rti in 2005 understanding/diagnosing reading disabilities within a rti model marilyn korth,...
TRANSCRIPT
RTI in 2005
Understanding/Diagnosing ReadingDisabilities within a RTI Model
Marilyn Korth, Altmar-Parish-Williamstown School District Tricia Hamlin, Southern Cayuga Central School District
Amanda Miller, Saint Catherine’s Center for Children Karrie Clark, Carthage School District
& James McDougal, PsyD
State University of New York at [email protected]

LD Within an RTI Model
AGENDA
Brief history of Special Education: how it has influenced our practice
Critiques of traditional assessment practices
Contemporary Approaches- Early Literacy to Literacy
1975, PL 94-142
Provided educational rights and goals for children previously underserved or excluded
Solidified the dominant place of Special Education in School Psychology
Discrepancy based model influenced assessment practices
Characteristics of the “Traditional Assessment Practices”
Medical model, deficit oriented, child centered
One at a time focus “Wait to fail” “Refer-test- place” Heavy on diagnosis light
on cure “Correlation approach”
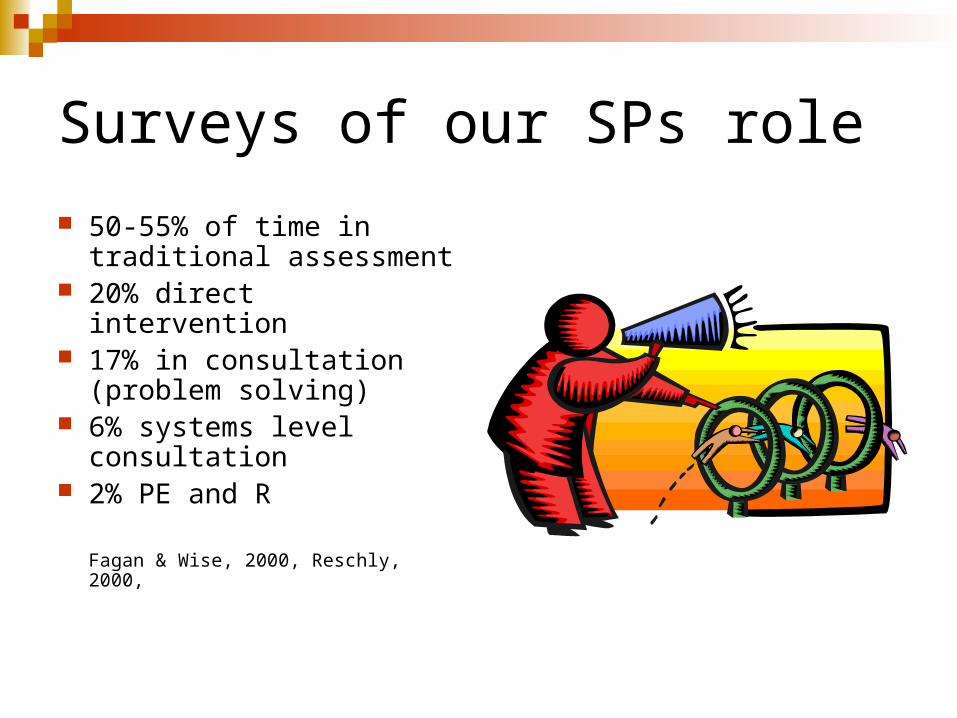
Surveys of our SPs role
50-55% of time in traditional assessment
20% direct intervention 17% in consultation
(problem solving) 6% systems level
consultation 2% PE and R
Fagan & Wise, 2000, Reschly, 2000,

Related to Traditional Assessment? Inconsistencies in
Identification
1988 27 % of identified children in Utah were ED,
the ED rate in CA was
2.5 % of identified childrenForness & Kavale, 1990
Huge Increases in Identification
From 1976 to 2002 the classification of children with specific learning disabilities increased 300%President’s Commission on Excellence in Special Education July 1, 2002
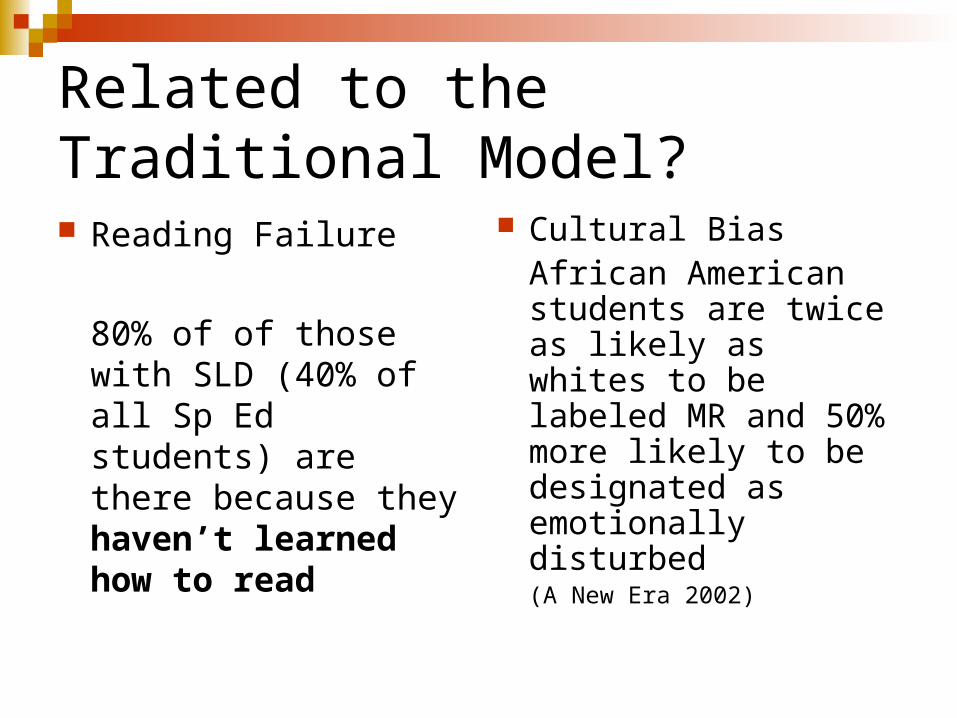
Related to the Traditional Model? Reading Failure
80% of of those with SLD (40% of all Sp Ed students) are there because they haven’t learned how to read
Cultural Bias African American
students are twice as likely as whites to be labeled MR and 50% more likely to be designated as emotionally disturbed(A New Era 2002)
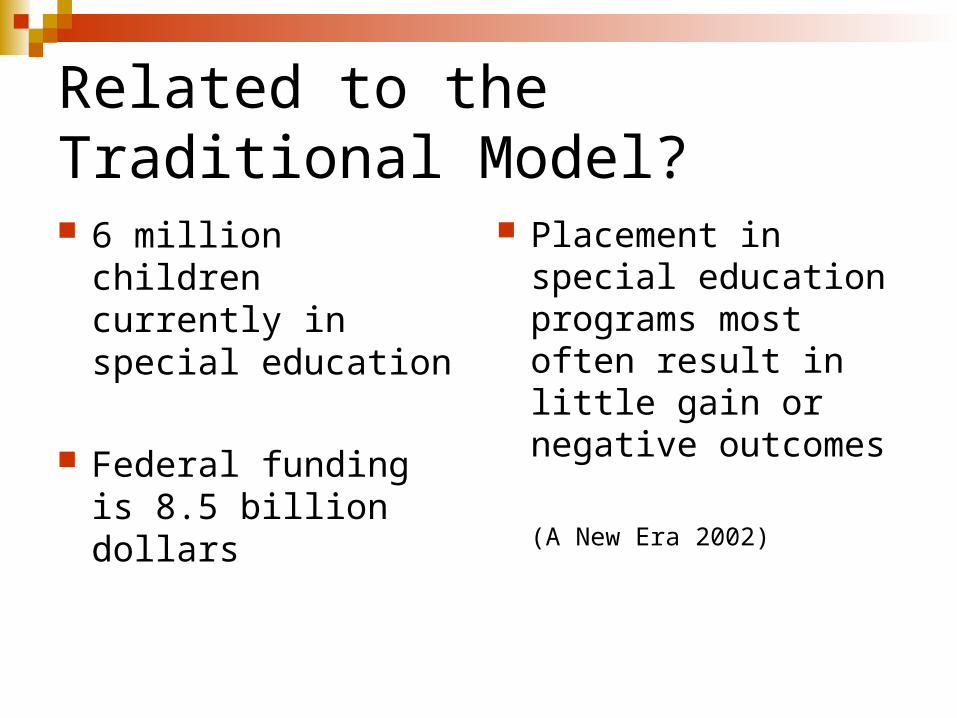
Related to the Traditional Model? 6 million children
currently in special education
Federal funding is 8.5 billion dollars
Placement in special education programs most often result in little gain or negative outcomes
(A New Era 2002)

The Link to LD Assessment:Past and Future
Discrepancy based procedures
Problems with these models
A new approach

LD Assessment: Past & FutureThe Ghost of LD
PAST Definitional
Concerns What is LD? What isn’t LD? Discrepancy based
models Wait to fail
The Promise of LD Future A New Era Preventative approach Validated Models Response to
Intervention
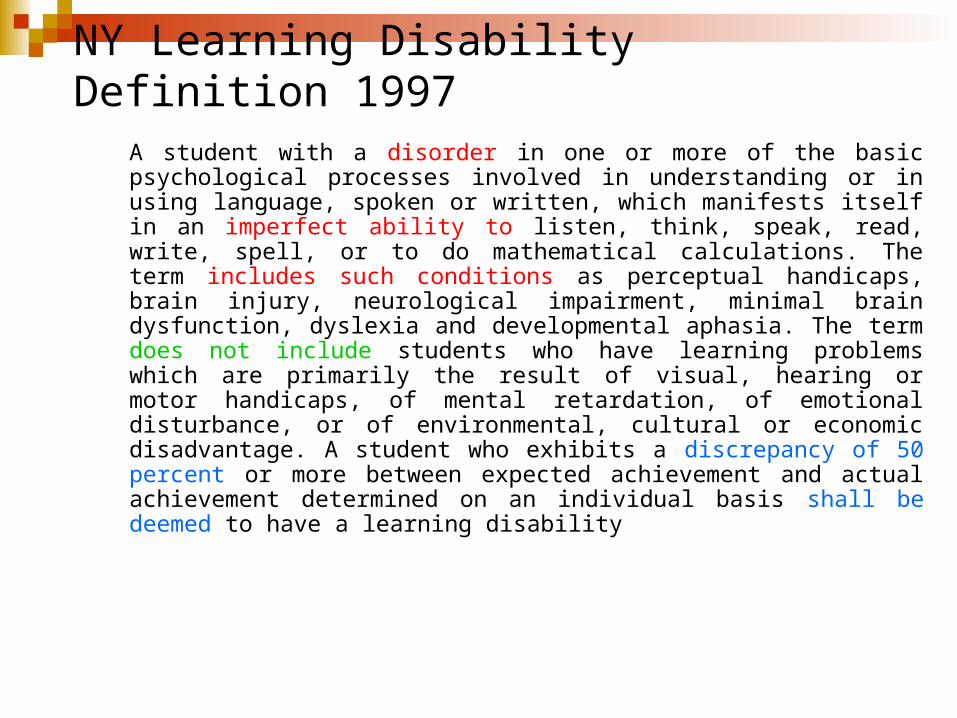
NY Learning Disability Definition 1997
A student with a disorder in one or more of the basic psychological processes involved in understanding or in using language, spoken or written, which manifests itself in an imperfect ability to listen, think, speak, read, write, spell, or to do mathematical calculations. The term includes such conditions as perceptual handicaps, brain injury, neurological impairment, minimal brain dysfunction, dyslexia and developmental aphasia. The term does not include students who have learning problems which are primarily the result of visual, hearing or motor handicaps, of mental retardation, of emotional disturbance, or of environmental, cultural or economic disadvantage. A student who exhibits a discrepancy of 50 percent or more between expected achievement and actual achievement determined on an individual basis shall be deemed to have a learning disability

IDEA's Definition of Learning Disability
". . . a disorder in one or more of the basic psychological processes involved in understanding or in using language, spoken or written, that may manifest itself in an imperfect ability to listen, think, speak, read, write, spell, or do mathematical calculations, including conditions such as perceptual disabilities, brain injury, minimal brain dysfunction, dyslexia, and developmental aphasia."However, learning disabilities do not include, "…learning problems that are primarily the result of visual, hearing, or motor disabilities, of mental retardation, of emotional disturbance, or of environmental, cultural, or economic disadvantage."
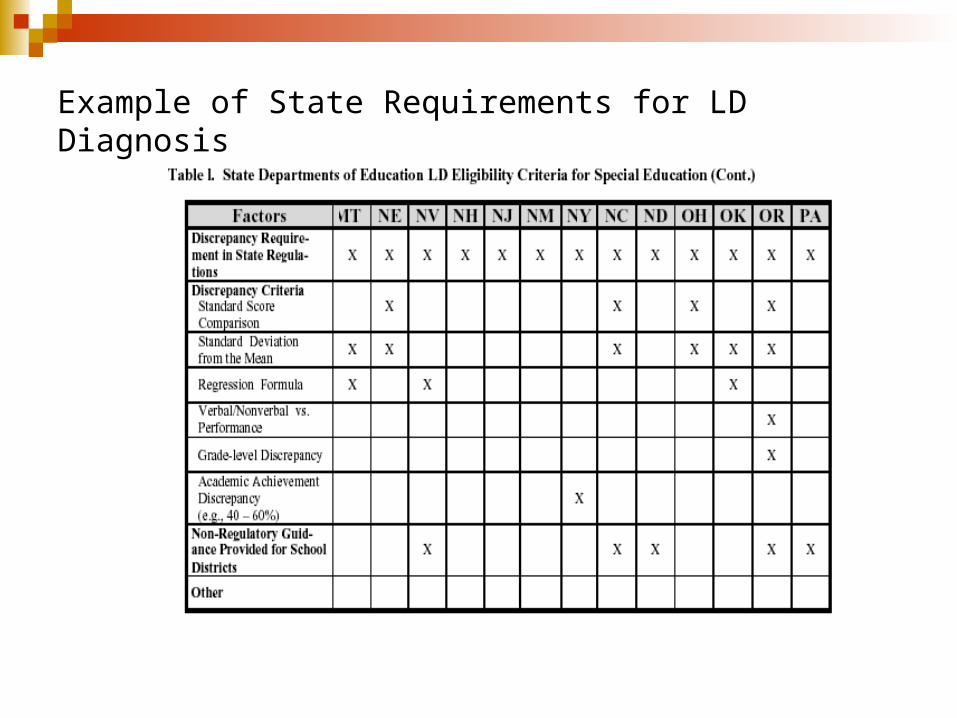
Example of State Requirements for LD Diagnosis
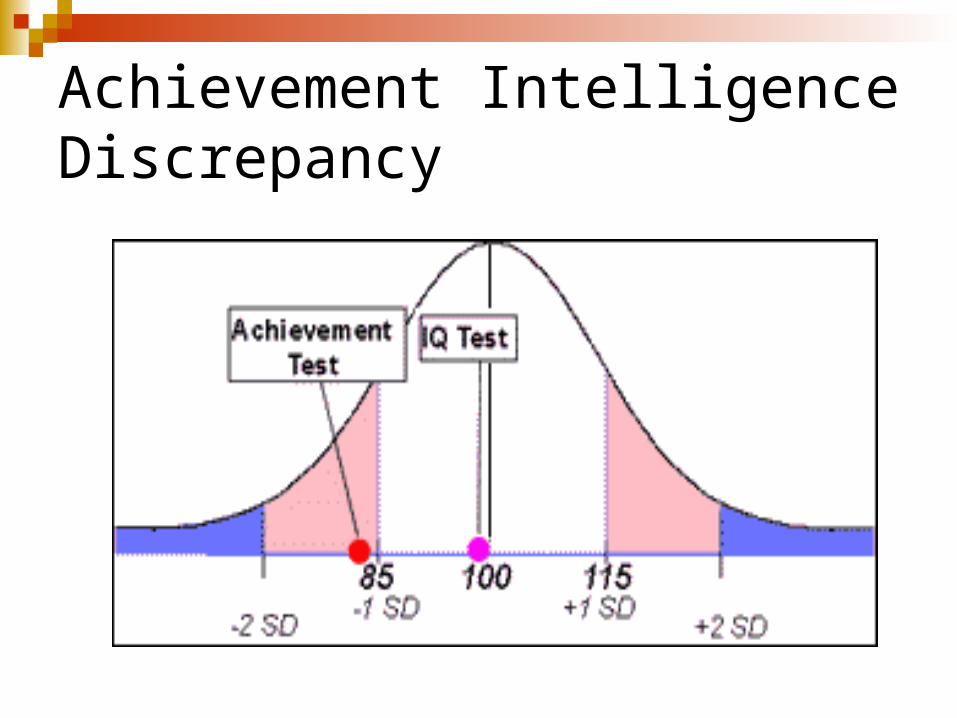
Achievement Intelligence Discrepancy

Severe Discrepancy Determination by Formula
Kate obtains an IQ score of 90 and an achievement score of 74. Is this 16-point difference large enough to be considered a ‘significant difference’ between ability and achievement?
Data:
Ability Score ………………………………………………... 90
Reliability of Ability Score ……………………………. … 0.91
Achievement Score ……………………………………….. 74
Achievement Reliability ………………………………….. 0.91
Correlation Between Ability and Achievement Scores .. 0.47
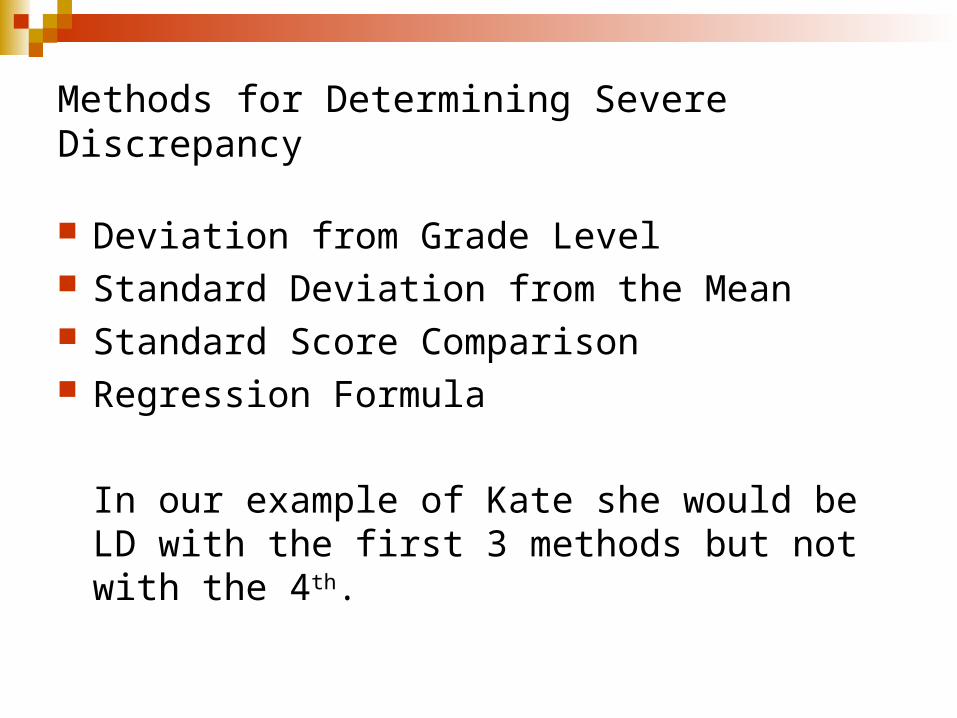
Methods for Determining Severe Discrepancy
Deviation from Grade Level Standard Deviation from the Mean Standard Score Comparison Regression Formula
In our example of Kate she would be LD with the first 3 methods but not with the 4th.
Reliability concerns
Determination of LD Diagnosis is based in part on:State determinations of severe discrepancymethod of calculating severe discrepancy
Different methods of calculating a discrepancy will result in different students being classified

Validity
Learning disability is result of unexpected low achievement.
Also implies that children with unexpected low achievement (LD) are distinct from expected low achievement (i.e., low achievement and low intelligence).
Validity
Validity of construct relies on its uniqueness and utility
Validity of a discrepancy based model assumes that ability-achievement discrepant children are qualitatively distinct from regular “low achievers”.
Also assumes that identifying LD will lead to useful interventions specific to that group.
Assessing Validity of LD
Fletcher et al. (2001) describe means of validating LD diagnosis
PrognosisResponse to interventionDistinct cognitive profiles

Cognitive Domains
Meta-Analysis Hoskyn & Swanson (2000) Stuebing et al. (2002)
Stuebing et al.
Substantial overlap between IQ-discrepant & IQ-consistent poor readers
Differences between groups on several cognitive domains were negligible or small
Research indicates little need for using IQ tests in assessing LDs

Prognosis
Do LD students and ordinary low-achievers differ in development of reading ability?
O’Mally et al. (2002) found little evidence of differences between groups.
Several longitudinal studies found little or no differences in reading development between groups.
Response to Intervention
Research generally finds that discrepancy based LD vs. low-achievers do not respond differently to interventions.
Vellutino, Scanlon, Lyon (2000) reported that IQ-achievement discrepancy did not predict differences between groups on responses to intervention or which group would be more easily remediated.

Assessing Validity of LD:Summary Research indicates little or no differences
between discrepancy based LD students and ordinary low achievers based on:Cognitive ProfilesPrognosisResponse to intervention
Validity
Current definitions and diagnosis of LD students lacks uniqueness (distinct group of learners) and utility (clear differences in treatment and prognosis).
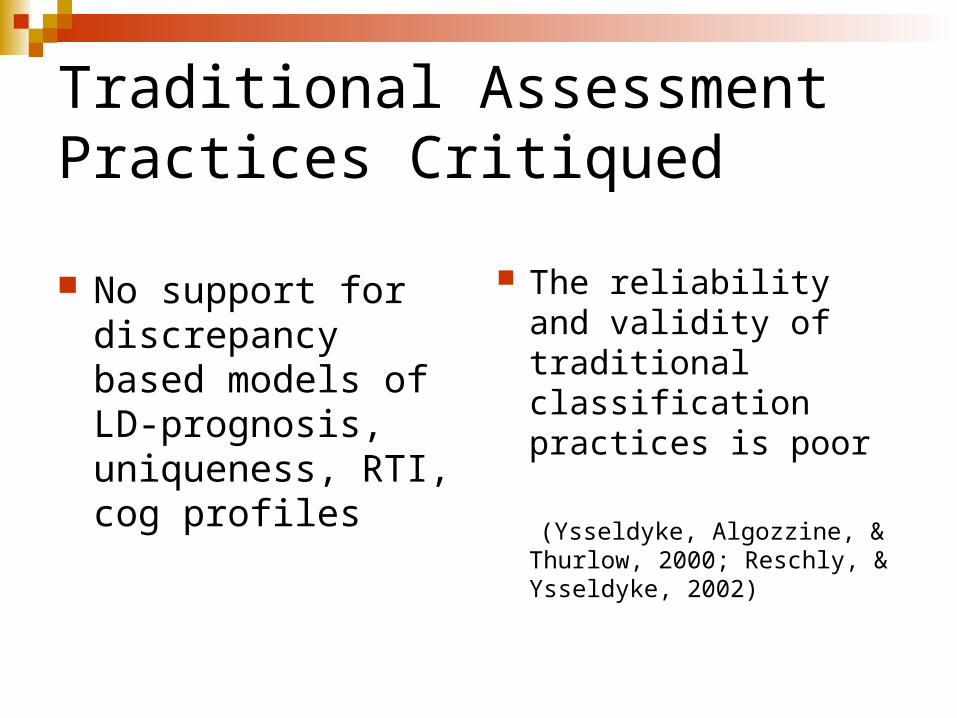
Traditional Assessment Practices Critiqued
No support for discrepancy based models of LD-prognosis, uniqueness, RTI, cog profiles
The reliability and validity of traditional classification practices is poor
(Ysseldyke, Algozzine, & Thurlow, 2000; Reschly, & Ysseldyke, 2002)
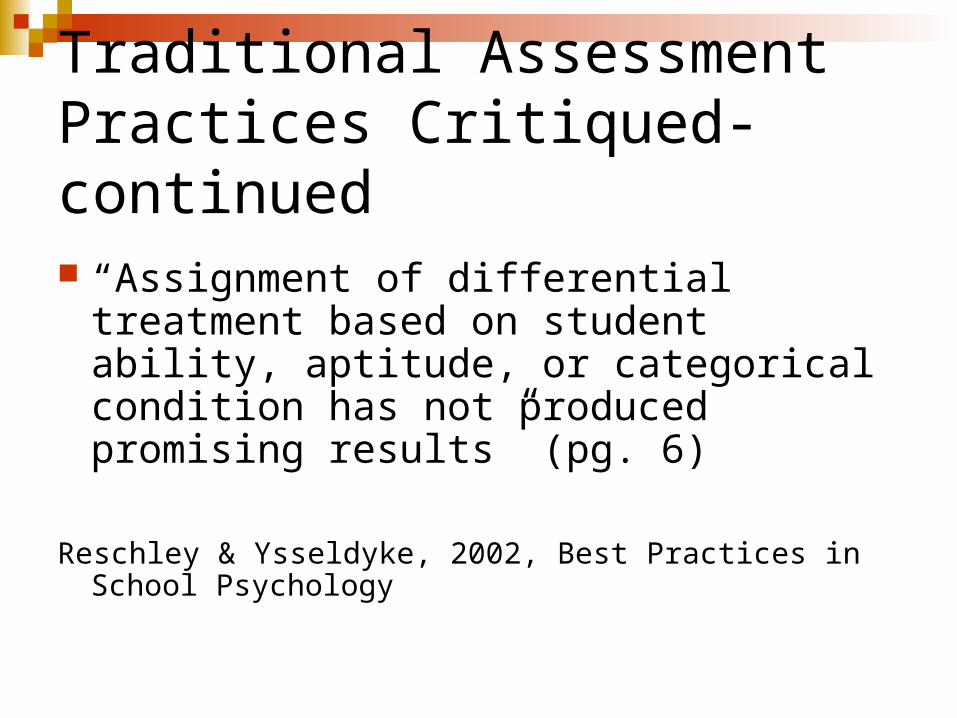
Traditional Assessment Practices Critiqued- continued
“Assignment of differential treatment based on student ability, aptitude, or categorical condition has not produced promising results” (pg. 6)
Reschley & Ysseldyke, 2002, Best Practices in School Psychology
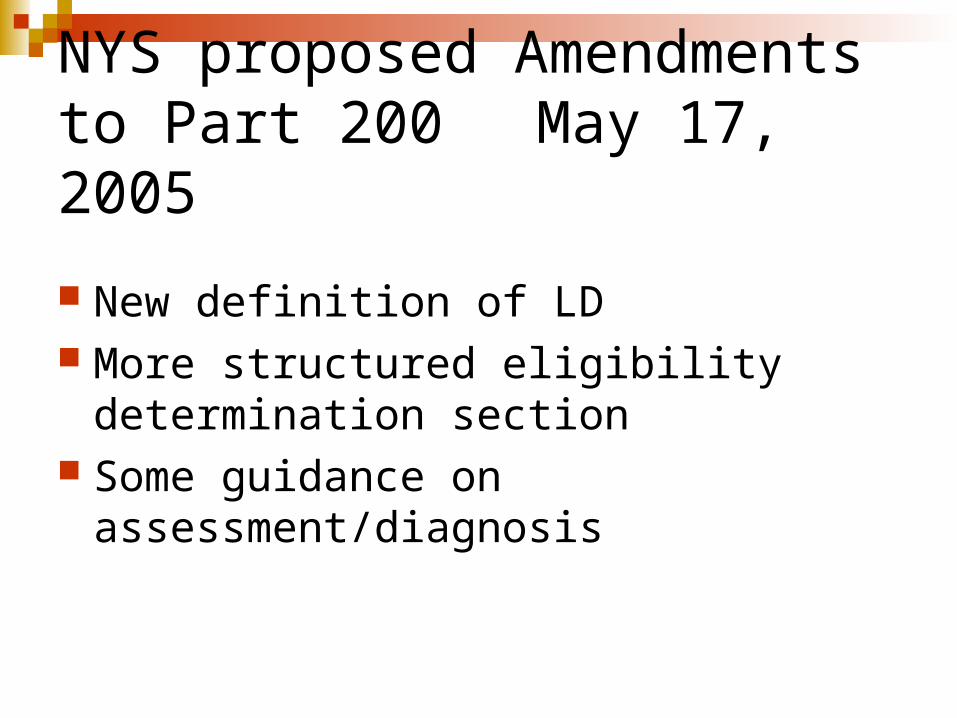
NYS proposed Amendments to Part 200 May 17, 2005
New definition of LD More structured eligibility determination
section Some guidance on assessment/diagnosis

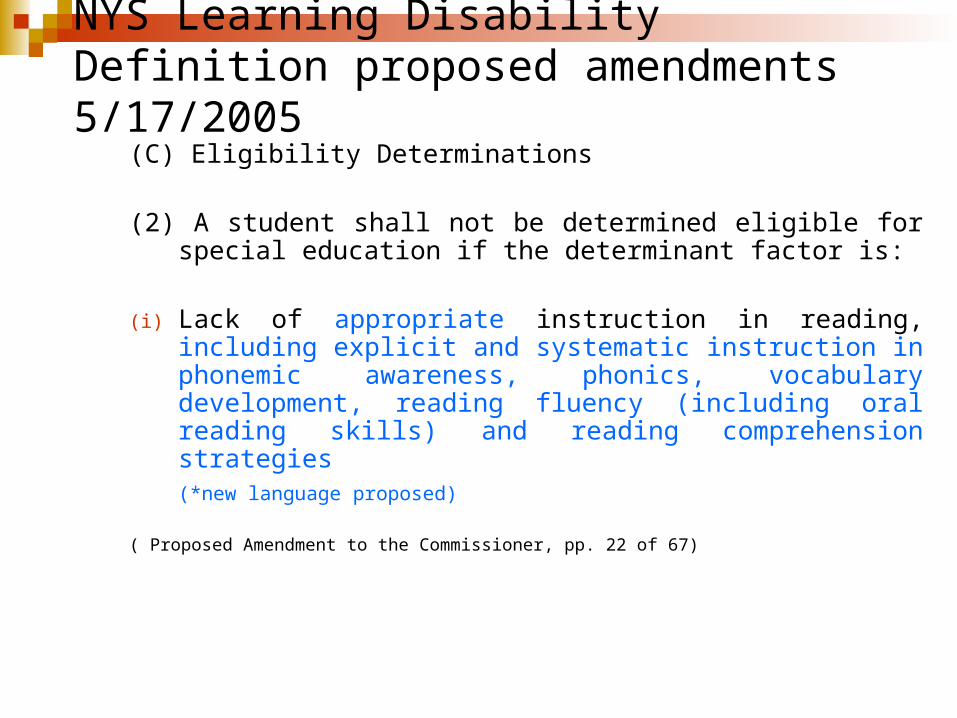
NYS Learning Disability Definition proposed amendments 5/17/2005
A student with a disorder in one or more of the basic psychological processes involved in understanding or in using language, spoken or written, which manifests itself in an imperfect ability to listen, think, speak, read, write, spell, or to do mathematical calculations. The term includes such conditions as perceptual handicaps, brain injury, neurological impairment, minimal brain dysfunction, dyslexia and developmental aphasia. The term does not include students who have learning problems which are primarily the result of visual, hearing or motor handicaps, of mental retardation, of emotional disturbance, or of environmental, cultural or economic disadvantage. A student who exhibits a discrepancy of 50 percent or more between expected achievement and actual achievement determined on an individual basis shall be deemed to have a learning disability [**language to be repealed**]
NYS Learning Disability Definition proposed amendments 5/17/2005
(C) Eligibility Determinations
(2) A student shall not be determined eligible for special education if the determinant factor is:
(i) Lack of appropriate instruction in reading, including explicit and systematic instruction in phonemic awareness, phonics, vocabulary development, reading fluency (including oral reading skills) and reading comprehension strategies
(*new language proposed)
( Proposed Amendment to the Commissioner, pp. 22 of 67)
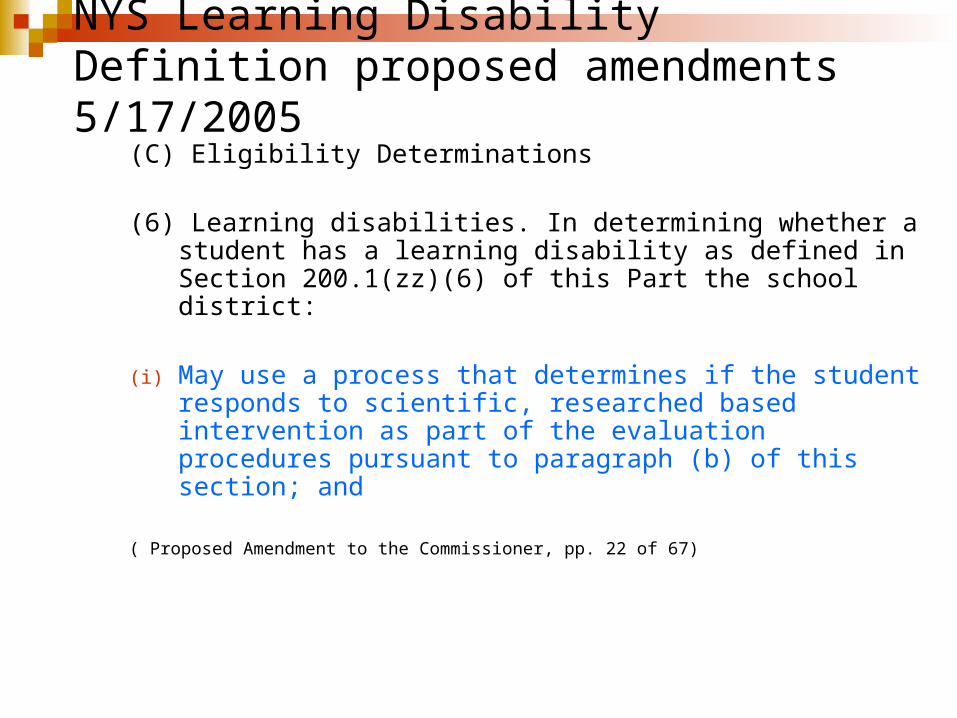
NYS Learning Disability Definition proposed amendments 5/17/2005
(C) Eligibility Determinations
(6) Learning disabilities. In determining whether a student has a learning disability as defined in Section 200.1(zz)(6) of this Part the school district:
(i) May use a process that determines if the student responds to scientific, researched based intervention as part of the evaluation procedures pursuant to paragraph (b) of this section; and
( Proposed Amendment to the Commissioner, pp. 22 of 67)

NYS Learning Disability Definition proposed amendments 5/17/2005
(C) Eligibility Determinations
(ii) is not required to consider whether a student has a significant discrepancy between achievement and intellectual ability in oral expression, listening comprehension, written expression, basic reading skill, reading comprehension, mathematical calculation or mathematical reasoning
( Proposed Amendment to the Commissioner, pp. 23 of 67)

Discussion Time- you make the call!
Potential problems and barriers to implementing the new regulations
Potential benefits related to the new regulations

Identification and Eligibility Determination for Students with Specific Learning DisabilitiesApril 25, 2003
RTI Assessment Model: NASP Recommendations
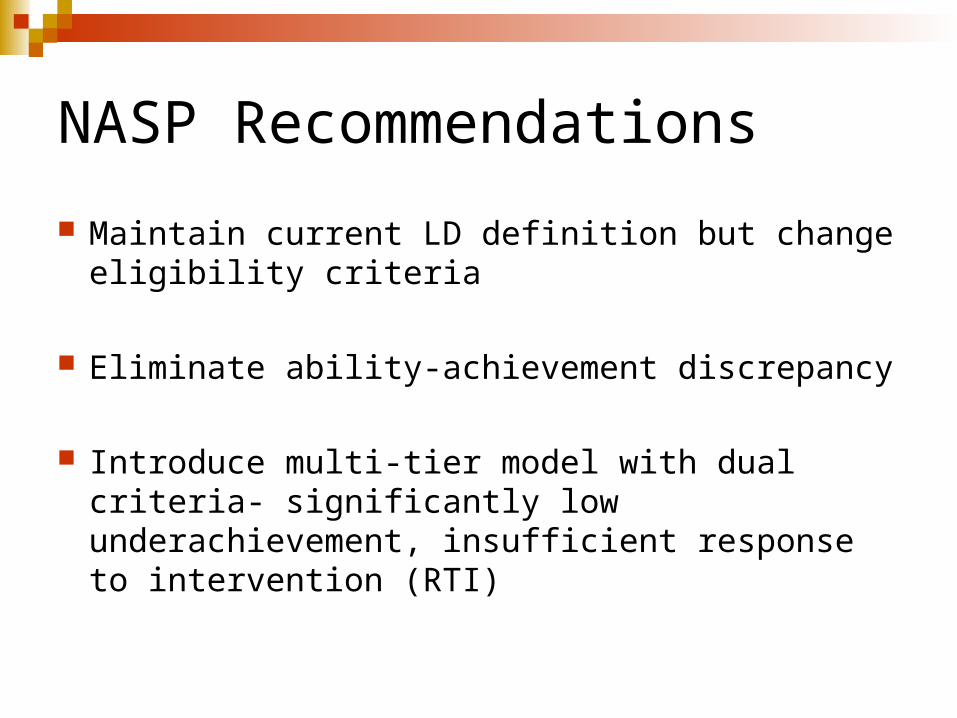
NASP Recommendations
Maintain current LD definition but change eligibility criteria
Eliminate ability-achievement discrepancy
Introduce multi-tier model with dual criteria- significantly low underachievement, insufficient response to intervention (RTI)
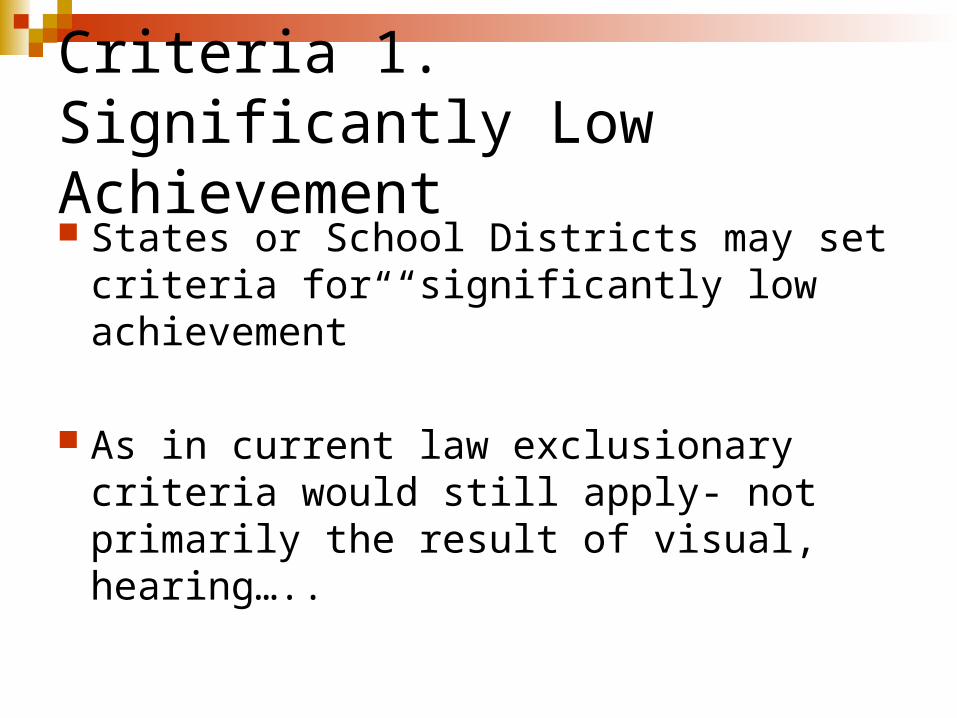
Criteria 1. Significantly Low Achievement States or School Districts may set criteria
for “significantly low achievement”
As in current law exclusionary criteria would still apply- not primarily the result of visual, hearing…..
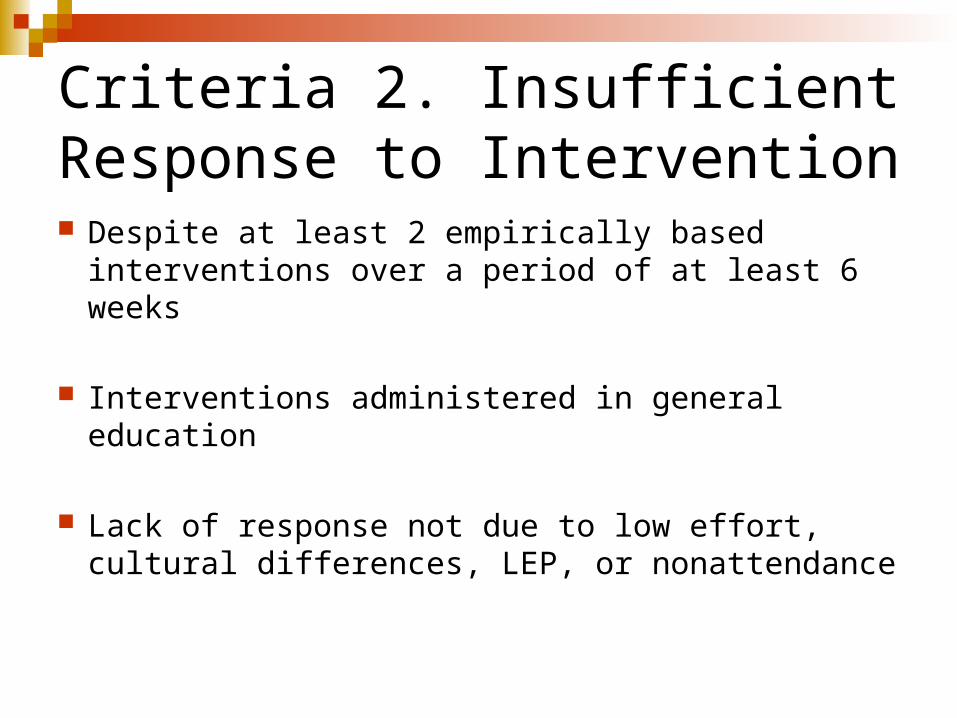
Criteria 2. Insufficient Response to Intervention Despite at least 2 empirically based
interventions over a period of at least 6 weeks
Interventions administered in general education
Lack of response not due to low effort, cultural differences, LEP, or nonattendance
Characteristics of the Multi-Tier Assessment Model
Tier 1. High quality instructional and behavioral supports for all students in general education
Tier 1. Components include..
Research based instruction & behavior supports
Ongoing CBM of basic skills, instructional level matched to students skills
Remedial instruction and group interventions within general education

Characteristics of the Multi-Tier Model
Tier 2. Targeted intensive prevention or remediation services for struggling students
Tier 2. Components include..
Research based/intense services targeted to the student’s individual needs
Time limited services Linked to a problem solving process including
general & Sp Ed teachers and support services personnel
Initiated though formal referral, parental notification and consent
Tier 2. Problem solving includes.
Precise charting of progress- general education interventions
Formal documentation of progress toward targeted goals
A verified level of intervention fidelity
Comparison to local norms- if available
Characteristics of the Multi-Tier Model
Tier 3. Comprehensive evaluation by a multi-disciplinary team to determine eligibility for special education and related services
Tier 3. Components include..
Low achievement and insufficient response criteria met
Referral to a Multidisciplinary Team
MDT conducts a comprehensive evaluation
Characteristics of Evolving RTI Assessment Models Prevention focused
Focused on the “ecology”
not the child
Consultative based
Scientifically supported
Data-based (short term
empiricism)
Elements of an Evolved School Psychology-continued Emphasis on
intervention rather than diagnosis
Focused on the success of all students not just those referred for Special Education
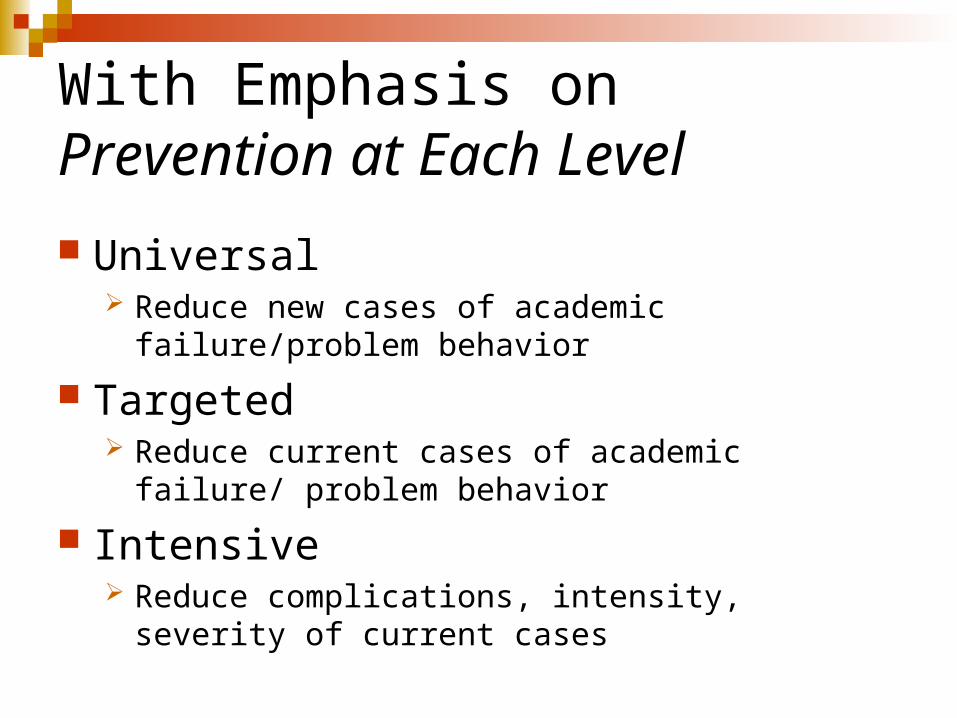
With Emphasis on Prevention at Each Level
Universal Reduce new cases of academic failure/problem
behavior
Targeted Reduce current cases of academic failure/ problem
behavior
Intensive Reduce complications, intensity, severity of current
cases
Implications for Intervention
Assessment techniques should lend themselves to intervention
Assessments that measure important subskills, are repeatable and directly related to instruction
The Consultation Process
Problem Identification
Problem Analysis
Plan Implementation
Plan Evaluation
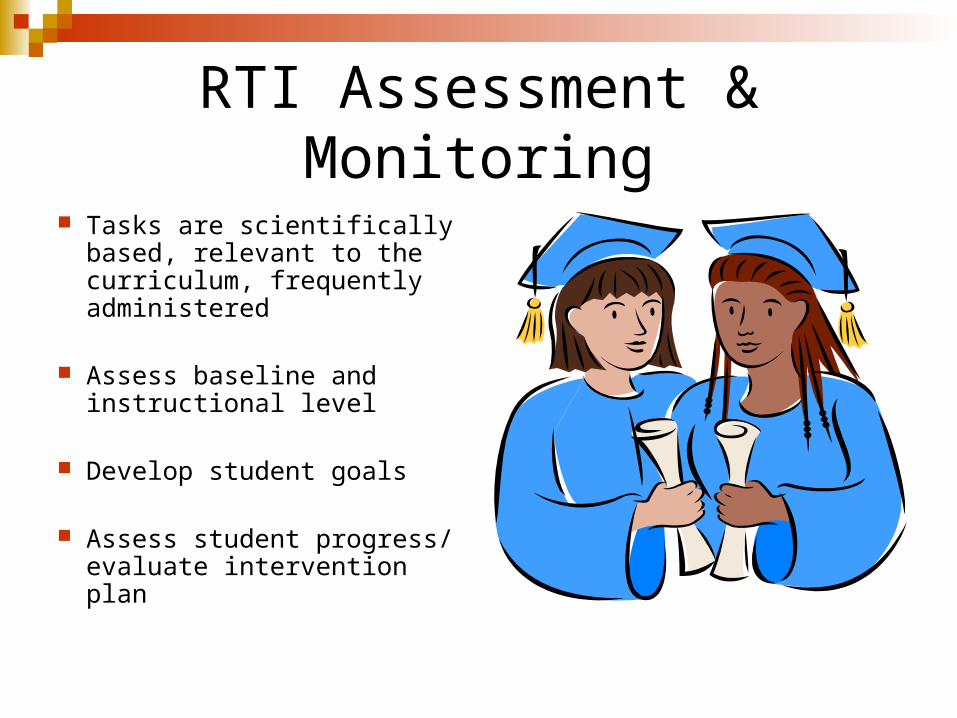
RTI Assessment & Monitoring
Tasks are scientifically based, relevant to the curriculum, frequently administered
Assess baseline and instructional level
Develop student goals
Assess student progress/ evaluate intervention plan

RTI in Literacy: Examples of new skills & resources
DIBELS
CBM
Scientifically based interventions (e.g., Big 5 ideas)
Peer tutoring
BEA
Graphing & progress monitoring
Discussion Time- you make the call!
How consistent are these practices with the status quo in your district?
What will be required to implement change?

RTI Practices
Defining RTI Criteria
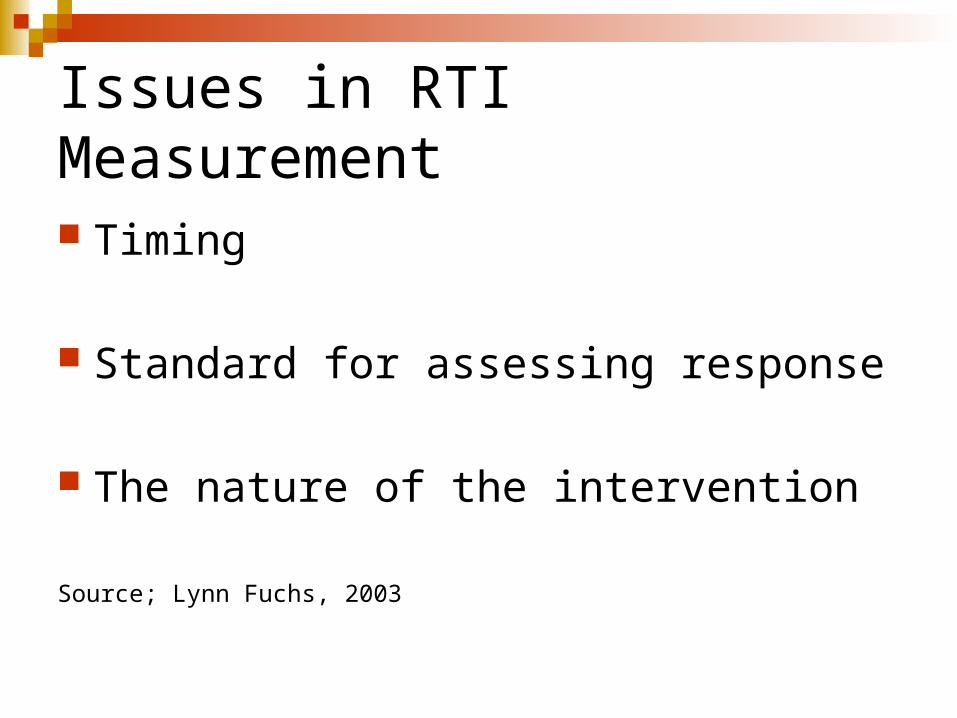
Issues in RTI Measurement
Timing
Standard for assessing response
The nature of the intervention
Source; Lynn Fuchs, 2003

Issues in measurement: Timing
Final Status- measure post intervention response. Did child meet a pre-determined performance level.
Growth- measure students periodically across the intervention. Base decisions on the amount of learning
Dual Discrepancy- measures both performance level and growth are measured
Source; Lynn Fuchs, 2003

Issues in measurement: Standard for Response Normative- Response is compared to the full range of
student performance (need local norms).
Limited Norm- Response compared to others receiving the intervention (need intervention norms)
Benchmark- Response is compared to a predetermined goal (40 CRWs, Slope of 1.5 words per week)
Source; Lynn Fuchs, 2003
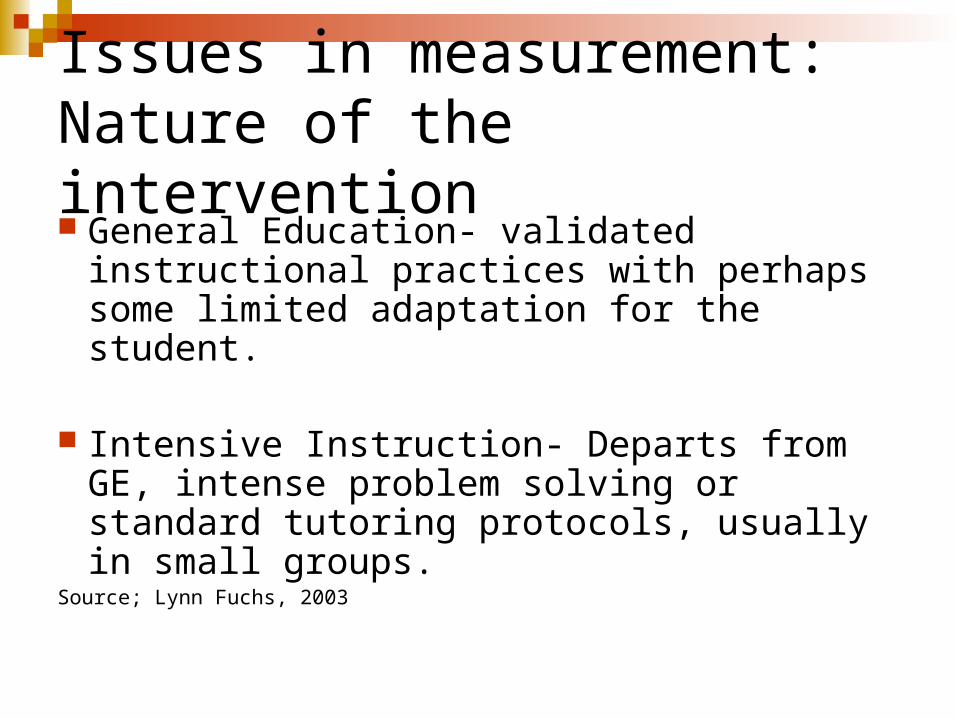
Issues in measurement: Nature of the intervention General Education- validated instructional
practices with perhaps some limited adaptation for the student.
Intensive Instruction- Departs from GE, intense problem solving or standard tutoring protocols, usually in small groups.
Source; Lynn Fuchs, 2003
NRCLD
National Research Center on Learning Disabilities
Doug & Lynn Fuchs

LD Identification: Using CBM to Identify Students Who Are Not Responsive to Instruction: The Fuchs
Operationalize unresponsiveness as CBM dual-discrepancyCBM performance level is below classmatesCBM slope (rate of learning) is below
classmates

Rationale for Dual Discrepancy
All students do not ultimately achieve same degree of reading competence
Just because reading growth is low, student doesn’t automatically receive special education services
If learning rate is similar to other classmates, student is profiting from the regular education environment

LD Identification: Using CBM to Identify Students Who Are Not Responsive to Instruction
If a low-performing student does not grow where other students are thriving, special intervention needs to be considered
Alternative instructional methods must be tested to address mismatch between student’s learning requirements and requirements in conventional instructional program
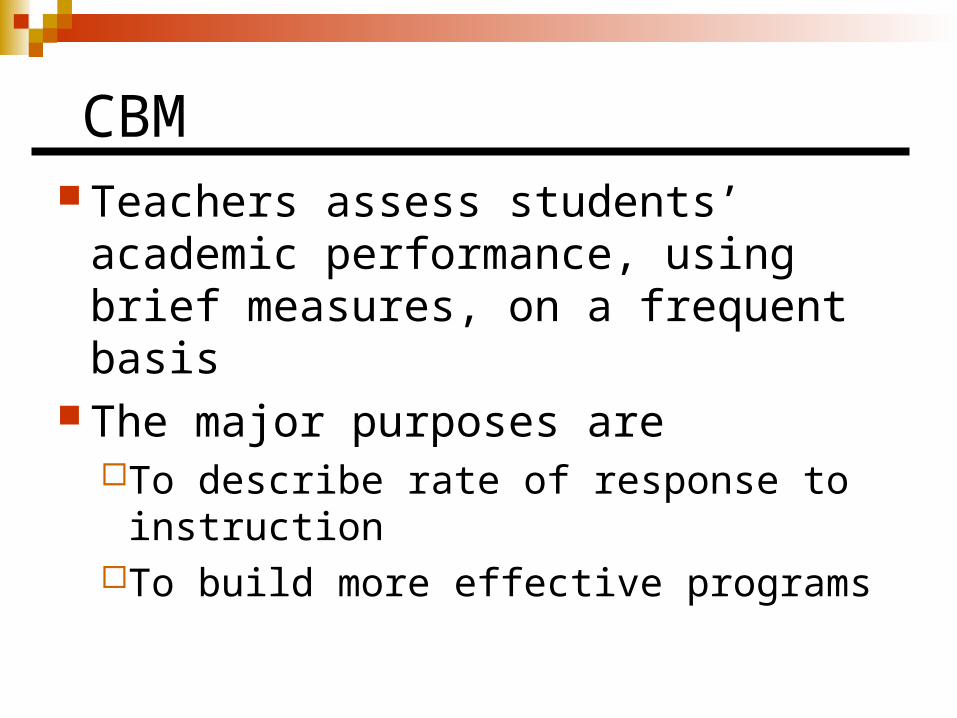
CBM Teachers assess students’ academic
performance, using brief measures, on a frequent basis
The major purposes areTo describe rate of response to
instructionTo build more effective programs

What We Look For in CBM
INCREASING SCORES:
Student is becoming a better reader.
FLAT SCORES:
Student is not profiting from instruction and requires a change in the
instructional program.

Sarah’s Progress on Words Read Correctly
0
20
40
60
80
100
120
140
160
180
Wo
rds
Re
ad C
orr
ect
ly
Sarah Smith Reading 2
Sep Oct Nov Dec Jan Feb Mar Apr May
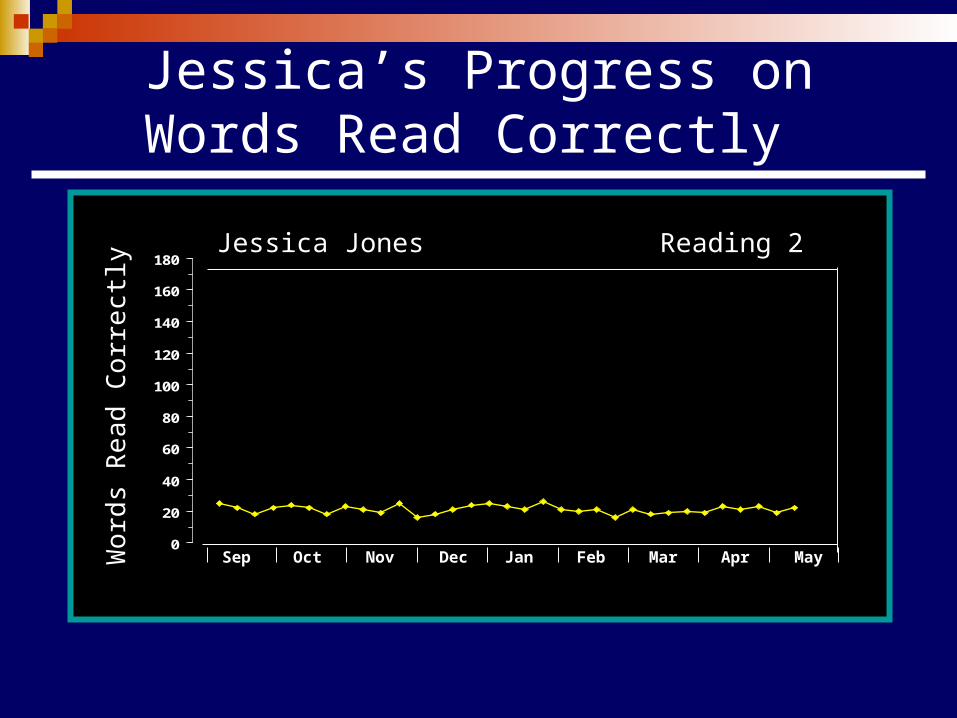
Jessica’s Progress on Words Read Correctly
0
20
40
60
80
100
120
140
160
180
Wo
rds
Re
ad C
orr
ect
ly
Jessica Jones Reading 2
Sep Oct Nov Dec Jan Feb Mar Apr May

In RTI, CBM Used For …
Identifying Risk One-time screening Monitoring response to GE
Reversing Failure without SE Individual adaptations to class instruction Preventive tutoring
Designating response (or lack thereof) to identify LD
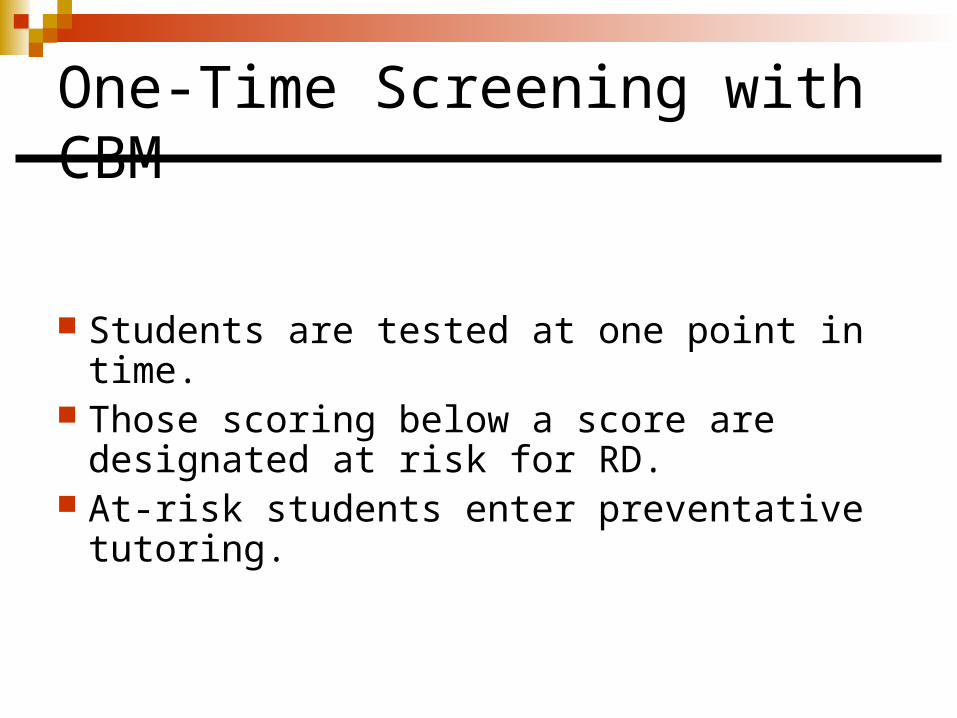
One-Time Screening with CBM
Students are tested at one point in time. Those scoring below a score are
designated at risk for RD. At-risk students enter preventative
tutoring.
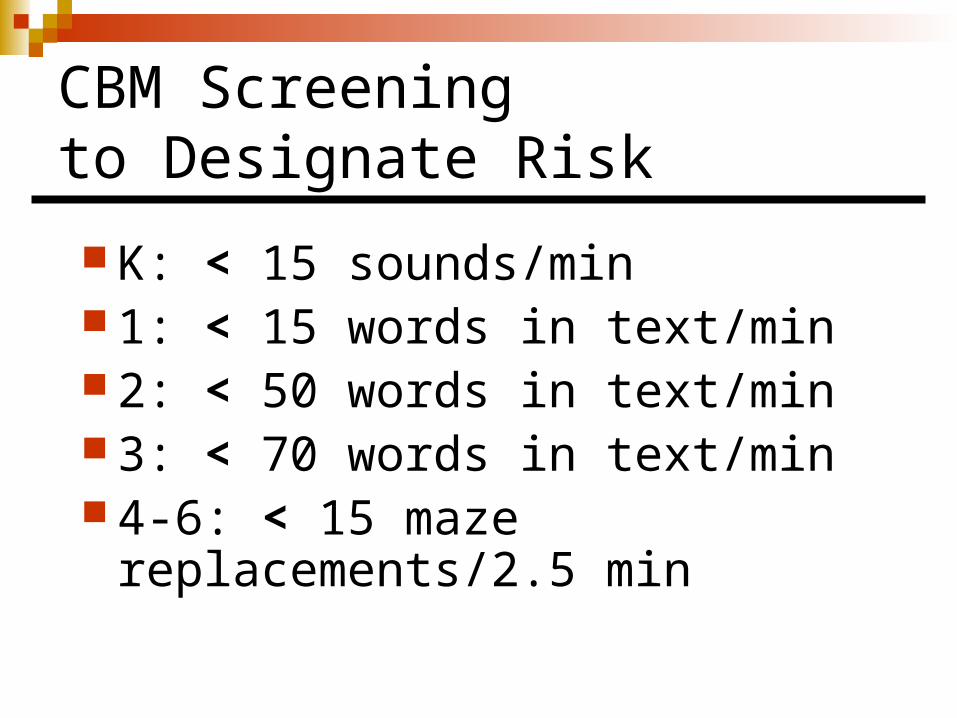
CBM Screening to Designate Risk
K: < 15 sounds/min 1: < 15 words in text/min 2: < 50 words in text/min 3: < 70 words in text/min 4-6: < 15 maze replacements/2.5
min

CBM Monitoring of Response to GE
Administer weekly CBM to all students in the class.
Identify subset of children whose level of performance and rate of improvement is substantially less than class peers.

CLASS STATISTICS: ComputationTeacher: Mrs. Smith
Report through 3/17
Score
Average score 39.5
Standard deviation 12.6
Discrepancy criterion 26.9
Slope
Average slope +0.98
Standard deviation 0.53
Discrepancy criterion +0.45
Students identified with dual discrepancy criterion
Score Slope
Anthony Jones 19.0 +0.05
Erica Jernigan 18.0 +0.23
Identify students whose response to general education < class peers.

0
10
20
30
40
50
60
70
Sep Oct Nov Dec Jan Feb Mar Apr May
Donald Ross Computation 4
DIGITS
G38
Wait. Not enough scores for decision.You need at least 8 scores to make a decision.
A1
S1
M1
M2
M3
D1
D2
D3
F1
F2
Using CBM to test effectiveness of adaptations to class instruction
0
10
20
30
40
50
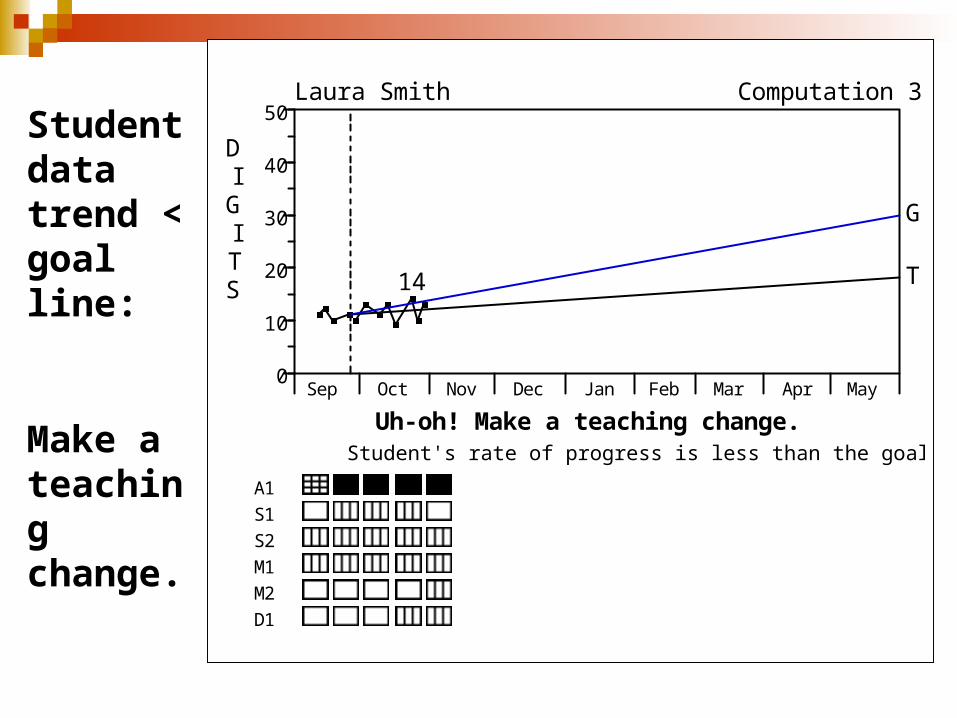
Sep Oct Nov Dec Jan Feb Mar Apr May
Laura Smith Computation 3
DIGITS
T
G
14
Uh-oh! Make a teaching change.Student's rate of progress is less than the goal line.
A1
S1
S2
M1
M2
D1
Student data trend < goal line:
Make a teaching change.

0
10
20
30
40
50
Sep Oct Nov Dec Jan Feb Mar Apr May
Brian Jones Computation 3
DIGITS
T
G
12
OK!! Raise the goal.Student's rate of progress exceeds the goal line
A1
S1
S2
M1
M2
D1
Student data trend > goal line:
Raise the goal.

NRCLD Preventive Tutoring
Content
Letter-sound recognition Decoding Sight word recognition Fluency building Partner reading Writing incorporated into correction
procedures
For Information about the OSEP LD Initiative http://www.nrcld.org/ www.air.org/ldsummit/ www.ld.org/advocacy/
CommonGround.doc www.erlbaum.com Identification of Learning Disabilities:
Research to Practice, Renée Bradley, Louis Danielson, and Daniel Hallahan (Eds.), 2002
For Information about Progress Monitoring Materials Reading probes
[email protected] Math probes and/or software:
“Monitoring Basic Skills Progress” Pro-Ed: 512-451-3246
Web math system: www.digitallearning.com
AIMSweb software, measures, admin & scoring guides
www.aimsweb.com or http://www.edformation.com

For Information about Progress Monitoring, Training & Research
National Center for Student Progress Monitoring [email protected]
Research Institute on Progress Monitoringhttp://progressmonitoring.org

Reading CBM: Fuchs
Kindergarten: Letter-Sound Fluency
Grade 1: Word-Identification Fluency
Grades 2-3: Passage Reading Fluency
Grades 4-6: Maze Fluency

RTI Assessment Pre-Literacy to LiteracyAssessment DIBELS: Roland Good, Ruth Kaminski, etc
NRCLD & National Center onStudent Progress Monitoring: Doug and Lynn Fuchs
DIBELS
Dynamic Indicators of Basic Early Literacy Skills
Reading First Initiative
Result of The No Child Left Behind Act
Research based program built on information compiled by the National Reading Panel
Purpose: To ensure that more children receive effective reading instruction in the early grades http://www.ed.gov/programs/readingfirst/index.html
DIBELS Information
One-minute fluency measures are individually administered to assess the development of pre-reading and early reading skills.
Benchmarks for K through 3rd Grade. Recently added 4-6 norms based on Fuchs work.
What does the DIBELS measure?
Specific skills addressed are: initial sound fluency letter naming fluencyphonemic segmentationnonsense word fluencyoral reading fluency

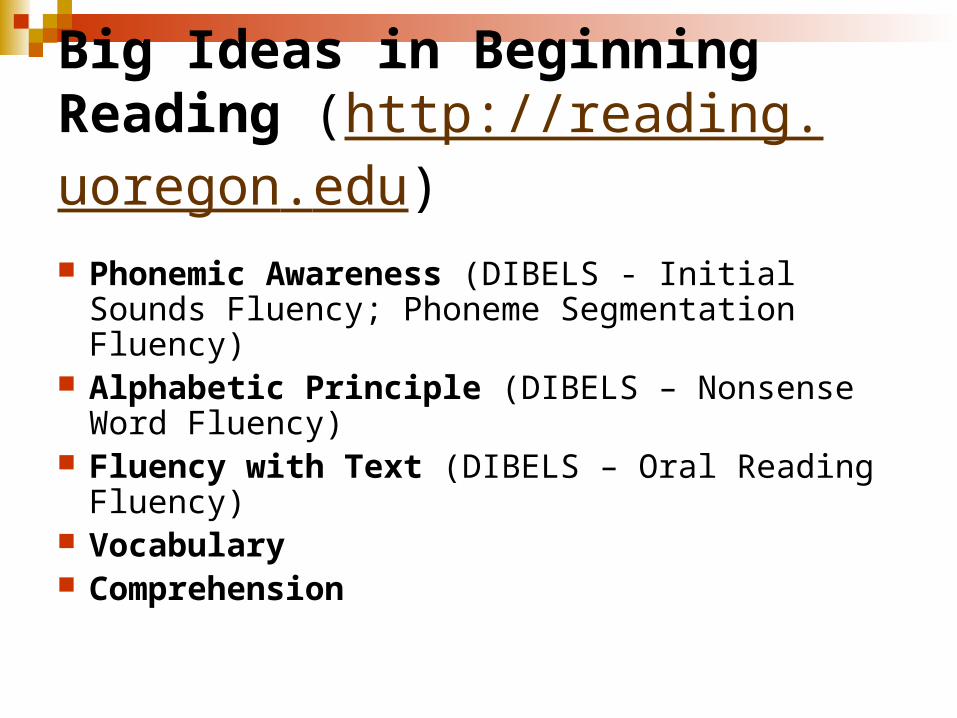
Big Ideas in Beginning Reading (http://reading.uoregon.edu)
Phonemic Awareness (DIBELS - Initial Sounds Fluency; Phoneme Segmentation Fluency)
Alphabetic Principle (DIBELS – Nonsense Word Fluency)
Fluency with Text (DIBELS – Oral Reading Fluency)
Vocabulary Comprehension
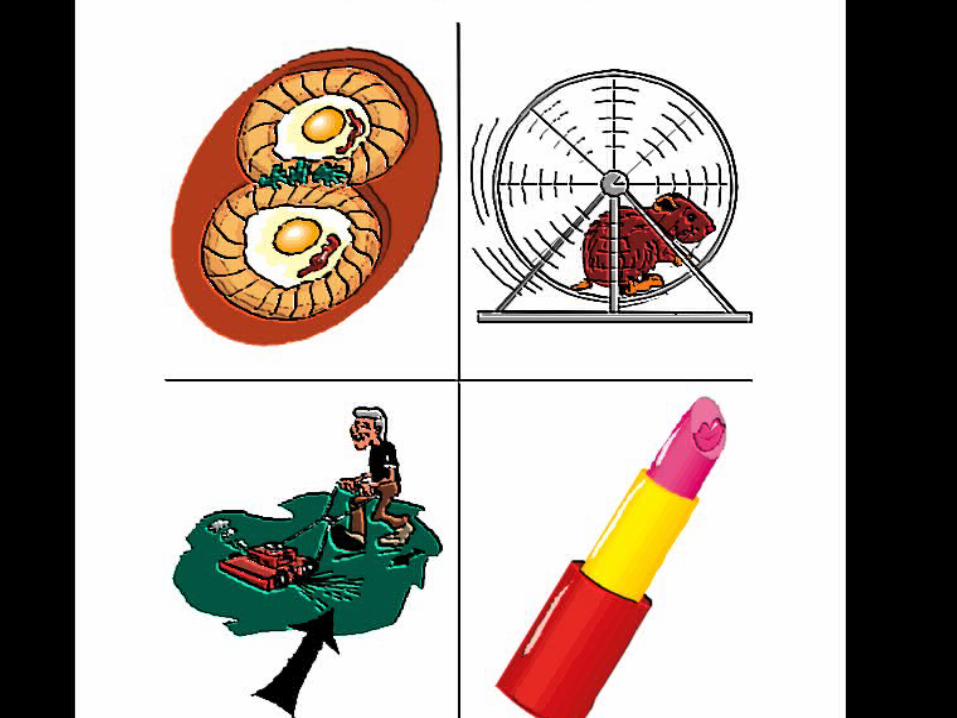
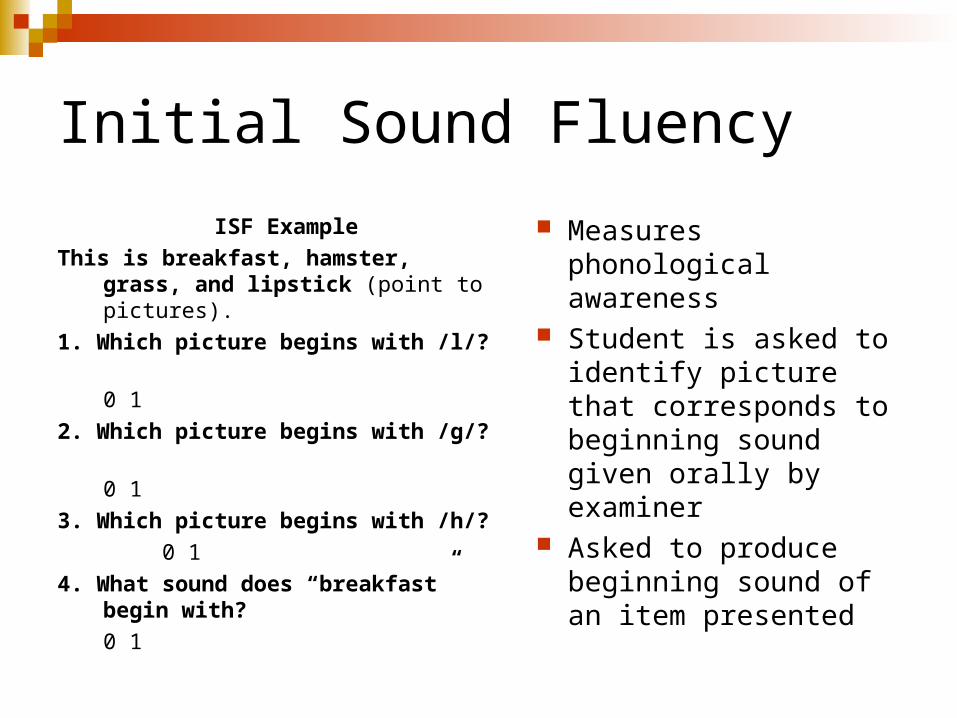
Initial Sound Fluency
ISF Example
This is breakfast, hamster, grass, and lipstick (point to pictures).
1. Which picture begins with /l/?
0 1
2. Which picture begins with /g/?
0 1
3. Which picture begins with /h/?
0 1
4. What sound does “breakfast” begin with?
0 1
Measures phonological awareness
Student is asked to identify picture that corresponds to beginning sound given orally by examiner
Asked to produce beginning sound of an item presented
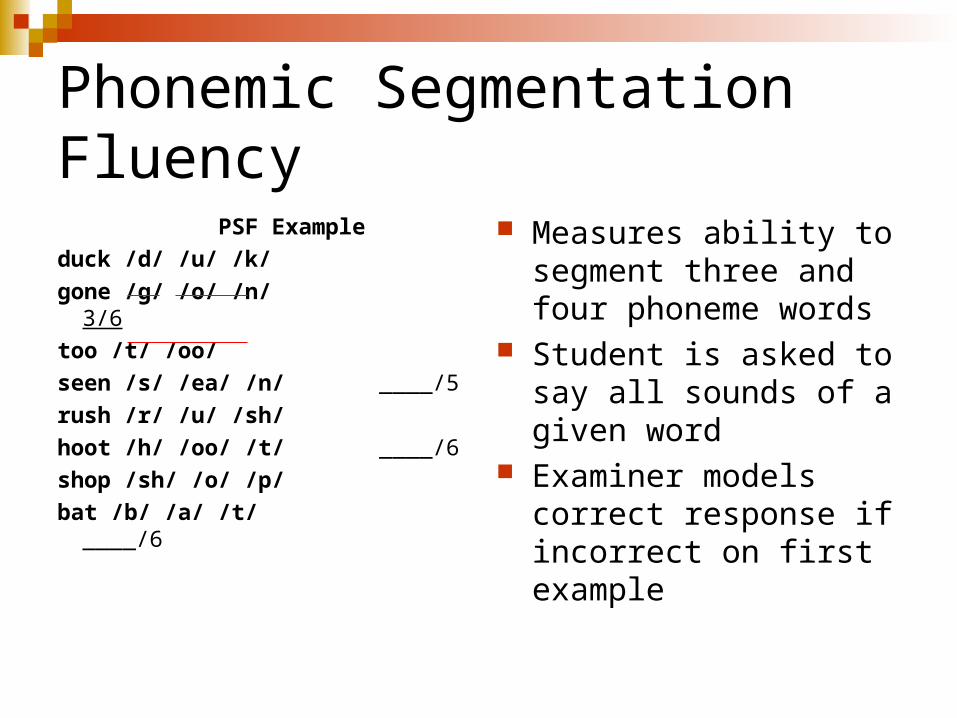
Phonemic Segmentation Fluency PSF Example
duck /d/ /u/ /k/
gone /g/ /o/ /n/ 3/6
too /t/ /oo/
seen /s/ /ea/ /n/ ____/5
rush /r/ /u/ /sh/
hoot /h/ /oo/ /t/ ____/6
shop /sh/ /o/ /p/
bat /b/ /a/ /t/ ____/6
Measures ability to segment three and four phoneme words
Student is asked to say all sounds of a given word
Examiner models correct response if incorrect on first example
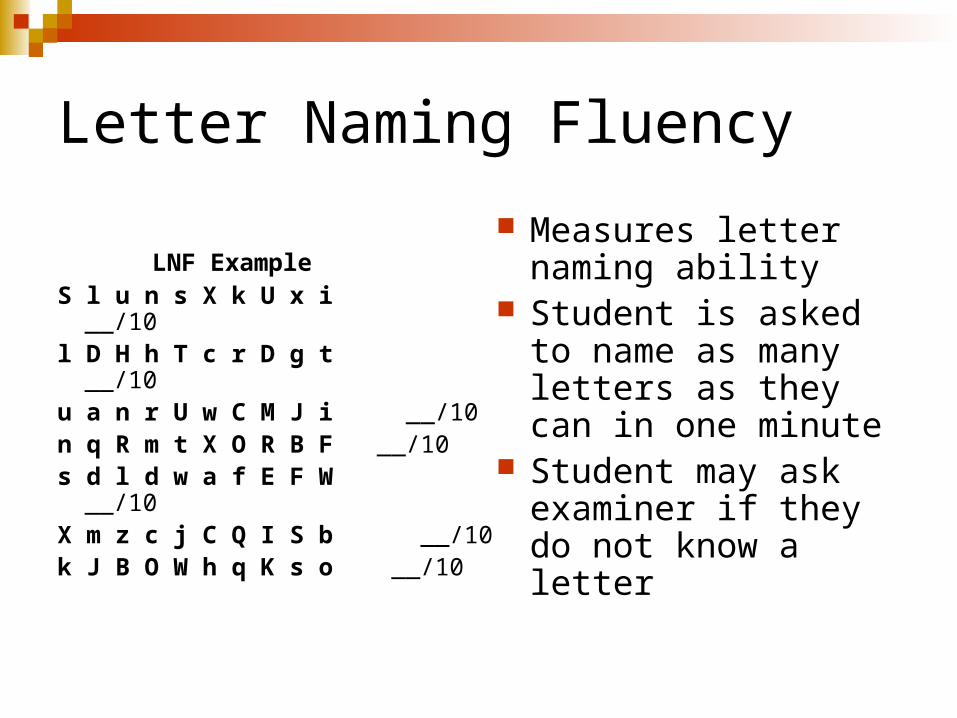
Letter Naming Fluency
LNF ExampleS l u n s X k U x i __/10l D H h T c r D g t __/10u a n r U w C M J i __/10n q R m t X O R B F __/10s d l d w a f E F W __/10X m z c j C Q I S b __/10k J B O W h q K s o __/10
Measures letter naming ability
Student is asked to name as many letters as they can in one minute
Student may ask examiner if they do not know a letter
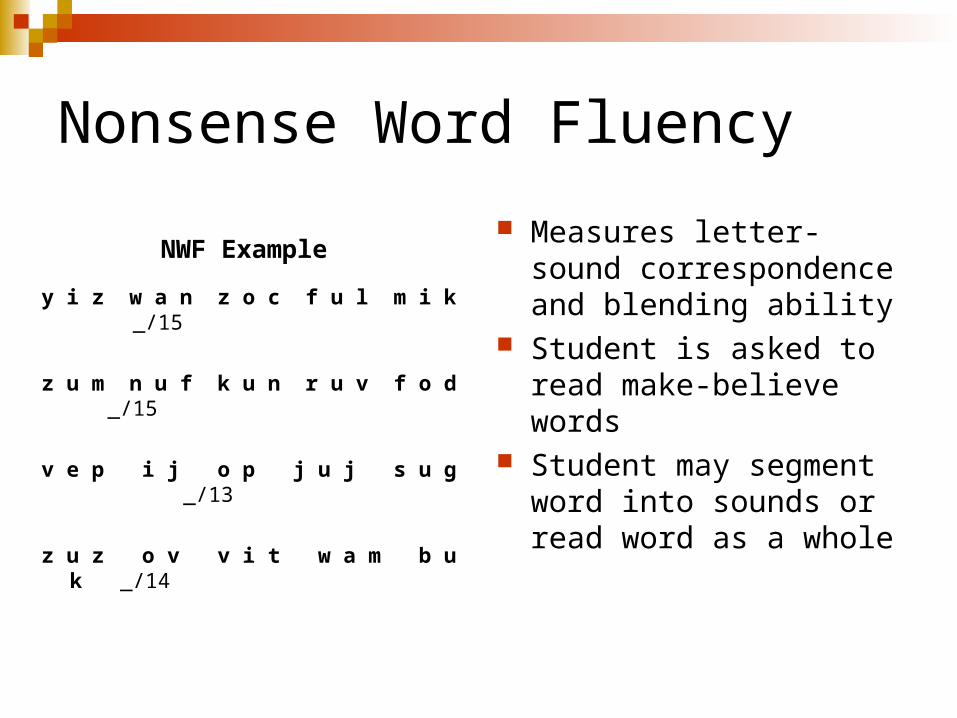
Nonsense Word Fluency
NWF Example
y i z w a n z o c f u l m i k _/15
z u m n u f k u n r u v f o d _/15
v e p i j o p j u j s u g _/13
z u z o v v i t w a m b u k _/14
Measures letter-sound correspondence and blending ability
Student is asked to read make-believe words
Student may segment word into sounds or read word as a whole
Oral Reading Fluency
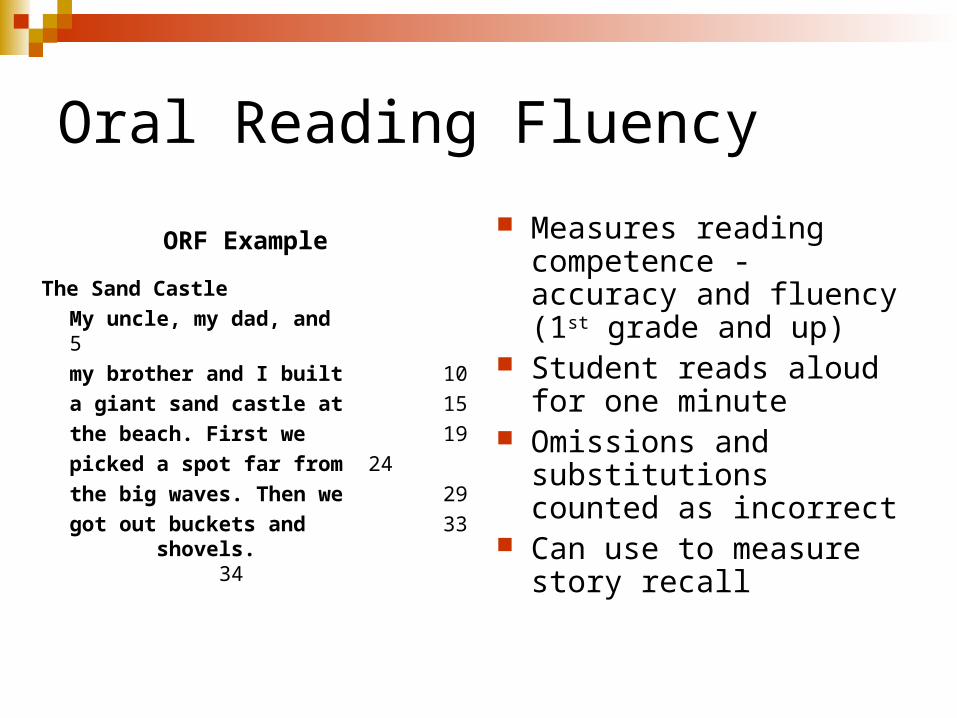
ORF Example
The Sand Castle
My uncle, my dad, and 5
my brother and I built 10
a giant sand castle at 15
the beach. First we 19
picked a spot far from 24
the big waves. Then we 29
got out buckets and 33 shovels. 34
Measures reading competence - accuracy and fluency (1st grade and up)
Student reads aloud for one minute
Omissions and substitutions counted as incorrect
Can use to measure story recall
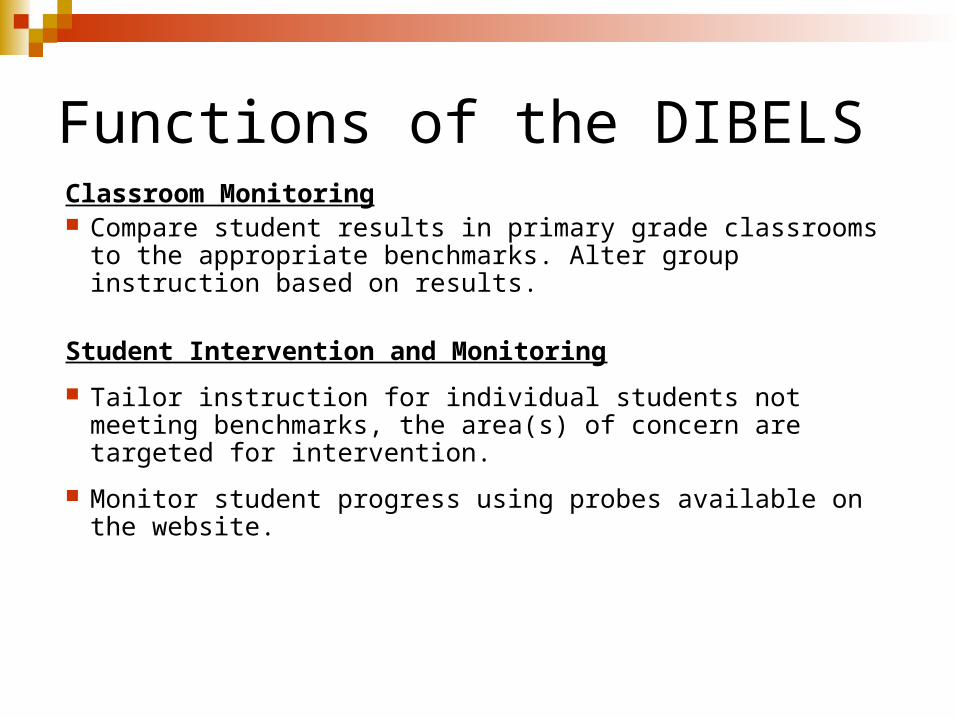
Functions of the DIBELSClassroom Monitoring Compare student results in primary grade classrooms to the
appropriate benchmarks. Alter group instruction based on results.
Student Intervention and Monitoring
Tailor instruction for individual students not meeting benchmarks, the area(s) of concern are targeted for intervention.
Monitor student progress using probes available on the website.

DIBELS Classroom Monitoring Example
Three Kindergarten Classrooms at Readnwrite Elementary School assessed with the DIBELS at Mid year and End of the year

0%
50%
100%
% o
f st
uden
t pe
rform
ance
per
ca
tego
ry
ISF LNF PSF NWF
Subtest
Overall Kindergarten Mid-Year DIBELS Performance
Deficit Emerging Established

0%
20%
40%
60%
80%
100%
% o
f st
ud
ent
per
form
ance
per
ca
teg
ory
ISF M ISF E LNF M LNF E PSF M PSF E NWF M NWF E
Subtest
Overall Kindergarten DIBELS Performance: Mid to Year End
Deficit Emerging Established
ISF LNF PSF NWF

DIBELS Student Intervention and Monitoring Example
First grade student referred for low reading skills at Readnwrite Elementary School.
Assessed and monitored with the DIBELS
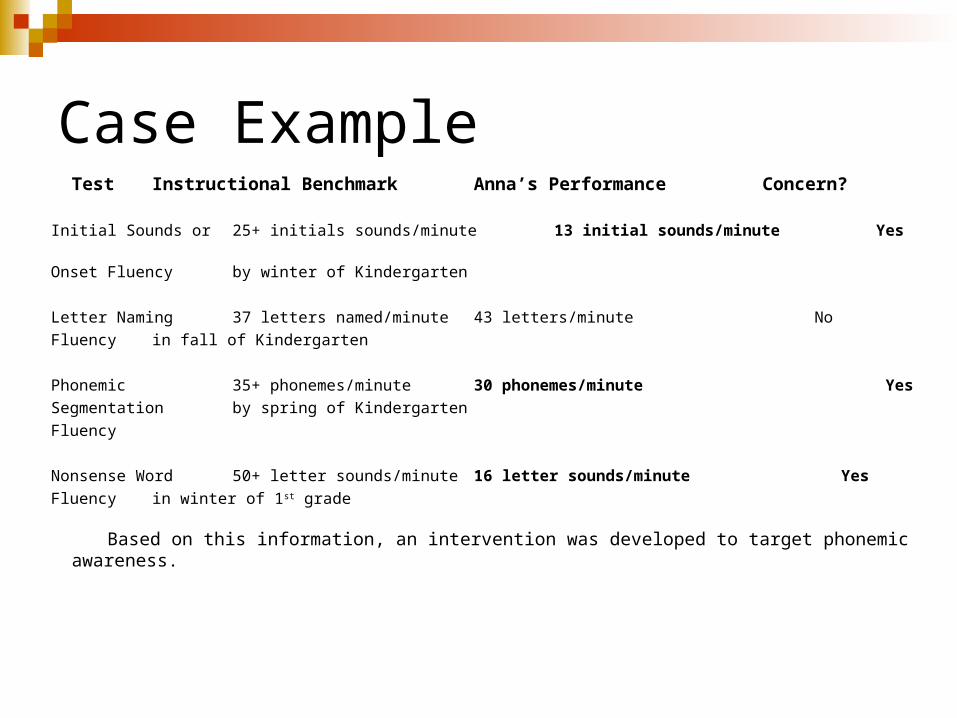
Case ExampleTest Instructional Benchmark Anna’s Performance Concern?
Initial Sounds or 25+ initials sounds/minute 13 initial sounds/minute Yes
Onset Fluency by winter of Kindergarten
Letter Naming 37 letters named/minute 43 letters/minute No
Fluency in fall of Kindergarten
Phonemic 35+ phonemes/minute 30 phonemes/minute Yes
Segmentation by spring of Kindergarten
Fluency
Nonsense Word 50+ letter sounds/minute 16 letter sounds/minute Yes
Fluency in winter of 1st grade
Based on this information, an intervention was developed to target phonemic awareness.
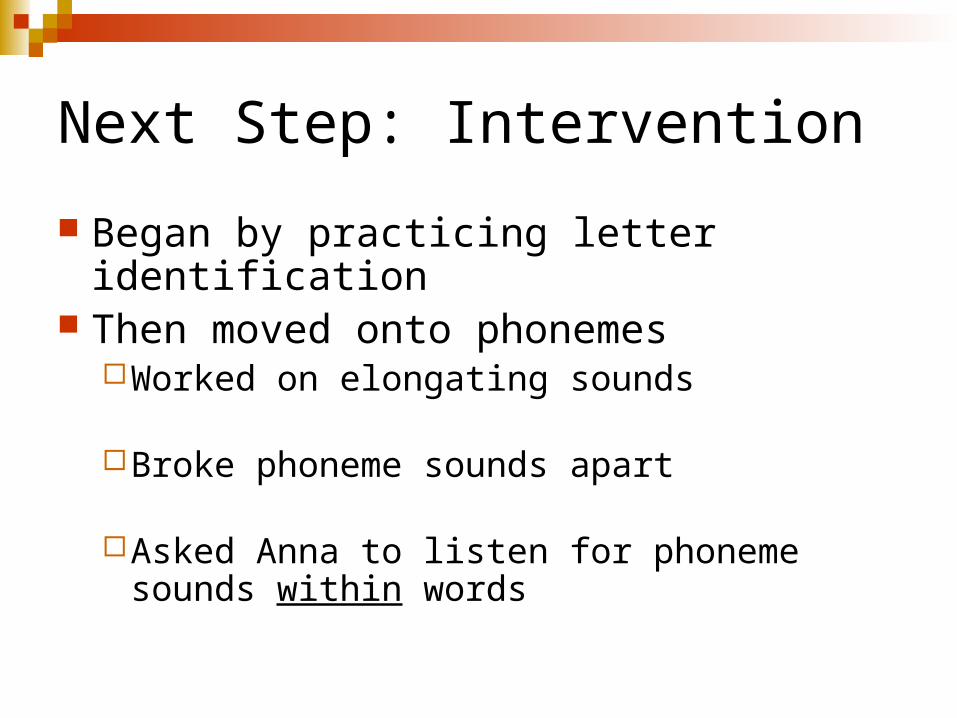
Next Step: Intervention
Began by practicing letter identification Then moved onto phonemes
Worked on elongating sounds
Broke phoneme sounds apart
Asked Anna to listen for phoneme sounds within words
Intervention con’t
Worked on blending sounds
Monitored progress once per week over several weeks
Graphed results with student
Certificate of achievement at the end of intervention period
Made intervention fun!
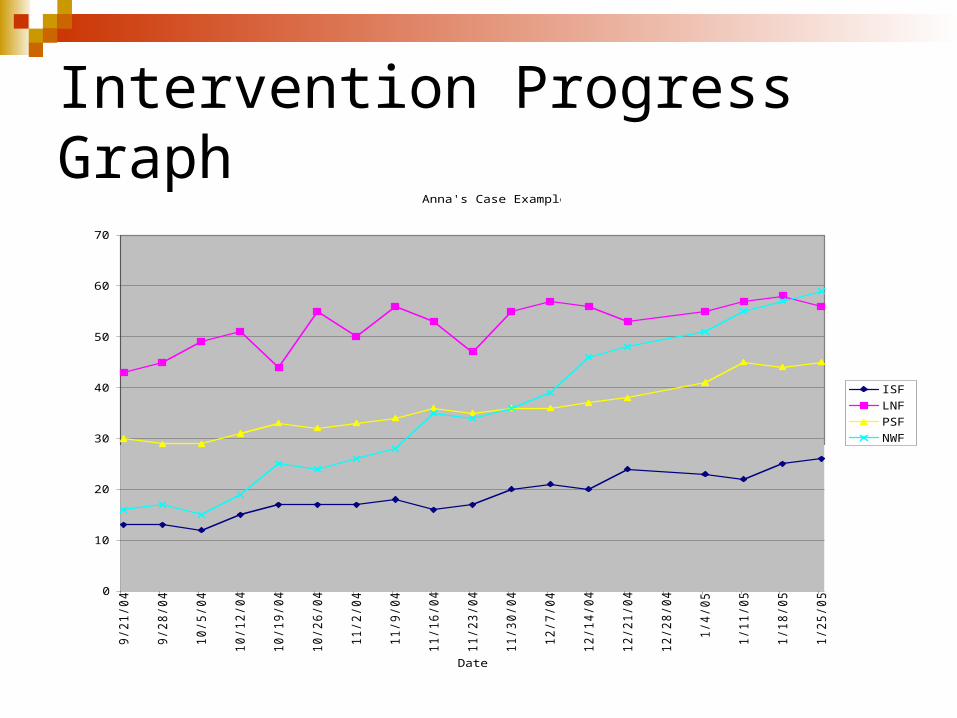
Intervention Progress Graph Anna's Case Example
0
10
20
30
40
50
60
70
9/2
1/0
4
9/2
8/0
4
10
/5/0
4
10
/12
/04
10
/19
/04
10
/26
/04
11
/2/0
4
11
/9/0
4
11
/16
/04
11
/23
/04
11
/30
/04
12
/7/0
4
12
/14
/04
12
/21
/04
12
/28
/04
1/4
/05
1/1
1/0
5
1/1
8/0
5
1/2
5/0
5
Date
Score
ISF
LNF
PSF
NWF

Where do I get more information?
The manual, probes, and benchmarks are available at no charge on the following website: http://dibels.uoregon.edu
You must register as a user to be able to download materials
Interventions
Early Reading Interventions

Early Reading Interventions
http://reading.uoregon.edu 5 Big Ideas in Beginning Reading (3 of
which are assessed by the DIBELS Measures)
Site provides interventions for teaching these Big Ideas in Beginning Reading
Teaching the Big Ideas in Beginning Reading (http://reading.uoregon.edu/instruction)
Organizing Principles: Earlier rather than later Schools, not just programs Evidence, not opinion
Big Ideas in Beginning Reading (http://reading.uoregon.edu)
Phonemic Awareness (DIBELS - Initial Sounds Fluency; Phoneme Segmentation Fluency)
Alphabetic Principle (DIBELS – Nonsense Word Fluency)
Fluency with Text (DIBELS – Oral Reading Fluency)
Vocabulary Comprehension
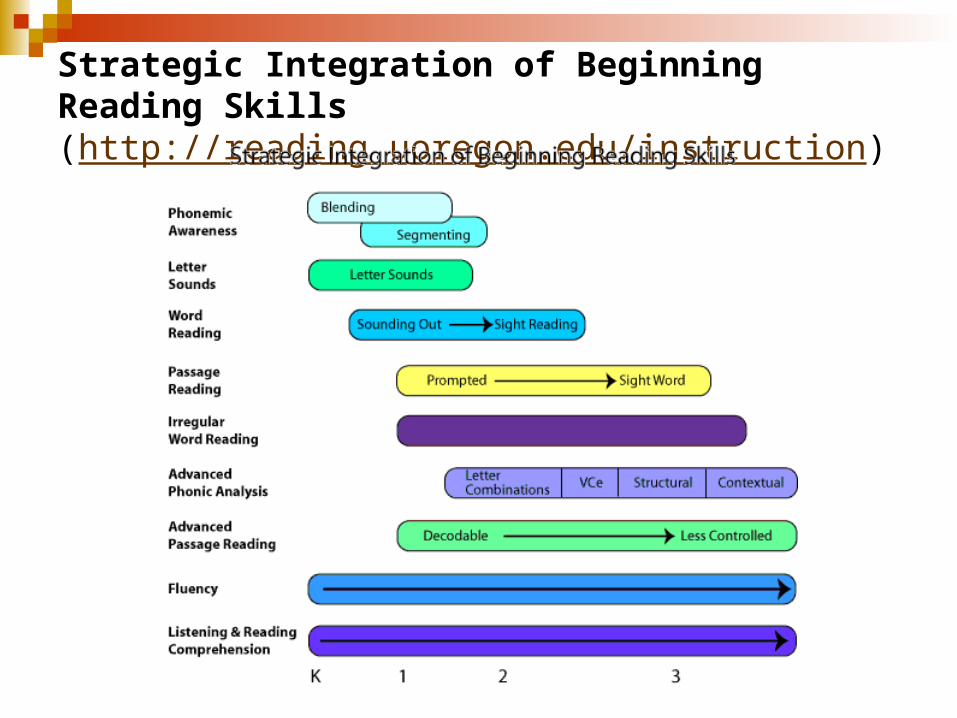
Strategic Integration of Beginning Reading Skills (http://reading.uoregon.edu/instruction)
Early Reading Interventions
www.pbskids.org Between the Lions http://pbskids.org/lions/
Or use search feature on PBS Kids site to
locate intervention ideas that are tied to the skills assessed by the DIBELS measures.
Research Findings – Between the Lions Mississippi Project (Grace & Prince, 2002)
Significant differences were made in several key reading skills of children at high risk of reading failure in two communities in Mississippi.
The students who participated in the project did not outperform their non-viewing peers on ALL measures, but meaningful differences were found and it was concluded that the series could be an important component of reading interventions.
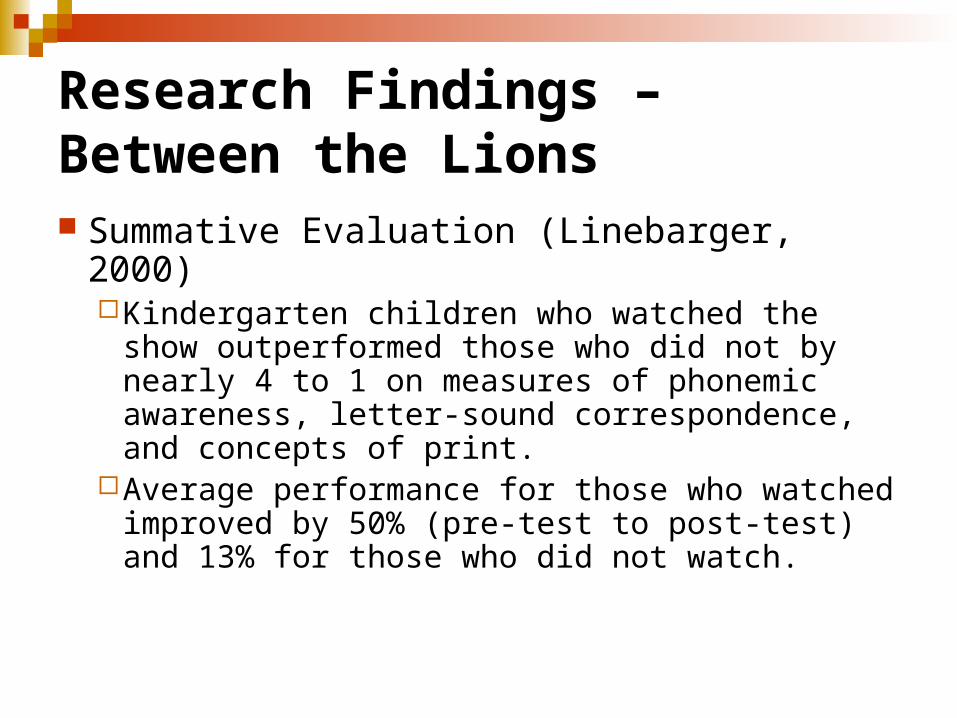
Research Findings – Between the Lions Summative Evaluation (Linebarger, 2000)
Kindergarten children who watched the show outperformed those who did not by nearly 4 to 1 on measures of phonemic awareness, letter-sound correspondence, and concepts of print.
Average performance for those who watched improved by 50% (pre-test to post-test) and 13% for those who did not watch.

Intervention IdeasPhonemic Awareness (adapted from www.pbskids.org/lions/)
Use wordplay in songs, poems, and oral language; and use words that rhyme or begin with the same sound to foster Phonological Awareness. Between the Lions examples:
Songs and poems help kids hear the sounds in words: Limericks spotlight simple rhyming words. Tongue twisters spotlight initial consonant sounds (alliteration). Other poems, songs, and wordplay draw attention to rhyming
and other sound patterns
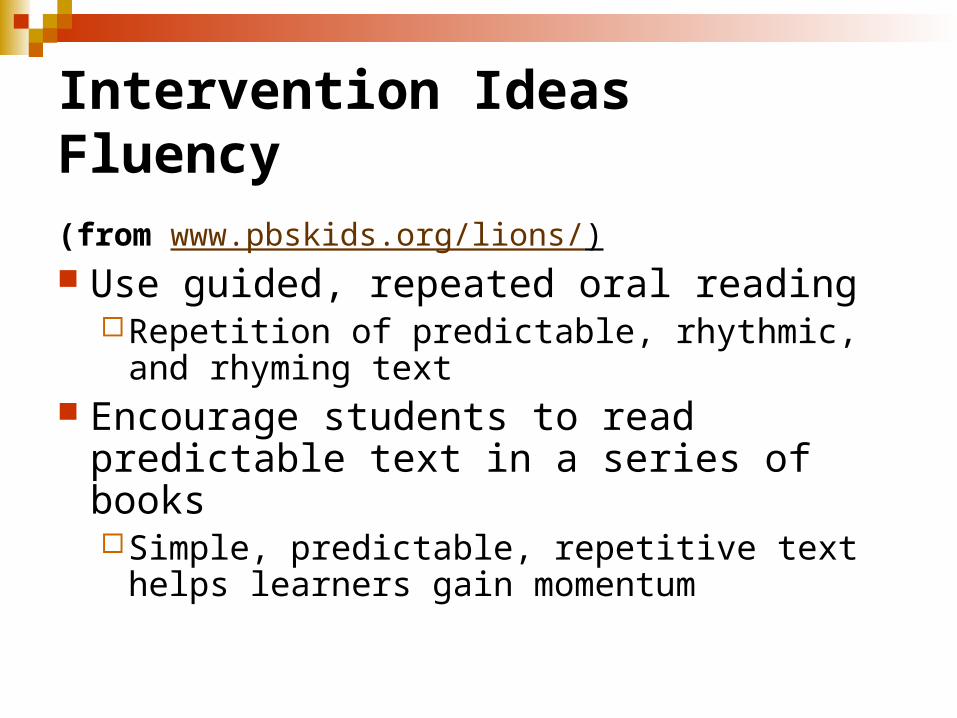
Intervention Ideas Fluency
(from www.pbskids.org/lions/) Use guided, repeated oral reading
Repetition of predictable, rhythmic, and rhyming text
Encourage students to read predictable text in a series of booksSimple, predictable, repetitive text helps
learners gain momentum
RTI Practices
RTI in literacy with students in text

Students in Text: Assessment to Intervention Assessment DIBELS: ORF, Story Retell CBM Comprehension Measures
Intervention Ideas/Resources Peer Tutoring BEA Graphing Website
Curriculum Based Measurement
“Curriculum-based measurement, or CBM, is a method of monitoring student educational progress through direct assessment of academic skills. CBM can be used to measure basic skills in reading, mathematics, spelling, and written expression. It can also be used to monitor readiness skills. When using CBM, the instructor gives the student brief, timed samples, or "probes," made up of academic material taken from the child's school curriculum.” (Wright 2005)
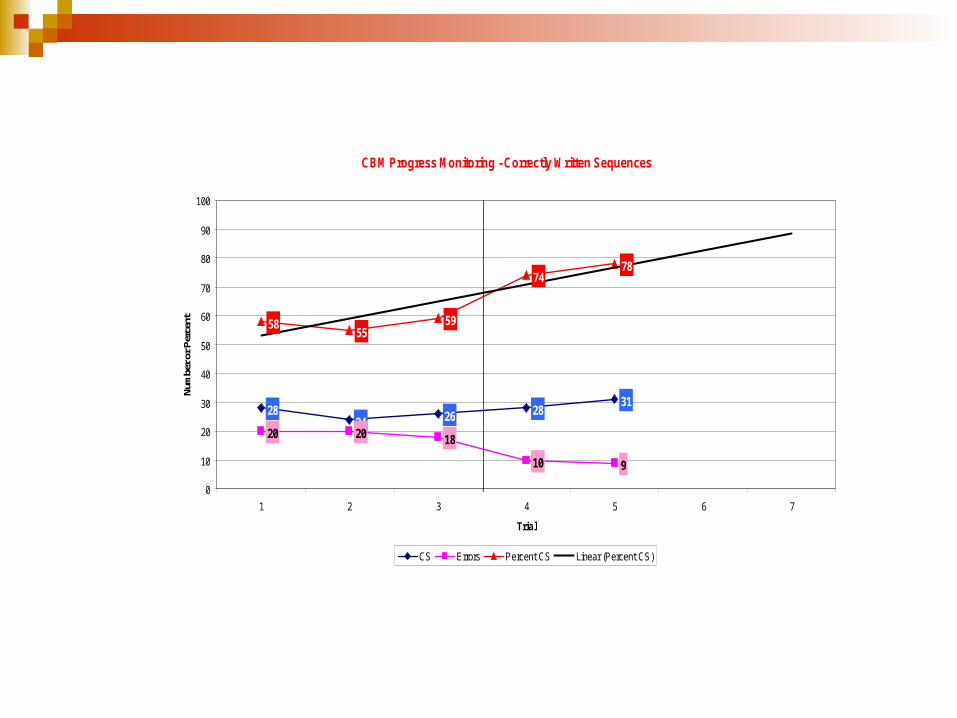
CBM Progress Monitoring - Correctly Written Sequences
2824 26 28
31
20 20 18
9
5855
59
7478
10
0
10
20
30
40
50
60
70
80
90
100
1 2 3 4 5 6 7
Trial
Num
ber o
r Per
cent
CS Errors Percent CS Linear (Percent CS)
Baseline Weekly Monitoring
Curriculum Based Measurement
Curriculum based assessment can be used to measure things such as reading fluency and comprehension, math fluency, spelling, and writing fluency
Many practitioners use it as a method to track student progress while others use it as a class wide screening method to help guide instruction and in curriculum development

Why use curriculum based Measurement? This method is very quick and simple to administer This type of assessment can be directly linked to
classroom instruction It provides information that teachers can use to modify
the instruction for individual students or a whole class Many people, such as teachers, school psychologists,
and paraprofessionals are able to collect the data
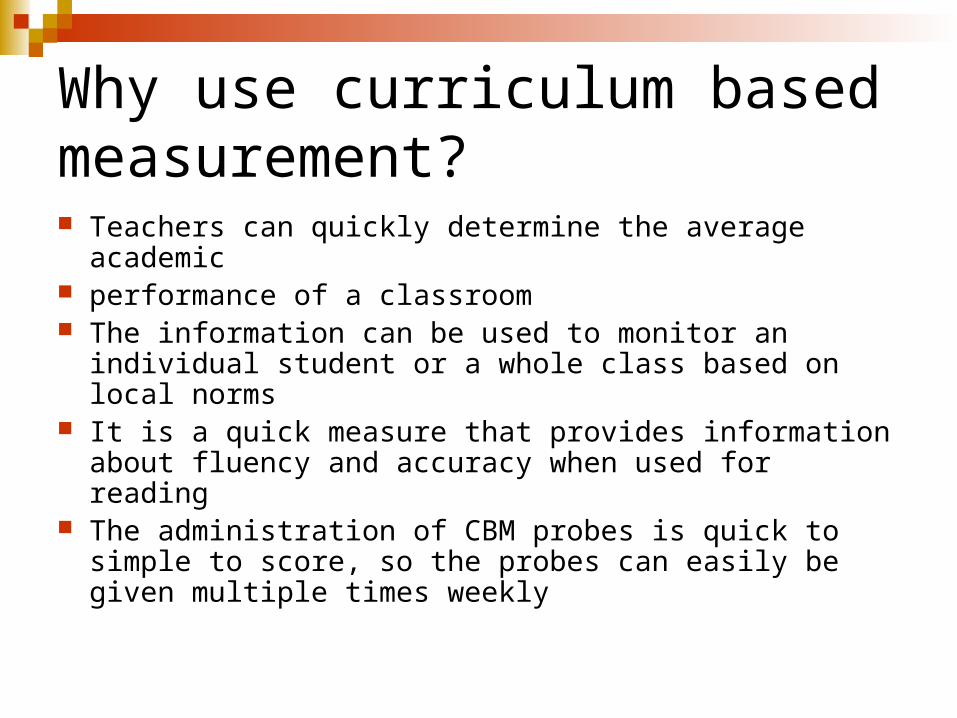
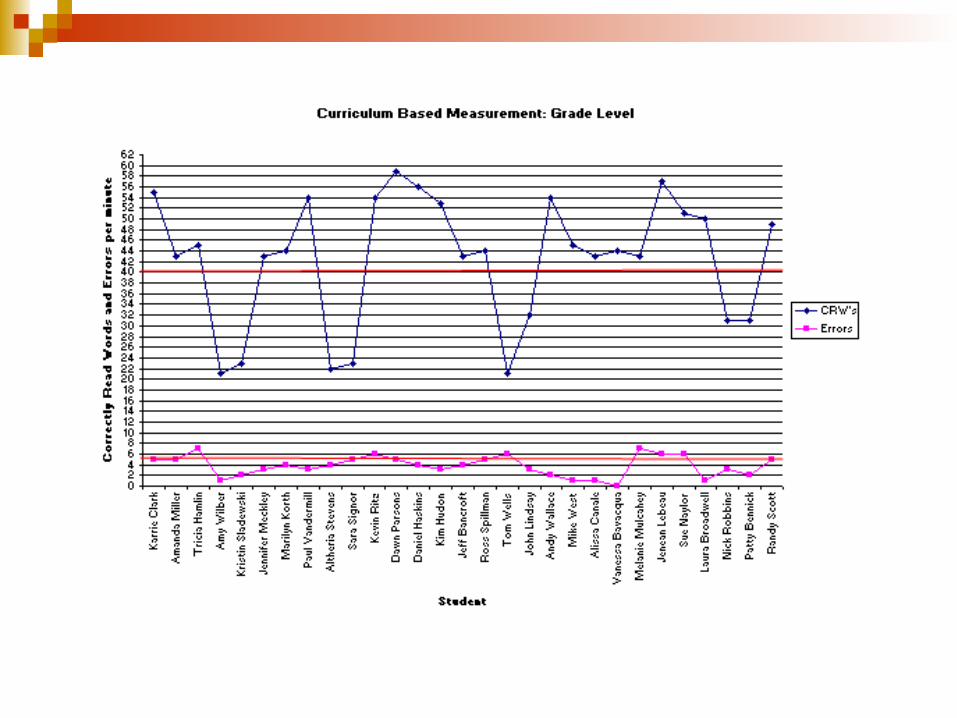
Why use curriculum based measurement? Teachers can quickly determine the average academic performance of a classroom The information can be used to monitor an individual
student or a whole class based on local norms It is a quick measure that provides information about
fluency and accuracy when used for reading The administration of CBM probes is quick to simple to
score, so the probes can easily be given multiple times weekly

Why use curriculum based assessment?
CBM is sensitive to short-term student gains that other measures aren’t able to pick up
Results of testing with CBM can more easily reflect a local average rather than comparing student performance to a national average
http://www.studentprogress.org/
http://www.interventioncentral.org/index.shtml
http://www.nrcld.org/
Reading Comprehension
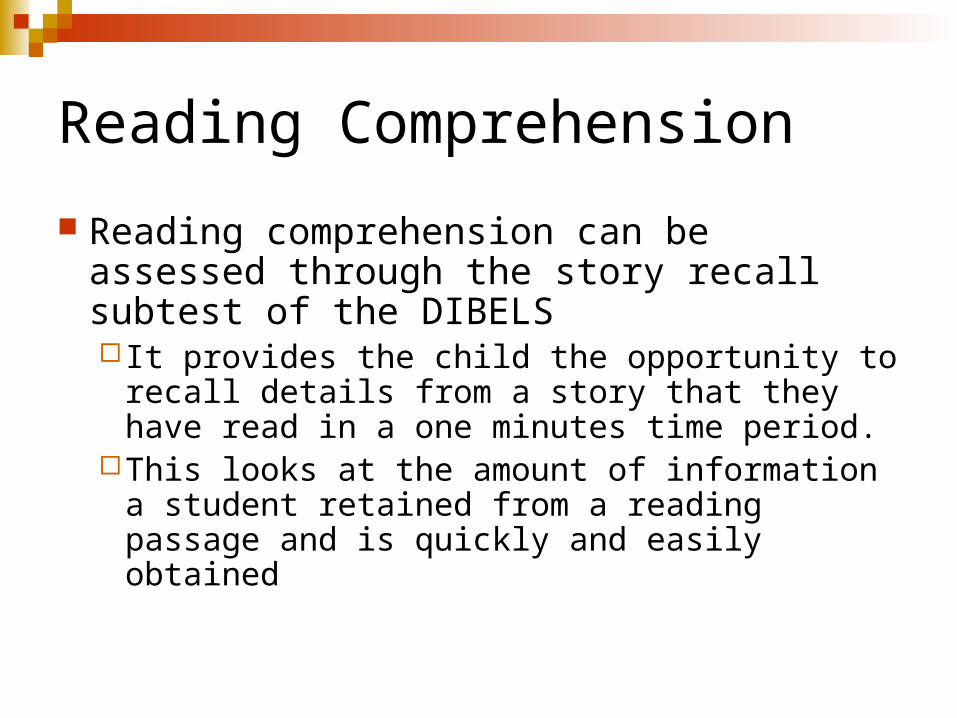
Reading comprehension can be assessed through the story recall subtest of the DIBELS It provides the child the opportunity to recall
details from a story that they have read in a one minutes time period.
This looks at the amount of information a student retained from a reading passage and is quickly and easily obtained
Reading Comprehension
Reading fluency probes have also been created with three questions to be used as a comprehension check at the end of the probe. (found on
http://www.joewitt.org/ Reading%20Grade%20levels.htm)

Reading Comprehension
Silent reading passages can also be used to measure comprehension by asking the student to choose the appropriate term based on a stories context
(Found on http://www.edformation.com/ promo/mcbm.htm)
Other passages have been created from popular children’s literature and can be found on
(Found on http://www.usm.maine.edu/~rbrown/ 456%20files.htm)

Peer Tutoring
Using CBM to assess reading levels and monitor progress
Research
According to Fuchs and Fuchs (2004), “as many as 40% of children in classrooms fail to make adequate reading progress.”Up to 25% of the adult population is illiterate
Peer tutoring can help through “oral reading with feedback and guidance which leads to meaningful improvements in reading for students (NRP, 2000).”

Research (cont.)
“Peer tutoring produced more than twice as much achievement compared to computer-assisted instruction, three times more than reducing the class size from 35 to 30 students, and almost four times more than lengthening the school day by one hour (Levin, Glass, and Meister, 1984).”
Research (cont.)
Benefits both the tutor and tutee academically (Garcia-Vazquez & Ehly, 1995).
Also used to foster social skills, positive relationships, and self-esteem for both (Mercer, et al., 2001).
Feasible and beneficial for students who are receiving services for learning disabilities, behavioral disorders, and developmental delays (Cook, Scruggs, Mastropieri, & Castro, 1986 )

Cross-Age Peer Tutoring
Variety of different models A form of cooperative learning under a teacher’s
guidance in which an older student who can often benefit from additional reinforcement of skills is paired with a younger student who may or may not need remediation (Thrope & Wood, 2000).
Supplements classroom instruction Adapted to the student’s pace, style, and level of
understanding (Jacobson, Thrope, et al., 2001).
Benefits of Cross-Age Peer Tutoring Tutors and tutees benefit academically
Analysis of ten cross-age peer tutoring pairs show consistent academic gains in both students (Thrope & Wood, 2000).
Tutee receives immediate feedback Error correction Answers to questions Encouragement Learns correct reading through modeling (Jacobson,
Thrope, et al., 2001) Tutors are viewed as role models (Thrope & Wood, 2000).
Core Guidelines
Schools have freedom in designing peer tutoring programs as they like, however a core set of guidelines are encouraged to increase reading fluency Select peer tutoring activities that supplement classroom
instruction Provide thorough training to tutors, ensuring they have
mastered the necessary techniques Use research based treatments for tutees Conduct periodic integrity checks Monitor the effectiveness of the program (CBM)
(Garcia-Vazquez et al., 1995 & Wright, 2004)
Case Example:New York Urban School District
Implemented under Safe Schools Healthy Students Initiative
Three urban elementary schools Facilitated by five SUNY Oswego graduate
students under the guidance of Jim Wright and Kristi Lorah-Cleary

Participants
Tutors are teacher nominated third and fourth graders who are reading within one grade level of their current grade placement
Tutees are teacher nominated second and third graders who are reading below grade level but at a minimum of early first grade
Tutor Training
Students took part in four 45 minute lessons covering the following:Peer tutoring and appropriate behaviorsHow to give praise to tutees “Listening While Reading” to build reading
fluencyReview of previous lessons and graduation
“Listening While Reading”
“Modeling by reading aloud helps students understand what fluency sounds like and is essential to its development” (Worthy & Broaddus, 2001). Benefits include gains in rate, accuracy, phrasing,
segmentation, and expression (Chomsky, 1978; Schreiber, 1987).
“Listening While Reading”
Book is placed so both the tutor and tutee can read from it
Tutor reads one page of text aloud to the tutee Tutee reads the same page aloud to the tutor while the
tutor provides error correction as needed At the end of each page, students are instructed to
verbally praise the tutee’s effort
Sessions
Total of 30 sessions will occur over the course of the programSites vary slightly30 minute sessions, three times per week
Progress Monitoring
Used to look at the effectiveness of the peer tutoring intervention
Each week the students are monitored using Curriculum Based Measurement (CBM) reading probesProbes are used to determine whether the
number of correctly read words (CRW) per minute that a student reads increases over time indicating whether the intervention was effective or not

KeithGrade 2Monitoring Level 1:1
0
20
40
60
80
100
12010/1
1
10/2
6
11/1
0
11/2
5
12/1
0
12/2
5
1/9
1/2
4
2/8
2/2
3
3/9
3/2
4
4/8
4/2
3
5/8
5/2
3
6/7
Assesment Date
Co
rrectl
y R
ead
Wo
rds
Per
Min
ute
Baseline/CRW Monitoring/CRW
Tutee Progress Monitoring
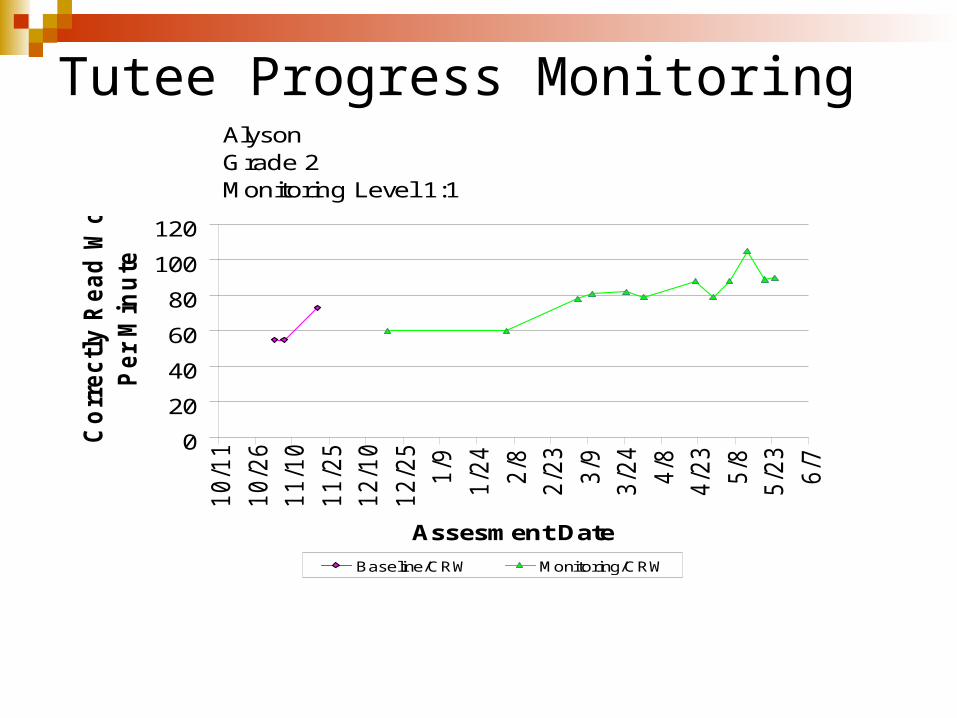
Tutee Progress MonitoringAlysonGrade 2Monitoring Level 1:1
0
20
40
60
80
100
12010/1
1
10/2
6
11/1
0
11/2
5
12/1
0
12/2
5
1/9
1/2
4
2/8
2/2
3
3/9
3/2
4
4/8
4/2
3
5/8
5/2
3
6/7
Assesment Date
Co
rrectl
y R
ead
Wo
rds
Per
Min
ute
Baseline/CRW Monitoring/CRW

Tutor Progress Monitoring LeslieGrade 3Monitoring Level 2:2
020406080
100120140160
9/2
6
10/1
1
10/2
6
11/1
0
11/2
5
12/1
0
12/2
5
1/9
1/2
4
2/8
2/2
3
3/9
3/2
4
4/8
4/2
3
5/8
5/2
3
6/7
Assesment Date
Co
rrectl
y R
ead
Wo
rds
Per
Min
ute
Baseline/CRW Monitoring/CRW
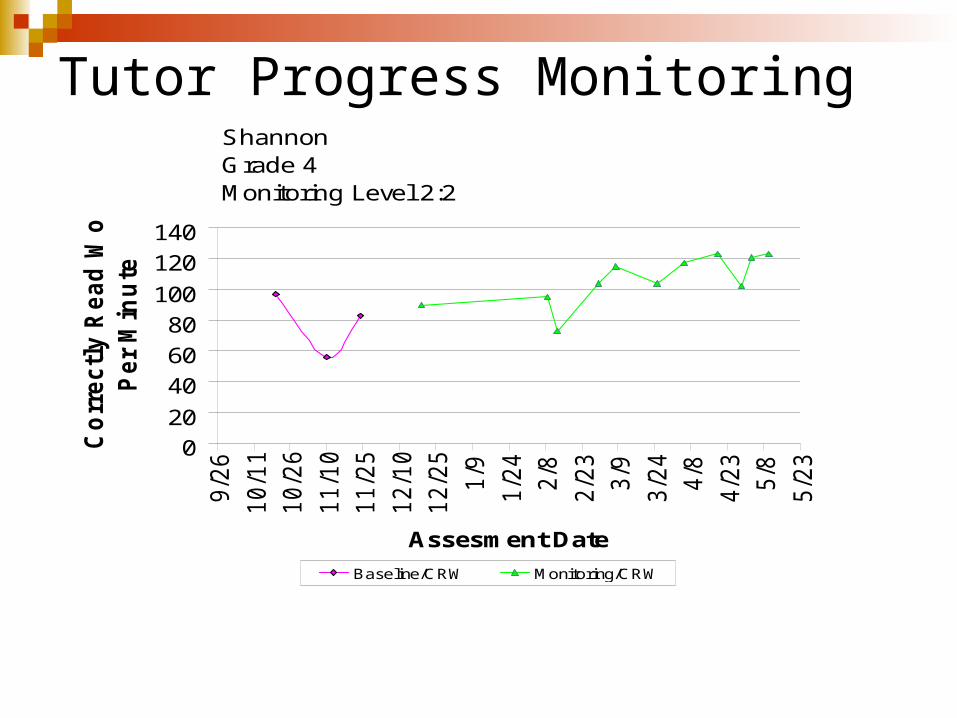
Tutor Progress Monitoring ShannonGrade 4Monitoring Level 2:2
0
20
40
60
80
100
120
1409/2
6
10/1
1
10/2
6
11/1
0
11/2
5
12/1
0
12/2
5
1/9
1/2
4
2/8
2/2
3
3/9
3/2
4
4/8
4/2
3
5/8
5/2
3
Assesment Date
Co
rrectl
y R
ead
Wo
rds
Per
Min
ute
Baseline/CRW Monitoring/CRW
www.interventioncentral.org
For a complete description of the Peer Tutoring Project and materials necessary for implementation please visit the website created by Jim Wright- “Intervention Central”
Brief Experimental Analysis
CBM are useful methods to use in combination with BEA to identify the least intrusive and most effective intervention to use with a student.
What’s BEA?
A model used to predict which intervention will be most effective & feasible for a student
We "test-drive" different interventions before “buying one” to see which “runs best & gets best mileage”
BEA can be used with variety of academic or behavior problems
Focus Today: Academics
(particularly oral reading)
4 Main Steps…
Step 1. Collect Baseline
-Current performance level before new intervention
-Something to measure later performance against
-Can use: CBM, Classroom quizzes, worksheets, reading series , other
Step 2. Choose interventions to “test-drive”
Selected based on Main Reasons for Academic Difficulty
*Which is Based on Instructional Hierarchy(Effective Instruction Accuracy Fluency
Generalization)

Possible Reading Interventions
1) Motivation: choices and incentives
2) Motivation & Practice- 1 & passage preview
3) Motivation, Practice, & Modeling- 2 & LPP
4) Motivation, Practice, Modeling, & Help- 3 & error correction
5) Better Instructional match: easier materials
(Listed from easiest to most difficult and intrusive)

Step 3. Briefly “Test-Drive” interventions sequentially from least to most intrusive
measure student performance after each “Test Drive”
Administer & Monitor each Intervention…
3 Times Accounts for variability/checks for
consistency Like a “mini-replica” of the experiment This increases our confidence in uncovering
the best intervention.

4. Compare “test – drives”…
Graph outcome of each intervention
Ex. If using CBM: Graph CRW’s & errors for each intervention and compare.
Which intervention “ran the best”?
Which produced greatest increases in performance?
If 2 were equally effective, which was least intrusive?
Balance effectiveness with feasibility

BEA Goal is Reached
Appropriate intervention for student is identified…
Long-Term Implementation (Extended Analysis Phase)
Turn the identified intervention into a long-term intervention
Measure progress over time
Use same method as used for baseline
Use novel passages, quizzes, ect. that student hasn’t been given before
This allows us to assess if progress is generalizing to novel text
See if student is progressing as desired…
Alter intervention as needed.
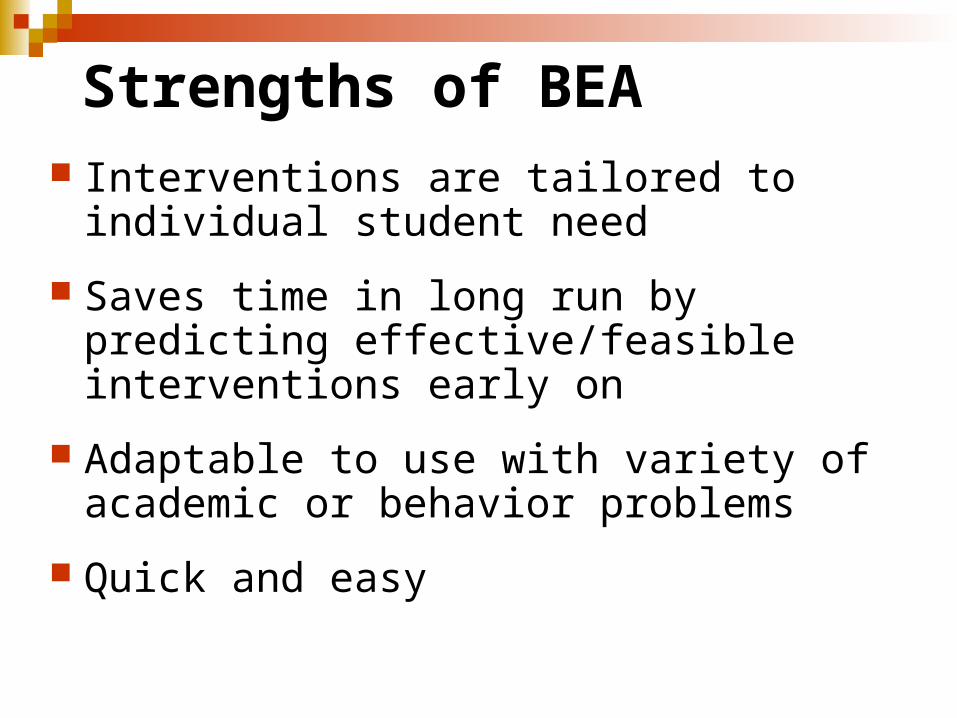
Strengths of BEA Interventions are tailored to individual
student need
Saves time in long run by predicting effective/feasible interventions early on
Adaptable to use with variety of academic or behavior problems
Quick and easy
BEA Case Example: Haley

Reason for Referral
10-year old female
Fourth grade
Referred for reading difficulties

Baseline performance
CBM used
Instructional for reading at a late third grade level (3-2)
Reading 48 words correctly per minute with 5 errors

Brief Experimental Analysis
Interventions developed according to Main reasons for academic difficulty…
This BEA identically repeated three times
= three BEA trials or “mini-replicas”: (week 1, 2, & 3)
Allowed consultant to check for consistency/ account for variability
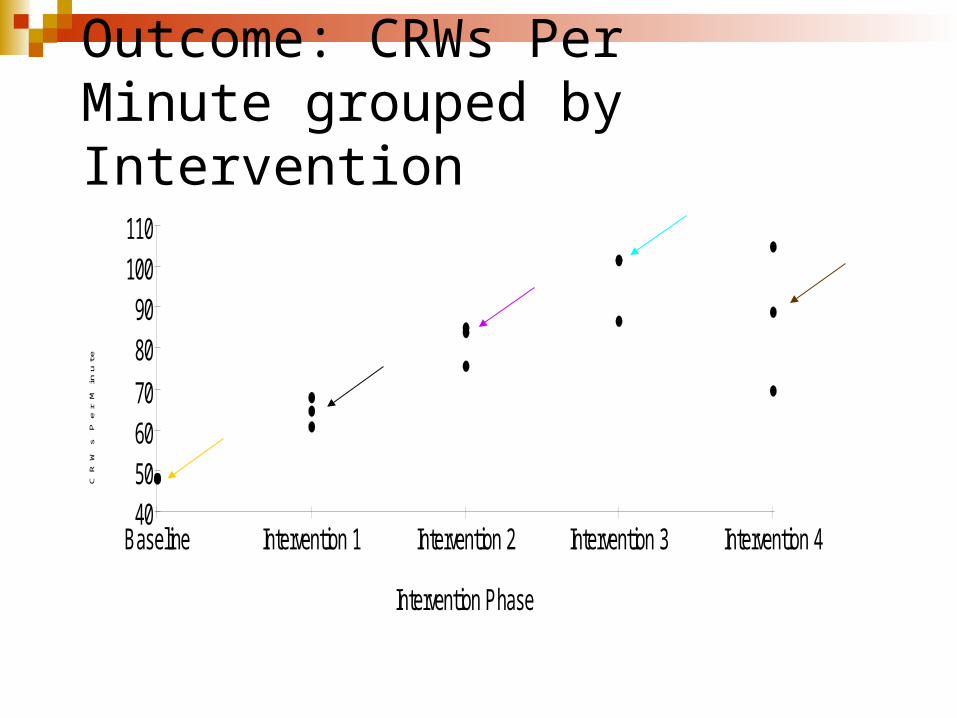
Outcome: CRWs Per Minute grouped by Intervention
40506070
8090
100110
Baseline Intervention 1 Intervention 2 Intervention 3 Intervention 4
CR
Ws
Pe
r M
inu
te
Intervention Phase

Median Errors per Minute
0
1
2
3
4
5
Baseline Intervention 1 Intervention 2 Intervention 3 Intervention 4
Er
ro
rs
P
er
M
in
Intervention Phase
Results Summary
Intervention 3 (motivation, practice and modeling)
was most consistently effective..
So it was implemented long-term
Extended Analysis Phase:
1. Level 3-2 book used.
2. LPP/RR/Motivation implemented.
3. 30 min.,2x/week, 5 weeks.
Monitoring Process
Progress measured after each session…
Median performance taken on three novel 3-2 level CBM passages
Haley graphed own daily performance on chart to see progress
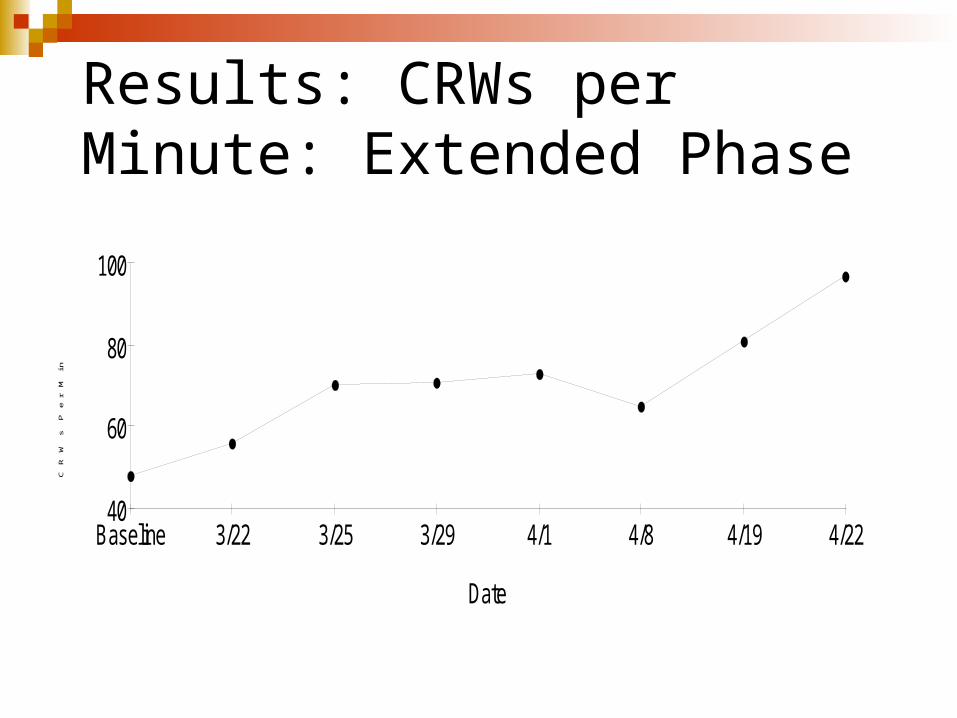
Results: CRWs per Minute: Extended Phase
40
60
80
100
Baseline 3/22 3/25 3/29 4/1 4/8 4/19 4/22
CR
Ws
P
er
M
in
Date
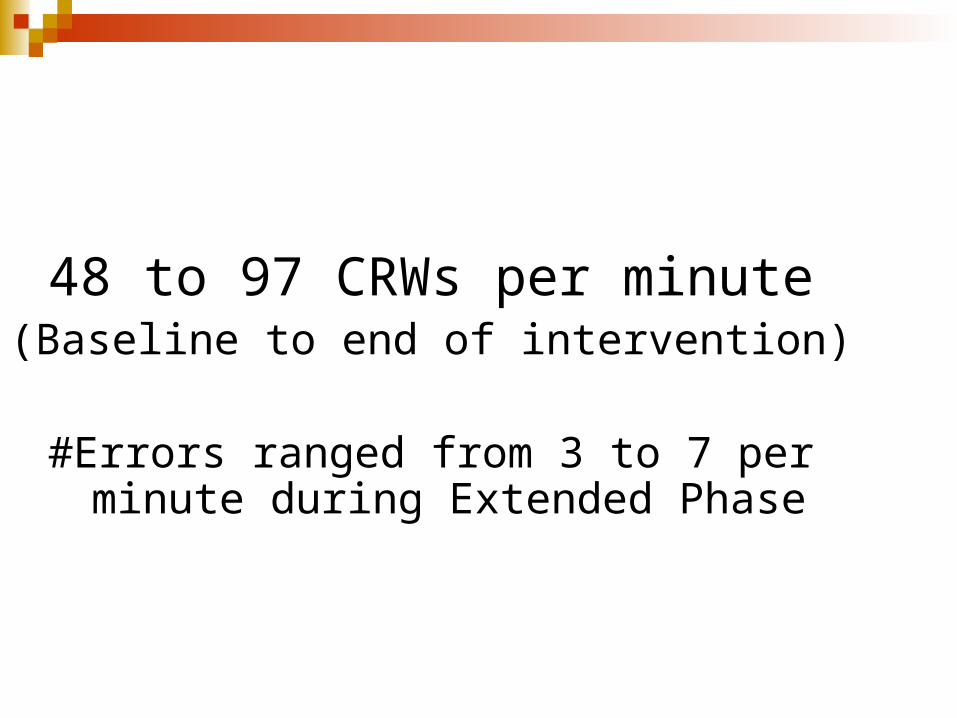
48 to 97 CRWs per minute(Baseline to end of intervention)
#Errors ranged from 3 to 7 per minute during Extended Phase

Summary
Successful reading improvement over time through use of intervention specially designed for Haley’s individual needs.
Intervention identified using BEA model
Graphing and Templates
How to use graphs to display assessment and progress
monitoring data.
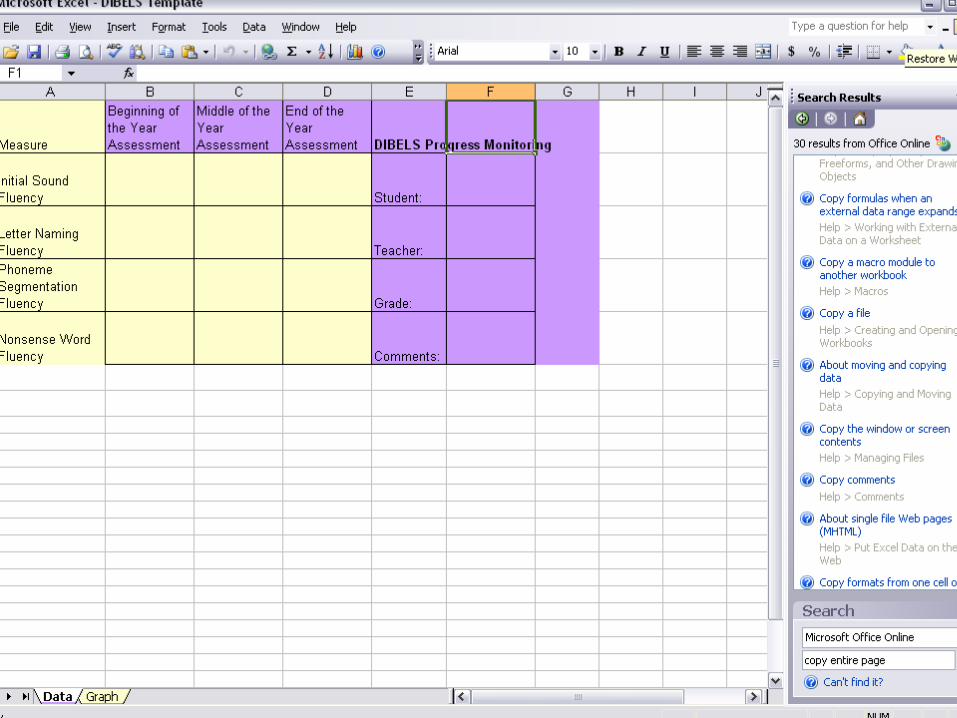
Templates
• Have been already constructed for your use in order to input data using DIBELS, CBA, BEA and Peer Tutoring.
• All you have to do is input the data and then click on the graph tab.
• You do not need to know how to construct your own graph – however if this is something you want to learn directions are included.
Examples of the templates and corresponding Graphs……
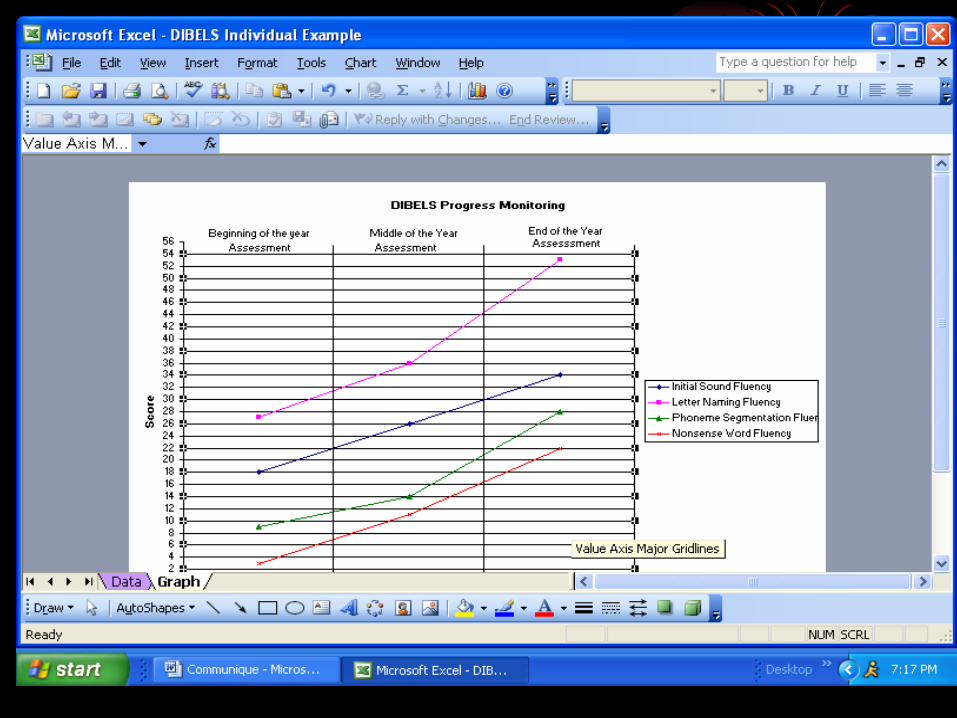
DIBELS Individual Student Graph

DIBELS Grade Level Assessment Template
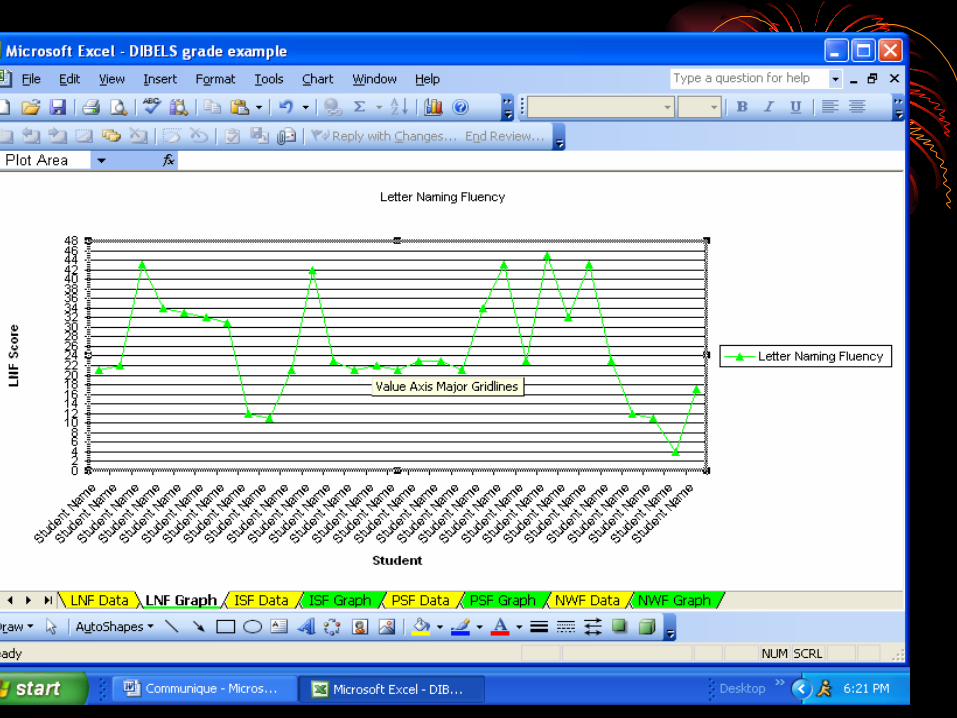
DIBELS Grade Level Assessment Graph
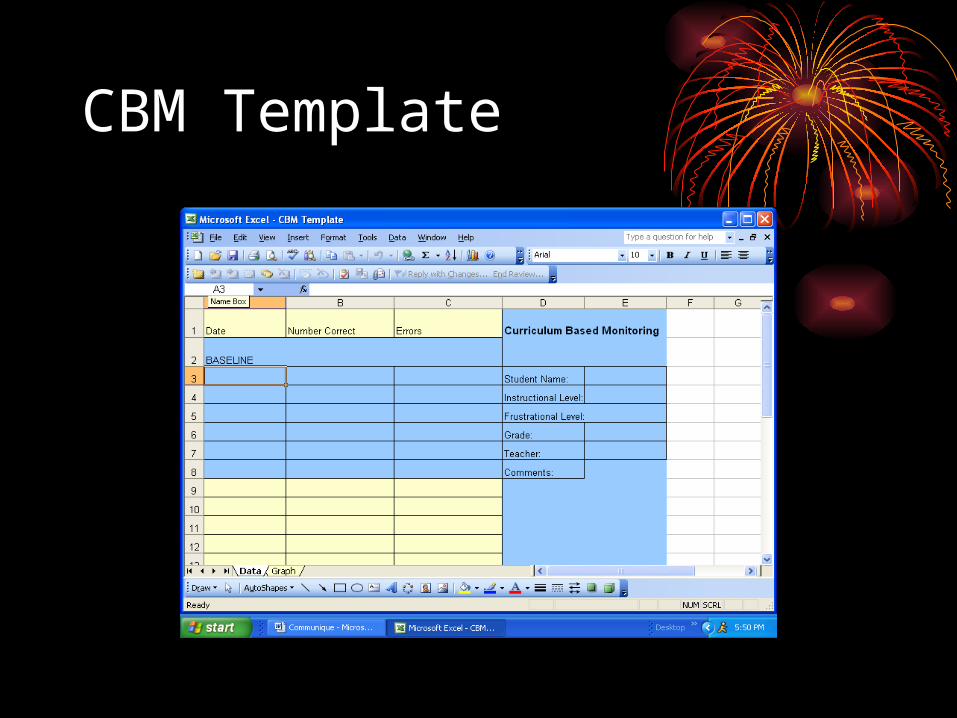
CBM Template
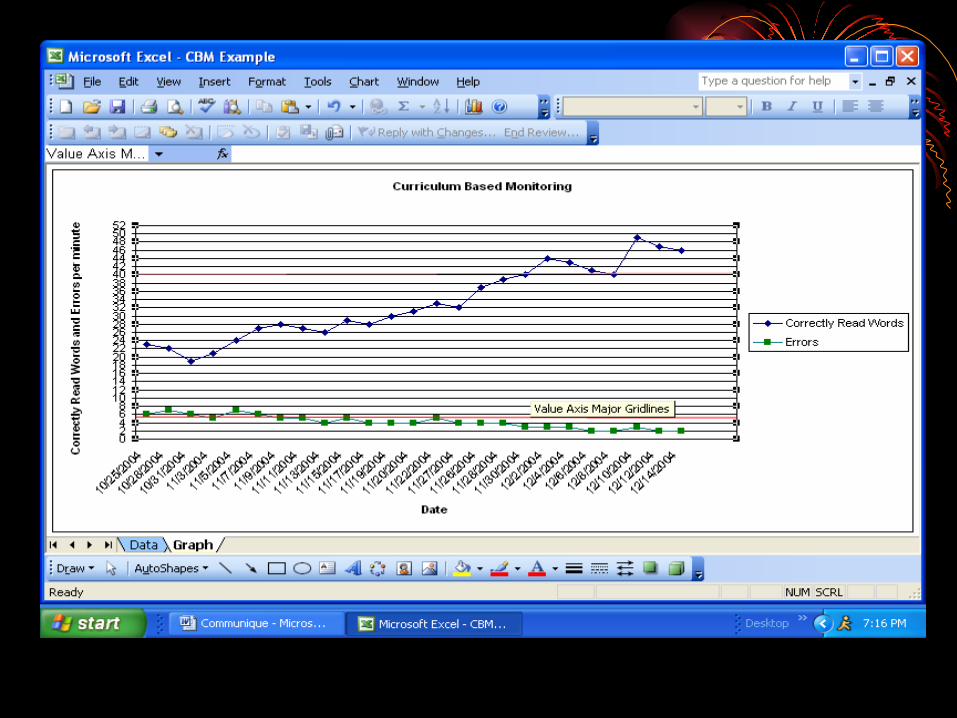
CBM Graph
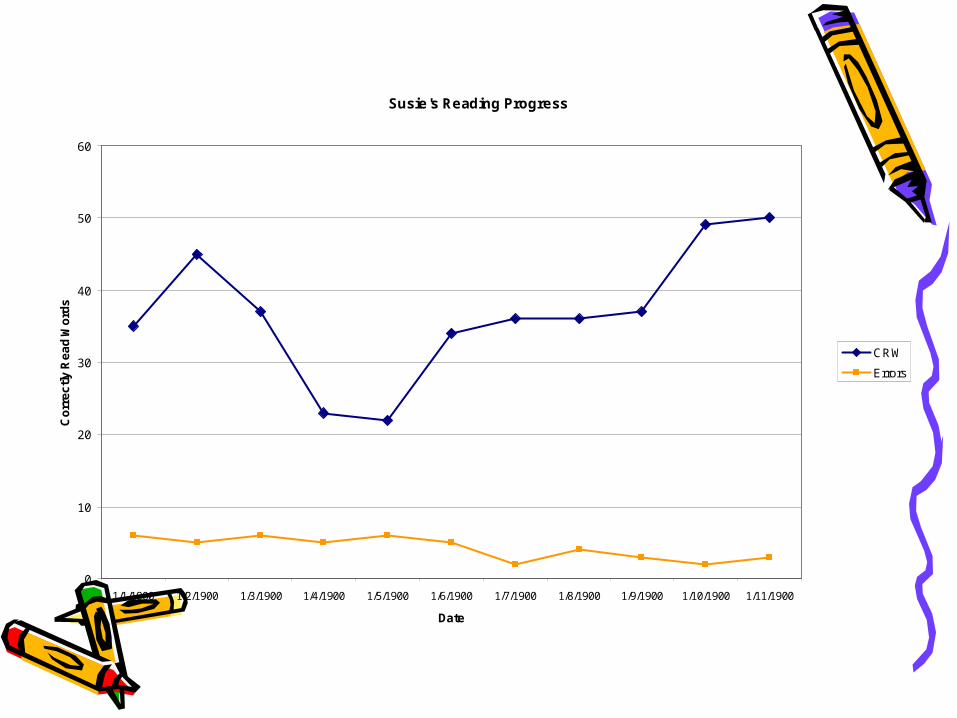
Adding a slope to CBM graph
• With Excel, No problem
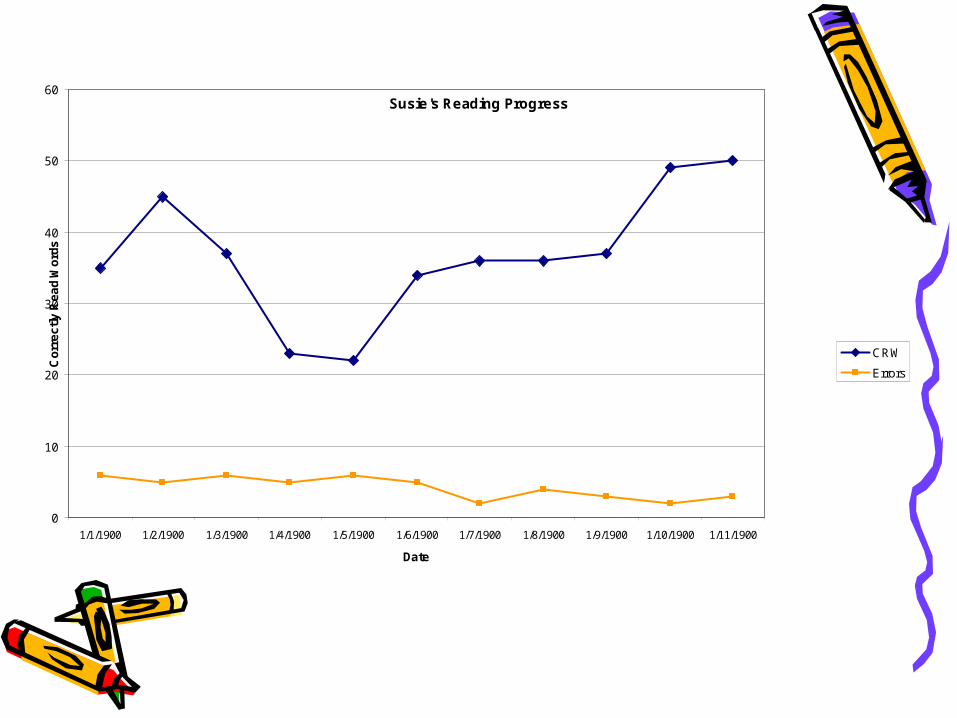
Susie's Reading Progress
0
10
20
30
40
50
60
1/1/1900 1/2/1900 1/3/1900 1/4/1900 1/5/1900 1/6/1900 1/7/1900 1/8/1900 1/9/1900 1/10/1900 1/11/1900
Date
Co
rre
ctl
y R
ea
d W
ord
s
CRW
Errors
Susie's Reading Progress
0
10
20
30
40
50
60
1/1/1900 1/2/1900 1/3/1900 1/4/1900 1/5/1900 1/6/1900 1/7/1900 1/8/1900 1/9/1900 1/10/1900 1/11/1900
Date
Co
rre
ctl
y R
ea
d W
ord
s
CRW
Errors

Debbie's Reading Progress
0
5
10
15
20
25
30
1/1/1900 1/2/1900 1/3/1900 1/4/1900 1/5/1900 1/6/1900 1/7/1900 1/8/1900 1/9/1900 1/10/1900 1/11/1900
Date
Co
rre
ctl
y R
ea
d W
ord
s
CRW
Errors

Debbie's Reading Progress
0
5
10
15
20
25
30
1/1/1900 1/2/1900 1/3/1900 1/4/1900 1/5/1900 1/6/1900 1/7/1900 1/8/1900 1/9/1900 1/10/1900 1/11/1900
Date
Co
rre
ctl
y R
ea
d W
ord
s
CRW
Errors

How to access these templates
www.oswego.edu/~mcdougal/
Discussion Time- you make the call!
What are the most prominent needs that must be met in order for you to respond to the RTI initiative? (training, administrative/district support, resources)
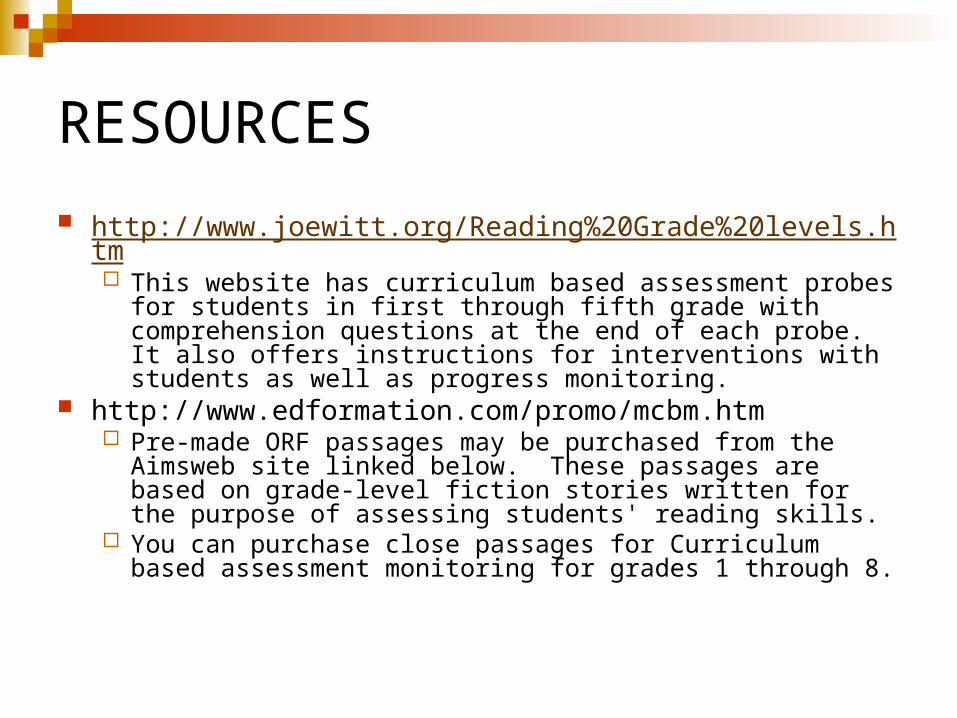
RESOURCES
http://www.joewitt.org/Reading%20Grade%20levels.htm This website has curriculum based assessment probes for
students in first through fifth grade with comprehension questions at the end of each probe. It also offers instructions for interventions with students as well as progress monitoring.
http://www.edformation.com/promo/mcbm.htm Pre-made ORF passages may be purchased from the Aimsweb
site linked below. These passages are based on grade-level fiction stories written for the purpose of assessing students' reading skills.
You can purchase close passages for Curriculum based assessment monitoring for grades 1 through 8.

RESOURCES
http://www.usm.maine.edu/~rbrown/456%20files.htmThe passages found here are taken from well
known children's literature. There are about 20 passages at each grade level for grades 4, 5, and 6.
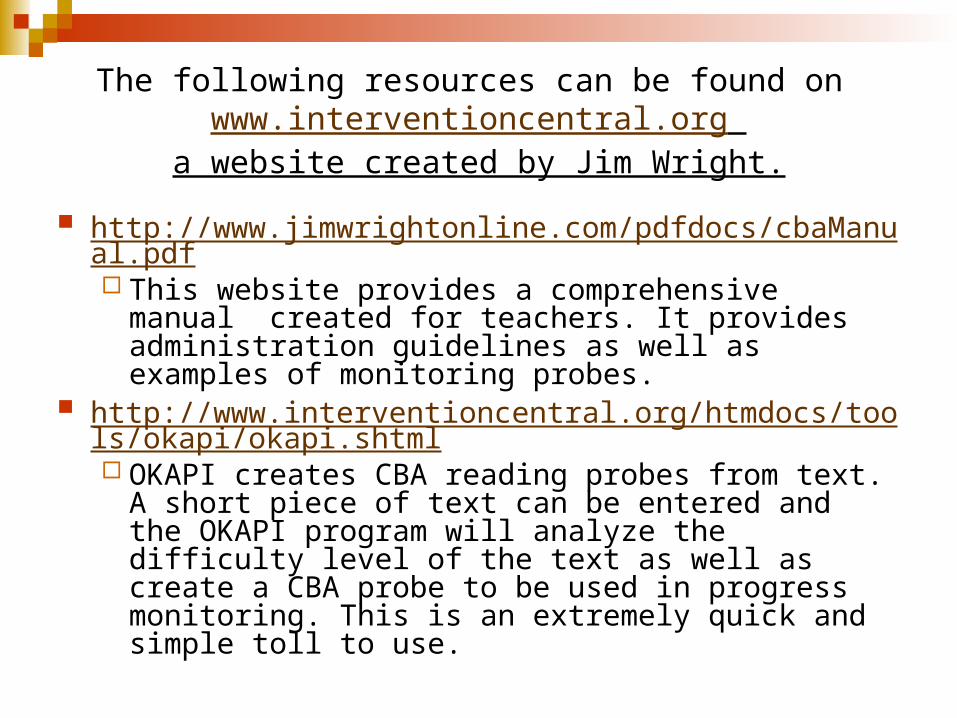
The following resources can be found on www.interventioncentral.org
a website created by Jim Wright.
http://www.jimwrightonline.com/pdfdocs/cbaManual.pdf This website provides a comprehensive manual
created for teachers. It provides administration guidelines as well as examples of monitoring probes.
http://www.interventioncentral.org/htmdocs/tools/okapi/okapi.shtml OKAPI creates CBA reading probes from text. A short
piece of text can be entered and the OKAPI program will analyze the difficulty level of the text as well as create a CBA probe to be used in progress monitoring. This is an extremely quick and simple toll to use.

The following resources can be found on www.interventioncentral.org
a website created by Jim Wright.
http://www.interventioncentral.org/htmdocs/interventions/cbmwarehouse.shtmlCBA Warehouse “A world of CBM resources
under one roof…” http://www.jimwrightonline.com/php/chartdog_2_
0/chartdog.phpThis allows graphing of information collected
through curriculum based assessment quickly and easily.
REFERENCES
http://www.jimwrightonline.com/pdfdocs/cbaManual.pdf
http://www.usm.maine.edu/~rbrown/Web-Pages/CBM_ReadingPP/CBM-Reading.html
References
Chafouleas, S.M., Riley-Tillman, T.C., & McGrath, M.C. (2002). Making successful intervention decisions through testing intervention packages: A manual for conducting brief experimental analysis (BEA).
Chomsky, C. (1978). When you still can’t read in third grade: After decoding, what? In S.J. Samuels (Ed.), What research has to say about reading instruction (pp. 13-30). Newark, DE: International Reading Association.
Cook, S.B., Scruggs, T.E., Mastropieri, M.A., & Castro, G.C. (1986). Handicapped students as tutors. The Journal of Special Education, 19(4), 483-492.
Daly, E.J.,III, Witt, J.C., Martens, B.K., & Dool, E.J. (1997). A model for conducting a functional analysis of academic performance problems. School Psychology Review, 26, 554-574.
Fuchs, L. & Fuchs, D. (2004). Peer-assisted learning strategies: Accelerating growth in reading and mathematics. Communiqué (insert). Bethesda, MD: National Association of School Psychologists.
References Cont…
Garcia-Vazquez, E. & Ehly, S. (1995). Best practices for facilitating peer tutoring programs. In A. Thomas and J. Grimes (Eds.), Best Practices in School Psychology- III (pp. 403-411). Washington, DC: National Association of School Psychologists.
Gravois, T.A., & Gickling, E.E. 2002)Best Practices in Curriculum Based Assessment. Best Practices in School Psychology IV,56,885-898.
Haring, N.G., Lovitt, T.C., Eaton, M.D., & Hansen, C.L. (1978). The fourth R: Research in the classroom. Columbus, OH: Merrill.
Howell, K.W., Kurns, S., & Antil, L. 2002)Best Practices in Using Curriculum Based Evaluation. Best Practices in School Psychology IV,48,753-771.
References Cont…
Jacobson, J., Thrope, L., & Fisher, D. Cross-age tutoring: A literacy improvement approach for struggling adolescent readers. Journal of Adolescent and Adult Literacy, 44(6), 528-536. Retrieved on March 27, 2004 HW Wilson.
Levin, H., Glass, G., & Meister, C. (1984). Cost effectiveness of four educational Interventions. Stanford, CA: Institute for Research on Educational Finance and Governance, Stanford University.
Mercer, C.D. & Mercer, A.R. (2001). Teaching students with learning problems (6th Ed.). Columbus, OH: Merrill Prentice Hall.
References Cont…
National Reading Panel. (2000). Teaching children to read: An evidence based assessment of the scientific research literature on reading and its implications for reading instruction. Reports of the Subgroups. Washington DC: National Institute of Child Health and Human Development.
Schreiber, P.A. (1987). Prosody and structure in children’s syntactic processing. In R.Horowitz & S.J. Samuels (Eds.), Comprehending oral and written language (pp. 243-270. New York: Academic Press.
Shinn Mark. R.(2002)Best Practices in Using Curriculum Based Measurement in a Problem Solving Model. Best Practices in School Psychology IV,44,371-397.
Thrope, L., & Wood, K. (2000). Cross-age tutoring for young adolescents. The Clearing House, 73(4), 239-243. Retrieved March 27, 2004 from ProQuest.
References Cont…
Worthy, J. & Broaddus, K. (2001). Fluency beyond the primary grades: From group performance to silent, independent reading. Reading Teacher, 55(4), pp. 334-344. Retrieved March 11, 2005 from EbscoHost.
Wright, J. (2004). Curriculum based measurement: A manual for teachers. Retrieved on February 14, 2005 from www.interventioncentral.org