rti dl release - ehp · the data that you supply will be treated as confidential and used in...
TRANSCRIPT

Dear .__________
As required under Chapter 7 of the Waste Reduction and Recycling Act 2011 (WRR Act),
the Department of Environment and Heritage Protection (EHP) is preparing to collect
waste and recycling data for the 2012-13 financial year.
Sections 150 to 153 of the WRR Act and sections 40(a) and 44 of the Waste Reduction
and Recycling Regulation 2011 require composters and soil conditioners to supply waste and recycling data in the approved form to EHP by 31 August each year.
Completing and returning the attached survey by August 31, 2013 will meet your
reporting obligation. The survey is similar to one you may have completed last year. It
seeks details of your facility (please complete a separate worksheet if you have more
than one facility), waste materials received, products generated and materials sent for
disposal. It will also provide the opportunity for feedback on issues that concern you (for
example, difficulties accessing feedstock or contamination in source materials).
The data that you supply will be treated as confidential and used in aggregated form in
the development of priorities for the new industry-led waste strategy, as well as for the
information of the public and other interested parties. The data received will also
contribute to the 2013 State of Waste and Recycling in Queensland report. (The 2012 report is available at http://www.ehp.qld.gov.au/waste/pdf/state-of-waste-recycling-report.pdf). Aggregated data will also be provided to the Australian Government to meet
Queensland’s obligations under the National Waste Policy.
Given the importance of good quality data to the Queensland Government, I thank you
for taking the time to participate in the survey. Please complete and return the survey to
Dr Laurence Knight ([email protected]) by 31 August 2013. Should you have any queries, please liaise with Laurence (ph 07 3330 5033).
Sincerely,
Elisa Nichols
A/Executive Director, Reform and Innovation
RTI DL R
ELEASE - E
HP
13-033 File B. 1 of 124

1 Business name
2 Postal address
3 Facility address
4 Contact person
5 Phone number
6 Email address
7 Which of the following best describes your facility?
Licensed commercial facility
On farm facility
Council facility
Other (please specify)
8
Shredding and screening
Vermiculture
Manure aging
Direct Land application
Rendering
Aerobic composting
Anaerobic digestion
Other (please specify)
9
Received from local government
Received from other sources
Green/garden waste (vegetation & other organic waste from gardens etc)
Timber, wood or sawdust arising from sawmills or other industrial sources
Forestry residuals
Biosolids (dry solids equivalent)
Grease trap waste & other organic sludges
Waste food
Abattoir waste
Food processing waste
Agricultural residuals
Other municipal solid waste (MSW)
Other (please specify)
10
Composted soil conditioners
Pasteurised soil conditioners
Composted mulches
Pasteurised mulches
Raw mulches
Playground surfacing
Manufactured soils
Potting mixes
Composted manure
Raw manure
Direct land application
Other (please specify)
Survey of composters in Queensland (Data for the period 1 July 2011 - 30 June 2012)
All data provided will be treated as confidential and used to support EHP's waste policy formulation and environmental reporting
Please fill in your responses in the answer boxes
Please indicate which of the following processes are undertaken at your facility. Please note that you can select multiple options.
Facility details
What amount of the following materials were processed in your facility in 2011-12? Please specify the amounts by weight (tonnes).
What amounts of the following products were produced by your facility in 201112? Please indicate units of measurement (e.g. tonnes or cubic metres).
RTI DL R
ELEASE - E
HP
13-033 File B. 2 of 124

11
12
13 Please enter the date you completed the survey in the following format (DD/MM/YYYY).
Please describe and provide the amounts of materials sent from your facility to waste treatment or disposal.
Please discuss any waste issues you would like to report to EHP. (For example, there has been a spike in a particular waste stream or you may wish to clarify one or more of your responses.)
RTI DL R
ELEASE - E
HP
13-033 File B. 3 of 124

Dear .__________
As required under Chapter 7 of the Waste Reduction and Recycling Act 2011 (WRR Act),
the Department of Environment and Heritage Protection (EHP) is preparing to collect
waste and recycling data for the 2012-13 financial year.
Sections 150 to 153 of the WRR Act and sections 40, 41 and 44 of the Waste Reduction
and Recycling Regulation 2011 require incinerator operators to supply waste and recycling data in the required form to EHP by 31 August each year.
Completing and returning the attached survey by August 31, 2013 will meet your
reporting obligation. The survey is similar to one you may have completed last year. It
seeks details of your facility and the waste materials incinerated. It will also provide the opportunity for feedback on issues that concern you.
The data that you supply will be treated as confidential and used in aggregated form in
the development of priorities for the new industry-led waste strategy, as well as for the
information of the public and other interested parties. The data received will also
contribute to the 2013 State of Waste and Recycling in Queensland report. (The 2012 report is available at http://www.ehp.qld.gov.au/waste/pdf/state-of-waste-recycling-report.pdf). Aggregated data will also be provided to the Australian Government to meet Queensland’s obligations under the National Waste Policy.
Given the importance of good quality data to the Queensland Government, I thank you
for taking the time to participate in the survey. Please complete and return the survey to
Dr Laurence Knight ([email protected]) by 31 August 2013. Should you have any queries, please liaise with Laurence (ph 07 3330 5033).
Sincerely,
Elisa Nichols
Executive Director, Reform and Innovation
RTI DL R
ELEASE - E
HP
13-033 File B. 4 of 124

Quantity incinerated (tonnes)
Facility address
Thank you for your time and effort in completing this questionnaire
Feedback
Quarantine waste
Pharmaceutical waste
Other wastes [please specify]
Are there any waste-related issues that you would like to report to DERM?
Please return the filled in questionnaire to Laurence Knight at [email protected] or Waste Policy and Legislation, Department of Environment and Heritage Protection, GPO Box 2454, Brisbane 4001
Survey of incinerator operators in Queensland (Data for the period 1 July 2012 - 30 June 2013)
All data provided will be treated as confidential and used to support the EHP's waste policy formulation and environmental reporting
Please fill in your responses in the answer boxes
Name of the business
Postal address
ABN/ACN
Wastes Incinerated
1Commercial & Industrial waste includes materials from schools, restaurants, offices, retail and wholesale businesses, and manufacturing industries. Materials that are defined to be regulated waste by Schedule 7 of the Environmental Protection Regulation 1998 (e.g. tyres, batteries and food processing waste) should be reported separately.
Contact person
Phone number(s)
Email address
Type of waste
Commercial & industrial waste1
Clinical waste
RTI DL R
ELEASE - E
HP
13-033 File B. 5 of 124

?
?
Quantity incinerated (tonnes)
Facility address
Thank you for your time and effort in completing this questionnaire
Feedback
Quarantine waste
Pharmaceutical waste
Other wastes [please specify]
Are there any waste-related issues that you would like to report to EHP?
Please return the filled in questionnaire to Laurence Knight at [email protected] or Waste
Policy and Legislation, Department of Environment and Heritage Protection, GPO Box 2454, Brisbane 4001
Survey of incinerator operators in Queensland (Data for the period 1 July 2012 - 30 June 2013)
All data provided will be treated as confidential and used to support the Department of Environmet
and Heritage Progection's waste policy formulation and environmental reporting
Please fill in your responses in the answer boxes
Name of the business
Postal address
ABN/ACN
Wastes Incinerated
1Commercial & Industrial waste includes materials from schools, restaurants, offices, retail and wholesale businesses, and manufacturing industries. Materials that are defined to be regulated waste by Schedule 7 of the Environmental Protection Regulation
1998 (e.g. tyres, batteries and food processing waste) should be reported separately.
Contact person
Phone number(s)
Email address
Type of waste
Commercial & industrial waste1
Clinical waste
RTI DL R
ELEASE - E
HP
13-033 File B. 6 of 124

Dear .__________
As required under Chapter 7 of the Waste Reduction and Recycling Act 2011 (WRR Act),
the Department of Environment and Heritage Protection (EHP) is preparing to collect waste and recycling data for the 2012-13 financial year.
As was the case last year, EHP is collecting data from the operators of industrial waste
facilities via an online survey. Please navigate to
https://www.surveymonkey.com/s/ZQ8BZ6N to enter your data by 31 August 2013.
I have attached a read-only pdf version of the questionnaire to help you to complete the
survey. It will enable you to examine the questions before you go online and to resolve
any uncertainties or ambiguities. The online version will differ from the pdf in that the
questions relating to wastes generated by other companies will only appear if you
indicated that your facility received materials from other entities (Q5).
The data that you supply will be treated as confidential and used in aggregated form in
the development of priorities for the new industry-led waste strategy, as well as for the
information of the public and other interested parties. The data received will also
contribute to the 2013 State of Waste and Recycling in Queensland report. (The 2012
report is available at http://www.ehp.qld.gov.au/waste/pdf/state-of-waste-recycling-
report.pdf). Aggregated data will also be provided to the Australian Government to meet Queensland’s obligations under the National Waste Policy.
Given the importance of good quality data to the Queensland Government, I thank you
for taking the time to participate in the survey. Please complete the survey by 31 August
2013. Should you have any queries, please liaise with Laurence (ph 07 3330 5033).
Sincerely,
Elisa Nichols
Executive Director, Reform and Innovation
RTI DL R
ELEASE - E
HP
13-033 File B. 7 of 124

?
?
1 Name of the business
2 Facility address
3
Licensed commercial facility
On farm facility
Council facility
Other (please specify)
4 Does this facility have a weighbridge?
5
Shredding and screening
Vermiculture
Manure aging
Direct Land application
Rendering
Aerobic composting
Anaerobic digestion
Other (please specify)
6
Received from local
government
Received from other
sourcesGreen/garden waste (vegetation & other organic waste from gardens etc)Timber, wood or sawdust arising from sawmills or other industrial sources
Forestry residuals
Biosolids (dry solids equivalent)
Grease trap waste & other organic sludges
Waste food
Abattoir waste
Food processing waste
Agricultural residuals
Other municipal solid waste (MSW)
Other general waste (C&I)
Other (please specify)
7
Amount produced
(tonnes or cubic metres) Average density (kg/m3)
Composted soil conditioners
Pasteurised soil conditioners
Other soil conditioners
Composted mulches
Pasteurised mulches
Raw mulches
Playground surfacing
Manufactured soils
Potting mixes
Composted manure
Raw manure
Direct land application
Other (please specify)
8
9
Suggested volume to weight conversion factorsMixed garden waste (uncompacted):. 247 kg/m3 Mixed garden waste (compacted):.... 460 kg/m3
Please discuss any waste issues you would like to report to EHP. (For example, there has
been a spike in a particular waste stream or you may wish to clarify one or more of your
Please indicate which of the following processes are undertaken
at the facility. Please note that you can select multiple options.
Which of the following best describes the facility?
What amount of the following materials were processed in the facility in 2012-13? Please
specify the amounts by weight (tonnes).
Products generated by the facility in 2012-13
Uncompacted municipal solid waste:. 133 kg/m3 <br>
Wood scrap (loose):......................... 195 kg/m3 Saw dust (loose): ............................ 222 kg/m3
Wet biosolids:.................................. 721 kg/m3 Dry biosolids:................................... 560 kg/m3 Grease trap waste ........................... 946 kg/m3 Sullage ........................................... 983 kg/m3
Wood chips: .................................... 297 kg/m3
Manure: .......................................... 400 kg/m3 Straw (loose): ................................... 48 kg/m3 Hay (loose): ...................................... 80 kg/m3 Straw/hay (baled): ........................... 384 kg/m3 <br>
see http://www.onlineconversion.com/weight_volume_cooking.htm
Please describe and provide the amounts of materials sent from your facility to waste
treatment or disposal.
Survey of composters and other organic processors in
Queensland (Data for the period 1 July 2012 - 30 June 2013)
All data provided will be treated as confidential and used to support EHP's waste policy formulation and environmental reporting
Facility details
Please fill in your responses in the answer boxes. Please complete a separate worksheet for each facility if you operate more than one
RTI DL R
ELEASE - E
HP
13-033 File B. 8 of 124

?
?
1 Name of the business
2 Facility address
3
Licensed commercial facility
On farm facility
Council facility
Other (please specify)
4 Does this facility have a weighbridge?
5
Shredding and screening
Vermiculture
Manure aging
Direct Land application
Rendering
Aerobic composting
Anaerobic digestion
Other (please specify)
6
Received from local
government
Received from other
sourcesGreen/garden waste (vegetation & other organic waste from gardens etc)Timber, wood or sawdust arising from sawmills or other industrial sources
Forestry residuals
Biosolids (dry solids equivalent)
Grease trap waste & other organic sludges
Waste food
Abattoir waste
Food processing waste
Agricultural residuals
Other municipal solid waste (MSW)
Other general waste (C&I)
Other (please specify)
7
Amount produced
(tonnes or cubic metres) Average density (kg/m3)
Composted soil conditioners
Pasteurised soil conditioners
Other soil conditioners
Composted mulches
Pasteurised mulches
Raw mulches
Playground surfacing
Manufactured soils
Potting mixes
Composted manure
Raw manure
Direct land application
Other (please specify)
8
9
Which of the following best describes the facility?
Please indicate which of the following processes are undertaken
at the facility. Please note that you can select multiple options.
What amount of the following materials were processed in the facility in 2012-13? Please
specify the amounts by weight (tonnes).
Products generated by the facility in 2012-13
Wood chips: .................................... 297 kg/m3
Manure: .......................................... 400 kg/m3 Straw (loose): ................................... 48 kg/m3 Hay (loose): ...................................... 80 kg/m3 Straw/hay (baled): ........................... 384 kg/m3 <br>
see http://www.onlineconversion.com/weight_volume_cooking.htm
Suggested volume to weight conversion factorsMixed garden waste (uncompacted):. 247 kg/m3 Mixed garden waste (compacted):.... 460 kg/m3
Survey of composters and other organic processors in
Queensland (Data for the period 1 July 2012 - 30 June 2013)
All data provided will be treated as confidential and used to support EHP's waste policy formulation and environmental reporting
Facility details
Please fill in your responses in the answer boxes. Please complete a separate worksheet for each facility if you operate more than one
Please describe and provide the amounts of materials sent from your facility to waste
treatment or disposal.
Uncompacted municipal solid waste:. 133 kg/m3 <br>
Wood scrap (loose):......................... 195 kg/m3 Saw dust (loose): ............................ 222 kg/m3
Wet biosolids:.................................. 721 kg/m3 Dry biosolids:................................... 560 kg/m3 Grease trap waste ........................... 946 kg/m3 Sullage ........................................... 983 kg/m3
Please discuss any waste issues you would like to report to EHP. (For example, there has
been a spike in a particular waste stream or you may wish to clarify one or more of your
RTI DL R
ELEASE - E
HP
13-033 File B. 9 of 124

?
?
1 Name of the business
2 Facility address
3
Licensed commercial facility
On farm facility
Council facility
Other (please specify)
4 Does this facility have a weighbridge?
5
Shredding and screening
Vermiculture
Manure aging
Direct Land application
Rendering
Aerobic composting
Anaerobic digestion
Other (please specify)
6
Received from local
government
Received from other
sourcesGreen/garden waste (vegetation & other organic waste from gardens etc)Timber, wood or sawdust arising from sawmills or other industrial sources
Forestry residuals
Biosolids (dry solids equivalent)
Grease trap waste & other organic sludges
Waste food
Abattoir waste
Food processing waste
Agricultural residuals
Other municipal solid waste (MSW)
Other general waste (C&I)
Other (please specify)
7
Amount produced
(tonnes or cubic metres) Average density (kg/m3)
Composted soil conditioners
Pasteurised soil conditioners
Other soil conditioners
Composted mulches
Pasteurised mulches
Raw mulches
Playground surfacing
Manufactured soils
Potting mixes
Composted manure
Raw manure
Direct land application
Other (please specify)
8
9
Uncompacted municipal solid waste:. 133 kg/m3 <br>
Wood scrap (loose):......................... 195 kg/m3 Saw dust (loose): ............................ 222 kg/m3
Which of the following best describes the facility?
Please indicate which of the following processes are undertaken
at the facility. Please note that you can select multiple options.
Please fill in your responses in the answer boxes. Please complete a separate worksheet for each facility if you operate more than one
Please discuss any waste issues you would like to report to EHP. (For example, there has
been a spike in a particular waste stream or you may wish to clarify one or more of your
Suggested volume to weight conversion factorsMixed garden waste (uncompacted):. 247 kg/m3 Mixed garden waste (compacted):.... 460 kg/m3
Products generated by the facility in 2012-13
Please describe and provide the amounts of materials sent from your facility to waste
treatment or disposal.
Wet biosolids:.................................. 721 kg/m3 Dry biosolids:................................... 560 kg/m3 Grease trap waste ........................... 946 kg/m3 Sullage ........................................... 983 kg/m3
Wood chips: .................................... 297 kg/m3
Manure: .......................................... 400 kg/m3 Straw (loose): ................................... 48 kg/m3 Hay (loose): ...................................... 80 kg/m3 Straw/hay (baled): ........................... 384 kg/m3 <br>
see http://www.onlineconversion.com/weight_volume_cooking.htm
Survey of composters and other organic processors in
Queensland (Data for the period 1 July 2012 - 30 June 2013)
All data provided will be treated as confidential and used to support EHP's waste policy formulation and environmental reporting
Facility details
What amount of the following materials were processed in the facility in 2012-13? Please
specify the amounts by weight (tonnes).
RTI DL R
ELEASE - E
HP
13-033 File B. 10 of 124

?
?
1 Name of the business
2 Facility address
3
Licensed commercial facility
On farm facility
Council facility
Other (please specify)
4 Does this facility have a weighbridge?
5
Shredding and screening
Vermiculture
Manure aging
Direct Land application
Rendering
Aerobic composting
Anaerobic digestion
Other (please specify)
6
Received from local
government
Received from other
sources
Green/garden waste (vegetation & other organic waste from gardens etc)Timber, wood or sawdust arising from sawmills or other industrial sources
Forestry residuals
Biosolids (dry solids equivalent)
Grease trap waste & other organic sludges
Waste food
Abattoir waste
Food processing waste
Agricultural residuals
Other municipal solid waste (MSW)
Other general waste (C&I)
Other (please specify)
7
Amount produced
(tonnes or cubic metres) Average density (kg/m3)
Composted soil conditioners
Pasteurised soil conditioners
Other soil conditioners
Composted mulches
Pasteurised mulches
Raw mulches
Playground surfacing
Manufactured soils
Potting mixes
Composted manure
Raw manure
Direct land application
Other (please specify)
8
9
Manure: .......................................... 400 kg/m3 Straw (loose): ................................... 48 kg/m3 Hay (loose): ...................................... 80 kg/m3 Straw/hay (baled): ........................... 384 kg/m3 <br>
Uncompacted municipal solid waste:. 133 kg/m3 <br>
Please discuss any waste issues you would like to report to EHP. (For example, there has
been a spike in a particular waste stream or you may wish to clarify one or more of your
Products generated by the facility in 2012-13
Please describe and provide the amounts of materials sent from your facility to waste
treatment or disposal.
Grease trap waste ........................... 946 kg/m3 Sullage ........................................... 983 kg/m3
see http://www.onlineconversion.com/weight_volume_cooking.htm
Wet biosolids:.................................. 721 kg/m3 Dry biosolids:................................... 560 kg/m3
Suggested volume to weight conversion factors
Wood scrap (loose):......................... 195 kg/m3 Saw dust (loose): ............................ 222 kg/m3
Wood chips: .................................... 297 kg/m3
Mixed garden waste (uncompacted):. 247 kg/m3 Mixed garden waste (compacted):.... 460 kg/m3
What amount of the following materials were processed in the facility in 2012-13? Please
specify the amounts by weight (tonnes).
Please indicate which of the following processes are undertaken
at the facility. Please note that you can select multiple options.
Which of the following best describes the facility?
Survey of composters and other organic processors in
Queensland (Data for the period 1 July 2012 - 30 June 2013)
All data provided will be treated as confidential and used to support EHP's waste policy formulation and environmental reporting
Facility details
Please fill in your responses in the answer boxes. Please complete a separate worksheet for each facility if you operate more than one
RTI DL R
ELEASE - E
HP
13-033 File B. 11 of 124

?
?
1 Name of the business (please include
trading names and other aliases)
2 ABN/ACN
3 Postal address
4 Facility address
5 Contact person
6 Position
7 Phone number
8 Email address
9
Licensed commercial facility
On farm facility
Council facility
Other (please specify)
10 Does this facility have a weighbridge?
11
Shredding and screening
Vermiculture
Manure aging
Direct Land application
Rendering
Aerobic composting
Anaerobic digestion
Other (please specify)
12
Received from local
government
Received from other
sources
Green/garden waste (vegetation & other organic waste from gardens etc)
Timber, wood or sawdust arising from sawmills or other industrial sources
Forestry residuals
Biosolids (dry solids equivalent)
Grease trap waste & other organic sludges
Waste food
Abattoir waste
Food processing waste
Agricultural residuals
Other municipal solid waste (MSW)
Other general waste (C&I)
Other (please specify)
13
Amount produced
(tonnes or cubic metres)
Average density
(kg/m3)
Composted soil conditioners
Pasteurised soil conditioners
Other soil conditioners
Composted mulches
Pasteurised mulches
Raw mulches
Playground surfacing
Manufactured soils
Potting mixes
Composted manure
Raw manure
Direct land application
Other (please specify)
14
15
Please return the filled in questionnaire to Laurence Knight at [email protected] or
Environmental Policy and Planning Division, Department of Environment and Heritage Protection,
GPO Box 2454, Brisbane 4001
Thank you for your time and effort in completing this questionnaire
Which of the following best describes your facility?
Please indicate which of the following processes are undertaken
at your facility. Please note that you can select multiple options.
Please discuss any waste issues you would like to report to EHP. (For example, there has
been a spike in a particular waste stream, there barriers to resource recovery that you
would like addressed, or you may wish to clarify one or more of your responses.)
Uncompacted municipal solid waste:. 133 kg/m3
Wood scrap (loose):......................... 195 kg/m3 Saw dust (loose): ............................ 222 kg/m3
Wet biosolids:.................................. 721 kg/m3 Dry biosolids:................................... 560 kg/m3 Grease trap waste ........................... 946 kg/m3 Sullage ........................................... 983 kg/m3
Wood chips: .................................... 297 kg/m3
Manure: .......................................... 400 kg/m3 Straw (loose): ................................... 48 kg/m3 Hay (loose): ...................................... 80 kg/m3 Straw/hay (baled): ........................... 384 kg/m3
see http://www.onlineconversion.com/weight_volume_cooking.htm
Suggested volume to weight conversion factors
Mixed garden waste (uncompacted):. 247 kg/m3 Mixed garden waste (compacted):.... 460 kg/m3
What amount of the following materials were processed in your facility in 2012-13? Please
specify the amounts by weight (tonnes).
Survey of composters and other organic processors in
Queensland (Data for the period 1 July 2012 - 30 June 2013)
All data provided will be treated as confidential and used to support EHP's waste policy formulation and environmental reportingPlease fill in your responses in the answer boxes. Please complete a separate worksheet for each facility if you operate more than one
Products generated by your facility in 2012-13
Please describe and provide the amounts of materials sent from your facility to waste
treatment or disposal.
Facility details
RTI DL R
ELEASE - E
HP
13-033 File B. 12 of 124

Page 1
All data provided will be treated as confidential and used to support the Department of Environment and Heritage Protection's waste policy formulation and environmental reporting. Instructions You will need to complete the survey in one sitting. Please complete every relevant section of the survey before submitting. Navigate through the survey by clicking on the "Prev" and "Next" buttons at the bottom of the screen. If your organisation operates multiple waste disposal facilities (with ERA 60 licences) at geographically separated locations, please submit a separate report for each facility. The survey will loop you back to the beginning after you hit submit to facilitate this. Questions denoted with an asterix * must be completed. Please note that Question 5 has skip logic, and that the numbering of subequent questions will vary depending on how you answer it. Please provide a response in the appropriate numeric or text format. The preferred unit for materials in this survey is weight (tonnes). However, if the weight is not available you can provide a volume measure as an alternative. Thank you for taking the time to complete the survey. If you have any difficulties filling in this survey or need to clarify any questions, please contact Laurence Knight (ph 3330 5033, email [email protected] ) or Col Tucker (ph 3330 5043, email [email protected]).
Waste Disposal Activities over the period 1 July 2012 30 June 2013
RTI DL R
ELEASE - E
HP
13-033 File B. 13 of 124

Page 2
1. Please enter the name of your company.
2. Please enter the location details of the waste disposal facility (preferably "street address").
3. Please enter the contact details of a person able to provide further details in relation to this report.
Company Details
*
*
55
66
*
Name
Position
Phone numbers (landline and mobile if available)
Email address
RTI DL R
ELEASE - E
HP
13-033 File B. 14 of 124

Page 3
This section deals with wastes generated by the company and disposed of in the corporate facility.
4. Please supply details of wastes generated by the company that were disposed of in the waste disposal facility during the 201213 financial year. Please indicate units of measurement for each waste (e.g. tonnes or cubic metres).
5. Were wastes from other companies/entities placed in the waste disposal facility?
Wastes Placed in the Waste Disposal Facility.
*
Ash
Red mud
Other regulated process wastes
Asbestos
Other regulated wastes
Construction & demolition waste
Clean fill
Other general (nonregulated) wastes
*
Yes
nmlkj
No
nmlkj
RTI DL R
ELEASE - E
HP
13-033 File B. 15 of 124

Page 4
This section deals with wastes that were generated by other companies/entities and disposed of in the waste facility.
6. Please supply details of the other companies/entities generating the wastes disposed of in the waste facility.
7. Please supply details of wastes generated by other companies that were disposed of in the waste disposal facility during the 201213 financial year. Please indicate units of measurement for each waste (e.g. tonnes or cubic metres).
Wastes Generated by Other Companies
55
66
Ash
Red mud
Other regulated process wastes
Asbestos
Other regulated wastes
Construction & demolition waste
Clean fill
Other general (nonregulated) wastes
RTI DL R
ELEASE - E
HP
13-033 File B. 16 of 124

Page 5
This section deals with wastes that were generated by the facility and sent offsite for landfill disposal. 8. Please supply the names and addresses of the external facilities receiving waste for disposal.
9. Please supply details (types and amounts) of the wastes sent to external facilities for disposal.
Wastes disposed of in external landfills
Facility 1
Facility 2
Facility 3
Facility 4
Facility 5
Facility 6
Ash
Red mud
Other regulated process wastes
Asbestos
Other regulated wastes
Construction & demolition waste
Clean fill
Other general (nonregulated) wastes
RTI DL R
ELEASE - E
HP
13-033 File B. 17 of 124

Page 6
This section deals with wastes generated by the facility that were recycled or reprocessed. 10. Please supply details of the amounts of wastes that were recycled internally (that is fed back into the processes that generated them, or used as inputs for other processes undertaken at the facility).
11. Please supply the names and addresses of the external facilities receiving waste for recycling or reprocessing.
12. Please supply the amounts of wastes that were sent for recycling or reprocessing at another facility (e.g. as an input in another process).
Wastes Diverted from Disposal
Ash
Red mud
Other regulated process wastes
Other regulated wastes
Construction & demolition waste
Clean fill
Other general (nonregulated) wastes
Facility 1
Facility 2
Facility 3
Facility 4
Facility 5
Facility 6
Ash
Red mud
Other regulated process wastes
Other regulated wastes
Construction & demolition waste
Clean fill
Other general (nonregulated) wastes
RTI DL R
ELEASE - E
HP
13-033 File B. 18 of 124

Page 7
13. Are there any further comments you would like to make, or queries that you would like to raise with EHP?
14. If you have completed the survey please enter the date in the following format (DD/MM/YYYY).
Thank you for completing the survey. Should you require any further information, please contact Laurence Knight (ph 3330 5033, email [email protected]).
Conclusion
55
66
RTI DL R
ELEASE - E
HP
13-033 File B. 19 of 124

Page 1
Waste Disposal Facility Report 2011-12Waste Disposal Facility Report 2011-12Waste Disposal Facility Report 2011-12Waste Disposal Facility Report 2011-12
All data provided will be treated as confidential and used to support DEHP's waste policy formulation and environmental reporting. Instructions You will need to complete the survey in one sitting. Please complete every relevant section of the survey before submitting. Navigate through the survey by clicking on the "Prev" and "Next" buttons at the bottom of the screen. If your organisation operates multiple waste disposal facilities (with ERA 60 licences) at geographically separated locations, please submit a separate report for each facility. The survey will loop you back to the beginning after you hit submit to facilitate this. Questions denoted with an asterix * must be completed. Please note that Question 5 has skip logic, and that the numbering of subequent questions will vary depending on how you answer it. Please provide a response in the appropriate numeric or text format. The preferred unit for materials in this survey is weight (tonnes). However, if the weight is not available you can provide a volume measure as an alternative. Thank you for taking the time to complete the survey. If you have any difficulties filling in this survey or need to clarify any questions, please contact Laurence Knight (ph 3339 5816, email [email protected] ) or Glenn Ellis (ph 3339 5808, email [email protected]).
Waste Disposal Activities over the period 1 July 2011 30 June 2012
RTI DL R
ELEASE - E
HP
13-033 File B. 20 of 124
Page 2
Waste Disposal Facility Report 2011-12Waste Disposal Facility Report 2011-12Waste Disposal Facility Report 2011-12Waste Disposal Facility Report 2011-12
1. Please enter the name of your company.
2. Please enter the location details of the waste disposal facility (preferably "street address").
3. Please enter the contact details of a person able to provide further details in relation to this report.
Company Details
*
*
55
66
*
Name
Position
Phone numbers (landline and mobile if available)
Email address
RTI DL R
ELEASE - E
HP
13-033 File B. 21 of 124

Page 3
Waste Disposal Facility Report 2011-12Waste Disposal Facility Report 2011-12Waste Disposal Facility Report 2011-12Waste Disposal Facility Report 2011-12
This section deals with wastes generated by the company and disposed of in the corporate facility.
4. Please supply details of wastes generated by the company that were disposed of in the waste disposal facility during the 201112 financial year. Please indicate units of measurement for each waste (e.g. tonnes or cubic metres).
5. Were wastes from other companies/entities placed in the waste disposal facility?
Wastes Placed in the Waste Disposal Facility.
*
Ash
Red mud
Other regulated process wastes
Asbestos
Other regulated wastes
Construction & demolition waste
Clean fill
Other general (nonregulated) wastes
*
Yes
nmlkj
No
nmlkj
RTI DL R
ELEASE - E
HP
13-033 File B. 22 of 124

Page 4
Waste Disposal Facility Report 2011-12Waste Disposal Facility Report 2011-12Waste Disposal Facility Report 2011-12Waste Disposal Facility Report 2011-12
This section deals with wastes that were generated by other companies/entities and disposed of in the waste facility.
6. Please supply details of the other companies/entities generating the wastes disposed of in the waste facility.
7. Please supply details of wastes generated by other companies that were disposed of in the waste disposal facility during the 201112 financial year. Please indicate units of measurement for each waste (e.g. tonnes or cubic metres).
Wastes Generated by Other Companies
55
66
Ash
Red mud
Other regulated process wastes
Asbestos
Other regulated wastes
Construction & demolition waste
Clean fill
Other general (nonregulated) wastes
RTI DL R
ELEASE - E
HP
13-033 File B. 23 of 124

Page 5
Waste Disposal Facility Report 2011-12Waste Disposal Facility Report 2011-12Waste Disposal Facility Report 2011-12Waste Disposal Facility Report 2011-12
This section deals with wastes that were generated by the facility and sent offsite for landfill disposal. 8. Please supply the names and addresses of the external facilities receiving waste for disposal.
9. Please supply details (types and amounts) of the wastes sent to external facilities for disposal.
Wastes disposed of in external landfills
Facility 1
Facility 2
Facility 3
Facility 4
Facility 5
Facility 6
Ash
Red mud
Other regulated process wastes
Asbestos
Other regulated wastes
Construction & demolition waste
Clean fill
Other general (nonregulated) wastes
RTI DL R
ELEASE - E
HP
13-033 File B. 24 of 124

Page 6
Waste Disposal Facility Report 2011-12Waste Disposal Facility Report 2011-12Waste Disposal Facility Report 2011-12Waste Disposal Facility Report 2011-12
This section deals with wastes generated by the facility that were recycled or reprocessed. 10. Please supply details of the amounts of wastes that were recycled internally (that is fed back into the processes that generated them, or used as inputs for other processes undertaken at the facility).
11. Please supply the names and addresses of the external facilities receiving waste for recycling or reprocessing.
12. Please supply the amounts of wastes that were sent for recycling or reprocessing at another facility (e.g. as an input in another process).
Wastes Diverted from Disposal
Ash
Red mud
Other regulated process wastes
Other regulated wastes
Construction & demolition waste
Clean fill
Other general (nonregulated) wastes
Facility 1
Facility 2
Facility 3
Facility 4
Facility 5
Facility 6
Ash
Red mud
Other regulated process wastes
Other regulated wastes
Construction & demolition waste
Clean fill
Other general (nonregulated) wastes
RTI DL R
ELEASE - E
HP
13-033 File B. 25 of 124

Page 7
Waste Disposal Facility Report 2011-12Waste Disposal Facility Report 2011-12Waste Disposal Facility Report 2011-12Waste Disposal Facility Report 2011-12
13. Are there any further comments you would like to make, or queries that you would like to raise with EHP?
14. If you have completed the survey please enter the date in the following format (DD/MM/YYYY).
Thank you for completing the survey. Should you require any further information, please contact Laurence Knight (ph 3339 5816, email [email protected]).
Conclusion
55
66
RTI DL R
ELEASE - E
HP
13-033 File B. 26 of 124

Dear ___________,
As required under Chapter 7 of the Waste Reduction and Recycling Act 2011 (WRR Act),
the Department of Environment and Heritage Protection (EHP) is preparing to collect waste and recycling data for the 2012-13 financial year.
Sections 151 and 152 of the WRR Act and section 40(c) of the Waste Reduction and
Recycling Regulation 2011 require landfill operators to supply waste and recycling data in
the approved form to EHP by 31 August each year.
Completing and returning the attached survey by August 31, 2013 will meet your
reporting obligation. It deals with matters that are not covered by the summary return
process in QWOLS.
The data that you supply will be treated as confidential and used to inform the new
industry-led waste strategy, as well as the public and other stakeholders. (It will
contribute to the 2013 State of Waste and Recycling in Queensland report. The 2012
report is available at http://www.ehp.qld.gov.au/waste/pdf/state-of-waste-recycling-report.pdf).
Given the importance of good quality data, I thank you for taking the time to participate
in the survey. Please complete and return the survey to Dr. Laurence Knight
([email protected]) by 31 August 2013. Should you have any queries, please liaise with Laurence (ph 07 3330 5033).
Sincerely,
Elisa Nichols
A/Executive Director, Reform and Innovation
RTI DL R
ELEASE - E
HP
13-033 File B. 27 of 124

?
?
1 Business name
2 Postal address
3 Facility address
4 Contact person
5 Phone number
6 Email address
7
8
Type of waste
Quantity received
from local
government
(tonnes)
Quantity received
from business /
other (tonnes)
Quantity
landfilled
(tonnes)
Quantity
recovered,
recycled or
reused
(tonnes)
9 Household waste
10Non-regulated Commercial & Industrial waste
11 Construction & Demolition waste
12 Green waste
13 Biosolids
14 Clean fill
15 Contaminated soil
16 Acid Sulfate soil
17 Asbestos
18 Tyres
19 Recycling residuals
20 Other (please specify)
Recycling residuals are the residues from recycling activites. Shredder flock is the residue from scrap metal shredding.
21
Are there any waste-related issues that you would like to report to EHP?
Facility details
Survey of private landfill operators in Queensland (Data for the period 1 July 2011 - 30 June 2012)
All data provided will be treated as confidential and used to support EHP's waste policy formulation and environmental reportingPlease fill in your responses in the answer boxes
If yes, what is the current operating
efficiency of the landfill gas capture
system?
Waste details
Details of materials recovered (e.g. cardboard, concrete, timber)
and where used / sent Volume to weight conversion factors
Does the facility have a functioning
landfill gas capture system?
General C&D average:.. 960 kg/m3 Wood scrap (loose):.... 195 kg/m3 Particle board (loose):.. 252 kg/m3 Plywood sheets .......... 460 kg/m3 Concrete scrap ........ 1,100 kg/m3 Bricks ........................ 958 kg/m3 Ceramic tiles .............. 720 kg/m3 Asphalt (crushed)......... 819 kg/m3 Grass clippings (uncompacted): ....... 237 kg/m3 Mixed garden waste (uncompacted):. 247 kg/m3 Mixed garden waste (compacted):.... 460 kg/m3 Large limbs and stumps (loose) ........ 640 kg/m3
Uncompacted HHW (in bin): 133 kg/m3 Compacted HHW (in truck): 445 kg/m3
General C&I: 267 kg/m3
General Soil: 1419 kg/m3
General Soil: 1419 kg/m3
Wet biosolids: 721 kg/m3 Dry biosolids:. 560 kg/m3
General Clean Fill: 1500 kg/m3
Shredder flock: 475 kg/m3
General asbestos: 223 kg/m3
Volume to weight: 132 kg/m3 Car tyres:.............. 10 kg/tyre Truck tyres: .......... 32 kg/tyre
Household waste includes bin wastes collected by council kerbside services as well as loads that households self-deliver to facilities. It does not include clean green waste self-delivered by residents.
Commercial & Industrial waste is waste produced by institutions and businesses. It includes waste from schools, restaurants, offices, retail and wholesale businesses, and manufacturing industries etc. Clean green waste, construction and demolition waste, recycling residuals and regulated wastes (such as tyres and batteries etc) should be reported separately.
Feedback
Please return the filled in questionnaire to Laurence Knight at [email protected] or Waste Policy and Legislation, Department of Environment and
Heritage Protection, GPO Box 2454, Brisbane 4001
Thank you for your time and effort in completing this questionnaire
Construction & Demolition waste is waste produced by demolition and building activities, including road and rail construction. Clean fill, contaminated and acid sulfate soils and construction and demolition materials that are defined to be regulated waste by Schedule 7 of the Environmental Protection Regulation 1998 (e.g. asbestos) should be reported separately.Green waste includes grass clippings, tree, bush and shrub trimmings, branches and other similar materials resulting from domestic or commercial gardening, landscaping or maintenance activities.
Biosolids are organic solids derived from biological wastewater treatment processes, eg sewage sludge.
Clean fill is soil, gravel, rocks etc received as a waste stream. It does not include contaminated and acid sulfate soils, nor material that was procured and imported for landfill management purposes (e.g. daily cover, landfill cell construction, final capping etc).
RTI DL R
ELEASE - E
HP
13-033 File B. 28 of 124

?
?
1 Business name
2 Postal address
3 Facility address
4 Contact person
5 Phone number
6 Email address
7
8
Type of waste
Quantity received
from local
government
(tonnes)
Quantity received
from business /
other (tonnes)
Quantity
landfilled
(tonnes)
Quantity
recovered,
recycled or
reused
(tonnes)
9 Household waste
10Non-regulated Commercial & Industrial waste1
11Construction & Demolition waste2
12 Green waste3
13 Biosolids4
14 Clean fill
15 Contaminated soil
16 Acid Sulfate soil
17 Asbestos
18 Tyres
19 Recycling residuals
20 Other (please specify)
Recycling residuals are the residues from recycling activites. Shredder flock is the residue from scrap metal shredding.
21
Are there any waste-related issues that you would like to report to EHP?
Facility details
Survey of private landfill operators in Queensland (Data for the period 1 July 2011 - 30 June 2012)
All data provided will be treated as confidential and used to support EHP's waste policy formulation and environmental reportingPlease fill in your responses in the answer boxes
If yes, what is the current operating
efficiency of the landfill gas capture
system?
Waste details
Details of materials recovered (e.g. cardboard, concrete, timber)
and where used / sent Volume to weight conversion factors
Does the facility have a functioning
landfill gas capture system?
General C&D average:.. 960 kg/m3 Wood scrap (loose):.... 195 kg/m3 Particle board (loose):.. 252 kg/m3 Plywood sheets .......... 460 kg/m3 Concrete scrap ........ 1,100 kg/m3 Bricks ........................ 958 kg/m3 Ceramic tiles .............. 720 kg/m3 Asphalt (crushed)......... 819 kg/m3 Grass clippings (uncompacted): ....... 237 kg/m3 Mixed garden waste (uncompacted):. 247 kg/m3 Mixed garden waste (compacted):.... 460 kg/m3 Large limbs and stumps (loose) ........ 640 kg/m3
Uncompacted HHW (in bin): 133 kg/m3 Compacted HHW (in truck): 445 kg/m3
General C&I: 267 kg/m3
General Soil: 1419 kg/m3
General Soil: 1419 kg/m3
Wet biosolids: 721 kg/m3 Dry biosolids:. 560 kg/m3
General Clean Fill: 1500 kg/m3
Shredder flock: 475 kg/m3
General asbestos: 223 kg/m3
Volume to weight: 132 kg/m3 Car tyres:.............. 10 kg/tyre Truck tyres: .......... 32 kg/tyre
Household waste includes bin wastes collected by council kerbside services as well as loads that households self-deliver to facilities. It does not include clean green waste self-delivered by residents.
Commercial & Industrial waste is waste produced by institutions and businesses. It includes waste from schools, restaurants, offices, retail and wholesale businesses, and manufacturing industries etc. Clean green waste, construction and demolition waste, recycling residuals and regulated wastes (such as tyres and batteries etc) should be reported separately.
Feedback
Please return the filled in questionnaire to Laurence Knight at [email protected] or Waste Policy and Legislation, Department of Environment and
Heritage Protection, GPO Box 2454, Brisbane 4001
Thank you for your time and effort in completing this questionnaire
Construction & Demolition waste is waste produced by demolition and building activities, including road and rail construction. Clean fill, contaminated and acid sulfate soils and construction and demolition materials that are defined to be regulated waste by Schedule 7 of the Environmental Protection Regulation 1998 (e.g. asbestos) should be reported separately.Green waste includes grass clippings, tree, bush and shrub trimmings, branches and other similar materials resulting from domestic or commercial gardening, landscaping or maintenance activities.
Biosolids are organic solids derived from biological wastewater treatment processes, eg sewage sludge.
Clean fill is soil, gravel, rocks etc received as a waste stream. It does not include contaminated and acid sulfate soils, nor material that was procured and imported for landfill management purposes (e.g. daily cover, landfill cell construction, final capping etc).
RTI DL R
ELEASE - E
HP
13-033 File B. 29 of 124

?
?
1 Business name
2 Postal address
3 Facility address
4 Contact person
5 Phone number
6 Email address
7
8
Type of waste
Quantity received
from local
government
(tonnes)
Quantity received
from business /
other (tonnes)
Quantity
landfilled
(tonnes)
Quantity
recovered,
recycled or
reused (tonnes)
9 Household waste
10Non-regulated Commercial & Industrial waste1
11Construction & Demolition waste2
12 Green waste3
13 Biosolids4
14 Clean fill
15 Contaminated soil
16 Acid Sulfate soil
17 Asbestos
18 Tyres
19 Regulated Waste
20Disaster Management Waste
Other (please specify)
21
22
Recycling residuals are the residues from recycling activites. Shredder flock is the residue from scrap metal shredding.
Material
Concrete
Asphalt
Bricks and tiles
Timber
Green waste
Ferrous metal
Non-ferrous metal
Clean Fill
Biosolids
Other (please specify)
21
Are there any waste-related issues that you would like to report to EHP?
Amount Recovered (tonnes) Major recipients (including internal use)
Initial capacity (when DA approved -
m3)
Current capacity (m3)
Waste details
Survey of private landfill operators in Queensland (Data for the period 1 July 2012 - 30 June 2013)
All data provided will be treated as confidential and used to support EHP's waste policy formulation and environmental reportingPlease fill in your responses in the answer boxes
Facility details
Volume to weight: 132 kg/m3 Car tyres:.............. 10 kg/tyre Truck tyres: .......... 32 kg/tyre
Shredder flock: 475 kg/m3
Feedback
Please return the filled in questionnaire to Laurence Knight at [email protected] or Waste Policy and Legislation, Department of Environment and
Heritage Protection, GPO Box 2454, Brisbane 4001
Thank you for your time and effort in completing this questionnaire
Green waste includes grass clippings, tree, bush and shrub trimmings, branches and other similar materials resulting from domestic or commercial gardening, landscaping or maintenance activities.
Household waste includes bin wastes collected by council kerbside services as well as loads that households self-deliver to facilities. It does not include clean green waste self-delivered by residents.
Construction & Demolition waste is waste produced by demolition and building activities, including road and rail construction. Clean fill, contaminated and acid sulfate soils and construction and demolition materials that are defined to be regulated waste by Schedule 7 of the Environmental Protection Regulation 1998 (e.g. asbestos) should be reported separately.
Materials Recovered
General Clean Fill: 1500 kg/m3
General Soil: 1419 kg/m3
General Soil: 1419 kg/m3
General asbestos: 223 kg/m3
Volume to weight conversion factors
Uncompacted HHW (in bin): 133 kg/m3 Compacted HHW (in truck): 445 kg/m3
General C&I: 267 kg/m3
General C&D average:.. 960 kg/m3 Wood scrap (loose):.... 195 kg/m3 Particle board (loose):.. 252 kg/m3 Plywood sheets .......... 460 kg/m3 Concrete scrap ........ 1,100 kg/m3 Bricks ........................ 958 kg/m3 Ceramic tiles .............. 720 kg/m3 Asphalt (crushed)......... 819 kg/m3 Grass clippings (uncompacted): ....... 237 kg/m3 Mixed garden waste (uncompacted):. 247 kg/m3 Mixed garden waste (compacted):.... 460 kg/m3 Large limbs and stumps (loose) ........ 640 kg/m3
Wet biosolids: 721 kg/m3 Dry biosolids:. 560 kg/m3
Commercial & Industrial waste is waste produced by institutions and businesses. It includes waste from schools, restaurants, offices, retail and wholesale businesses, and manufacturing industries etc. Clean green waste, construction and demolition waste, recycling residuals and regulated wastes (such as tyres and batteries etc) should be reported separately.
Clean fill is soil, gravel, rocks etc received as a waste stream. It does not include contaminated and acid sulfate soils, nor material that was procured and imported for landfill management purposes (e.g. daily cover, landfill cell construction, final capping etc).
Biosolids are organic solids derived from biological wastewater treatment processes, eg sewage sludge.RTI DL R
ELEASE - E
HP
13-033 File B. 30 of 124

?
?
1 Business name
2 Postal address
3 Facility address
4 Contact person
5 Phone number
6 Email address
Type of wasteProportion received from
Queensland local governments
Proportion received from other
States
7 Municipal solid waste
8 Commercial and industrial waste
9 Construction and demolition waste
10 Acid sulphate soil and contaminated soil
11 Regulated waste
12 Disaster management waste
13 Green waste
14 Clean earthen material
Material Amount recovered (tonnes)Major recipients (including internal
use)
15 Concrete
16 Asphalt
17 Bricks and tiles
18 Timber
19 Green waste
20 Ferrous metal
21 Non-ferrous metal
22 Clean earthen material
23 Biosolids
Other (please specify)
24
25
26
27
If you have any comments you wish to make or issues you wish to raise, please note them here.
Survey of private landfill operators in Queensland (Data for the period 1
July 2012 - 30 June 2013) All data provided will be treated as confidential and used to support EHP's waste policy formulation and environmental reportingPlease fill in your responses in the answer boxes
Facility details
Feedback
Please return the filled in questionnaire to Laurence Knight at [email protected] or Waste Policy and Legislation, Department of Environment and Heritage Protection, GPO Box 2454, Brisbane 4001
Thank you for your time and effort in completing this questionnaire
Waste Received
Materials recovered
RTI DL R
ELEASE - E
HP
13-033 File B. 31 of 124

?
?
1 Business name
2 Postal address
3 Facility address
4 Contact person
5 Phone number
6 Email address
7 Initial capacity (when
DA approved - m3)
8 Current capacity (m3)
Type of wasteProportion received from
Queensland local governments
Proportion received from other
States
9 Municipal solid waste
10 Commercial and industrial waste
11 Construction and demolition waste
12 Acid sulphate soil and contaminated soil
13 Regulated waste
14 Disaster management waste
15 Green waste
16 Clean earthen material
Material Amount recovered (tonnes)Major recipients (including internal
use)
17 Concrete
18 Asphalt
19 Bricks and tiles
20 Timber
21 Green waste
22 Ferrous metal
23 Non-ferrous metal
24 Clean earthen material
25 Biosolids
Other (please specify)
26
27
28
29
If you have any comments you wish to make or issues you wish to raise, please note them here.
Survey of private landfill operators in Queensland (Data for the period 1
July 2012 - 30 June 2013) All data provided will be treated as confidential and used to support EHP's waste policy formulation and environmental reportingPlease fill in your responses in the answer boxes. If you operate more than one facility, please use a separate worksheet for each facility
Facility details
Feedback
Please return the filled in questionnaire to Laurence Knight at [email protected] or
Waste Policy and Legislation, Department of Environment and Heritage Protection, GPO Box 2454,
Brisbane 4001
Thank you for your time and effort in completing this questionnaire
Waste Received
Materials recovered
RTI DL R
ELEASE - E
HP
13-033 File B. 32 of 124

1 Business name
2 Postal address
3 Facility address
4 Contact person
5 Phone number
6 Email address
7
8
Type of waste
Quantity received from local
government (tonnes)
Quantity received from business / other (tonnes)
Quantity landfilled (tonnes)
Quantity recovered, recycled or
reused (tonnes)
9 Household waste
10Non-regulated Commercial & Industrial waste
11 Construction & Demolition waste
12 Green waste
13 Biosolids
Facility details
Survey of private landfill operators in Queensland (Data for the period 1 July 2011 - 30 June 2012)
All data provided will be treated as confidential and used to support EHP's waste policy formulation and environmental reportingPlease fill in your responses in the answer boxes
If yes, what is the current operating efficiency of the landfill gas capture system?
Waste details
Details of materials recovered (e.g. cardboard, concrete, timber) and where used / sent Volume to weight conversion factors
Does the facility have a functioning landfill gas capture system?
General C&D average:.. 960 kg/m3 Wood scrap (loose):.... 195 kg/m3 Particle board (loose):.. 252 kg/m3 Plywood sheets .......... 460 kg/m3 Concrete scrap ........ 1,100 kg/m3 Bricks ........................ 958 kg/m3 Ceramic tiles .............. 720 kg/m3 Asphalt (crushed)......... 819 kg/m3 Grass clippings (uncompacted): ....... 237 kg/m3 Mixed garden waste (uncompacted):. 247 kg/m3 Mixed garden waste (compacted):.... 460 kg/m3 Large limbs and stumps (loose) ........ 640 kg/m3
Uncompacted HHW (in bin): 133 kg/m3 Compacted HHW (in truck): 445 kg/m3
General C&I: 267 kg/m3
Wet biosolids: 721 kg/m3 Dry biosolids:. 560 kg/m3
RTI DL R
ELEASE - E
HP
13-033 File B. 33 of 124

14 Clean fill
15 Contaminated soil
16 Acid Sulfate soil
17 Asbestos
18 Tyres
19 Recycling residuals
20 Other (please specify)
General Soil: 1419 kg/m3
General Soil: 1419 kg/m3
General Clean Fill: 1500 kg/m3
Shredder flock: 475 kg/m3
General asbestos: 223 kg/m3
Volume to weight: 132 kg/m3 Car tyres:.............. 10 kg/tyre Truck tyres: .......... 32 kg/tyre
Household waste includes bin wastes collected by council kerbside services as well as loads that households self-deliver to facilities. It does not include clean green waste self-delivered by residents.
Commercial & Industrial waste is waste produced by institutions and businesses. It includes waste from schools, restaurants, offices, retail and wholesale businesses, and manufacturing industries etc. Clean green waste, construction and demolition waste, recycling residuals and regulated wastes (such as tyres and batteries etc) should be reported separately.Construction & Demolition waste is waste produced by demolition and building activities, including road and rail construction. Clean fill, contaminated and acid sulfate soils and construction and demolition materials that are defined to be regulated waste by Schedule 7 of the Environmental Protection Regulation 1998 (e.g. asbestos) should be reported separately.Green waste includes grass clippings, tree, bush and shrub trimmings, branches and other similar materials resulting from domestic or commercial gardening, landscaping or maintenance activities.
Biosolids are organic solids derived from biological wastewater treatment processes, eg sewage sludge.
RTI DL R
ELEASE - E
HP
13-033 File B. 34 of 124

Recycling residuals are the residues from recycling activites. Shredder flock is the residue from scrap metal shredding.
21Are there any waste-related issues that you would like to report to EHP?
Feedback
Please return the filled in questionnaire to Laurence Knight at [email protected] or Waste Policy and Legislation, Department of Environment and Heritage Protection, GPO Box 2454, Brisbane 4001
Thank you for your time and effort in completing this questionnaire
Clean fill is soil, gravel, rocks etc received as a waste stream. It does not include contaminated and acid sulfate soils, nor material that was procured and imported for landfill management purposes (e.g. daily cover, landfill cell construction, final capping etc).
RTI DL R
ELEASE - E
HP
13-033 File B. 35 of 124

1 Business name
2 Postal address
3 Facility address
4 Contact person
5 Phone number
6 Email address
7
8
Type of waste
Quantity received from local
government (tonnes)
Quantity received from business / other (tonnes)
Quantity landfilled (tonnes)
Quantity recovered, recycled or
reused (tonnes)
9 Household waste
10Non-regulated Commercial & Industrial waste1
11Construction & Demolition waste2
12 Green waste3
13 Biosolids4
14 Clean fill
Details of materials recovered (e.g. cardboard, concrete, timber) and where used / sent
Survey of private landfill operators in Queensland (Data for the period 1 July 2011 - 30 June 2012)
All data provided will be treated as confidential and used to support EHP's waste policy formulation and environmental reportingPlease fill in your responses in the answer boxes
Facility details
General Clean Fill: 1500 kg/m3
Wet biosolids: 721 kg/m3 Dry biosolids:. 560 kg/m3
Volume to weight conversion factors
Uncompacted HHW (in bin): 133 kg/m3 Compacted HHW (in truck): 445 kg/m3
General C&I: 267 kg/m3
General C&D average:.. 960 kg/m3 Wood scrap (loose):.... 195 kg/m3 Particle board (loose):.. 252 kg/m3 Plywood sheets .......... 460 kg/m3 Concrete scrap ........ 1,100 kg/m3 Bricks ........................ 958 kg/m3 Ceramic tiles .............. 720 kg/m3 Asphalt (crushed)......... 819 kg/m3 Grass clippings (uncompacted): ....... 237 kg/m3 Mixed garden waste (uncompacted):. 247 kg/m3 Mixed garden waste (compacted):.... 460 kg/m3 Large limbs and stumps (loose) ........ 640 kg/m3
Does the facility have a functioning landfill gas capture system?If yes, what is the current operating efficiency of the landfill gas capture system?
Waste details
RTI DL R
ELEASE - E
HP
13-033 File B. 36 of 124

15 Contaminated soil
16 Acid Sulfate soil
17 Asbestos
18 Tyres
19 Recycling residuals
20 Other (please specify)
Recycling residuals are the residues from recycling activites. Shredder flock is the residue from scrap metal shredding.
Volume to weight: 132 kg/m3 Car tyres:.............. 10 kg/tyre Truck tyres: .......... 32 kg/tyre
General Soil: 1419 kg/m3
General Soil: 1419 kg/m3
Shredder flock: 475 kg/m3
Feedback
Green waste includes grass clippings, tree, bush and shrub trimmings, branches and other similar materials resulting from domestic or commercial gardening, landscaping or maintenance activities.
Household waste includes bin wastes collected by council kerbside services as well as loads that households self-deliver to facilities. It does not include clean green waste self-delivered by residents.
Construction & Demolition waste is waste produced by demolition and building activities, including road and rail construction. Clean fill, contaminated and acid sulfate soils and construction and demolition materials that are defined to be regulated waste by Schedule 7 of the Environmental Protection Regulation 1998 (e.g. asbestos) should be reported separately.
General asbestos: 223 kg/m3
Commercial & Industrial waste is waste produced by institutions and businesses. It includes waste from schools, restaurants, offices, retail and wholesale businesses, and manufacturing industries etc. Clean green waste, construction and demolition waste, recycling residuals and regulated wastes (such as tyres and batteries etc) should be reported separately.
Clean fill is soil, gravel, rocks etc received as a waste stream. It does not include contaminated and acid sulfate soils, nor material that was procured and imported for landfill management purposes (e.g. daily cover, landfill cell construction, final capping etc).
Biosolids are organic solids derived from biological wastewater treatment processes, eg sewage sludge.
RTI DL R
ELEASE - E
HP
13-033 File B. 37 of 124

21Are there any waste-related issues that you would like to report to EHP?
Please return the filled in questionnaire to Laurence Knight at [email protected] or Waste Policy and Legislation, Department of Environment and Heritage Protection, GPO Box 2454, Brisbane 4001
Thank you for your time and effort in completing this questionnaire
RTI DL R
ELEASE - E
HP
13-033 File B. 38 of 124

1 Business name
2 Postal address
3 Facility address
4 Contact person
5 Phone number
6 Email address
7
8
Type of waste
Quantity received from local
government (tonnes)
Quantity received from business / other (tonnes)
Quantity landfilled (tonnes)
Quantity recovered, recycled or
reused (tonnes)
9 Household waste
10Non-regulated Commercial & Industrial waste1
11Construction & Demolition waste2
12 Green waste3
Facility details
Survey of private landfill operators in Queensland (Data for the period 1 July 2011 - 30 June 2012)
All data provided will be treated as confidential and used to support EHP's waste policy formulation and environmental reportingPlease fill in your responses in the answer boxes
If yes, what is the current operating efficiency of the landfill gas capture system?
Waste details
Details of materials recovered (e.g. cardboard, concrete, timber) and where used / sent Volume to weight conversion factors
Does the facility have a functioning landfill gas capture system?
General C&D average:.. 960 kg/m3 Wood scrap (loose):.... 195 kg/m3 Particle board (loose):.. 252 kg/m3 Plywood sheets .......... 460 kg/m3 Concrete scrap ........ 1,100 kg/m3 Bricks ........................ 958 kg/m3 Ceramic tiles .............. 720 kg/m3 Asphalt (crushed)......... 819 kg/m3 Grass clippings (uncompacted): ....... 237 kg/m3 Mixed garden waste (uncompacted):. 247 kg/m3 Mixed garden waste (compacted):.... 460 kg/m3 Large limbs and stumps (loose) ........ 640 kg/m3
Uncompacted HHW (in bin): 133 kg/m3 Compacted HHW (in truck): 445 kg/m3
General C&I: 267 kg/m3
RTI DL R
ELEASE - E
HP
13-033 File B. 39 of 124

13 Biosolids4
14 Clean fill
15 Contaminated soil
16 Acid Sulfate soil
17 Asbestos
18 Tyres
19 Recycling residuals
20 Other (please specify)
General Soil: 1419 kg/m3
General Soil: 1419 kg/m3
Wet biosolids: 721 kg/m3 Dry biosolids:. 560 kg/m3
General Clean Fill: 1500 kg/m3
Shredder flock: 475 kg/m3
General asbestos: 223 kg/m3
Volume to weight: 132 kg/m3 Car tyres:.............. 10 kg/tyre Truck tyres: .......... 32 kg/tyre
Household waste includes bin wastes collected by council kerbside services as well as loads that households self-deliver to facilities. It does not include clean green waste self-delivered by residents.
Commercial & Industrial waste is waste produced by institutions and businesses. It includes waste from schools, restaurants, offices, retail and wholesale businesses, and manufacturing industries etc. Clean green waste, construction and demolition waste, recycling residuals and regulated wastes (such as tyres and batteries etc) should be reported separately.
RTI DL R
ELEASE - E
HP
13-033 File B. 40 of 124

Recycling residuals are the residues from recycling activites. Shredder flock is the residue from scrap metal shredding.
21
Are there any waste-related issues that you would like to report to EHP?
Feedback
Please return the filled in questionnaire to Laurence Knight at [email protected] or Waste Policy and Legislation, Department of Environment and Heritage Protection, GPO Box 2454, Brisbane 4001
Thank you for your time and effort in completing this questionnaire
Construction & Demolition waste is waste produced by demolition and building activities, including road and rail construction. Clean fill, contaminated and acid sulfate soils and construction and demolition materials that are defined to be regulated waste by Schedule 7 of the Environmental Protection Regulation 1998 (e.g. asbestos) should be reported separately.Green waste includes grass clippings, tree, bush and shrub trimmings, branches and other similar materials resulting from domestic or commercial gardening, landscaping or maintenance activities.
Biosolids are organic solids derived from biological wastewater treatment processes, eg sewage sludge.
Clean fill is soil, gravel, rocks etc received as a waste stream. It does not include contaminated and acid sulfate soils, nor material that was procured and imported for landfill management purposes (e.g. daily cover, landfill cell construction, final capping etc).
RTI DL R
ELEASE - E
HP
13-033 File B. 41 of 124

Dear .__________
As required under Chapter 7 of the Waste Reduction and Recycling Act 2011 (WRR Act),
the Department of Environment and Heritage Protection (EHP) is preparing to collect
waste and recycling data for the 2012-13 financial year.
Sections 150 to 153 of the WRR Act and sections 40, 41 and 44 of the Waste Reduction
and Recycling Regulation 2011 require recyclers to supply waste and recycling data in the approved form to EHP by 31 August each year.
Completing and returning the attached survey by August 31, 2013 will meet your
reporting obligation. The survey is similar to one you may have completed last year. It
seeks details of your facility, waste materials received, materials recycled, materials
forwarded to other recyclers and materials sent for disposal. It will also provide the
opportunity for feedback on issues that concern you (for example, difficulties accessing
feedstock or access to markets).
The data that you supply will be treated as confidential and used in aggregated form in
the development of priorities for the new industry-led waste strategy, as well as for the
information of the public and other interested parties. The data received will also
contribute to the 2013 State of Waste and Recycling in Queensland report. (The 2012 report is available at http://www.ehp.qld.gov.au/waste/pdf/state-of-waste-recycling-report.pdf). Aggregated data will also be provided to the Australian Government to meet
Queensland’s obligations under the National Waste Policy.
Given the importance of good quality data to the Queensland Government, I thank you
for taking the time to participate in the survey. Please complete and return the survey to
Dr Laurence Knight ([email protected]) by 31 August 2013. Should you have any queries, please liaise with Laurence (ph 07 3330 5033).
Sincerely,
Elisa Nichols
Executive Director, Reform and Innovation
RTI DL R
ELEASE - E
HP
13-033 File B. 42 of 124

1 Name of the business
2 Addresses of facilities processing material collected in Queensland
3 Contact person
4 Position
5 Phone number(s)
6 Email address
Type of waste received Quantity from Local Government (tonnes)
Quantity from private landfill operators (tonnes)
Quantity from other sources (tonnes)
Region(s) of Queensland the material is sourced
from7 Paper & packaging materials1
8 Scrap metal2
9 Green waste
10 Clean earth/fill
11 Contaminated and/or Acid Sulfate Soil
12Other construction and demolition wastes3
13 Vegetable Oil
14 Other food waste/food processing waste
15 Tyres
16 Mineral Oil
17 Lead-acid batteries
18 Other E-Wastes
19 Other wastes - please specify
20
21
22
23
Waste received for recycling in Queensland
Survey of recyclers in Queensland (Data for the period 1 July 2011 - 30 June 2012)
All data provided will be treated as confidential and used to support EHP's waste policy formulation and environmental reportingPlease insert your responses in the answer boxes
Business details
RTI DL R
ELEASE - E
HP
13-033 File B. 43 of 124

24
25
3 Concrete, asphalt, bricks, tiles, fibro, plasterboard, timber etc
1 Paper & packaging materials include paper, cardboard, glass, plastic and metal containers
2 Scrap metal other than metal containers
RTI DL R
ELEASE - E
HP
13-033 File B. 44 of 124

Material Quantity recycled and sold to end user (tonnes)
Quantity combusted for energy recovery (tonnes)
Quantity forwarded to other recyclers in
Queensland for further processing (tonnes)
Quantity forwarded to interstate or overseas recyclers for further processing (tonnes)
Details of recyclers who receive material
26 Glass
27 Paper & newsprint
28 Cardboard
29 Plastics
30 Ferrous metals
31 Nonferrous metals
32 Concrete
33 Asphalt
34 Bricks and tiles
35 Fibro / plasterboard
36 Timber
37 Clean earth/fill
38 Mulch
39 Compost
40 Biofuels
41 Mineral oil
42 Tyres
43 Other rubber
44 Batteries
45 Chemicals
46 Other (please specify)
47
48
49
50
Materials recycled
RTI DL R
ELEASE - E
HP
13-033 File B. 45 of 124

51Total amount of materials received for recycling that was ultimately disposed of (sent to landfill)
52
Please indicate the reasons why the materials were sent to landfill (e.g. contamination, other process residuals, market or regulatory barriers)
53 Are there any waste-related issues that you would like to report to EHP?
Feedback
Please return the filled in questionnaire to Laurence Knight at [email protected] or Environmental Policy and Planning Division, Department of Environment and Heritage Protection, GPO Box 2454, Brisbane 4001
Thank you for your time and effort in completing this questionnaire
Materials sent for disposal
RTI DL R
ELEASE - E
HP
13-033 File B. 46 of 124

?
?
1Name of the business (please
include trading names and other
aliases)
2 ABN / ACN
3 Postal Address
4 Contact person
5 Position
6 Phone number(s)
7 Email address
Proportion of total waste
processed that was
initially received at this
facility (percent)
8
9
10
11
12
13
14
15
16
Type of waste receivedQuantity from Local
Government (tonnes)
Quantity from private
landfill operators (tonnes)
Quantity from other
sources (tonnes)
17 Paper & packaging materials1
18 Scrap metal2
19 Green waste
20 Clean earth/fill
21 Contaminated and/or Acid Sulfate
Soil
22Other construction and demolition
wastes3
23 Vegetable Oil
24 Other food waste
25 Food processing waste
26 Tyres
27 Mineral Oil
28 Lead-acid batteries
29 Other E-Wastes
30 Other wastes - please specify
31
32
33
34
35
MaterialQuantity recycled and
sold to end user (tonnes)
Quantity combusted for
energy recovery (tonnes)
Quantity forwarded to
other recyclers in
Queensland for further
processing (tonnes)
Quantity forwarded to
interstate recyclers for
further processing
(tonnes)
Quantity forwarded to
overseas recyclers for
further processing
(tonnes)
36 Glass
37 Paper & newsprint
38 Cardboard
39 Plastics
40 Ferrous metals
41 Nonferrous metals
42 Concrete
43 Asphalt
44 Bricks and tiles
45 Fibro/plasterboard
46 Timber
47 Clean earth/fill
48 Mulch
49 Compost
50 Biofuels
51 Mineral oil
52 Tyres
53 Other rubber
54 Batteries
55 Chemicals
56 Other (please specify)
57
58
59
60
Material (please specify)Organisation receiving
the materialAmount sent (tonnes)
61
62
63
64
65
66
67
68Total amount of materials received for recycling that was ultimately disposed of (sent to landfill)
69
Please indicate the reasons why the materials were sent to landfill (e.g. contamination, other process residuals, market or regulatory barriers)
70
If you wish to clarify your responses to any of the questions or raise any waste-related issues, please insert the details here.
Materials recycled
Address of facility processing waste collected in Queensland (please use separate rows
for each facility if your business has more than one).
Additional Information
3 Concrete, asphalt, bricks, tiles, fibro, plasterboard, timber etc
Waste received for recycling in Queensland
Materials sent for disposal
1 Paper & packaging materials include paper, and cardboard, glass, plastic and metal containers
2 Scrap metal other than metal containers, lead-acid batteries and other e-wastes
Facility details
Survey of recyclers in Queensland (Data for the period 1 July 2012 - 30 June 2013)
Please return the filled in questionnaire to Laurence Knight at [email protected] or Environmental Policy and Planning Division,
Department of Environment and Heritage Protection, GPO Box 2454, Brisbane 4001
Thank you for your time and effort in completing this questionnaire
Comments
Details of materials sent to other recyclers in Queensland for further processing
All data provided will be treated as confidential, and used to support EHP's waste policy formulation and environmental reportingPlease insert your responses in the answer boxes
Business details
RTI DL R
ELEASE - E
HP
13-033 File B. 47 of 124
Dear .__________
As required under Chapter 7 of the Waste Reduction and Recycling Act 2011 (WRR Act),
the Department of Environment and Heritage Protection (EHP) is preparing to collect
waste and recycling data for the 2012-13 financial year.
EHP is collecting data from waste removers on a confidential basis to develop priorities
for the new industry-led waste strategy, and to inform the public and other interested
parties. The data received will also contribute to the 2013 State of Waste and Recycling
in Queensland report. (The 2012 report is available at http://www.ehp.qld.gov.au/waste/pdf/state-of-waste-recycling-report.pdf). Aggregated data will also
be provided to the Australian Government to meet Queensland’s obligations under the National Waste Policy.
The survey seeks details of your facility, waste materials received, materials sent for
disposal, and materials recycled or recovered. It will also provide the opportunity for
feedback on issues that concern you. Please to enter your data into the attached spread
sheet and return it to Dr. Laurence Knight via email [email protected] by 31 August 2013.
Given the importance of good quality data to the Queensland Government, I thank you
for taking the time to participate in the survey. Should you have any queries, please liaise with Laurence (ph 07 3330 5033).
Sincerely,
Elisa Nichols
Executive Director, Reform and Innovation
RTI DL R
ELEASE - E
HP
13-033 File B. 48 of 124

?
?
1Name of the business (please
include trading names and other
aliases)
2 ABN/ACN
3 Postal Address
4 Contact person
5 Position
6 Phone number(s)
7 Email address
Proportion of total waste
processed that was
initially received at this
facility (percent)
8
9
10
11
12
13
14
15
Type of waste collectedQuantity collected
(tonnes)
Quantity sent to landfill
(tonnes)
16 Mixed household waste
17 Green waste
18 Clean earth/fill
19 Contaminated and/or Acid Sulfate
Soil
20 Asbestos
21 Other construction and demolition
wastes1
22 Mixed commercial waste
23 Other wastes - please specify
24
25
26
27
28
29
30
31
32
33
MaterialQuantity recycled and
sold to end user (tonnes)
Quantity forwarded to
other recyclers in
Queensland for further
processing (tonnes)
Quantity forwarded to
interstate recyclers for
further processing
(tonnes)
Quantity forwarded to
overseas recyclers for
further processing
(tonnes)
34 Glass
35 Paper & newsprint
36 Cardboard
37 Plastics
38 Ferrous metals
39 Nonferrous metals
40 Concrete
41 Asphalt
42 Bricks and tiles
43 Fibro / plasterboard
44 Timber
45 Clean earth/fill
46 Mulch
47 Compost
48 Biofuels
49 Mineral oil
50 Tyres
51 Other rubber
52 Batteries
53 Chemicals
54 Other (please specify)
55
56
57
58
Material (please specify)Organisation receiving
the materialAmount sent (tonnes)
59
60
61
62
63
64
65
66
If you wish to clarify your responses to any of the questions or raise any waste-related issues, please insert the details here. For example, are there barriers to resource recovery that you would like addressed?
Address of facility processing waste collected in Queensland
All data provided will be treated as confidential, and used to support EHP's waste policy formulation and environmental reportingPlease insert your responses in the answer boxes
Business details
Please return the filled in questionnaire to Laurence Knight at [email protected] or Environmental Policy and Planning Division,
Department of Environment and Heritage Protection, GPO Box 2454, Brisbane 4001
Details of materials sent to other recyclers in Queensland for further processing
Materials recovered
Thank you for your time and effort in completing this questionnaire
Comments
Survey of waste removers in Queensland (Data for the period 1 July 2012 - 30 June 2013)
Facility details
Additional Information
1 Concrete, asphalt, bricks, tiles, fibro, plasterboard, timber etc
Waste collected in Queensland
RTI DL R
ELEASE - E
HP
13-033 File B. 49 of 124

Page 1
Local Government Waste Management Report 2012Local Government Waste Management Report 2012Local Government Waste Management Report 2012Local Government Waste Management Report 2012
Welcome to the DEHP Waste and Recycling Survey 2012. Waste and Recycling Activities during the period 1 July 2011 to 30 June 2012. Instructions The survey is divided into 23 sections and does not need to be completed in one session. Information entered is automatically saved. You can exit and enter the survey as many times as you like, but you will need to access the survey from the same computer each time. If you have the waste information available then the survey should take around one hour to complete. Please complete every section of the survey before submitting. Navigate through the survey by clicking on the "Prev" and "Next" buttons at the bottom of the screen. Questions denoted with an asterisk * must be completed. Please provide a response in the appropriate numeric or text format. The unit of measurement for most of the materials in this survey is weight (tonnes). If you do not have weightbased data, please refer to the weight to volume conversion factors. There are comment boxes at the end of each section where you can discuss issues you are having with the waste streams covered in that section or describe the basis of your calculations/answers. Once you have completed the survey, submit the response to DEHP by clicking on the "submit" button on the last page. Please make sure you enter the date when the survey was completed. Thank you for taking the time to complete the survey. Notes: 1. Council* refers to action taken by Council, contractors or corporations operating on its behalf in relation to waste management within its local government area. 2. Each material should only be recorded in one section. Materials reported in one section (such as segregated green waste, or paper and packaging materials) should not be reported in another section. If you have any difficulties filling in this report or need to clarify any questions, please contact Laurence Knight (ph 3339 5816, email [email protected] ) or Glenn Ellis (ph 3339 5808, email [email protected]).
Waste and Recycling Activities over the period 1 July 2011 to 30 June 2012
RTI DL R
ELEASE - E
HP
13-033 File B. 50 of 124
Page 2
Local Government Waste Management Report 2012Local Government Waste Management Report 2012Local Government Waste Management Report 2012Local Government Waste Management Report 2012
1. Please enter the name of your council
2. Please enter the contact details of a Council officer able to discuss and verify the data in this report.
Council details
*
*
Name
Position
Phone number(s)
Email address
RTI DL R
ELEASE - E
HP
13-033 File B. 51 of 124

Page 3
Local Government Waste Management Report 2012Local Government Waste Management Report 2012Local Government Waste Management Report 2012Local Government Waste Management Report 2012
Navigate to the section of your choice
3. Please select the relevant section you need to navigate to:
Contents Page
Answer all questions
nmlkj
Section 1: General (Residual) Household Waste Kerbside Collection Service
nmlkj
Section 2: General (Residual) Waste Collected in Street and Other Public Place (Litter) Bins
nmlkj
Section 3: Litter and Other Illegally Dumped Waste Collected by the Council
nmlkj
Section 4: Disaster Management Waste
nmlkj
Section 5: Selfhauled Household Waste
nmlkj
Section 6: Household Bulky Waste Collection
nmlkj
Section 7: Paper and Packaging Materials Recycling
nmlkj
Section 8: Segregated Green Waste
nmlkj
Section 9: Biosolids
nmlkj
Section 10: Clean fill
nmlkj
Section 11: Contaminated and Acid Sufate Soils
nmlkj
Section 12: Construction and Demolition Waste
nmlkj
Section 13: Commercial and Industrial Waste
nmlkj
Section 14: Tyres
nmlkj
Section 15: Mineral (motor) Oil
nmlkj
Section 16: Lead Acid Batteries
nmlkj
Section 17: Asbestos
nmlkj
Section 18: Clinical Waste
nmlkj
Section 19: Household, Farm and Industrial Hazardous Chemicals
nmlkj
Section 20: Electronic Waste
nmlkj
Section 21: Cross Boundary Waste Movements
nmlkj
Section 22: Waste Management Initiatives.
nmlkj
Section 23: Feedback
nmlkj
Submit data to DEHP
nmlkj
RTI DL R
ELEASE - E
HP
13-033 File B. 52 of 124

Page 4
Local Government Waste Management Report 2012Local Government Waste Management Report 2012Local Government Waste Management Report 2012Local Government Waste Management Report 2012
General (Residual) Household Waste Household waste that has not been separated for separate collection for recycling collected via a regular kerbside bin service (or similar e.g. bulk bins in multi unit dwellings).
4. Does Council* provide a regular kerbside collection service for general (residual) household waste?
Section 1: General (Residual) Household Waste Kerbside Collection Service
*
Yes
nmlkj
No
nmlkj
RTI DL R
ELEASE - E
HP
13-033 File B. 53 of 124

Page 5
Local Government Waste Management Report 2012Local Government Waste Management Report 2012Local Government Waste Management Report 2012Local Government Waste Management Report 2012
Details of General (Residual) Household Waste collected via the Kerbside Service. Volume to weight conversion factors: Uncompacted (in bin): 133 kg/m3 Compacted (in truck): 445 kg/m3 5. How many households are provided with a regular kerbside collection service for general (residual) household waste (as at 30/6/2012)? [Include households in multi unit dwellings receiving a regular council* collection service].
6. Amount of general (residual) household waste collected via the regular kerbside collection service. Please specify the amount by weight.
7. Amount of general (residual) household waste disposed of in Council landfills or incinerated. Please specify the amount by weight.
8. Amount of general (residual) household waste disposed of in external landfills (ie. sent to another council or to a private landfill). Please specify the amount by weight.
9. Is any of the commingled household waste sent for reprocessing?
Section 1: General (Residual) Household Waste Kerbside Collection Service
Number of households
Weight (tonnes)
Weight (tonnes)
Weight (tonnes)
*
Yes
nmlkj
No
nmlkj
RTI DL R
ELEASE - E
HP
13-033 File B. 54 of 124

Page 6
Local Government Waste Management Report 2012Local Government Waste Management Report 2012Local Government Waste Management Report 2012Local Government Waste Management Report 2012
Details of General (Residual) Household Waste sent for reprocessing. Volume to weight conversion for uncompacted household waste 133 kg per m3. 10. Amount of general (residual) household waste reprocessed. Please specify the amount by weight.
11. Please specify the reprocessing/recovery method for the general (residual) household waste.
12. Please provide a description of materials reprocessed / recovered from the general (residual) household waste.
13. Please indicate the address destination for materials reprocessed / recovered.
14. Please provide any further information which gives further context and understanding to the answers provided in this section. If council sent general (residual) household waste for disposal in (an) external landfill(s), please supply details of the landfill(s) receiving that waste.
Section 1: General (Residual) Household Waste Kerbside Collection Service
Weight (tonnes)
55
66
55
66
55
66
manual extraction of recyclables
gfedc
waste sent to compost facility
gfedc
Other (please specify)
55
66
RTI DL R
ELEASE - E
HP
13-033 File B. 55 of 124

Page 7
Local Government Waste Management Report 2012Local Government Waste Management Report 2012Local Government Waste Management Report 2012Local Government Waste Management Report 201215. Thank you for completing this section. You can now choose to continue with the
survey from here, or navigate back to the contents page to select another section to complete.
*
Go back to contents page
nmlkj
Continue with survey
nmlkj
RTI DL R
ELEASE - E
HP
13-033 File B. 56 of 124
Page 8
Local Government Waste Management Report 2012Local Government Waste Management Report 2012Local Government Waste Management Report 2012Local Government Waste Management Report 2012
Bins in public places where people can deposit general (residual) waste for disposal Note: If street and other public bin waste is picked up on the same runs as the kerbside household waste collection and you don't have separate data for street bins, estimate the proportion of the combined waste that would be attributable to street bins and use that figure. You can insert a comment at the end of the section to discuss your calculations.
16. Does your Council* collect general (residual) waste from street bins and bins in other public places?
Section 2: General (Residual) Waste Collected in Street and Other Public Pl...
*
Yes
nmlkj
No
nmlkj
RTI DL R
ELEASE - E
HP
13-033 File B. 57 of 124

Page 9
Local Government Waste Management Report 2012Local Government Waste Management Report 2012Local Government Waste Management Report 2012Local Government Waste Management Report 2012
Details of General (Residual) Waste Collected in Street and Other Public Place (Litter) Bins Volume to weight conversion for uncompacted general (residual) waste 133 kg per m3. 17. Amount of general (residual) waste that Council* collected from street and other waste bins in public places (this does not include material placed in public place recycling bins). Please specify the amount by weight.
18. Amount of general (residual) waste collected from street and other public place bins waste disposed of in council landfills or incinerated. Please specify the total amount by weight.
19. Amount of general (residual) waste collected from street and other public place bins disposed of in external landfills (ie. sent to another council or to a private landfill). Please specify the amount by weight.
20. Is any of the waste from public place bins reprocessed?
Section 2: General (Residual) Waste Collected in Street and Other Public Pl...
Weight (tonnes)
Weight (tonnes)
Weight (tonnes)
*
Yes
nmlkj
No
nmlkj
RTI DL R
ELEASE - E
HP
13-033 File B. 58 of 124

Page 10
Local Government Waste Management Report 2012Local Government Waste Management Report 2012Local Government Waste Management Report 2012Local Government Waste Management Report 2012
Details of general (residual) waste collected in street and other public place bins sent for reprocessing. Volume to weight conversion for uncompacted household waste 133 kg per m3. 21. Amount of general (residual) waste collected from street and other public place bins reprocessed. Please specify the amount by weight.
22. Please specify the reprocessing/recovery method for the general (residual) waste collected from street and other public place bins
23. Please provide a description of the materials reprocessed / recovered.
24. Please indicate the address destination for materials reprocessed / recovered.
25. Please provide any further information which gives further context and understanding to the answers provided in this section. If council sent general (residual) waste collected from street and other public place bins for disposal in (an) external landfill(s), please supply details of the landfill(s) receiving that waste.
Section 2: General (Residual) Waste Collected in Street and Other Public Pl...
Weight (tonnes)
55
66
55
66
55
66
Manual extraction of recyclables
gfedc
Waste sent to compost facility
gfedc
Other (please specify)
55
66
RTI DL R
ELEASE - E
HP
13-033 File B. 59 of 124

Page 11
Local Government Waste Management Report 2012Local Government Waste Management Report 2012Local Government Waste Management Report 2012Local Government Waste Management Report 201226. Thank you for completing this section. You can now choose to continue with the
survey from here, or navigate back to the contents page to select another section to complete.
*
Go back to contents page
nmlkj
Continue with survey
nmlkj
RTI DL R
ELEASE - E
HP
13-033 File B. 60 of 124

Page 12
Local Government Waste Management Report 2012Local Government Waste Management Report 2012Local Government Waste Management Report 2012Local Government Waste Management Report 2012
Details of Illegally disposed of waste Volume to weight conversion for uncompacted general waste 133 kg per m3. 27. Amount of litter and other illegally dumped waste collected by Council* Please specify the amount by weight.
28. Please describe the nature of the litter / illegally dumped waste. Please note you can select multiple options.
29. Amount of litter and illegally dumped waste disposed of in council landfills or incinerated. Please specify the amount by weight.
30. Amount of litter and illigally dumped waste disposed of in external landfills (ie. sent to another council or to a private landfill). Please specify the amount by weight.
31. Is any of the litter and illegally dumped waste recovered/diverted from landfill?
Section 3: Litter and Other Illegally Dumped Waste Collected by the Council
Weight (tonnes)
Weight (tonnes)
Weight (tonnes)
*
Paper and packaging materials
gfedc
Other domestic waste
gfedc
Furniture / white goods
gfedc
Motor vehicles
gfedc
Chemicals / chemical containers
gfedc
Construction and demolition wastes
gfedc
Other industrial waste
gfedc
Other (please specify)
55
66
Yes
nmlkj
No
nmlkj
RTI DL R
ELEASE - E
HP
13-033 File B. 61 of 124

Page 13
Local Government Waste Management Report 2012Local Government Waste Management Report 2012Local Government Waste Management Report 2012Local Government Waste Management Report 2012
Litter and other illegally dumped waste reprocessed by Council Volume to weight conversion for uncompacted general waste 133 kg per m3. 32. Amount of litter and other illegally dumped waste reprocessed. Please specify the amount by weight.
33. Please specify the reprocessing / recovery method for the litter and other illegally dumped waste.
34. Please provide a description of materials which are reprocessed / recovered from the litter and other illegally dumped waste.
35. Please provide the address destinations for materials which are reprocessed / recovered from the litter and other illegally dumped waste.
36. How much did it cost Council* to manage litter and other illegally dumped waste over the past 12 months?
Section 3: Litter and Other Illegally Dumped Waste Collected by the Council
Weight (tonnes)
55
66
55
66
Cost to Council* ($)
Manual extraction of recyclables
gfedc
Waste sent to compost facility
gfedc
Other (please specify)
55
66
RTI DL R
ELEASE - E
HP
13-033 File B. 62 of 124

Page 14
Local Government Waste Management Report 2012Local Government Waste Management Report 2012Local Government Waste Management Report 2012Local Government Waste Management Report 201237. Please provide any further information which gives further context and understanding to the answers provided in this section. If council sent litter and other illegally dumped waste for disposal in (an) external landfill(s), please supply details of the landfill(s) receiving that waste.
38. Thank you for completing this section. You can now choose to continue with the survey from here, or navigate back to the contents page to select another section to complete.
55
66
*
Go back to contents page
nmlkj
Continue with survey
nmlkj
RTI DL R
ELEASE - E
HP
13-033 File B. 63 of 124

Page 15
Local Government Waste Management Report 2012Local Government Waste Management Report 2012Local Government Waste Management Report 2012Local Government Waste Management Report 2012
Waste generated from a disaster declared under the Disaster Management Act 2003. Note disaster management waste may include selfhauled household waste, bulky item household waste, green waste, construction and demolition waste, commercial and industrial waste, and asbestos.
39. Did Council* collect/receive waste generated as a consequence of a disaster declared under the Disaster Management Act 2003?
Section 4: Disaster Management Waste
*
Yes
nmlkj
No
nmlkj
RTI DL R
ELEASE - E
HP
13-033 File B. 64 of 124

Page 16
Local Government Waste Management Report 2012Local Government Waste Management Report 2012Local Government Waste Management Report 2012Local Government Waste Management Report 2012
Details of Disaster Management Waste Managed by Council*. 40. Please list the declared disasters that generated the disaster management waste.
41. Please list the amounts (tonnes) of the following waste types arising from these declared disasters:
42. Thank you for completing this section. You can now choose to continue with the survey from here, or navigate back to the contents page to select another section to complete.
Section 4: Disaster Management Waste
55
66
Selfhauled household clean up wastes
Kerbsidecollected household clean up wastes
Green waste
Demolition and construction wastes
Commercial cleanup wastes
Asbestos
*
Go back to contents page
nmlkj
Continue with survey
nmlkj
RTI DL R
ELEASE - E
HP
13-033 File B. 65 of 124

Page 17
Local Government Waste Management Report 2012Local Government Waste Management Report 2012Local Government Waste Management Report 2012Local Government Waste Management Report 2012
Details of SelfHauled Household Waste Received by Council* Volume to weight conversion for selfhauled household waste 150 kg per m3. 43. Amount of household waste (excluding segregated green waste) dropped off by residents at landfills and transfer stations. Please list seperate amounts for normal deliveries and disaster waste deliveries, and please specify the amounts by weight.
44. Amount of selfhauled household waste disposed of in Council landfills or incinerated. Please specify the amount by weight.
45. Amount of selfhauled household waste disposed of in external landfills (ie. sent to another council or to a private landfill). Please specify the amount by weight.
46. Is any of the selfhauled household waste recovered / diverted from landfill?
Section 5: SelfHauled Household Waste
Normal deliveries (tonnes)
Disaster waste (tonnes)
Weight (tonnes)
Weight (tonnes)
*
Yes
nmlkj
No
nmlkj
RTI DL R
ELEASE - E
HP
13-033 File B. 66 of 124

Page 18
Local Government Waste Management Report 2012Local Government Waste Management Report 2012Local Government Waste Management Report 2012Local Government Waste Management Report 2012
Selfhauled Household Waste Reprocessed by Council* Volume to weight conversion for selfhauled household waste 150 kg per m3. 47. Amount of selfhauled household waste recovered/diverted from landfill. Please specify the amount by weight.
48. Please use the table below to specify both the materials recovered / diverted from landfill from the selfhauled household waste, and their final destination.
49. Please provide any further information which gives further context and understanding to the answers provided in this section.
50. Thank you for completing this section. You can now choose to continue with the survey from here, or navigate back to the contents page to select another section to complete.
Section 5: Selfhauled Household Waste
Weight (tonnes)
council shop charity scrap metal dealer other
Furniture gfedc gfedc gfedc gfedc
White goods gfedc gfedc gfedc gfedc
Ewastes (computers, TVs, AV equipment etc)
gfedc gfedc gfedc gfedc
Motor vehicles gfedc gfedc gfedc gfedc
Lawn mowers and other gardening equipment
gfedc gfedc gfedc gfedc
Bricabrac, toys and other small items
gfedc gfedc gfedc gfedc
Gas bottles gfedc gfedc gfedc gfedc
55
66
*
If other selected please specify destination for each material
55
66
Go back to contents page
nmlkj
Continue with survey
nmlkj
RTI DL R
ELEASE - E
HP
13-033 File B. 67 of 124

Page 19
Local Government Waste Management Report 2012Local Government Waste Management Report 2012Local Government Waste Management Report 2012Local Government Waste Management Report 2012
Periodic Council* collections from households of large / bulky items that are not collected via the regular kerbside bin service. Note: This section does not include segregated green waste collected by Council*.
51. Does Council* provide a periodic collection service (e.g. once per year) for large / bulky household household waste items?
Section 6: Household Bulky Waste Collection
*
yes
nmlkj
no
nmlkj
RTI DL R
ELEASE - E
HP
13-033 File B. 68 of 124

Page 20
Local Government Waste Management Report 2012Local Government Waste Management Report 2012Local Government Waste Management Report 2012Local Government Waste Management Report 2012
Details of Household Bulky Item Waste Collected by Council* Volume to weight conversion for bulky item waste 150 kg per m3. 52. Amount of household bulky item waste collected by Council*. Please list seperate amounts for normal collections and disaster waste collections, and please specify the amounts by weight.
53. Amount of household bulky item waste disposed of in Council* landfill or incinerated. Please specify the amount by weight.
54. Amount of household bulky item waste disposed of in external landfills (ie. sent to another council or to a private landfill). Please specify the amount by weight.
55. Is any of the household bulky item waste recovered / diverted from landfill?
Section 6: Household Bulky Waste Collection
Normal collections (tonnes)
Disaster waste collections (tonnes)
Weight (tonnes)
Weight (tonnes)
*
yes
nmlkj
no
nmlkj
RTI DL R
ELEASE - E
HP
13-033 File B. 69 of 124

Page 21
Local Government Waste Management Report 2012Local Government Waste Management Report 2012Local Government Waste Management Report 2012Local Government Waste Management Report 2012
Houlsehold Bulky Item Waste Reprocessed by Council*. Volume to weight conversion for household bulky item waste 150 kg per m3. 56. Amount of household bulky item waste recovered / diverted from landfill. Please specify the amount by weight.
57. Please provide any additional information which gives further context and understanding to the answers provided in this section.
58. Thank you for completing this section. You can now choose to continue with the survey from here, or navigate back to the contents page to select another section to complete.
Section 6: Household Bulky Item Waste Collection
Weight (tonnes)
55
66
*
Go back to contents page
nmlkj
Continue with survey
nmlkj
RTI DL R
ELEASE - E
HP
13-033 File B. 70 of 124

Page 22
Local Government Waste Management Report 2012Local Government Waste Management Report 2012Local Government Waste Management Report 2012Local Government Waste Management Report 2012
Paper and Packaging Materials Collected or Received by Council* for Recycling.
59. Does Council* collect/receive paper and packaging materials for recycling?
Section 7: Paper and Packaging Materials Recycling
*
Yes
nmlkj
No
nmlkj
RTI DL R
ELEASE - E
HP
13-033 File B. 71 of 124

Page 23
Local Government Waste Management Report 2012Local Government Waste Management Report 2012Local Government Waste Management Report 2012Local Government Waste Management Report 2012
Kerbside Collection of Paper and Packaging Materials for Recycling
60. Does Council* provide kerbside recycling collection services for paper and packaging materials (e.g. using yellow lidded bins)?
Section 7: Paper and Packaging Materials Recycling
*
Yes
nmlkj
No
nmlkj
RTI DL R
ELEASE - E
HP
13-033 File B. 72 of 124

Page 24
Local Government Waste Management Report 2012Local Government Waste Management Report 2012Local Government Waste Management Report 2012Local Government Waste Management Report 2012
Details of Kerbside Collection Service for Paper and Packaging Material Recycling.
61. How many households are provided with a kerbside recycling collection service by Council* (as at 30/6/2012)?
62. What is the average presentation rate (%) for Council*’s kerbside recycling collection service? (That is, the average proportion of households provided with a kerbside recycling service that participate in the collection.)
63. What type of container does Council* provide residents for kerbside recycling? (Please note you can select multiple options.)
64. If known, how many households are served by each type of container?
Section 7a: Kerbside Collection for Paper and Packaging Materials for Recyc...
Number of households
Average presentation rate (%)
240 litre bins
360 litre bins
240 litre split bins
Bulk bins
Bags
Crates
Other (please specify)
240 litre bins
gfedc
360 litre bins
gfedc
240 litre split bins
gfedc
Bulk bins
gfedc
Bags
gfedc
Crates
gfedc
Other (please specify)
RTI DL R
ELEASE - E
HP
13-033 File B. 73 of 124

Page 25
Local Government Waste Management Report 2012Local Government Waste Management Report 2012Local Government Waste Management Report 2012Local Government Waste Management Report 201265. How often does Council* provide the kerbside recycling collection service? (Please note you can select multiple options.)
66. What is the average annual cost (to the nearest dollar) per household to the Council* to provide the kerbside recycling collection service?
67. What is the average annual fee (to the nearest dollar) charged per household by Council* for the kerbside recycling collection service? (If Council levies a combined waste and recycling fee, please provide an estimate of the recycling component of the fee.)
68. How many nonresidential premises (e.g. businesses) are provided with a recycling collection service for paper and packaging materials?
69. What is the average annual cost (to the nearest dollar) per nonresidential premise to the Council* to provide the recycling collection service for paper and packaging material?
70. What is the annual fee (to the nearest dollar) charged to nonresidential premises for the recycling collection service for paper and packaging material? (If Council levies a combined waste and recycling fee, please provide an estimate of the recycling component of the fee.)
71. How many schools are provided with a recycling collection service for paper and packaging materials by Council*?
Average annual cost ($)
Separate recycling fee ($)
Recycling component of combined fee ($)
Number of premises
Average annual cost ($)
Separate recycling fee ($)
Recycling component of combined fee ($)
Number of schools
Daily
gfedc
Weekly
gfedc
Once per fortnight
gfedc
Monthly
gfedc
Other (please specify)
RTI DL R
ELEASE - E
HP
13-033 File B. 74 of 124

Page 26
Local Government Waste Management Report 2012Local Government Waste Management Report 2012Local Government Waste Management Report 2012Local Government Waste Management Report 201272. Contamination. What was the estimated proportion of the materials collected via the kerbside service that were not supposed to be placed in the recycling bins, such as food scraps and cigarette butts.
73. Please provide any further information which gives further context and understanding to the answers provided in this section.
55
66
<5 (%)
nmlkj
>5 (%) to 10 (%)
nmlkj
>10 (%) to 15 (%)
nmlkj
>15 (%) to 20 (%)
nmlkj
>20 (%)
nmlkj
RTI DL R
ELEASE - E
HP
13-033 File B. 75 of 124

Page 27
Local Government Waste Management Report 2012Local Government Waste Management Report 2012Local Government Waste Management Report 2012Local Government Waste Management Report 2012
Provision of Dropoff Points to Receive Paper and Packaging Materials for Recycling.
74. Does Council* provide public place recycling bins for paper and packaging materials in public parks, sports venues etc, or dropoff points at landfills and transfer stations?
Section 7b: Dropoff Points for Paper and Packaging Materials for Recycling
*
Yes
nmlkj
No
nmlkj
RTI DL R
ELEASE - E
HP
13-033 File B. 76 of 124

Page 28
Local Government Waste Management Report 2012Local Government Waste Management Report 2012Local Government Waste Management Report 2012Local Government Waste Management Report 2012
Details of Dropoff Points to Receive Paper and Packaging Materials for Recycling.
75. What types of sites have public place recycling bins provided by Council*? Please note you can select multiple options.
76. How many public place recycling bins (including dropoff points at landfills and transfer stations) are provided by Council* to receive paper and packaging materials.
77. What is the estimated percentage of all the paper and packaging materials collected/received by Council* for recycling that was collected via the public place bins and dropoff points?
78. Contamination. What was the estimated proportion of the materials collected in public place recycling bins that were not supposed to be placed in those bins, such as food scraps and cigarette butts.
79. Please provide any further information which gives further context and understanding to the answers provided in this section.
Section 7b: Dropoff Points for Paper and Packaging Materials for Recycling
Number of bins
Percent collected
55
66
Parks
gfedc
Sporting grounds
gfedc
Footpaths
gfedc
Pedestrian malls
gfedc
Transfer stations / landfills
gfedc
Other (please specify)
<5 (%)
nmlkj
>5 (%) to 10 (%)
nmlkj
>10 (%) to 15 (%)
nmlkj
>15 (%) to 20 (%)
nmlkj
>20 (%)
nmlkj
RTI DL R
ELEASE - E
HP
13-033 File B. 77 of 124

Page 29
Local Government Waste Management Report 2012Local Government Waste Management Report 2012Local Government Waste Management Report 2012Local Government Waste Management Report 2012
Process Path for Paper and Packaging Materials
80. How does Council* manage the paper and packaging materials collected / received for recycling? (Please note that you can select more than one option.)
81. Please provide the address details of the MRFs receiving the paper and packaging material collected by Council*
Section 7c: Management of Paper and Packaging Materials
*
55
66
Material is collected and transported by a Council vehicle to a MRF operated by Council
gfedc
Material is collected and transported by a contractor to a MRF operated by Council
gfedc
Material is collected and transported by a Council vehicle to a MRF operated by another Council
gfedc
Material is collected and transported by a contractor to a MRF operated by another Council
gfedc
Material is collected and transported by a Council vehicle to a privately operated MRF
gfedc
Material is collected and transported by a contractor to a privately operated MRF
gfedc
RTI DL R
ELEASE - E
HP
13-033 File B. 78 of 124

Page 30
Local Government Waste Management Report 2012Local Government Waste Management Report 2012Local Government Waste Management Report 2012Local Government Waste Management Report 2012
Amounts of Paper and Packaging Materials Processed
82. Please indicate whether you are able to provide data for individual materials or whether you can only provide combined figures. Please note that the option you choose will determine the next set of questions.
Section 7d: Amounts of Paper and Packaging Materials Processed
*
Full material breakdown e.g. separate amounts for paper, cardboard, glass, plastics, steel cans and aluminium cans.
nmlkj
Only as 'Total amount of paper and packaging'
nmlkj
RTI DL R
ELEASE - E
HP
13-033 File B. 79 of 124

Page 31
Local Government Waste Management Report 2012Local Government Waste Management Report 2012Local Government Waste Management Report 2012Local Government Waste Management Report 2012
Details of Paper and Cardboard Processed
83. Can you provide paper amounts separately from cardboard amounts?
Section 7d: Amounts of Paper and Packaging Materials Processed Paper and...
*
Yes
nmlkj
No
nmlkj
RTI DL R
ELEASE - E
HP
13-033 File B. 80 of 124

Page 32
Local Government Waste Management Report 2012Local Government Waste Management Report 2012Local Government Waste Management Report 2012Local Government Waste Management Report 2012
Combined Paper and Cardboard.
Please complete this section if you are only able to supply a combined paper and cardboard figure.
Volume to weight conversion factors: Loose Paper and Cardboard Cardboard: 59 kg/m3 Paper:.......257 kg/m3 75% Cardboard, 25% Paper: 109 kg/m3 50% Cardboard, 50% Paper: 158 kg/m3 25% Cardboard, 75% Paper: 208 kg/m3 Baled Paper and Cardboard Baled Paper: ...... 510 kg/m3 Baled Cardboard: 534 kg/m3 84. Estimated total amount of paper and cardboard collected / received. Please specify the amount by weight.
85. Estimated amount of paper and cardboard recycled (excluding discarded material). Please specify the amount by weight.
86. Estimated amount of paper and cardboard discarded. Please specify the amount by weight.
87. Reasons for disposal of paper and cardboard. Please note you can select more than one option.
Section 7d: Amounts of Paper and Packaging Materials Processed Paper and...
Weight (tonnes)
Weight (tonnes)
Weight (tonnes)
Contamination
gfedc
Cost
gfedc
Contractual issues
gfedc
Other
gfedc
Please specify
55
66
RTI DL R
ELEASE - E
HP
13-033 File B. 81 of 124

Page 33
Local Government Waste Management Report 2012Local Government Waste Management Report 2012Local Government Waste Management Report 2012Local Government Waste Management Report 2012
Amount of Paper Processed Volume to weight conversion factors: Loose Paper: 257 kg/m3 Baled Paper: 510 kg/m3 88. Total amount of paper collected / received. Please specify the amount by weight.
89. Estimated amount of paper recycled (excluding discarded material). Please specify the amount by weight.
90. Estimated amount of paper discarded. Please specify the amount by weight.
91. Reasons for disposal of paper. Please note you can select more than one option.
Section 7d: Amounts of Paper and Packaging Materials Processed Paper
Weight (tonnes)
Weight (tonnes)
Weight (tonnes)
Contamination
gfedc
Cost
gfedc
Contractual issues
gfedc
Other (please specify)
55
66
RTI DL R
ELEASE - E
HP
13-033 File B. 82 of 124

Page 34
Local Government Waste Management Report 2012Local Government Waste Management Report 2012Local Government Waste Management Report 2012Local Government Waste Management Report 2012
Amount of Cardboard Processed Volume to weight conversion factors: Loose Cardboard: 59 kg/m3 Baled Cardboard: 534 kg/m3 92. Estimated total amount of cardboard collected / received. Please specify the amount by weight.
93. Estimated amount of cardboard recycled (excluding discarded material). Please specify the amount by weight.
94. Estimated amount of cardboard discarded. Please specify the amount by weight.
95. Reasons for disposal of cardboard. Please note you can select more than one option.
Section 7d: Amounts of Paper and Packaging Materials Processed Cardboard
Weight (tonnes)
Weight (tonnes)
Weight (tonnes)
Contamination
gfedc
Cost
gfedc
Contractual issues
gfedc
Other (please specify)
55
66
RTI DL R
ELEASE - E
HP
13-033 File B. 83 of 124

Page 35
Local Government Waste Management Report 2012Local Government Waste Management Report 2012Local Government Waste Management Report 2012Local Government Waste Management Report 2012
Amount of Glass Processed Volume to weight conversion factors: Glass bottles:.... 356 kg/m3 Crushed glass: 1,187 kg/m3 96. Estimated amount of glass collected / received. Please specify the amount by weight.
97. Estimated amount of glass recycled (excluding discarded material). Please specify the amount by weight.
98. Estimated amount of glass discarded. Please specify the amount by weight.
99. Reasons for disposal of glass. Please note you can select more than one option.
Section 7d: Amounts of Paper and Packaging Materials Processed Glass
Weight (tonnes)
Weight (tonnes)
Weight (tonnes)
Contamination
gfedc
Cost
gfedc
Contractual issues
gfedc
Other (please specify)
55
66
RTI DL R
ELEASE - E
HP
13-033 File B. 84 of 124

Page 36
Local Government Waste Management Report 2012Local Government Waste Management Report 2012Local Government Waste Management Report 2012Local Government Waste Management Report 2012
Amount of Plastics Processed Volume to weight conversion factors: Loose Containers PET: 21 kg/m3 HDPE: 14 kg/m3 Mixed Plastics: 19 kg/m3 Baled Containers PET: 311 kg/m3 HDPE: 267 kg/m3 Mixed Plastics: 295 kg/m3 100. Estimated total amount of plastics collected / received. Please specify the amount by weight.
101. If known, estimated amount of PET collected / received. Please specify the amount by weight.
102. If known, estimated amount of HDPE collected / received. Please specify the amount by weight.
103. If known, estimated amount of other mixed plastics collected / received. Please specify the amount by weight.
104. Estimated amount of plastics recycled (excluding discarded material). Please specify the amount by weight.
105. Estimated amount of plastics discarded. Please specify the amount by weight.
Section 7d: Amounts of Paper and Packaging Materials Processed Plastics
Weight (tonnes)
Weight (tonnes)
Weight (tonnes)
Weight (tonnes)
Weight (tonnes)
Weight (tonnes)
RTI DL R
ELEASE - E
HP
13-033 File B. 85 of 124

Page 37
Local Government Waste Management Report 2012Local Government Waste Management Report 2012Local Government Waste Management Report 2012Local Government Waste Management Report 2012106. Reasons for disposal of plastics. Please note you can select more than one option.
Contamination
gfedc
Cost
gfedc
Contractual issues
gfedc
Other (please specify)
RTI DL R
ELEASE - E
HP
13-033 File B. 86 of 124

Page 38
Local Government Waste Management Report 2012Local Government Waste Management Report 2012Local Government Waste Management Report 2012Local Government Waste Management Report 2012
Amount of Steel Cans Processed Volume to weight conversion factors: Loose Steel Cans: 89 kg/m3 Baled Steel Cans: 504 kg/m3 107. Estimated total amount of steel cans collected / received. Please specify the amount by weight.
108. Estimated amount of steel cans recycled (excluding discarded material). Please specify the amount by weight.
109. Estimated amount of steel cans discarded. Please specify the amount by weight.
110. Reasons for disposal of steel cans. Please note you can select more than one option.
Section 7d: Paper and Packaging Materials Processed Steel Cans
Weight (tonnes)
Weight (tonnes)
Weight (tonnes)
Contamination
gfedc
Cost
gfedc
Contractual issues
gfedc
Other (please specify)
RTI DL R
ELEASE - E
HP
13-033 File B. 87 of 124

Page 39
Local Government Waste Management Report 2012Local Government Waste Management Report 2012Local Government Waste Management Report 2012Local Government Waste Management Report 2012
Amount of Aluminium Cans Processed Volume to weight conversion factors: Loose Aluminium Cans:. 37 kg/m3 Baled Aluminium Cans: 202 kg/m3 111. Estimated total amount of aluminium cans collected / received. Please specify the amount by weight.
112. Estimated amount of aluminium cans recycled (excluding discarded material). Please specify the amount by weight.
113. Estimated amount of aluminium cans discarded. Please specify the amount by weight.
114. Reasons for disposal of aluminium cans. Please note you can select more than one option.
115. Please provide any further information which gives further context and understanding to the answers provided in this section.
116. Thank you for completing this section. You can now choose to continue with the survey from here, or navigate back to the contents page to select another section to complete.
Section 7d: Paper and Packaging Materials Processed Aluminium Cans
Weight (tonnes)
Weight (tonnes)
Weight (tonnes)
55
66
*
Contamination
gfedc
Cost
gfedc
Contractual issues
gfedc
Other (please specify)
Go back to contents page
nmlkj
Continue with survey
nmlkj
RTI DL R
ELEASE - E
HP
13-033 File B. 88 of 124

Page 40
Local Government Waste Management Report 2012Local Government Waste Management Report 2012Local Government Waste Management Report 2012Local Government Waste Management Report 2012
Total Amount of Paper and Packaging Materials Processed
Please complete this part if you are only able to supply combined paper and packaging figures.
Volume to weight conversion factors: Loose Paper: 257 kg/m3 Cardboard: 59 kg/m3 Glass: 356 kg/m3 Plastics: 19 kg/m3 Steel Cans: 89 kg/m3 Aluminium Cans: 37 kg/m3 Baled/Crushed Paper: 510 kg/m3 Cardboard: 534 kg/m3 Glass: 1,186 kg/m3 Plastics: 295 kg/m3 Steel Cans: 504 kg/m3 Aluminium Cans: 202 kg/m3 117. Which of the following materials did Council process?
118. Total amount of paper and packaging collected / received. Please specify the amount by weight.
119. Total amount of paper and packaging recycled excluding discarded material). Please specify the amount by weight.
120. Total amount of paper and packaging discarded. Please specify the amount by weight.
Section 7d: Amounts of Processed Paper and Packaging Materials Total
Weight (tonnes)
Weight (tonnes)
Weight (tonnes)
Paper
gfedc
Cardboard
gfedc
Glass
gfedc
Plastics
gfedc
Steel cans
gfedc
Aluminium cans
gfedc
RTI DL R
ELEASE - E
HP
13-033 File B. 89 of 124

Page 41
Local Government Waste Management Report 2012Local Government Waste Management Report 2012Local Government Waste Management Report 2012Local Government Waste Management Report 2012121. Reasons for disposal of paper and packaging. Please note you can select more than one option.
122. Please provide any further information which gives further context and understanding to the answers provided in this section.
123. Thank you for completing this section. You can now choose to continue with the survey from here, or navigate back to the contents page to select another section to complete.
55
66
*
Contamination
gfedc
Cost
gfedc
Contractual issues
gfedc
Other (please specify)
Go back to contents page
nmlkj
Continue with survey
nmlkj
RTI DL R
ELEASE - E
HP
13-033 File B. 90 of 124

Page 42
Local Government Waste Management Report 2012Local Government Waste Management Report 2012Local Government Waste Management Report 2012Local Government Waste Management Report 2012
Management of Segregated Green Waste (Vegetation) Vegetation and untreated timber not mixed with other wastes
124. Does Council* provide a regular (e.g. weekly or once per fortnight) kerbside green waste collection service?
Section 8: Segregated Green Waste
*
Yes
nmlkj
No
nmlkj
RTI DL R
ELEASE - E
HP
13-033 File B. 91 of 124

Page 43
Local Government Waste Management Report 2012Local Government Waste Management Report 2012Local Government Waste Management Report 2012Local Government Waste Management Report 2012
Regular Kerbside Collection of Segregated Green Waste
125. How many households have a regular kerbside green waste collection service (as at 30/6/2012)?
126. Contamination. What was the estimated proportion of the materials collected via the kerbside service that were not supposed to be placed in the recycling bins, such as food scraps, packaging materials or other general household waste.
Section 8: Segregated Green Waste
Number of households
<5 (%)
nmlkj
>5 (%) to 10 (%)
nmlkj
>10 (%) to 15 (%)
nmlkj
>15 (%) to 20 (%)
nmlkj
>20 (%)
nmlkj
RTI DL R
ELEASE - E
HP
13-033 File B. 92 of 124

Page 44
Local Government Waste Management Report 2012Local Government Waste Management Report 2012Local Government Waste Management Report 2012Local Government Waste Management Report 2012
Details of Segregated Green Waste Volume to weight conversion factors: Grass clippings (uncompacted): ....... 237 kg/m3 Mixed garden waste (uncompacted): 247 kg/m3 Mixed garden waste (compacted):.... 460 kg/m3 Large limbs and stumps (loose) ........ 640 kg/m3 127. Amount of segregated green waste collected / received by Council*. Please list seperate amounts for normal collections/deliveries and disaster waste collections/deliveries, and please specify the amounts by weight.
128. What proportion of the (normal) segregated green waste was delivered by commercial operators? (percentage)
129. Amount of segregated green waste disposed of in council landfill or incinerated. Please specify the amount by weight.
130. Amount of segregated green waste disposed of in external landfills (ie. sent to another council or to a private landfill). Please specify the amount by weight.
131. Is any of the green waste recovered or diverted from landfill?
Section 8: Segregated Green Waste
Normal collections/deliveries (tonnes)
Disaster waste collections/deliveries (tonnes)
Proportion commercial delivered (%)
Weight (tonnes)
Weight (tonnes)
*
Yes
nmlkj
No
nmlkj RTI DL R
ELEASE - E
HP
13-033 File B. 93 of 124

Page 45
Local Government Waste Management Report 2012Local Government Waste Management Report 2012Local Government Waste Management Report 2012Local Government Waste Management Report 2012
Segregated Green Waste Recovered or Diverted from Landfill Volume to weight conversion factors: Grass clippings (uncompacted): ....... 237 kg/m3 Mixed garden waste (uncompacted): 247 kg/m3 Mixed garden waste (compacted):.... 460 kg/m3 Large limbs and stumps (loose) ........ 640 kg/m3 132. Amount of segregated green waste recovered by Council*. Please specify the amount by weight.
133. How was the green waste recovered?
134. Please supply contact details (name and address) of wholesale recipients.
135. Please provide any further information which gives further context and understanding to the answers provided in this section.
Section 8: Segregated Green Waste
Weight (tonnes)
55
66
55
66
Mulched and used on council premises
gfedc
Mulched and sold / given to public
gfedc
Wastetoenergy
gfedc
Sent to composter
gfedc
Other (please specify)
RTI DL R
ELEASE - E
HP
13-033 File B. 94 of 124

Page 46
Local Government Waste Management Report 2012Local Government Waste Management Report 2012Local Government Waste Management Report 2012Local Government Waste Management Report 2012136. Thank you for completing this section. You can now choose to continue with the
survey from here, or navigate back to the contents page to select another section to complete.
*
Go back to contents page
nmlkj
Continue with survey
nmlkj
RTI DL R
ELEASE - E
HP
13-033 File B. 95 of 124

Page 47
Local Government Waste Management Report 2012Local Government Waste Management Report 2012Local Government Waste Management Report 2012Local Government Waste Management Report 2012
Biosolids Managed by Council* Volume to weight conversion factors: Wet biosolids: 721 kg/m3 Dry biosolids:. 560 kg/m3 137. Amount of biosolids collected/received by Council*. Please specify the amount by weight.
138. Amount of biosolids disposed of in Council landfills or incinerated. Please specify the amount by weight.
139. Amount of biosolids disposed of in external landfills (ie. sent to another council or to a private landfill). Please specify the amount by weight.
140. Are any of the biosolids recovered or diverted from landfill?
Section 9: Biosolids
Dry weight (tonnes)
Wet weight (tonnes)
Dry weight (tonnes)
Wet weight (tonnes)
Wet weight (tonnes)
Dry weight (tonnes)
*
Yes
nmlkj
No
nmlkj
RTI DL R
ELEASE - E
HP
13-033 File B. 96 of 124

Page 48
Local Government Waste Management Report 2012Local Government Waste Management Report 2012Local Government Waste Management Report 2012Local Government Waste Management Report 2012
Biosolids Recovered or Diverted from Landfill Volume to weight conversion: Wet biosolids: 721 kg/m3 Dry biosolids:. 560 kg/m3 141. Amount of biosolids recovered by Council*. Please specify the amount by weight.
142. How were the biosolids recovered?
143. Please supply contact details (name and address) of wholesale recipients.
144. Please provide any further information which gives further context and understanding to the answers provided in this section.
145. Thank you for completing this section. You can now choose to continue with the survey from here, or navigate back to the contents page to select another section to complete.
Section 9: Biosolids
Wet weight (tonnes)
Dry weight (tonnes)
55
66
55
66
*
Composted and used on council premises
gfedc
Wastetoenergy
gfedc
Sent to composter
gfedc
Other (please specify)
Go back to contents page
nmlkj
Continue with survey
nmlkj
RTI DL R
ELEASE - E
HP
13-033 File B. 97 of 124
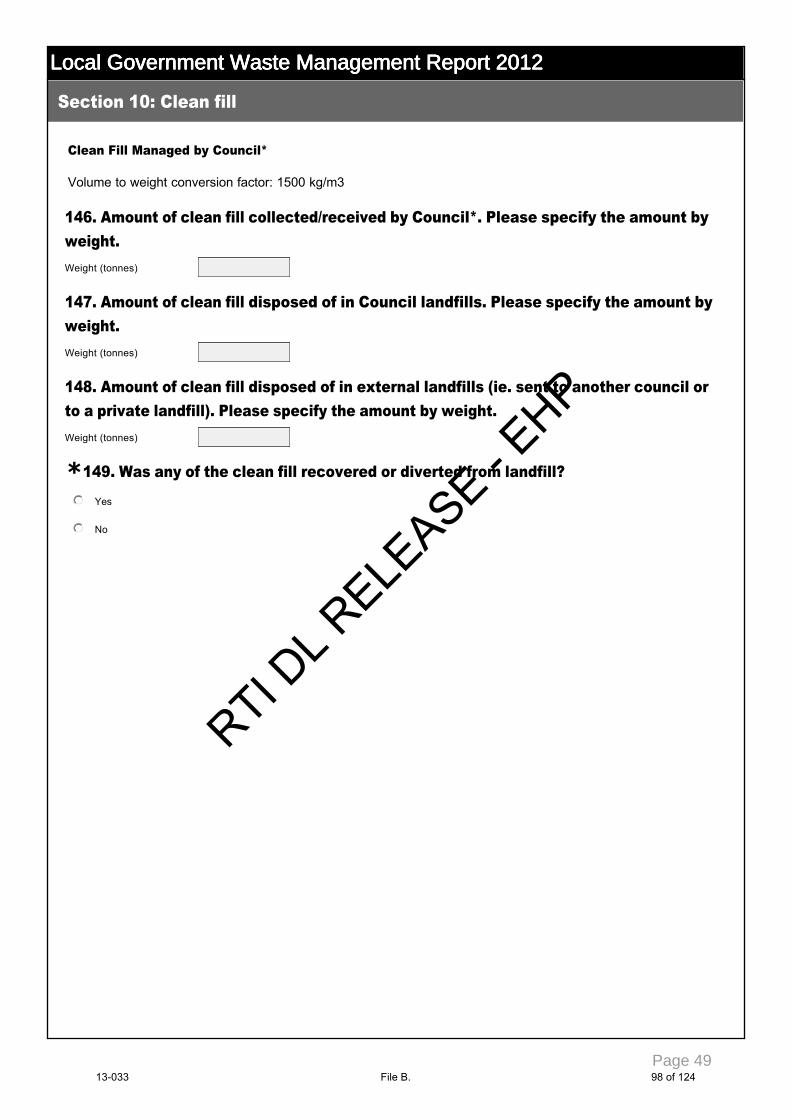
Page 49
Local Government Waste Management Report 2012Local Government Waste Management Report 2012Local Government Waste Management Report 2012Local Government Waste Management Report 2012
Clean Fill Managed by Council* Volume to weight conversion factor: 1500 kg/m3
146. Amount of clean fill collected/received by Council*. Please specify the amount by weight.
147. Amount of clean fill disposed of in Council landfills. Please specify the amount by weight.
148. Amount of clean fill disposed of in external landfills (ie. sent to another council or to a private landfill). Please specify the amount by weight.
149. Was any of the clean fill recovered or diverted from landfill?
Section 10: Clean fill
Weight (tonnes)
Weight (tonnes)
Weight (tonnes)
*
Yes
nmlkj
No
nmlkj
RTI DL R
ELEASE - E
HP
13-033 File B. 98 of 124

Page 50
Local Government Waste Management Report 2012Local Government Waste Management Report 2012Local Government Waste Management Report 2012Local Government Waste Management Report 2012
Clean Fill Recovered or Diverted From Landfill*. Volume to weight conversion factor: 1500 kg/m3 150. Amount of clean fill recovered by Council*. Please specify the amount by weight.
151. How was the clean fill used?
152. Please supply contact details (name and address) of wholesale recipients.
153. Please provide any further information which gives further context and understanding to the answers provided in this section.
154. Thank you for completing this section. You can now choose to continue with the survey from here, or navigate back to the contents page to select another section to complete.
Section 10: Clean fill
Weight (tonnes)
55
66
55
66
*
Used as daycover at landfills
gfedc
Sold to public / businesses
gfedc
Other (please specify)
Go back to contents page
nmlkj
Continue with survey
nmlkj
RTI DL R
ELEASE - E
HP
13-033 File B. 99 of 124
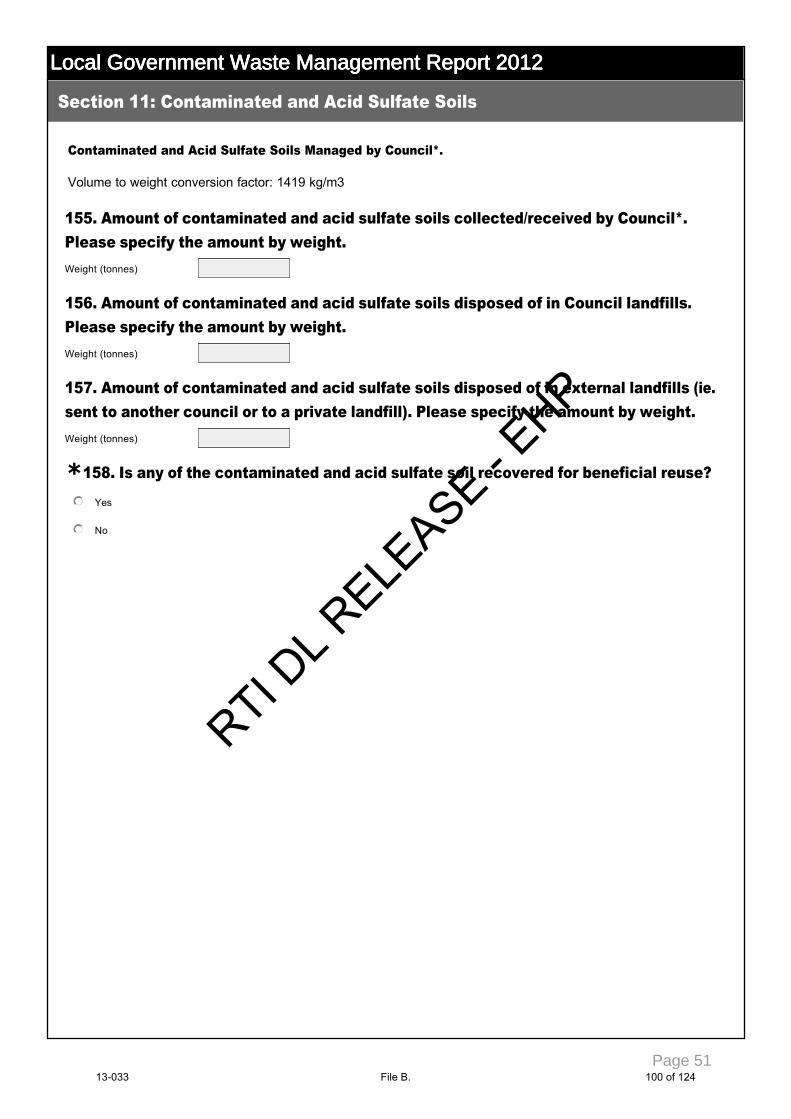
Page 51
Local Government Waste Management Report 2012Local Government Waste Management Report 2012Local Government Waste Management Report 2012Local Government Waste Management Report 2012
Contaminated and Acid Sulfate Soils Managed by Council*. Volume to weight conversion factor: 1419 kg/m3 155. Amount of contaminated and acid sulfate soils collected/received by Council*. Please specify the amount by weight.
156. Amount of contaminated and acid sulfate soils disposed of in Council landfills. Please specify the amount by weight.
157. Amount of contaminated and acid sulfate soils disposed of in external landfills (ie. sent to another council or to a private landfill). Please specify the amount by weight.
158. Is any of the contaminated and acid sulfate soil recovered for beneficial reuse?
Section 11: Contaminated and Acid Sulfate Soils
Weight (tonnes)
Weight (tonnes)
Weight (tonnes)
*
Yes
nmlkj
No
nmlkj
RTI DL R
ELEASE - E
HP
13-033 File B. 100 of 124

Page 52
Local Government Waste Management Report 2012Local Government Waste Management Report 2012Local Government Waste Management Report 2012Local Government Waste Management Report 2012
Contaminated and Acid Sulfate Soils Recovered or Diverted From Landfill. Volume to weight conversion factor: 1419 kg/m3 159. Amount of contaminated and acid sulfate soils recovered for beneficial reuse by Council*. Please specify the amount by weight.
160. How were the contaminated and acid sulfate soils treated?
161. How were the recovered contaminated and acid sulfate soils used?
162. Please supply contact details (name and address) of wholesale recipients.
163. Please provide any further information which gives further context and understanding to the answers provided in this section.
Section 11: Contaminated and Acid Sulfate Soils
Weight (tonnes)
55
66
55
66
55
66
Used as daycover at landfills
gfedc
Sold to public / businesses
gfedc
Other (please specify)
55
66
RTI DL R
ELEASE - E
HP
13-033 File B. 101 of 124

Page 53
Local Government Waste Management Report 2012Local Government Waste Management Report 2012Local Government Waste Management Report 2012Local Government Waste Management Report 2012164. Thank you for completing this section. You can now choose to continue with the
survey from here, or navigate back to the contents page to select another section to complete.
*
Go back to contents page
nmlkj
Continue with survey
nmlkj
RTI DL R
ELEASE - E
HP
13-033 File B. 102 of 124
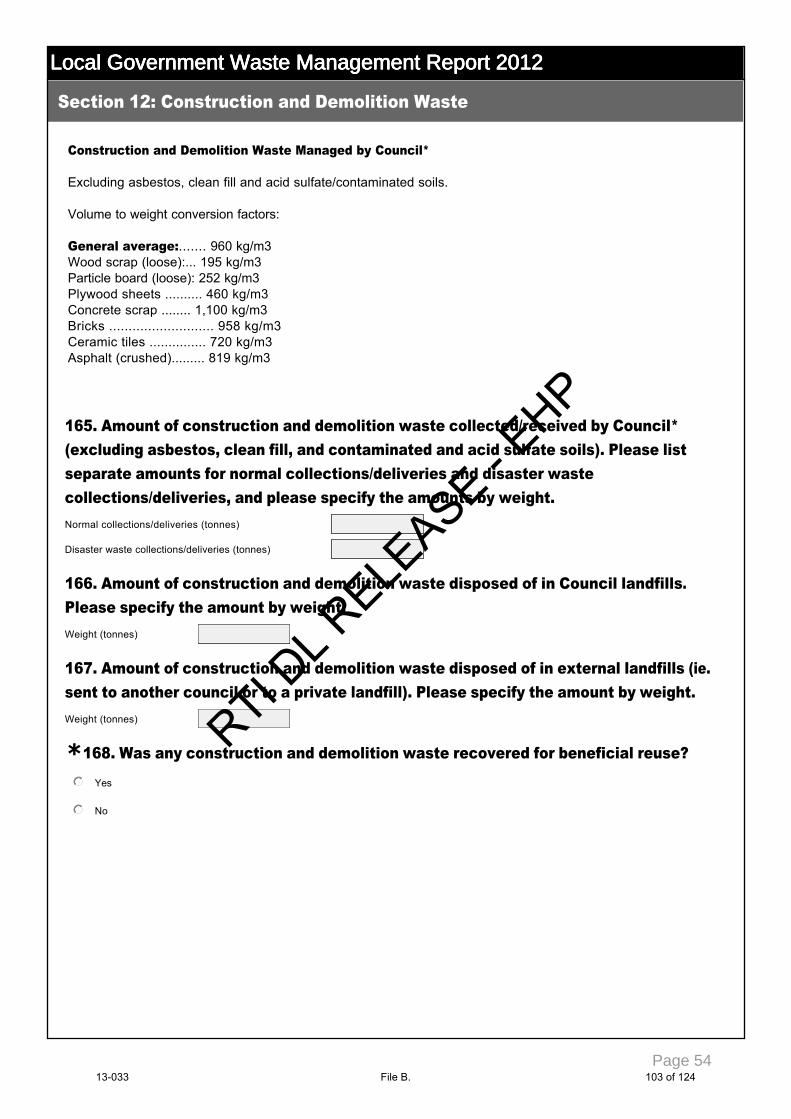
Page 54
Local Government Waste Management Report 2012Local Government Waste Management Report 2012Local Government Waste Management Report 2012Local Government Waste Management Report 2012
Construction and Demolition Waste Managed by Council* Excluding asbestos, clean fill and acid sulfate/contaminated soils. Volume to weight conversion factors: General average:....... 960 kg/m3 Wood scrap (loose):... 195 kg/m3 Particle board (loose): 252 kg/m3 Plywood sheets .......... 460 kg/m3 Concrete scrap ........ 1,100 kg/m3 Bricks ........................... 958 kg/m3 Ceramic tiles ............... 720 kg/m3 Asphalt (crushed)......... 819 kg/m3 165. Amount of construction and demolition waste collected/received by Council* (excluding asbestos, clean fill, and contaminated and acid sulfate soils). Please list separate amounts for normal collections/deliveries and disaster waste collections/deliveries, and please specify the amounts by weight.
166. Amount of construction and demolition waste disposed of in Council landfills. Please specify the amount by weight.
167. Amount of construction and demolition waste disposed of in external landfills (ie. sent to another council or to a private landfill). Please specify the amount by weight.
168. Was any construction and demolition waste recovered for beneficial reuse?
Section 12: Construction and Demolition Waste
Normal collections/deliveries (tonnes)
Disaster waste collections/deliveries (tonnes)
Weight (tonnes)
Weight (tonnes)
*
Yes
nmlkj
No
nmlkj
RTI DL R
ELEASE - E
HP
13-033 File B. 103 of 124

Page 55
Local Government Waste Management Report 2012Local Government Waste Management Report 2012Local Government Waste Management Report 2012Local Government Waste Management Report 2012
Construction and Demolition Waste Recovered/Diverted From Landfill. Volume to weight conversion factors: General average:....... 960 kg/m3 Wood scrap (loose):... 195 kg/m3 Particle board (loose): 252 kg/m3 Plywood sheets .......... 460 kg/m3 Concrete scrap ........ 1,100 kg/m3 Bricks ........................... 958 kg/m3 Ceramic tiles ............... 720 kg/m3 Asphalt (crushed)......... 819 kg/m3 169. Amount of construction and demolition waste recovered for beneficial reuse by Council*. Please specify the amount by weight.
170. How was the construction and demolition waste recovered?
171. Please supply contact details (name and address) of wholesale recipients.
172. Please provide any further information which gives further context and understanding to the answers provided in this section.
Section 12: Construction and Demolition Waste
Weight (tonnes)
55
66
55
66
Concrete crushed and used onsite
gfedc
Sold to public / businesses
gfedc
Other (please specify)
55
66
RTI DL R
ELEASE - E
HP
13-033 File B. 104 of 124

Page 56
Local Government Waste Management Report 2012Local Government Waste Management Report 2012Local Government Waste Management Report 2012Local Government Waste Management Report 2012173. Thank you for completing this section. You can now choose to continue with the
survey from here, or navigate back to the contents page to select another section to complete.
*
Go back to contents page
nmlkj
Continue with survey
nmlkj
RTI DL R
ELEASE - E
HP
13-033 File B. 105 of 124

Page 57
Local Government Waste Management Report 2012Local Government Waste Management Report 2012Local Government Waste Management Report 2012Local Government Waste Management Report 2012
Commercial and Industrial Waste Managed by Council* Excluding segregated green waste, construction and demolition waste, paper and packaging materials collected for recycling and regulated wastes. Volume to weight conversion factor: 267 kg/m3 174. Amount of commercial and industrial waste collected/received by Council* (excluding construction and demolition waste, paper and packaging materials collected for recycling, segregated green waste and regulated wastes). Please list separate amounts for normal collections/deliveries and disaster waste collections/deliveries, and please specify the amounts by weight.
175. Amount of commercial and industrial waste disposed of in Council landfills or incinerated. Please specify the amount by weight.
176. Amount of commercial and industrial waste disposed of in external landfills (ie. sent to another council or to a private landfill). Please specify the amount by weight.
177. Was any commercial and industrial waste recovered for beneficial reuse?
Section 13: Commercial and Industrial Waste
Normal collections/deliveries (tonnes)
Disaster waste collections/deliveries (tonnes)
Recycling residuals (tonnes)
Weight (tonnes)
Weight (tonnes)
*
Yes
nmlkj
No
nmlkj
RTI DL R
ELEASE - E
HP
13-033 File B. 106 of 124

Page 58
Local Government Waste Management Report 2012Local Government Waste Management Report 2012Local Government Waste Management Report 2012Local Government Waste Management Report 2012
Commercial and Industrial Waste Recovered or Diverted From Landfill. Volume to weight conversion factor: 267 kg/m3
178. Amount of commercial and industrial waste recovered for beneficial reuse by Council*. Please specify the amount by weight.
179. How was the commercial and industrial waste recovered?
180. Please supply contact details (name and address) of wholesale recipients.
181. Please provide any further information which gives further context and understanding to the answers provided in this section.
182. Thank you for completing this section. You can now choose to continue with the survey from here, or navigate back to the contents page to select another section to complete.
Section 13: Commercial and Industrial Waste
Weight (tonnes)
55
66
55
66
*
Putrescible material sent to composter
gfedc
Scrap metal sold to recycler
gfedc
Sold to public / businesses
gfedc
Other (please specify)
Go back to contents page
nmlkj
Continue with survey
nmlkj
RTI DL R
ELEASE - E
HP
13-033 File B. 107 of 124

Page 59
Local Government Waste Management Report 2012Local Government Waste Management Report 2012Local Government Waste Management Report 2012Local Government Waste Management Report 2012
Tyres Managed by Council* Conversion factors: Volume to weight: 132 kg/m3 Car tyres:............... 10 kg/tyre Truck tyres: ........... 32 kg/tyre 183. Amount of tyres collected/received by Council*. Please specify the amount by weight.
184. Amount of tyres disposed of in Council landfills. Please specify the amount by weight.
185. Amount of tyres disposed of in external landfills (ie. sent to another council or to a private landfill). Please specify the amount by weight.
186. Amount of tyres in stockpile (as at 30/6/2012). Please specify the amount by either volume, weight or number of tyres.
187. Were any tyres recovered or diverted from landfill?
Section 14: Tyres
Weight (tonnes)
Weight (tonnes)
Weight (tonnes)
Weight (tonnes)
*
Yes
nmlkj
No
nmlkj
RTI DL R
ELEASE - E
HP
13-033 File B. 108 of 124

Page 60
Local Government Waste Management Report 2012Local Government Waste Management Report 2012Local Government Waste Management Report 2012Local Government Waste Management Report 2012
Tyres Diverted from Landfill Conversion factors: Volume to weight: 132 kg/m3 Car tyres:............... 10 kg/tyre Truck tyres: ........... 32 kg/tyre 188. Amount of tyres recovered by Council*. Please specify the amount by weight.
189. How were the tyres reprocessed?
190. Please supply contact details (name and address) of wholesale recipients.
191. Please provide any further information which gives further context and understanding to the answers provided in this section.
Section 14: Tyres
Weight (tonnes)
55
66
55
66
Processed by council and used internally
gfedc
Sold to recycler
gfedc
Given to recycler
gfedc
Paid recycler to remove
gfedc
Other (please specify)
RTI DL R
ELEASE - E
HP
13-033 File B. 109 of 124

Page 61
Local Government Waste Management Report 2012Local Government Waste Management Report 2012Local Government Waste Management Report 2012Local Government Waste Management Report 2012192. Thank you for completing this section. You can now choose to continue with the
survey from here, or navigate back to the contents page to select another section to complete.
*
Go back to contents page
nmlkj
Continue with survey
nmlkj
RTI DL R
ELEASE - E
HP
13-033 File B. 110 of 124

Page 62
Local Government Waste Management Report 2012Local Government Waste Management Report 2012Local Government Waste Management Report 2012Local Government Waste Management Report 2012
Mineral (motor) Oil Managed by Council* Volume to weight conversion factor: 0.9 kg/litre (0.0009 tonnes/litre) 193. Amount of mineral (motor) oil collected/received by Council*. Please specify the amount by weight.
194. Amount of mineral (motor) oil in storage (as at 30/6/2012). Please specify the amount by weight.
195. Was any mineral (motor) oil recycled?
Section 15: Mineral (motor) Oil
Weight (tonnes)
Weight (tonnes)
*
Yes
nmlkj
No
nmlkj
RTI DL R
ELEASE - E
HP
13-033 File B. 111 of 124

Page 63
Local Government Waste Management Report 2012Local Government Waste Management Report 2012Local Government Waste Management Report 2012Local Government Waste Management Report 2012
Mineral (motor) Oil Recycled by Council* Volume to weight conversion factor: 0.9 kg/litre (0.0009 tonnes/litre) 196. Amount of oil recycled by Council*. Please specify the amount by weight.
197. How was the oil recycled?
198. Please supply contact details (name and address) of wholesale recipients
199. Please provide any further information which gives further context and understanding to the answers provided in this section.
200. Thank you for completing this section. You can now choose to continue with the survey from here, or navigate back to the contents page to select another section to complete.
Section 15: Mineral (motor) Oil
Weight (tonnes)
55
66
55
66
*
Processed by council and used internally
gfedc
Sold to recycler
gfedc
Given to recycler
gfedc
Recycler paid to remove
gfedc
Other (please specify)
Go back to contents page
nmlkj
Continue with survey
nmlkj
RTI DL R
ELEASE - E
HP
13-033 File B. 112 of 124

Page 64
Local Government Waste Management Report 2012Local Government Waste Management Report 2012Local Government Waste Management Report 2012Local Government Waste Management Report 2012
Lead Acid Batteries Managed by Council* Conversion factors: Drained car batteries:...... 7 kg Undrained car batteries: 18 kg
201. Amount of lead acid batteries collected/received by Council*. Please specify the amount by weight.
202. Amount of lead acid batteries in storage (as at 30/6/2012). Please specify the amount by weight.
203. Were any lead acid batteries recycled?
Section 16: Lead Acid Batteries
Weight (tonnes)
Weight (tonnes)
*
Yes
nmlkj
No
nmlkj
RTI DL R
ELEASE - E
HP
13-033 File B. 113 of 124

Page 65
Local Government Waste Management Report 2012Local Government Waste Management Report 2012Local Government Waste Management Report 2012Local Government Waste Management Report 2012
Lead Acid Batteries Recovered by Council* Conversion factors: Drained car batteries:...... 7 kg Undrained car batteries: 18 kg 204. Amount of lead acid batteries recycled by Council*. Please specify the amount by weight.
205. How were the lead acid batteries recycled?
206. Please supply contact details (name and addresses) of wholesale recipients.
207. Please provide any further information which gives further context and understanding to the answers provided in this section.
208. Thank you for completing this section. You can now choose to continue with the survey from here, or navigate back to the contents page to select another section to complete.
Section 16: Lead Acid Batteries
Weight (tonnes)
55
66
55
66
*
Sold to recycler
gfedc
Given to recycler
gfedc
Paid recycler to remove
gfedc
Other (please specify)
Go back to contents page
nmlkj
Continue with survey
nmlkj
RTI DL R
ELEASE - E
HP
13-033 File B. 114 of 124

Page 66
Local Government Waste Management Report 2012Local Government Waste Management Report 2012Local Government Waste Management Report 2012Local Government Waste Management Report 2012
Asbestos Managed by Council* Volume to weight conversion factor: 223 kg/m3 209. Amount of asbestos collected/received by Council*. Please list separate amounts for normal collections/deliveries and disaster waste collections/deliveries, and please specify the amounts by weight.
210. Amount of asbestos disposed of in Council landfills. Please specify the amount by weight.
211. Amount of asbestos disposed of in external landfills (ie. sent to another council or to a private landfill). Please specify the amount by weight.
212. Please provide any further information which gives further context and understanding to the answers provided in this section.
213. Thank you for completing this section. You can now choose to continue with the survey from here, or navigate back to the contents page to select another section to complete.
Section 17: Asbestos
Normal collections/deliveries (tonnes)
Disaster waste collections/deliveries (tonnes)
Weight (tonnes)
Weight (tonnes)
55
66
*
Go back to contents page
nmlkj
Continue with survey
nmlkj
RTI DL R
ELEASE - E
HP
13-033 File B. 115 of 124

Page 67
Local Government Waste Management Report 2012Local Government Waste Management Report 2012Local Government Waste Management Report 2012Local Government Waste Management Report 2012
Clinical Waste Managed by Council* Volume to weight conversion factor: 133 kg/m3 214. Amount of clinical waste collected/received by Council*. Please specify the amount by weight.
215. Amount of clinical waste disposed of in Council landfills or incinerated. Please specify the amount by weight.
216. Amount of clinical waste disposed of in external landfills (ie. sent to another council or to a private landfill). Please specify the amount by weight.
217. Amount of clinical waste sent to destinations other than landfill. Please specify the amount by weight.
218. Please provide any further information which gives further context and understanding to the answers provided in this section.
219. Thank you for completing this section. You can now choose to continue with the survey from here, or navigate back to the contents page to select another section to complete.
Section 18: Clinical Waste
Weight (tonnes)
Weight (tonnes)
Weight (tonnes)
Weight (tonnes)
55
66
*
Go back to contents page
nmlkj
Continue with survey
nmlkj
RTI DL R
ELEASE - E
HP
13-033 File B. 116 of 124

Page 68
Local Government Waste Management Report 2012Local Government Waste Management Report 2012Local Government Waste Management Report 2012Local Government Waste Management Report 2012
Household, farm and industrial hazardous chemicals managed by Council* Volume to weight conversion factor: 0.9 kg/litre (900kg/m3) 220. Amount of household, farm or industrial hazardous chemicals collected/received by Council*. Please specify the amount by weight.
221. Please supply contact details (name and address) of the waste treatment / disposal companies receiving these chemicals.
222. Please provide any further information which gives further context and understanding to the answers provided in this section.
223. Thank you for completing this section. You can now choose to continue with the survey from here, or navigate back to the contents page to select another section to complete.
Section 19: Household, farm and industrial hazardous chemicals
Weight (tonnes)
55
66
55
66
*
Go back to contents page
nmlkj
Continue with survey
nmlkj
RTI DL R
ELEASE - E
HP
13-033 File B. 117 of 124

Page 69
Local Government Waste Management Report 2012Local Government Waste Management Report 2012Local Government Waste Management Report 2012Local Government Waste Management Report 2012
Electronic Waste Managed by Council*
224. Does council divert electronic wastes from disposal?
Section 20: Electronic Waste
*
Yes
nmlkj
No
nmlkj
RTI DL R
ELEASE - E
HP
13-033 File B. 118 of 124

Page 70
Local Government Waste Management Report 2012Local Government Waste Management Report 2012Local Government Waste Management Report 2012Local Government Waste Management Report 2012
Electronic Waste Diverted From Landfill
225. Which electronic wastes are diverted from disposal?
226. Please supply contact details (name and address) of the companies receiving these electronic wastes.
227. Please provide any further information which gives further context and understanding to the answers provided in this section.
228. Thank you for completing this section. You can now choose to continue with the survey from here, or navigate back to the contents page to select another section to complete.
Section 20: Electronic Waste
*
55
66
55
66
*
Televisions, DVD players, VCR players, other audio equipment etc
gfedc
Computers, printers, modems, scanners etc
gfedc
Mobile phones, batteries and other accessories
gfedc
Digital cameras, GPS devices, audio recorders, batteries and other accessories
gfedc
Other (please specify)
55
66
Go back to contents page
nmlkj
Continue with survey
nmlkj
RTI DL R
ELEASE - E
HP
13-033 File B. 119 of 124

Page 71
Local Government Waste Management Report 2012Local Government Waste Management Report 2012Local Government Waste Management Report 2012Local Government Waste Management Report 2012
Cross boundary waste movements wastes received
229. Did Council* receive waste from another council or private landfill for final disposal?
Section 21: Cross boundary waste movements
*
Yes
nmlkj
No
nmlkj
RTI DL R
ELEASE - E
HP
13-033 File B. 120 of 124

Page 72
Local Government Waste Management Report 2012Local Government Waste Management Report 2012Local Government Waste Management Report 2012Local Government Waste Management Report 2012
Cross boundary waste movements wastes received.
230. Please identify the other councils forwarding waste to Council* and provide details of the wastes (types and amounts) received from each of those councils.
231. Please provide any further information which gives further context and understanding to the answers provided in this section.
232. Thank you for completing this section. You can now choose to continue with the survey from here, or navigate back to the contents page to select another section to complete.
Section 21: Cross boundary waste movements
*
55
66
55
66
*
Go back to contents page
nmlkj
Continue with survey
nmlkj RTI DL R
ELEASE - E
HP
13-033 File B. 121 of 124

Page 73
Local Government Waste Management Report 2012Local Government Waste Management Report 2012Local Government Waste Management Report 2012Local Government Waste Management Report 2012
233. Please describe any new waste management initiatives implemented by Council* during the past financial year.
234. Thank you for completing this section. You can now choose to continue with the survey from here, or navigate back to the contents page to select another section to complete.
Section 22: Waste Management Initiatives.
55
66
*
Go back to contents page
nmlkj
Continue with survey
nmlkj
RTI DL R
ELEASE - E
HP
13-033 File B. 122 of 124

Page 74
Local Government Waste Management Report 2012Local Government Waste Management Report 2012Local Government Waste Management Report 2012Local Government Waste Management Report 2012
235. Please describe any waste issues that you would like to report to DEHP. (For example, has there been a spike in illegal dumping? Are there emerging problems with markets for particular recovered materials? Is Council receiving large volumes of waste from workers' camps? etc.)
236. If you would like to provide feedback on the survey, please insert comments here.
237. Would you like a copy of the data you have entered sent to you?
Section 23: Feedback
55
66
55
66
*
Yes please
nmlkj
No thank you
nmlkjRTI D
L RELE
ASE - EHP
13-033 File B. 123 of 124

Page 75
Local Government Waste Management Report 2012Local Government Waste Management Report 2012Local Government Waste Management Report 2012Local Government Waste Management Report 2012
If you have completed all the available sections and wish to submit your survey results, please click the submit button. Please note that submitting the survey will mean that you will no longer have access to questions, so you should only do this once you have finalised all your answers. Thank you for completing this survey. Should you require any further information, please contact Laurence Knight (ph 3339 5816, email [email protected] ) or Stephen Murray (ph 3339 5819, email [email protected]).
238. Please provide the date when you completed this survey in the following format (DD/MM/YYYY).
Submit Survey
Date completed
RTI DL R
ELEASE - E
HP
13-033 File B. 124 of 124