rst 0814 close 08-12-14 - wordpress.com · please see general disclaimers on the last page of this...
TRANSCRIPT

Please see General Disclaimers on the last page of this report.
Current Environment ............................................................................................ 1
Industry Profile .................................................................................................... 13
Industry Trends ................................................................................................... 17
How the Industry Operates ............................................................................... 26
Key Industry Ratios and Statistics ................................................................... 31
How to Analyze a Restaurant Company ......................................................... 33
Glossary ................................................................................................................ 39
Industry References ........................................................................................... 40
Comparative Company Analysis ...................................................................... 41
This issue updates the one dated January 2014.
Industry Surveys Restaurants Efraim Levy, CFA, Restaurants Equity Analyst
AUGUST 2014
CONTACTS:
INQUIRIES & CLIENT RELATIONS 800.852.1641 clientrelations@ standardandpoors.com
SALES 877.219.1247 [email protected]
MEDIA Michael Privitera 212.438.6679 [email protected]
S&P CAPITAL IQ 55 Water Street New York, NY 10041

Topics Covered by Industry Surveys
Aerospace & Defense
Airlines
Alcoholic Beverages & Tobacco
Apparel & Footwear: Retailers & Brands
Autos & Auto Parts
Banking
Biotechnology
Broadcasting, Cable & Satellite
Chemicals
Communications Equipment
Computers: Commercial Services
Computers: Consumer Services & the Internet
Computers: Hardware
Computers: Software
Electric Utilities
Environmental & Waste Management
Financial Services: Diversified
Foods & Nonalcoholic Beverages
Healthcare: Facilities
Healthcare: Managed Care
Healthcare: Pharmaceuticals
Healthcare: Products & Supplies
Heavy Equipment & Trucks
Homebuilding
Household Durables
Household Nondurables
Industrial Machinery
Insurance: Life & Health
Insurance: Property-Casualty
Investment Services
Lodging & Gaming
Metals: Industrial
Movies & Entertainment
Natural Gas Distribution
Oil & Gas: Equipment & Services
Oil & Gas: Production & Marketing
Paper & Forest Products
Publishing & Advertising
Real Estate Investment Trusts
Restaurants
Retailing: General
Retailing: Specialty
Semiconductors & Equipment
Supermarkets & Drugstores
Telecommunications
Thrifts & Mortgage Finance
Transportation: Commercial
Global Industry Surveys
Airlines: Asia
Autos & Auto Parts: Europe
Banking: Europe
Food Retail: Europe
Foods & Beverages: Europe
Media: Europe
Oil & Gas: Europe
Pharmaceuticals: Europe
Telecommunications: Asia
Telecommunications: Europe
S&P Capital IQ Industry Surveys
55 Water Street, New York, NY 10041
CLIENT SUPPORT: 1-800-523-4534
VISIT THE S&P CAPITAL IQ WEBSITE: www.spcapitaliq.com
S&P CAPITAL IQ INDUSTRY SURVEYS (ISSN 0196-4666) is published weekly. Redistribution or reproduction in whole or in part (including inputting into a computer) is prohibited without written permission. To learn more about Industry Surveys and the S&P Capital IQ product offering, please contact our Product Specialist team at 1-877-219-1247 or visit getmarketscope.com. Executive and Editorial Office: S&P Capital IQ, 55 Water Street, New York, NY 10041. Officers of McGraw Hill Financial: Douglas L. Peterson, President, and CEO; Jack F. Callahan, Jr., Executive Vice President, Chief Financial Officer; John Berisford, Executive Vice President, Human Resources; D. Edward Smyth, Executive Vice President, Corporate Affairs; Charles L. Teschner, Jr., Executive Vice President, Global Strategy; and Kenneth M. Vittor, Executive Vice President and General Counsel. Information has been obtained by S&P Capital IQ INDUSTRY SURVEYS from sources believed to be reliable. However, because of the possibility of human or mechanical error by our sources, INDUSTRY SURVEYS, or others, INDUSTRY SURVEYS does not guarantee the accuracy, adequacy, or completeness of any information and is not responsible for any errors or omissions or for the results obtained from the use of such information. Copyright © 2014 Standard & Poor's Financial Services LLC, a part of McGraw Hill Financial. All rights reserved. STANDARD & POOR’S, S&P, S&P 500, S&P MIDCAP 400, S&P SMALLCAP 600, and S&P EUROPE 350 are registered trademarks of Standard & Poor’s Financial Services LLC. S&P CAPITAL IQ is a trademark of Standard & Poor’s Financial Services LLC.

INDUSTRY SURVEYS RESTAURANTS / AUGUST 2014 1
CURRENT ENVIRONMENT
Bad weather hurts first quarter sales
The restaurant industry posted sales growth despite a weak performance in the first quarter of 2014, largely due to cautious consumer spending, sluggish economic growth, and bad weather. Severe winter in many parts of the country kept people at home, and rising heating bills contributed to already limited consumer discretionary spending, according to the Wall Street Journal. In March 2014, the Thomson Reuters/University of Michigan’s consumer index released its final reading of 80 (the lowest level since November 2013), which showed consumer expectations slipped to 70.0 from 72.7 in February. Consumer spending in the US accounts for 70% of total economic output. The drop in sentiment suggests that Americans have become more pessimistic about the economy, primarily because of higher home-heating bills and gasoline prices that hindered their buying capacity.
The MillerPulse restaurant survey from Nation’s Restaurant News (NRN), an industry publication, reports that overall industrywide same-store sales, on a year-over-year basis, remained flat at 0.1% in January and February 2014. Same-store sales were disappointing in the first two months of the year, dropping to a three-and-a-half year low. However, same-store sales rose 1.8% in March as the weather improved, and 1.7% in April, aided by the favorable timing of Easter week.
The quick-service segment outperformed casual dining in January 2014, and has generally held up well over the past three years. Same-store sales for fast-food restaurants increased 1.6% in January, while both fast- casual and casual dining restaurants decreased 0.9%, respectively. In February, same-store sales in the fast-food segment increased 2.3%, while casual dining restaurants fell 1.0% and fast-casual restaurants recorded a 0.5% increase in same-store sales.
In March 2014, Black Box Intelligence and People Report (a benchmarking and research firm established by restaurant industry veterans) stated that overall same-store sales growth in restaurants for January and February registered -9% and -7%, respectively. The full-service segment showed a 0.4% increase in same-store sales in March 2014. Fast-casual restaurants also reported a same-store sales increase of 0.5%, while the casual dining segment saw same-store sales decline 0.2%. Fast food reported the best trends, with same-store sales of 4.8% in March, followed by fine dining same-store sales of 4%. In April, fast food continued to lead with same-store sales for the segment increasing 3.2%. Same-store sales in the casual dining segment fell 0.3%, while the fast-casual segment showed an increase of 1.5% in same-store sales.
US traffic declines in the first quarter, but sales pick up slightly in March and April Besides a sluggish economic recovery, some restaurant operators blamed the weak sales on the record-cold temperatures, snow and ice spread across many parts of the US since mid-December 2013. According to NRN, industrywide traffic fell 1.4% in February 2014 compared with a 2.2% decline in January. Although same-store sales increased in March, guest traffic fell 1.1%, and fast food was the only segment to show positive guest traffic, with an increase of 0.8%. Weak traffic trends continued in the restaurant industry in April, and fell 1.8% for the sixth consecutive month of declines.
St. Louis-based Panera Bread Co. said “severe weather” affected its restaurants, yielding only a 0.1% increase in company-owned same-store sales for the first quarter of 2014, compared with the prior-year period. McDonald’s Corp. reported that profit slipped 1.7% in the first quarter of 2014 (compared with the same period in 2013), as customer traffic declined due to “challenging industry dynamics” and bad weather.
Yum! Brands, Inc. reported an overall same-store sales decline in the first quarter of 2014, partially offset by declining guest traffic; by division, sales of KFC, Pizza Hut, and Taco Bell declined 3%, 5%, and 1%, respectively. In March 2014, Darden Restaurants, Inc. announced a 1.1% decline in blended same-restaurant sales and a decline of 5.6% for Olive Garden, Red Lobster (which Darden has subsequently agreed to sell to Golden Gate Capital, as of May 16, 2014) and LongHorn Steakhouse, and a same-

2 RESTAURANTS / AUGUST 2014 INDUSTRY SURVEYS
restaurant sales decline of 0.7% for the company’s Specialty Restaurant Group. In the same quarter, US same-restaurant sales declined 5.4%, 8.8%, and 0.7% at Olive Garden, Red Lobster and the Specialty Restaurant Group, respectively. Meanwhile, LongHorn Steakhouse showed a 0.3% increase in same-restaurant sales. Darden attributed the results to the adverse effect of the more severe winter weather and the adverse effect of a shift in the Thanksgiving holiday week.
On a brighter side, Starbucks Corp.’s first quarter for the fiscal 2014 results showed comparable stores sales growth of 5%, driven by a 4% increase in traffic. With solid traffic growth, it puts the company in the position as one of the few consumer brands that were able to remain strong amid the economic challenges.
SNAP assistance cut hurts some sectors The Supplemental Nutrition Assistance Program (SNAP), also known as food stamp program, is the nation’s most important anti-hunger program. In 2013, it helped more than 47 million low income Americans to afford a nutritionally adequate diet. The average recipient received about $133 a month in fiscal 2013. In response to the economic downturn, on February 7, 2014, President Barack Obama signed the legislation (known as the Farm Bill) that will cut SNAP benefits by $8.7 billion over the next decade, causing 850,000 households in 17 states to lose an average of $90 per month in benefits.
On May 13, 2014, the Wall Street Journal reported that the number of Americans receiving food stamps is dropping, with more than 1.2 million people moving out of the program between October 2013 and February 2014. Wal-Mart Stores Inc., the world’s largest retailer, said the cut in food stamp support hit its November 2013 to January 2014 fourth quarter earnings, resulting in mediocre sales of $128.8 billion, up by a tepid 1.4%. Income was $4.4 billion, down 21% from the same period last year. Despite the holiday season, the bad weather and deeper-than-expected cuts in SNAP benefits kept consumers away.
Generally, SNAP benefits may not be used to purchase food at restaurants, according to Section 4014 of the Nutrition Provision of Agricultural Act of 2014. States that elect to operate a private restaurant meal program are required to submit plans and reports to the US Department of Agriculture (USDA), showing how the needs of homeless, elderly, and disabled clients are met. However, the benefits free up other funds that can be used at restaurants. Therefore, with the cut in budget, families who used to dine in restaurants will probably limit their visits; hence, restaurant revenues will be affected.
Recovery in Europe and China While the restaurant industry in the US has seen weak sales and lower traffic, other parts of the world, particularly Europe and China, have experienced an increase in sales.
McDonald’s Corp. reported that global comparable sales increased 0.9% in May 2014. Asia-Pacific, the Middle East, and Africa (APMEA) and Europe were up 2.5% and 0.4%, respectively. APMEA’s comparable sales growth reflected strong results in China (despite the negative impact of avian influenza in 2013) and positive performance across a number of markets (as offset by ongoing weakness in Japan). In Europe, positive performance in the UK and France has boosted sales (as offset by negative results in Germany).
Yum! Brands, Inc. reported a total revenue increase of 20% to $1.38 billion in the first quarter of 2014, while same-store sales grew 9%, including growth of 11% at KFC and 8% at Pizza Hut casual dining. The company’s China division opened 123 new units in the first quarter of 2014 and plans to open about 700 new restaurants during the year.
CORPORATE ACTION
From time to time, companies revisit their strategic plans to remain competitive in the industry. The same is true in the restaurant industry, as big names such as McDonald’s, Panera Bread, and Darden Restaurants made significant decisions that could greatly affect not only their specific businesses, but the restaurant industry as a whole.
In May 2014, McDonald’s Corp. announced its plan to return between $18 and $20 billion to shareholders of record from 2014 to 2016, either in the form of dividends or by repurchase of shares. The company

INDUSTRY SURVEYS RESTAURANTS / AUGUST 2014 3
reiterated that its philosophy on the use of capital remains unchanged—to focus on reinvestment to drive sales and cash flow, while generating strong returns.
Panera Bread announced on June 5, 2014, that its board of directors approved a new three-year share repurchase program of up to $600 million. We think this move should provide some support to the share price.
In May 2014, Darden Restaurants agreed to sell Red Lobster restaurant chain to Golden Gate Capital for $2.1 billion, with net cash proceeds of $1.6 billion. (In January 2014, an initial divestment plan was announced as part of its value creation plans). This proposal was met with various reactions from the investing community, which felt that the transaction was contrary to the interests of the shareholders. It was also alleged that the proposed sale does not disclose the asset’s true value.
Interestingly, more than the company’s internal issues, Darden needs to satisfy price-conscious consumers now that there are many choices available among the competing line of restaurants, such as Panera Bread, Chipotle, and Buffalo Wild Wings. These industry players have grabbed Darden’s market share by providing value meal offerings that are affordable, without having to lower their prices. Red Lobster puts downward pressure on Darden’s sales, earnings, and margin growth, due to the lowered price-range ($13–$16) that it recently offered to attract more customers.
Darden’s plan to divest Red Lobster—a seafood restaurant with a well-known brand and market potential—was in accordance with its comprehensive strategy to enhance shareholders value, according to the company’s December 19, 2013 news release. Yet, Red Lobster has been characterized by anemic traffic in the past two years. Darden was faced with the challenge of how to make Red Lobster’s menu more appealing to its customers’ growing and constantly changing preferences. Generally, consumers look for price affordability, and Red Lobster already had a lowered-range price menu. Consumers look for more choices and variety—Red Lobster had improved its menu versions in 2012 and introduced non-seafood entrees under $15, known as “Maine Stays.” Unlike other segments, Red Lobster (belonging to the fast-casual segment), faced the challenge of defining its customer base and how to serve them. To remain competitive, the company would have benefited from defining its competitors.
Standard & Poor Capital IQ (S&P) thinks that the business-spending environment has become more favorable, enabling acquisition opportunities to be considered. Companies are now more focused on raising dividends (McDonalds recently announced that it would pay dividends to its shareholders), buying back stocks (in June 2014, Panera Bread announced its buyback plan through 2015), and buying existing business (in May 2014, Sentinel Capital Partners acquired Carlson’s TGI Fridays).
A SLOW-GROWING US ECONOMY
Following the 2008–2009 recession, the recovery of the US economy has been slow. Growth in real US gross domestic product (GDP) decreased to an annual rate of 2.9% in the first quarter of 2014, following the effects of the winter storms, which resulted in a slowdown in consumer spending. For 2013, overall real GDP growth was 1.9%, compared with 2.8% in 2012 and 1.8% in 2011. In the third and fourth quarters of 2013, real GDP growth was 2.9% and 2.6%, respectively. S&P cut the US economy’s growth forecast for 2014 to 2.6% below the 3.1% forecast it made in the third quarter of 2013.
While the US economy contracted in the first quarter of 2014, Standard & Poor’s Economics (which operates separately from S&P Capital IQ) expects the economy to regain some lost ground, boosting real GDP growth to 2.3% in 2014 and 3.1% in 2015. GDP growth has been erratic, and we note that it is significantly below the rate of growth experienced in prior economic recoveries.
Unemployment levels, which reached an historic peak at 10.0% in October 2009, have been trending down for the past four years. The unemployment rate in 2012 declined from 8.2% in January to 7.9% in December. It has fallen further in 2013, and stood at 7.2% in October. The unemployment rate dropped 6.1% in June 2014 from 6.7% in December 2013. S&P expects the average unemployment rates to be 6.5% and 6.0% in 2014 and 2015, respectively.

4 RESTAURANTS / AUGUST 2014 INDUSTRY SURVEYS
While changes in the unemployment rate are usually a good indicator for assessing the jobs market, we think that a drop in the labor participation rate has skewed this metric recently. Standard & Poor’s Economics deems that a significant portion of the decline in the unemployment rate is the result of workers withdrawing from the labor force—either because they are discouraged from seeking new jobs or have volunteered to take early retirement. Thus, we think that the number of jobs created, along with the unemployment rate, provides a more complete picture of the jobs market.
As the unemployment rate dropped from 7.9% in January 2013 to 7.2% in October, nonfarm payroll employment increased by an average of 197,000 per month over the prior 12 months, which was below the increase of about 200,000 per month needed for additional job entrants into the labor market. After five straight months of more than 200,000, total nonfarm payroll employment increased by 288,000 in June 2014. Restaurant employment gains remained robust, with the industry adding a net 31,700 jobs on a seasonally adjusted basis primarily due to growth in number of locations. According to NRN, in addition to the anticipation of staffing gains, both full-service and quick-service operators are reporting plans to expand staffing levels, a sign that the restaurant industry will continue to grow in the months ahead.
CONSUMERS STILL CAUTIOUS
Consumers’ real disposable personal income (DPI) increased 0.2% in May 2014, due primarily to government social benefit payments based on the Affordable Care Act (ACA) provisions, and private payroll and salary increases. Real personal consumption expenditures (PCE) decreased 0.1% in May 2014, compared with a decrease of 0.2% in April. As of June 2014, S&P was expecting real PCE to grow by 3% and 4% in 2014 and 2015, respectively.
The Conference Board’s Consumer Confidence Index (CCI) began 2012 with consumer confidence of 61.5 in January. It stood at 78.1 in December 2013, and improved moderately to 83.0 in May 2014, up from 81.7 in April, as consumers became more positive about the outlook for the labor market. The May reading is only a few points below the 90-point level that is considered an indicator of a healthy economic environment where consumers engage in discretionary spending, such as eating at restaurants.
Most consumers seeking value… While we see a consumer bifurcation between high-end and low-end customers based on spending patterns, there is also a divide among consumers based on quality and price. Some consumers who believe that high quality or nutrition-rich food is more expensive prefer only value menu options. While a few restaurant operators focus on the quality subset, some want to target the value segment since it is much bigger. According to NRN, due to the weak economic situation, customers in the low-end segment are not willing to trade up from low-priced value items, as price is the most important factor for them.
…but some prefer quality Although most consumers want value, a smaller subset wants quality and is willing to forgo value. In addition, increasing health consciousness and expectations of high food quality are leading consumers toward independent restaurants. According to a study by Mintel Group Ltd., a global market research firm, consumers believe that independent restaurants offer better food quality and customized orders, as compared with chain restaurants. Some consumers who are concerned about value and convenience, and who are willing to trade down on quality, tend to prefer chain restaurants. However, some consumers are ready to pay more for the superior quality at independent restaurants.
Hence, to increase the average ticket check at their restaurants, operators are offering premium items to customers who currently opt for the high-priced menu items. These operators are adding more specialty items to their menu and pushing them, in addition to providing better services, to their high-end customers.
QUICK SERVICE: CUSTOMERS CHOOSE VALUE
Consumers have become more conscious about dining out, and many are choosing menus that offer the best value for money. In an attempt to provide additional value to existing and potential customers, quick-service restaurants are offering value meals, particularly during off-peak meal times.

INDUSTRY SURVEYS RESTAURANTS / AUGUST 2014 5
Fast-food restaurants re-evaluating value menus Fast-food restaurants generally reported lackluster results in 2013, largely due to economic conditions and bad weather. McDonald’s, the top ranking fast-food chain, reported revenue of $7.09 billion in the fourth quarter of 2013, a 2% increase compared with the fourth quarter of 2012. The company reported $6.7 billion revenue for the first quarter of 2014, up about 1% from the previous quarter. In May 2014, although the US segment was down 1%, McDonald’s global comparable sales increased 0.9%. Fast-food conglomerate Yum! Brands, Inc. reported a decrease of 5.6% in profits for the fourth quarter of 2013, mainly due to higher costs in its Chinese KFC operations that offset increased revenue. Yum! Brands, Inc. reported that in the first quarter of 2014, worldwide system sales growth reached 4%, which included its China division system sales increase of 17%.
During the economic slowdown, companies are intensifying their efforts to gain more traffic. McDonald’s, in its first-quarter 2014 earnings call in April 2014, stated that it continues to focus on its value menu to spur growth and to remain relevant and appealing to its customers. To drive long-term growth, the company plans to emphasize three areas: optimizing the menu, modernizing the customer experience, and broadening accessibility to the McDonald’s brand around the world. The company has been concentrating its advertising efforts on supporting its value offerings, and is focusing on creating and adjusting its core menu favorites with new food and beverage offerings.
In its Annual Report for 2014, Yum! Brands, Inc. stated that it has an aggressive and comprehensive plan to restage the KFC brand in the second quarter, which includes breakthroughs and innovations in its products, and menu management of competitively priced food items. In China, 40% of Yum!’s Pizza Hut menu consists of Chinese food, which means that the company is not only offering pizza, but also a full array of Chinese menu options. Pizza Hut, Taco Bell, and KFC each offers a concept that has proprietary menu items and emphasizes the preparation of food with high quality ingredients as well as unique recipes at competitive prices. In the first week of June 2014, Taco Bell announced that it sold 100 million new nacho cheese flavored Doritos Locos Taco in just 10 weeks (making it the company’s most successful product launch in its 50-year history).
In May 2014, Wendy’s International Inc. introduced its new “Steakhouse Jr. Cheeseburger Deluxe” for $1.49 for a limited time. This latest addition to Wendy’s Right Price Right Size Menu, (where customers have the option to create an entire meal starting at 99 cents) is a component of the company’s ongoing brand transformation initiative.
Restaurants also are turning to smaller portions at lower price points as a way to attract customers. According to Technomic, consumers are comfortable with price points of $10, $15, or $20, especially during an economic downturn. They seek easy price points, along with simple menu options. Restaurants that target customers with a deal that they cannot turn down manage to increase their traffic, even when the economy is not doing great. However, such strategies are successful only until they do not become a customer expectation, the research firm noted. Although such a strategy will increase the guest traffic at the restaurant, it may not help to increase its profit. Technomic also noted that consumers find it difficult to pay the full price for an item if these easy price points exist in the market for a long period.
In mid-May 2014, McDonald’s offered the New World Cup Family Meal in Southern California, also known as “$15 Mickey D’s Value Pack.” Aside from Mickey D’s, McDonald’s is also offering a “buy one, get one free” deal on Big Macs after 9:00 PM in the same state. Close rivals, Starbucks and Taco Bell, both introduced breakfast items and value meal offers, and put McDonald’s dominance in the breakfast segment at risk. We think this contributed to the company’s sluggish sales in the first half of 2014.
Value menus squeeze margins Rising costs and weak pricing power remain key issues for the fast-food sector. Restaurant operators are caught between rising food costs and customers who want affordable menu offerings. In May, the USDA said overall US food price inflation for 2014, including food bought at grocery stores and restaurants, would rise by 2.5% to 3.5%, up from 2013 (when retail food prices were almost flat). As of June 2014, the food-at-home consumer price index (CPI) had already increased 2.7% over 2013.

6 RESTAURANTS / AUGUST 2014 INDUSTRY SURVEYS
Most restaurant operators are planning to raise their menu prices modestly over the next six months. According to a survey conducted by restaurant supply chain cooperative SpenDifference LLC in May 2014, 51% of respondents said they made no price adjustments during the first quarter of 2014, while those who did, raised menu prices less than 1% on average. Further, 93% of chains planned to raise prices 2% on average in 2014, primarily due to food costs. Around 57% said they would raise prices due to rising labor costs, including higher minimum wages. Even though these respondents believe consumers may be more willing to accept higher prices, the average planned price increase of 2.1% will not fully cover the expected food input cost inflation, considering that in the first quarter of 2014 alone, food costs increased 1.5%.
Thus, we think pricing pressure will continue in 2014 and affect margins at many restaurants as they continue to spend on advertising their products and launch promotional offers to increase traffic, besides revamping the prices of certain offerings. For the first five months of 2014, McDonald’s reported that restaurant sales for both company and franchised establishments were down 1%. The company’s worldwide comparable sales were up 0.9%. The APMEA region was the best performer, with an increase of 2.5% in comparable sales as of June 2014. China’s strong sales were offset by the negative effect of the avian influenza, while the APMEA uptick performance was partially offset by the ongoing weakness in Japan’s revenue. Since October 2013, the US has consistently showed negative revenues. However, in its first quarter of 2014 earnings call in April, McDonald’s CEO Don Thompson and CFO Pete Bensen indicated the company’s goal to initiate significant cost-cutting, which would hold margins steady in the absence of increased sales.
Catering services While some operators are focusing on drive-throughs as a means to boost sales, others are looking at catering services as a lucrative option for sales growth. In its first quarter of 2014 earnings call in April, Panera Bread Co. stated that it is geared to continue its core strategy to rollout delivery hubs (formerly known as catering hubs) and have them in place serving more than 10% of company cafés by the end of 2014.
In January 2013, Chipotle Mexican Grill Inc. launched a new catering program in Colorado that allows groups of 20 to 200 to customize their own individual meals, and expanded it to more than 200 locations. By October, the company had rolled out the program to all the remaining restaurants in the US (except in New York City, where it is expected to start in 2014). In May 2014, Chipotle announced impressive first quarter figures, recording 13.4% comparable sales growth. According to the company, sales were partly boosted by its catering services, which accounted for 1% of its total revenue.
Increased sales through the retail channel Some restaurants are augmenting their in-store sales by selling their branded goods, ranging from syrups to coffee, and frozen breakfasts to bakery products, through retail channels. Some operators, such as Starbucks, Dunkin’ Donuts, and TGI Friday’s, have been successfully selling their licensed retail products for years, according to NRN. Many new startups in the industry are including consumer-packaged goods (CPG) in their brand from the beginning in order to gain additional sales. Over the last two years, Starbucks has been focusing primarily on CPG by introducing products such as instant coffee, bottled juices, and K-Cup coffee, and is planning to introduce bakery products.
The trend of increased coffee consumption among the public has picked up in the last two years. However, the demand for coffee is not limited only to restaurants. Within the coffee segment, the single-serve cup coffee maker has gained huge popularity in the last two years. According to a survey—the 2014 edition of the National Coffee Drinking Trends—by the National Coffee Association’s (NCA), an industry trade group, around 29% of respondents who drank coffee said they used a single-cup brewer to get their daily caffeine fix, up nearly 9% from 2013. About 40% of respondents who used single-cup brewers said they had owned their system for a year or less.
Sales of Starbucks K-Cups at grocers grew 47% in the 12 months ending January 26, 2014, according to data from IRI, a market research firm. In addition to working with Green Mountain and its Keurig brewing systems, Starbucks launched its at-home premium single-cup machine, the Verismo system, in September 2012. According to our estimate, Starbucks has sold only 250,000 units so far, but the company is committed to its platform and planned to introduce a new machine with a fresh design and increased

INDUSTRY SURVEYS RESTAURANTS / AUGUST 2014 7
functionality. We think the Verismo system will help the company increase its presence in the premium single-cup-segment and give the company a greater opportunity to leverage its Starbucks brand. Other restaurants including Dunkin’ Donuts and Tim Hortons have launched their lines of K-Cup coffee packs for use with the Keurig brewing system, but have not achieved the same amount of sales as Starbucks.
In October 2013, Starbucks opened a $70 million juicery in California to increase production of Evolution Fresh Juices, a brand it acquired in November 2011. This juice is already available in more than 8,000 Starbucks locations across the US and in Whole Foods outlets. The company has also expanded its Teavana retail platform by opening a first-of-its-kind Teavana Fine Teas + Tea Bar in New York City in October 2013. The company opened a second tea bar in Seattle’s University Village in November 2013.
LABOR AND COMMODITY COSTS REMAIN A KEY FOCUS FOR RESTAURANTS
Higher labor costs continued to affect the retail food industry in 2014, as hourly compensation rose due to increases in the federal minimum wage. On June 20, 2014, the US Department of Labor issued a proposed set of regulations to implement Executive Order 13658, “Establishing a Minimum Wage for Contractors,” which President Obama signed on February 12, 2014, calling for an increase in the minimum wage for employees of federal contractors, set at $10.10 per hour. As a result, we are seeing many restaurant operators either raising prices to compensate or absorbing the wage increases themselves in order to maintain traffic. Since most restaurant chains compete with many other employers for the same employees, the increases in the minimum wage would likely put upward pressure on wages even for employees making more than the minimum.
We note that the increase in the minimum wage has affected some chains more than others. Some larger national chains, such as McDonald’s, already pay wages in excess of the mandated minimums to most of their employees. In addition, because numerous states already had a minimum wage that exceeded the new federal minimum, the impact of the increase was likely limited to those chains operating in states where the federal rate prevails. Chains like Texas Roadhouse Inc. that operate in regions where the average hourly wage is somewhat lower than the national average are likely to see labor costs rise more in line with the increase in the federal minimum wage.
Although the overall unemployment rate fell to 6.1% in June 2014, teenage joblessness remains stubbornly high. The unemployment rate for teenagers rose in June to 21%, up from the previous month. This rate could drop if the restaurant industry and other employers of large numbers of unskilled or inexperienced workers stick to their plan of hiring more employees during the rest of 2014. Optimism is reflected in the improved employment rate in the leisure and hospitality industry, which, as of June 2014, had increased by 39,000 over the past year, according to the Bureau of Labor Statistics (BLS). In the first quarter of 2014, labor costs increased 104.09 Index Points (IP) from 102.55 IP in the fourth quarter of 2013. Wages and salaries accounted for 70% of employment costs, and increased 0.6%.
Food commodity costs generally expected to rise; coffee prices rising According to the USDA, 2014 and beyond may see more volatility in supplies and food prices due to drought conditions in the summer, which were even worse than conditions in 2012. The main culprit is the parched land in California—the state experienced the driest year on record, following several prior years of drought. Long-term moisture deficits remained at near-record levels despite the recent series of major storms. California is the major producer of fruit, vegetable, tree nut, and dairy, hence food commodity prices are expected to increase.
In April 2014, the USDA revised its forecast for fresh fruit inflation due to the greening diseases in Florida and the Southern California freeze that reduced the US fresh orange crop in December 2013. In 2012, corn prices were more than 65% above their historic averages. According to the USDA, US corn production was around 10.8 billion bushels in 2012, down 13% from 2011 and the lowest level since 2006–2007. As weather conditions started to improve in 2013, major food crops like corn, soybean, and wheat had higher production than expected earlier according to a USDA grain stocks report. In March 2014, the USDA forecast that combined acres of corn, soybeans and wheat would drop 1.1 million from the same period last year.

8 RESTAURANTS / AUGUST 2014 INDUSTRY SURVEYS
Projected corn production for 2014–2015 remain unchanged at 13,935 million bushels, which yields at 165.3 bushels per acre due to slightly lower-than-normal mid-May planting progress expected to be offset
by very favorable season crop and weather conditions, according to the USDA. In the most recent Crop Progress report, US crop conditions are the best in four years and better than any time since 2007 for the Corn Belt. Since corn is a crucial feed, its price affects the prices of beef, pork, and chicken. According to a USDA cattle report published on January 1, 2014, all cattle and calves in the US totaled 87.7 million head, 2% below the 89.3 million on January 1, 2013, and marking the lowest inventory since the 82.1 million head counted in 1951. Cattle and calves on feed slaughter in all feedlots inventories stood at 12.7, down 5% year over year.
As of April 2014, beef prices continue to track much higher than a year ago. Beef processors were able to push wholesale
beef prices to record levels within the seven weeks of the first quarter in 2014. The weekly comprehensive cutout (which consists of beef cuts, grinds and trim) began the year at $201.20 per centum weight (cwt), and hit $238.21 in the last week of March 2014, marking a record high. In February 2014, the USDA projected that low beef inventories would limit recovery from the summer drought for several years, leading to declines in beef production through 2016. Beef cow numbers are expected to rise from 29 million head at the start of 2014 to over 33 million in 2022–2033.
US cheese prices climbed past the $2 per pound level at the start of 2014. According to National Dairy Market News, a USDA publication, the barrel cheese price stood at $1.78 in November 20, 2013, up 2.25 cents compared with the week earlier. The block cheese price remained at $1.88, up 4.5 cents from the previous week.
The International Coffee Organization (ICO), an intergovernmental body of coffee exporting and importing countries, reported that coffee prices in May 2014 averaged $1.64 per pound, a decline of 0.4% from April. In May 2014, the USDA posited that the decline in coffee production in Brazil was due to the negative impact of the prolonged drought and warm weather. It further noted that coffee exports for the year, estimated at 32.38 million bags would be 1% less compared with 2013. In January 2014, prices rose slightly to $1.11 per pound and have increased month-on-month since then to reach $1.71 per pound in April, their fourth highest level since 2011. In the first 10 weeks of 2014, coffee futures were up 80% due to the weather issues that plagued crops in Brazil.
Higher food costs also have increased the operating costs for restaurants. Owing to the weak economic scenario, most players have absorbed the higher input costs, adversely affecting their operating margins. Despite restaurant operators raising their menu prices below the rate of food inflation, there has been a shift in consumer spending in the category of “food purchased away from home” toward “home-cooked meals.” Restaurants now account for only 47% of the food dollar share; the remaining 53% is spent at supermarkets.
Will restaurants be able to raise prices more than we expect to offset cost increases—both anticipated and unanticipated? We think the current environment, in which very little pricing power exists, will persist through 2014. The importance of price as a competitive factor is greater than at any time in the past, and we see no end to the trend.
Chart H06: Beef Pork Poultry prices
75
100
125
150
175
200
225
2000 01 02 03 04 05 06 07 08 09 10 11 12 13 2014
Beef & veal Pork Chicken
BEEF, PORK, AND POULTRY PRICES(Index, 1982=100)
Source: US Bureau of Labor Statistics.

INDUSTRY SURVEYS RESTAURANTS / AUGUST 2014 9
As of April 14, 2014, the USDA estimated that food price inflation would return to a range closer to the historical norm, as inflationary pressures are expected to moderate and CPIs are expected to increase 2.5% to 3.5% over 2013 levels. S&P does not anticipate a dramatic pick-up in the rate of inflation that would force the Federal Reserve to alter its tapering or tightening timetable. However, should headline CPI begin to creep higher and faster than anticipated, history suggests that investors look to 4% as the “line in the sand.”
Restaurants are trying to keep labor costs in check amid wage debate Debate over raising the federal wages continues as many quick-service workers protest to raise the minimum wage. The restaurant industry, slowly recuperating from the recent economic challenges, is trying to keep labor costs in check. Considering that each state has its own minimum wage in place, the restaurant industry is caught between rising prices and protesting workers.
On May 30, 2014, the Washington Restaurant Association (WRA) reported that the Seattle City Council has approved an ordinance to increase the minimum wage to $15 an hour. The adoption of what would be the nation’s highest minimum wage has been criticized as being unfair to small franchises, according to the International Franchise Association, a Washington, D.C.-based business group. Further, a survey conducted by WRA (released in April 2014) stated that if the minimum wage increase of $15 were to be implemented, 80% of full-service respondents said they would lay off employees, close their business, declare bankruptcy, or close a location. Those who said they would lay off their employees came from full service (69%) and quick-service (49%) restaurants, while 45% of both full-service and quick-service restaurants said they would close their business or close a location.
In May 2014, fast-food workers protested nationwide against static wages and major restaurant companies such as McDonald’s, Burger King, and Wendy’s and demanded an increase in their wages of up to $15.00 per hour from a rate of $7.25 per hour, which is the federal minimum rate. However, these companies are reluctant to double their wages since that would affect their margins. According to a study by the Institute for Policy Studies, a Washington, D.C.–based think tank, the workers have not received a hike in the last 22 years. The main reason for this is that the $2.13 per hour tip wage has not changed since 1991. The study noted that Darden Restaurants reported $2.6 million sales per restaurant in 1991, when the tip wage was frozen. By 2013, the company’s sales per restaurant increased by 52% to reach $4.0 million, while the hourly pay of wait staff remained unchanged. According to the study, the only workers earning more are those employed at Darden’s fine dining Capital Grille restaurants and those working in states that have adopted a tip wage that is higher than federal minimum.
According to the latest “2013 Corporate Compensation and Benefits Survey,” released in August 2013 by People Report, a service-industry employment research firm, salaries for hourly restaurant employees and corporate positions are budgeted to increase on average by as much as 2.7% in 2013. In some states, waiters are earning more due to an increase in minimum wages. In September 2013, California approved an increase in its minimum wage to $10 per hour from $8 per hour by 2016. A total of 21 states, together with Washington, D.C., have already raised their minimum wage rates higher than the federal minimum. Currently, Washington has the highest minimum wage rate in the US; its rate is $9.32 per hour. Seattle will take over as the highest paying state, once its minimum wage rate of $15 per hour takes effect in 2017.
Restaurant menu price likely to rise in second half of 2014 As the minimum wage debate continues, there have been price increases in some food categories. However, businesses can only raise prices so much before customers become less willing to shell out. A recent survey conducted by SpenDifference reports that the restaurant industry is contemplating price hikes for the second half of 2014. Food costs are the main reason for the planned price increase, followed by labor costs (including higher minimum wages). Quick-service restaurants are the most aggressive among the restaurant segments, reflecting price increases of 0.5% in the first quarter of 2014.
We do not expect a dramatic pick-up in the rate of inflation, and neither do we expect price gains in 2014 to accelerate much. Consumers, both at home and abroad, remain cautious about spending, and unless the CPI starts to edge higher, our projection for 2014 and 2015 is 1.9% and 1.7%, respectively.

10 RESTAURANTS / AUGUST 2014 INDUSTRY SURVEYS
Wage inflation—minimum wage impact if raised nationally On June 16, 2014, the International Monetary Fund (IMF) cut its growth estimate for the US from 2.8% to 2.0% for 2014. The weak estimate is largely due to poor economic performance in the first quarter brought about by a severe winter. The fund still expects a 3% growth in 2015. The IMF urged the US to raise its minimum wage from the existing $7.25 per hour, stating that it would help raise the incomes of millions of poor, working Americans. This recommendation is expected to be well-received by the Obama administration, which has been pushing legislators to pass the H.R. 1010, known as the Fair Minimum Wage Act of 2013, that will increase the minimum wage to $10.10.
According to the New York Times, certain states have started working on their own minimum wage levels. Some of these states are below the current federal level, while about 25 states, including the District of Columbia, already have set minimum wage levels higher than the federal level. However, the wage increase proposal provoked opposing reactions from diverse small businesses and from the Republican governors of Maine, New Jersey, and New Mexico.
If the proposed minimum wage were to be implemented, different opinions as to who would be affected most would be heard on all sides of the ring. In an article published in February 2014, Journalist’s Resource discussed a seminal paper on scholarly debates over the minimum wage. The data indicated no evidence that the rise in New Jersey’s minimum wage would reduce employment at fast-food restaurants in the state. Moreover, since an expansion of the Expanded Income Tax Credit (EITC) is being planned, it is worth keeping in mind that this is a wage subsidy paid by taxpayers, and not by private firms.
According to a study from UC Berkeley and the University of Illinois at Urbana-Champaign in 2013, Fast Food, Poverty Wages: The Public Cost of Low-wage Jobs in the Fast-Food Industry, workers at McDonald’s and other major restaurant chains use federal and state programs at far higher rates than other workers. Furthermore, on March 26, 2014, the White House released a report about the impact raising the minimum wage would have on women, who account for 72% of all workers in a predominantly tipped occupation—restaurant servers, bartenders, and hairstylists. The report shows that raising the minimum wage would help reduce poverty among women and their families.
We think that the public supports the proposed minimum wage increase and that it would improve the living standards of low-income Americans. However, a chain reaction can be expected, as business owners will tend to charge more for products and services to offset the increase in labor costs, and this will ultimately affect consumers.
Minimum wage hikes closing stores The Congressional Budget Office (CBO) estimates that almost 500,000 jobs will be lost should the minimum wage of $10.10 go into effect. This will have a greater effect on businesses with 50 or more employees rather than those with fewer employees. Businesses that depend on low-priced labor, such as retailers and fast-food companies, will have more to be concerned about. Generally, the implication is that many stores will cut jobs and even close stores, which will add to the unemployment rate.
In November 2013, the Federal Reserve Bank of Chicago reported on a study about the market-level responses to minimum wage hikes conducted in the states of Illinois, California and New Jersey. The results showed that minimum wage hikes did not hurt McDonald’s Corp. However, stores who adopted the minimum wage proposal, such as Burger King, Wendy’s, SUBWAY, Dominos, and Pizza Hut, have proved that they simply need to change their business perspective, embrace change, and face the challenges in growing their businesses.
Restaurant employment increasing The restaurant industry appears to be unaffected by the battle over wages. In the latest employment report from the BLS, 288,000 new jobs were generated in June 2014, marking the sixth consecutive month with gains above 200,000. Employment in food services and drinking places continued to increase over the past year to reach 33,000 in June 2014. The robust growth in the restaurant industry is supported by the willingness of 25% of restaurant operators to employ more people in the next six months, as stated in the National Restaurant Association’s (NRA) May 2014 Tracking Survey.

INDUSTRY SURVEYS RESTAURANTS / AUGUST 2014 11
Given the employment gains in the restaurant industry, we are optimistic that the trend will continue for the rest of 2014, adverse weather conditions aside. The general view of restaurant operators is that hiring more employees and adding more locations equates to more jobs and more industry sales.
Sales likely to rise at top 100 chains In the advent of rising commodity prices and continued traffic decline over the past few months, it is of interest to note that the US restaurant industry is experiencing an upward trend in sales, albeit at a slow pace due to lower guest traffic. NRN’s Top 100 Chains for 2014 tallied aggregate sales of $222.1 billion in 2013, a 3.2% increase compared with $215.2 billion sales (5.6%) in 2012. Despite the industry’s slow growth, it has shown the best performance since before the recession, with a 2.3% increase in units (188,817 units in 2013 compared with 184,558 units in 2012).
For the 2014 edition of Top 100, (fiscal years ended closest to December 2013, or the latest year), limited-service brands dominated eight of the top 10 spots, based on ranking by percentage growth in the overall US systemwide sales growth of 16.2% and systemwide sales of $1.8 billion. Limited-service restaurant (LSR)/burger dominated the largest share at 32.7%, followed by casual dining, beverage snack, LSR/sandwich, and pizza, at 16.7%, 9.3%, 8.6%, and 7.5%, respectively. When it comes to systemwide sales, chains that have shown top performance by rising up the rank include Chipotle (up four places from 21st to 17th), Panera Bread (up two places from 14th to 12th), and Domino Pizza (up two places from 16th to 14th).
The recent downturn in economic performance due to the winter storms is just one of the many challenges that restaurant operators, or all industries for that matter, must take into consideration. We are aware that the negative impact of bad weather or a new legislation may hit the industry at times, but the challenge lies in how operators deal with the hurdles. Often, adverse conditions present an opportunity to revisit and improve marketing strategies.
NEUTRAL OUTLOOK FOR THE RESTAURANT INDUSTRY
As of mid-June 2014, our fundamental outlook for the restaurants sub-industry was neutral. We project low-single-digit same-store sales growth in 2014. We think the US economy will grow at a gradual pace during the year, even though it shrank 2.9% during the first quarter. Nonfarm payroll employment rose slowly to 288,000 in June, while the unemployment rate declined to 6.1%. However, food services and drinking places increased by 33,000 in June 2014, and have increased by 314,000 over the past year. We think this is a sign that the restaurant industry is moving its way up, despite the challenges in the first quarter of 2014. Established restaurant brands are actively enforcing unique and competitive marketing strategies to capture emerging markets. Consumers have been cautious, and have been trading down or dining out less often, but delivery orders have increased. We project better traffic for casual dining restaurants, while we think limited-service, quick-service, fast-food and fast-casual dining restaurants will see more growth.
For the full-service restaurant segment, we project same-store sales growth of 0.5% for the next six months. We think traffic will edge up as more people dine out. We also think they will likely purchase lower-priced menu items instead of higher-priced fare. We think this factor is more than offset by overall higher prices, however. Thus, we expect the average ticket price to remain moderate. We see this segment of the restaurant industry will benefit less from faster growth in emerging countries. In our coverage universe, full-service restaurant companies have a higher percentage of their restaurants located in the US.
For the quick-service restaurant segment, we expect same-store sales to rise low by a low single- digit percentage for the next six months, as operators launch comprehensive modeling programs to entice consumers. We see incremental growth as some quick-service restaurants are adding breakfast food to their menus. There will be further growth opportunities in international markets, in particular China, with Yum! Brands, McDonald’s, and Starbucks opening more stores in that country.
The restaurant industry has been hit by bad winter weather in the past seven to eight months, resulting in lower traffic and lower operating margins, but we think the impact of the winter storms will lessen in the

12 RESTAURANTS / AUGUST 2014 INDUSTRY SURVEYS
next few quarters. Commodity inflation will pressure restaurants to raise their prices around 1.6%–2.1% to protect margins, according to NRA.
As of June 25, 2014, S&P 500 Restaurants Index (Sub-industry) was down 0.08%, versus a 0.13% decline for the S&P Composite Stock 1500 Restaurants Index.
INDUSTRY SURVEYS RESTAURANTS / AUGUST 2014 13
INDUSTRY PROFILE
Satisfying the consumer’s appetite
Driven by the changing consumer preferences and population shift, the US foodservice industry, comprised of a large and varied range of away-from-home eating facilities (from commercial eating and drinking places
like restaurants, bars, and cafeterias, to food contractors and institutional providers) faces the challenge of finding ways to revolutionize its menu concept.
According to the NPD Group, Inc., a market research firm, traffic will build for fast-casual restaurants, as well as gourmet coffee shops and donut outlets. Restaurant operators would be well advised to keep a close eye on increased spending among baby boomers and seniors, as they are “keeping the industry afloat.”
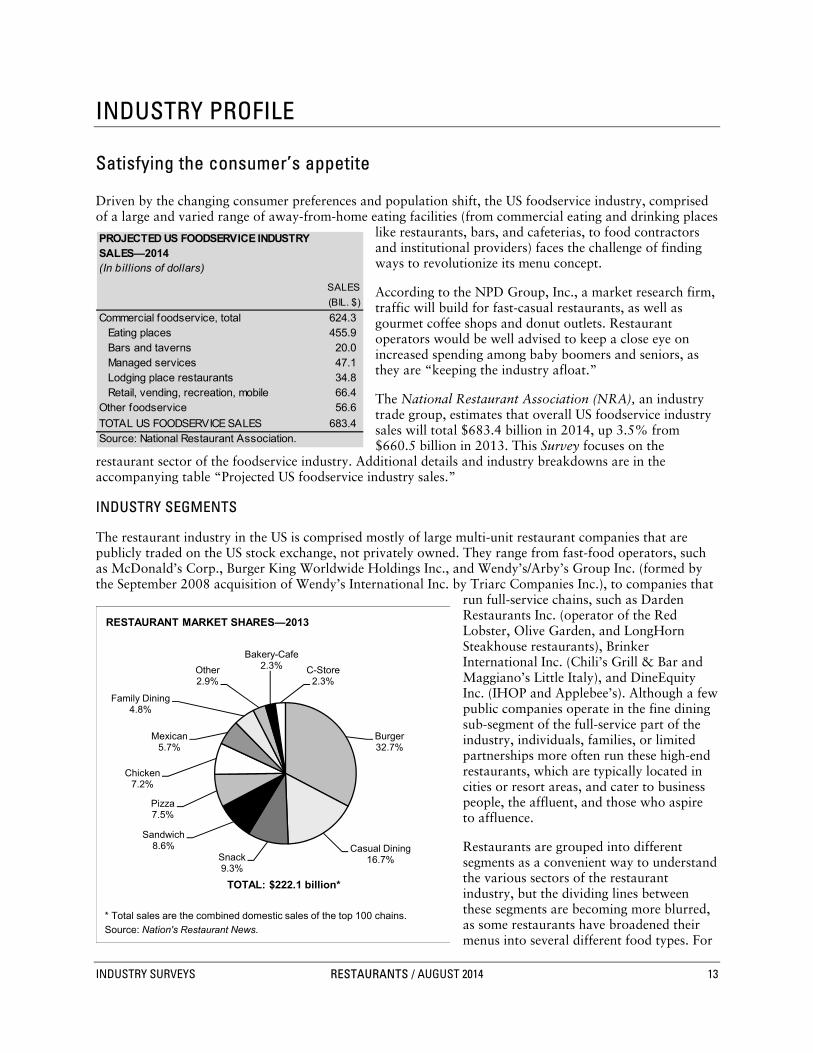
The National Restaurant Association (NRA), an industry trade group, estimates that overall US foodservice industry sales will total $683.4 billion in 2014, up 3.5% from $660.5 billion in 2013. This Survey focuses on the
restaurant sector of the foodservice industry. Additional details and industry breakdowns are in the accompanying table “Projected US foodservice industry sales.”
INDUSTRY SEGMENTS
The restaurant industry in the US is comprised mostly of large multi-unit restaurant companies that are publicly traded on the US stock exchange, not privately owned. They range from fast-food operators, such as McDonald’s Corp., Burger King Worldwide Holdings Inc., and Wendy’s/Arby’s Group Inc. (formed by the September 2008 acquisition of Wendy’s International Inc. by Triarc Companies Inc.), to companies that
run full-service chains, such as Darden Restaurants Inc. (operator of the Red Lobster, Olive Garden, and LongHorn Steakhouse restaurants), Brinker International Inc. (Chili’s Grill & Bar and Maggiano’s Little Italy), and DineEquity Inc. (IHOP and Applebee’s). Although a few public companies operate in the fine dining sub-segment of the full-service part of the industry, individuals, families, or limited partnerships more often run these high-end restaurants, which are typically located in cities or resort areas, and cater to business people, the affluent, and those who aspire to affluence.
Restaurants are grouped into different segments as a convenient way to understand the various sectors of the restaurant industry, but the dividing lines between these segments are becoming more blurred, as some restaurants have broadened their menus into several different food types. For
Chart H04: Restaurant market shares
Burger32.7%
Casual Dining16.7%Snack
9.3%
Sandwich8.6%
Pizza7.5%
Chicken7.2%
Mexican5.7%
Family Dining4.8%
Other2.9%
Bakery-Cafe2.3% C-Store
2.3%
RESTAURANT MARKET SHARES—2013
* Total sales are the combined domestic sales of the top 100 chains.
Source: Nation's Restaurant News.
TOTAL: $222.1 billion*
Table B01: Projected Foodservice Industry Sales
PROJECTED US FOODSERVICE INDUSTRYSALES—2014(In billions of dollars)
SALES
(BIL. $)
Commercial foodservice, total 624.3 Eating places 455.9 Bars and taverns 20.0 Managed services 47.1 Lodging place restaurants 34.8 Retail, vending, recreation, mobile 66.4
Other foodservice 56.6
TOTAL US FOODSERVICE SALES 683.4Source: National Restaurant Association.

14 RESTAURANTS / AUGUST 2014 INDUSTRY SURVEYS
example, a sandwich restaurant chain begins to offer chicken items. In addition, some casual dining chains are expanding their lunch menus and are now competing with fast-food outlets. We view the restaurant industry as one competitive market, with all participants trying to serve a diverse customer base.
Fast food Meals to eat in or take out, quick counter service, low prices, and plain décor are features common to fast-food (or limited-service) restaurants. These outlets tend to specialize in a few menu items—hamburgers, pizza, sandwiches, and/or chicken—and generally do not serve alcohol. According to the NRA, limited-service establishments in the US are expected to see a nominal sales growth of 4.4% in 2014.
The fast-food industry is less fragmented than its full-service counterpart. The segment’s focus on quick service and price means that larger chains have an advantage: their economies of scale allow them to
develop the operational expertise to improve efficiency, speed transactions, and purchase supplies more cheaply. Sales figures and comparisons that follow reflect the latest available data.
Burger chains. Limited-service restaurants (LSR)/Burger topped NRN’s 2014 Top 100, accounting for 32.7% of the restaurant chain market in 2013. Although the main menu offerings are hamburgers these restaurants chains offer a larger variety of main-course items, such as chicken and fish sandwiches. Many offer salads as a popular and healthy alternative to sandwiches. Nontraditional service hours, including breakfast, snack, and overnight parts of the day, have been a major source of growth for sandwich chains in recent years. New menu items, such as dessert-like coffee drinks and fruit smoothies, are seen as a source of future growth.
Several large competitors, with chains that are generally recognizable throughout the
nation, dominate the sandwich chain category. With $35.9 billion in US sales in 2013, McDonald’s is the largest fast-food chain by a wide margin. However, the concept faces strong direct competition in this segment from Burger King ($8.5 billion in sales) and Wendy’s ($8.4 billion). (Casual dining, the second largest segment of the restaurant chain market, will be discussed in the “Full service” section below).
Beverage-Snack. This category is the third largest in the fast-food segment, accounting for a 9.3% share of Top 100 sales. Total US sales for Top 100 casual-dining chains in this category increased 2.3% in 2013 from $36.2 billion in 2012. The market leader is Starbucks Corp. With than 11,438 locations in the US, sales in the US were approximately $11.9 billion in its fiscal 2013 ended September 30. Starbucks has benefited from increased demand for coffee and continued growth in the breakfast day part. Additionally, it has broadened its menu offerings, including other specialty drinks, such as smoothies and orange juice, pastries, breakfast sandwiches, and salads. Other restaurant chains in this category include Dunkin’ Donuts (owned by Dunkin’ Brands Group Inc.; $6.7 billion in sales in 2013), and Krispy Kreme Doughnuts Inc. ($621 million).
Sandwich chains. The fourth-largest category in the fast-food segment is sandwich, which accounted for 8.6% share of Top 100 sales. This category is led by SUBWAY (operated by privately held Doctor’s Associates Inc.), which had US systemwide sales of $12.2 billion in fiscal 2013 ended December 31,
Table B02: largest restaurant chains
LARGEST US RESTAURANT CHAINS(Ranked by 2013 US systemwide foodservice sales)
- - - - - - US SALES (MIL.$) - - - - - - - - - - - - - - US UNITS - - - - - - - - - -
CHAIN 2012 2013 % CHG. 2012 2013 % CHG.
McDonald's 35,593 35,856 0.7 14,157 14,278 0.9Subw ay 12,124 12,221 0.8 25,549 26,334 3.1Starbucks Coffee 10,956 11,864 8.3 11,026 11,438 3.7Burger King 8,585 8,501 (1.0) 7,183 7,155 (0.4)Wendy's 8,243 8,354 1.3 5,817 5,791 (0.4)Taco Bell 7,500 7,800 4.0 5,695 5,769 1.3Dunkin' Donuts 6,265 6,743 7.6 7,306 7,677 5.1Pizza Hut 5,700 5,700 0.0 7,756 7,846 1.2Chick-f il-A 4,560 4,989 9.4 1,669 1,759 5.4Applebee's 4,504 4,517 0.3 1,885 1,861 (1.3)KFC 4,500 4,200 (6.7) 4,618 4,491 (2.8)Panera Bread 3,629 4,034 11.2 1,534 1,658 8.1Sonic Drive-In 3,791 3,882 2.4 3,556 3,522 (1.0)Domino's Pizza 3,551 3,770 6.2 4,928 4,986 1.2Olive Garden 3,662 3,669 0.2 822 834 1.5Chili's Grill & Bar 3,559 3,547 (0.3) 1,265 1,269 0.3Chipotle Mexican 2,718 3,189 17.3 1,398 1,572 12.4Jack in the Box 3,085 3,109 0.8 2,250 2,251 0.0Little Caesars 2,900 3,100 6.9 3,655 3,886 6.3Arby's 2,992 3,032 1.3 3,354 3,269 (2.5)
Source: Nation's Restaurant News .

INDUSTRY SURVEYS RESTAURANTS / AUGUST 2014 15
generated from more than 26,000 restaurants. Next in sales are Arby’s, with US sales of $3.03 billion, and Jimmy John’s Gourmet Sandwiches (the sixth fastest growing sandwich chain), with systemwide sales of $1.5 billion, up 16.1% from 2012.
Pizza. This category ranks fifth in the fast-food segment. The nation’s largest seller of pizza is Pizza Hut, a division of Yum! Brands (US sales of $5.7 billion in fiscal 2013 ended December 31), followed by Domino’s Pizza Inc. ($3.8 billion, for fiscal 2013 ended December 31). Little Caesars (a division of Ilitch Holdings Inc.; $3.1 billion) and Papa John’s International Inc. ($2.5 billion) are other large, nationally known pizza concepts. These four account for some 89% of the aggregate sales in the pizza chain restaurant segment.
Overall, sales and unit growth in the pizza category in 2013 was somewhat flat, averaging 1.3%, up 0.1% compared with an increase of 2.3% in 2012. Total US sales of the top 100 pizza chains reached $16.7 billion, up 3.7% from $16.1 billion last year. However, at the beginning of 2014, most restaurant operators felt the effects of a change in consumer spending, mainly due to the tight economic condition and partly due to health consciousness. Top-ranked Pizza Hut system sales for the first quarter ended March 2014 was even; a 2% unit growth was offset by a 2% same-store sales decline. The restaurant margin declined 4.2% to 10.8%, driven by sales deleverage and inflation in the US.
Chicken. In 2013, Chick-fil-A Inc. took the lead in this category. It overtook KFC Corp., a division of Yum! Brands, for the second time, with its US systemwide sales totaling an estimated $5 billion in fiscal 2013 ended December 31. Revenue growth at Chick-fil-A has increased more quickly than at its competitors (its 1,775 units in 2013 was about triple its size in 2003), fueled by aggressive expansion and high customer satisfaction scores, especially for speed of service (in which the company maintains the highest scores in the fast-food industry). Meanwhile, KFC stumbled again in 2013 as sales fell for the sixth year in a row. Other competitors include Popeye’s Chicken & Biscuits (operated by AFC Enterprises Inc.; $2.1 billion) and Zaxby’s (Zaxby’s Franchising Inc.; $1.1 billion).
Fast casual There is a separate category in the fast-food segment called “fast casual,” which refers to a growing group of restaurant operators that promise a higher quality of food than at a traditional fast-food restaurant and at a lower price point than at a full-service restaurant. The typical cost per meal ranges from $8 to $12. Some of the largest and most successful players in this growing segment are Panera Bread Co., Chipotle Mexican Grill, and Five Guys Burgers and Fries.
The fast-casual segment has grown faster than the previous years, with casual chain growth of 11% and a store count increase of 8% in 2013, according to Technomic’s 2014 Top 500 chain restaurant report.
Chipotle Mexican Grill, Inc. reported a revenue increase of 24.4% for the first quarter of 2014. In the fourth quarter of 2013, revenue increased 20.7% compared with the prior-year period. In 2013, 185 new fast-casual restaurants opened, and 44 opened during the first quarter of 2014. For systemwide sales of restaurant chains, Chipotle showed a 17.3% increase compared with 2013.
According to NRN, most of the Top 10 growth chains on this year’s list experienced a shrinking growth rate for sales in 2013. Despite the economic challenge, newcomers Jersey Mike’s Subs and Yard House (owned by Darden Restaurants Inc.), ranked first and second in America’s top growth chains (with
sales growth of 21.2% and 20.1%, respectively). Wingstop, the only chicken chain in this year’s top 10 growth chains, ranked third, with a sales growth of 19.8%.
Table B03: FASTEST-GROWING US RESTAURANT CHAINS
TOP 10 FASTEST-GROWING US RESTAURANT CHAINS(Ranked by US systemwide sales growth)
% CHANGE IN
LATEST - - - - REVENUES - - - - -
FISCAL PREV. CURRENT
CHAIN YEAR END YEAR YEAR
Jersey Mike's Subs Dec-13 25.7 21.2Yard House Dec-13 17.1 20.1Wingstop Dec-13 20.5 19.8Chipotle Mexican Grill Dec-13 20.0 17.3Casey's General Stores Dec-13 13.1 16.1Jimmy John's Dec-13 24.7 16.1Noodles & Company Dec-13 NA 15.1Firehouse Subs Dec-13 33.6 14.8Buffalo Wild Wings Grill & Bar Dec-13 20.8 13.0Cheddar's Casual Café Dec-13 24.5 12.4Source: Nation's Restaurant News .

16 RESTAURANTS / AUGUST 2014 INDUSTRY SURVEYS
Success of fast casuals has motivated operators in other segments to renovate and upgrade their offerings in order to compete with fast casuals and drive more traffic. For example, on August 5, 2013, KFC opened a new restaurant format called “KFC eleven” to test the fast-casual concept. Fresh made-to-order pizza is a new addition to fast-casual offerings. In April 2013, The Pizza Studio launched its fast-casual pizza concept, which allows customers to build their own 11-inch pizzas on a variety of crusts. The company has signed a franchising deal to open 12 restaurants in Massachusetts, Rhode Island, and Connecticut over the next three years.
Full service All full-service restaurants offer some form of table ordering, though their price points range from low to high. These restaurants have much higher per-unit sales volume, on average, than do fast-food outlets. Consumers in this segment are from higher income households and are more engaged with technology. According to NRA surveys, about 20% of consumers report that technology options are an important feature when choosing a full-service restaurant. For example, they use their smartphones to look up directions and their computer to view menus or make reservations. The NRA projects that sales at full-service restaurants will increase 2.6% in 2014.
Casual dining. Casual dining chains (also called the dinnerhouse segment) encompass a host of restaurant types, including seafood, Asian, and Italian. NRA surveys have found that consumers in this segment prefer to dine in restaurants that have video menu boards and tabletop devices.
The casual dining segment showed sluggish growth in 2013, a resemblance to the slow recovery from the recent recession. US systemwide sales for the 26 casual dining chains in the Top 100 rose 2.3% to $37 billion in 2013 compared with $36.2 billion in 2012, according to NRN data. On a market share by segment, this category ranked second, after LSR/Burger. The Top 10 chains based on sales had positive results in 2013, with nine showing sales gains and one decline. Applebee’s Neighborhood Grill & Bar (operated by DineEquity Inc.) leads the segment ($4.52 billion in total systemwide sales in 2013), followed by Olive Garden (Darden Restaurants Inc.; $3.67 billion in the fiscal 2014 ended May 31), and Chili’s Grill & Bar (Brinker International; $3.55 billion in the fiscal year ended June 2014) maintaining their respective positions. Buffalo Wild Wings Grill & Bar (Buffalo Wild Wings Inc.; $2.78 billion) pushed Darden Brand’s Red Lobster out from the fourth to sixth position. Outback Steakhouse (Bloomin’ Brands, Inc.) took fifth position with $2.46 billion in total systemwide sales in 2013.
Family restaurants. A family restaurant aims to appeal to customers of all ages by offering a relaxed atmosphere, low prices, and menus geared to both children’s and adults’ palates. These restaurants are sometimes referred to as “midscale.” Also referred to as Family Dining, this segment constitutes a 4.8% share in the Top 100, with total sales of $10.70 billion in 2013.
Category leader International House of Pancakes (IHOP), operated by DineEquity Inc. (systemwide sales of $2.77 billion in fiscal 2013 ended December 31), grew by around 3.8%, while second-place Denny’s (a division of Denny’s Corp.; systemwide sales of $2.41 billion) saw a sales increase of 1.2%. Cracker Barrel Old Country Store (a division of CBRL Group Inc.; $2.10 billion) was in third place with sales growth of 2.5% in fiscal 2013 ended July 31. On a sales per unit basis, Big Boy/Frisch’s Big Boy led this segment, with an estimated growth of 3.5% in sales per unit, followed by IHOP at 2.7%. Cracker Barrel, which led the segment in 2012, fell 0.7%.
Fast casual. According to the NRA, fast casual represents 27.3% of US total foodservice sales (estimated at $173.8 billion for 2013. Based on 2014 US Top 100 systemwide sales, top chains in this segment include Panera Bread ($3.6 billion), Chipotle Mexican Grill ($2.7 billion), Five Guys Burgers and Fries ($1.1 billion), Qdoba Mexican Grill ($583.2 million), and Einstein Bros. Bagels ($455 million).
Full-service restaurant chains have begun participating in the fast-casual segment through brand spin-offs, according to NRN, aiming to capitalize on the benefits that fast-casual restaurants enjoy, such as lower capital and labor costs. For instance, in the last few years, Red Robin Gourmet Burgers has opened five Red Robin’s Burger Works stores, which range from 2,000 to 4,000 square feet versus the 6,000 square feet of its full-service restaurants (of which it has about 470 in operation). In the first quarter of fiscal 2014, the

INDUSTRY SURVEYS RESTAURANTS / AUGUST 2014 17
company opened four new Red Robin restaurants, and closed one full-service and one Red Robin Burger Works restaurant.
Another full-service restaurant operator, Johnny Rockets, is attempting to enter the fast-casual burger segment with its JR Burger Grill stores, which offer burgers of the same quality as those in its full-service restaurants, but at lower prices. However, the size of the burgers is smaller than its previous offerings and the menu options are limited.
Other Some chains do not easily fit into specific categories, due to the kind of product they sell or the way in which they serve the product. Examples include bars and taverns, caterers, and snack and beverage bars.
INDUSTRY TRENDS
The restaurant industry is highly competitive. This has forced operators to find ways to continue to boost market share, find and retain employees, and control costs, as they strive to maximize profits.
SALES TRENDS STABILIZING AFTER YEARS OF DECLINES
The largest US restaurants as a group continued to recover in 2013 from the great recession. The National Restaurants Association (NRA) predicts that restaurant sales in 2014 will reach a record high of $683.4 billion, up 3.5% from 2013. For 2014 Top 100 chains, total systemwide sales in 2013 increased 3.2% to $222.1 billion. This gain was lower than the 5.6% systemwide sales increase in 2012.
Despite the stabilizing trends, many companies are still recovering and repositioning after the downturn. The lack of top-line growth has led to a greater focus on the availability and use of capital. This represents a marked change for an industry that has traditionally had ready access to capital from banks and in the capital markets.
Numerous companies, such as Dunkin’ Brands, Sonic Corp., and Domino’s Pizza, have voluntarily undergone leveraged recapitalizations. Many others were taken private in similarly leveraged transactions by private equity groups. Underlying these strategies was the premise that growth would reduce financial risk over time, and that higher debt would always result in a higher return on equity.
Indeed, a wave of deals in 2010 demonstrated that private equity groups have developed a taste for the industry, a trend that continues in 2014. The largest of these deals was 3G Capital’s $4 billion takeover bid for Burger King, announced in September 2010 and completed in November 2010. In May 20, 2014,
Carlson announced its plan to sell TGI Fridays Restaurants to Sentinel Capital Partners and TriArtisan Capital Partners. The transaction was expected to close by July 2014, but is still pending. Carlson acquired TGI Fridays in 1975, when the brand had just 12 restaurants. The chain now has more than 900 units in almost 60 countries, and posted $2.7 billion worldwide sales in 2013. Darden Brands agreed to sell Red Lobster to Golden Gate Capital in May 2014, for $2.1 billion. (See the “Current Environment” section of this Survey for details).
Chart H01: US FOOD SALES GROWTH
0
100
200
300
400
500
600
700
90 *92 94 96 98 00 02 04 06 08 10 12 ʬ14
US FOOD SALES GROWTH (In billions of dollars)
Eating & drinking places All food stores
*Change in data compilation from SIC categories to NAICS categories.ʬ Annualized data based on January to June 2014.Source: US Department of Commerce, S&P Capital IQ estimates.
*

18 RESTAURANTS / AUGUST 2014 INDUSTRY SURVEYS
Restaurant operators now take a longer-term view when considering changes in their capital structure. Most are increasing the cash that they hold, paying down debt taken on earlier to grow, or buying back stock. Now that trends seem to be stabilizing, many have resumed expansion plans, but the recent downturn has left its mark. Most capital projects now are focused on efforts that are more modest and utilize less aggressive funding methods. Indeed, cash flow is once again a key driver of near-term operations and prospects.
How many restaurants can the US support? As of 2013, there were 617,505 restaurants in the US. We estimate that the number of restaurants should increase 3.0% by the end of 2014 to more than 1.01 million. This compares with unit growth of about 3.1% in 2013. Given our forecast of modest sales growth for the industry and optimism for further strengthening in the US economy, we expect operators to expand the number of restaurants as their profitability improves.
COMPETING FOR CUSTOMERS
To improve or simply maintain market share in the competitive restaurant industry, companies employ strategies to enhance consumer choice, convenience, and value. In today’s economic situation with unpredictable price swings, together with uncertainties brought about by bad weather conditions and legislative moves, restaurant operators need to be innovative in marketing strategies to remain competitive and to make their products more attractive to customers. Techniques include adding cuisine types, discounting prices to attract customers, expanding takeout service, and using technology to improve customer satisfaction. Restaurants are also extending their menus to draw in both value-conscious and premium customers. More fast-food chains are offering breakfast options, and many are catering to a late-night clientele by extending operating hours.
Why consumers pick one restaurant over another Although there are many factors that go into the selection of a restaurant to dine at, we think there are three main factors: value, quality, and convenience.
Value. Restaurants also compete for customers based on price (or value). While lower prices should draw in more customers and traffic, they also often reduce the restaurants’ operating margins. This is sometimes not desirable if the restaurant is constrained by capacity to serve all potential customers. As mentioned previously, there are certain price points at which customers are willing to dine out, such as $10 or $15. By lowering their entry price to those levels, restaurant operators can attract much higher traffic.
Quality. Typically, a restaurant chain will be established or well known for one kind of product. For example, McDonald’s is famous for its Big Mac hamburger and KFC for its chicken. However, consumers’ preferences can change over time. Thus, some major restaurant chains have introduced new products to rejuvenate their menus, such as McDonald’s adding Chicken McNuggets to its offerings. In addition, driven by demographic changes, many restaurants have begun to diversify their menus across various cuisine types. For instance, with the Hispanic and Asian-American segments growing at a faster pace than the overall US population, many restaurants are developing new products to target these groups’ tastes, often attracting other customers in the process.
Convenience. The place or location of a restaurant is a critical factor in its success. This is why some restaurant chains make detailed analyses of the flow of both foot and car traffic in selecting their future sites. For example, many fast-service restaurants are located just off a major highway or freeway, so drivers can access them conveniently. Restaurants are also increasing sales through the greater use of drive-through.
Hispanic market in focus The Hispanic market has become increasingly important to the restaurant industry, reflecting this community’s growing influence in the US economy. On June 26, 2014, the US Census Bureau reported that the US Hispanic population (more than 54 million people) remained the second largest group in the US. The US Hispanic population has greatly influenced the increased popularity of fruits, juice drinks, and more flavorful spices and seasonings.

INDUSTRY SURVEYS RESTAURANTS / AUGUST 2014 19
According to the NRA, Hispanics are projected to account for 25% of the increase in consumer spending on food away from home through 2015. On June 16, 2014, the Washington Restaurant Association (WRA) reported on a study commissioned by Hispanic media company Univision Inc. and conducted by Burke Marketing Research. The study found that Hispanic Americans frequenting casual dining restaurants prefer to dine at brands such as Red Lobster, Outback Steakhouse, and Olive Garden because they are more familiar with those restaurants.
In May 2014, Ad Age announced that the Association of Hispanic Advertising Agencies (AHAA) nominated McDonald’s as the marketer of the year for catering well to the Hispanic audience. Aside from feeling appreciated, Hispanic American consumers look for competitive pricing. According to Sandleman & Associates, a foodservice consumer research firm, Little Caesar is the group’s favorite pizza chain, largely because of its affordability.
Easier than home cooking The home meal replacement (HMR) market is of particular interest to restaurant operators, as a way to increase sales with incremental or, in some cases, no additional capital investment. We think the strong demand for takeout food, prepared and packaged for busy customers to eat at home, should continue to grow solidly over the next ten years.
Although takeout has always been a focus for quick-service restaurants, it has received similar attention from casual dining operators only in the past five years. The constant drive to increase the return on assets has spurred full-service chains to invest significant sums to improve pick-up access and packaging, and on menu development. According to Technomic, takeout food has been growing about twice as fast as the overall restaurant industry. A leader in this category was Outback Steakhouse, which has aggressively sought takeout customers by retrofitting its units to serve them. Applebee’s has significantly improved takeout packaging and rolled out curbside delivery service at its restaurants. It also has begun to test technology that would enable it to use handheld remote devices to accept credit cards for payment.
The buffet restaurant segment is also increasingly emphasizing takeout. Golden Corral Corp. has rolled out “Golden to Go” takeout stations and reserved parking for takeout buyers at many of its locations, charging customers by the pound. Luby’s Inc., where takeout accounts for about 15% of systemwide sales, has adopted a new cafeteria prototype with curbside-to-go service. Buffets Holdings Inc., which owns the Ryan’s Grill & Buffet & Bakery chain and others, is looking for ways to introduce takeout to its all-you-can-eat buffet formats. The challenge for many of these chains is not to undermine the existing concept by cannibalizing sales or disrupting the normal operating flow of the restaurant.
Although an increasing number of restaurants are seeking ways to win in the growing and lucrative carryout market, success in this sector is not guaranteed, and pitfalls are manifold. Competition is everywhere—from local food stands to casual restaurants to supermarkets that offer takeout and delivery.
In serving the takeout market, supermarkets have some advantages: a successful formula that they have used for years, as well as experience in managing food spoilage and wastage to avoid hurting profitability. In contrast, restaurants are relatively inexperienced in this business segment and are bound to have difficulty in gauging demand, average order size, and quantity of food to order and prepare. They also have the disadvantages of higher cost structures and labor costs that comprise a higher percentage of sales. The higher labor costs and food wastage can erode their profitability in the takeout sector.
Customer loyalty programs Restaurant chains are reworking their brands to attract customers who are not only willing to visit their restaurants repeatedly, but are also willing to pay a premium price for improved services. For instance, Starbucks has redefined the whole experience of having coffee at a restaurant by creating the concept of a “third place” (i.e., other than home or office), where customers can spend time listening to music or socializing. According to NRN, the company has taken various initiatives to increase the traffic at its restaurants.
Starbucks has outperformed it peers, in part due to its success with its “My Starbucks Rewards” loyalty program. Starbucks offers free drinks or refills to its members on their repeated usage of their cards. Like

20 RESTAURANTS / AUGUST 2014 INDUSTRY SURVEYS
any other card, the program has a Gold-level category offering more benefits. According to the company, it is adding around 80,000 new customers to its program every week, and had 6.5 million active members as of the fiscal year ended September 2013, up from 4.5 million at the end of fiscal 2012. Its loyalty program members account for about one-fourth of the company’s total transactions in the US.
In its fiscal 2013 fourth-quarter earnings call in October, the company reported that the Starbucks loyalty program has expanded across the world, including important markets such as Germany, Hong Kong, and the Philippines. The company also stated that it has created new options in the Starbucks reward cards such as the option to earn and redeem Starbucks reward stars in other Starbucks stores for Evolution Fresh Juices and other Starbucks ready-to-drink juices.
On April 29, 2014, Panera Bread reported an increase of 8% for the 13-week operations ended April 1, 2014, which the company attributes to marketing initiatives and advertising effectiveness. In November 2010, the company launched the “My Panera” loyalty program, which had over 16 million members at the beginning of the second quarter of 2014. Under its loyalty program, Panera gives its users free products based on their previous purchase, and other benefits such as invitations to events at its restaurants.
Expanding offerings for morning Fast-food chains have been focusing on under-served parts of the day in order to offset slumping traffic during the traditional lunch and dinner periods. The rationale is that rent and other costs are largely fixed, and some staffing is already required during off-peak times. The increased attention makes sense if additional gross profits on incremental sales from nontraditional dayparts at least cover staffing costs during the off-peak periods.
The most prominent daypart addition in recent years was the breakfast segment. Operators that have been offering breakfast for a long time have increased their focus on expanding these segments. McDonald’s is the dominant player in the breakfast segment with a market share of over 30%. As competition for the breakfast crowd intensifies, between March 31 and April 13, 2014, McDonald’s offered free coffee to its customers. Also, McDonald’s stated in its earnings call in April 2014, that its growth priorities are focused on ensuring that the company remains relevant and appealing by optimizing its menu and modernizing the customer experience.
On March 27, 2014, Taco Bell began a massive marketing campaign for its new breakfast menu, which included a real-life human named Ronald McDonald, who gave rave reviews of its breakfast items, ending with the line, “Delicious new breakfast everyone can love, even Ronald McDonald.” The said spot has drawn more than 1.6 million views on YouTube.
Starbucks also has a strategy to keep coffee sales flowing. In March 4, 2014, Starbucks launched four new breakfast sandwiches: ham and Swiss on a croissant; spinach, sun-dried tomatoes, and cheese on ciabatta; egg and cheddar on toast; and a lower-calorie egg white, turkey bacon, and cheese on English muffin. The company offered free brewed coffee between March 12 and March 14, along with the purchase of one of its breakfast sandwiches.
According to NRN, while new entrants prepare to capture some share in the breakfast segment, they prefer to do so gradually. For instance, Wendy’s, which has been testing its breakfast offerings since 2006, launched its Redhead Roaster coffee line across all locations in New York in an attempt to capture the breakfast segment. It also has launched baked goods and panini sandwiches for breakfast in some test markets. The company believes that it has not yet achieved the expected returns from the day part and therefore plans to test thoroughly before launching breakfast offerings systemwide. However, Wendy’s has rolled back its breakfast offering test sites from 1,000 locations to 400 locations, as its breakfast sandwiches and baked goods, and Redhead Roaster coffee, were not profitable in various markets, according to a May 2013 article in NRN.
The rise of technology Companies are retaining their valued customers by using social media in their advertising strategies. Platforms such as Facebook, Twitter, and Google have a huge impact on the customers’ dining decisions.
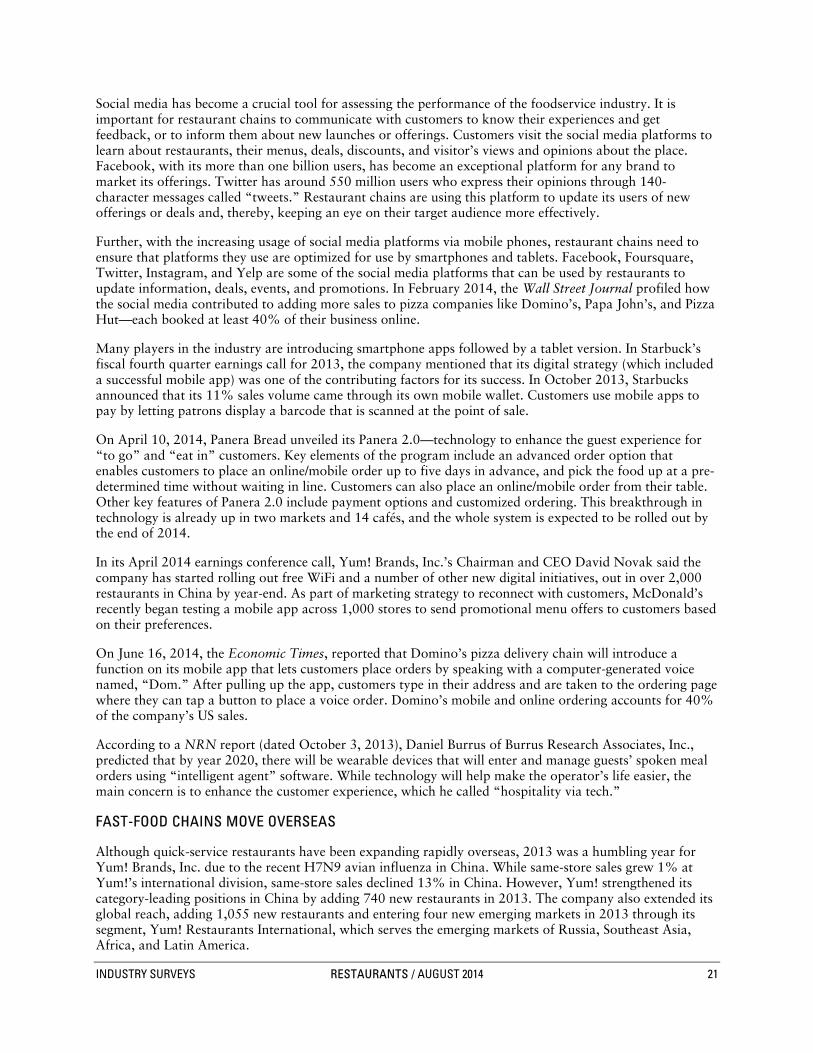
INDUSTRY SURVEYS RESTAURANTS / AUGUST 2014 21
Social media has become a crucial tool for assessing the performance of the foodservice industry. It is important for restaurant chains to communicate with customers to know their experiences and get feedback, or to inform them about new launches or offerings. Customers visit the social media platforms to learn about restaurants, their menus, deals, discounts, and visitor’s views and opinions about the place. Facebook, with its more than one billion users, has become an exceptional platform for any brand to market its offerings. Twitter has around 550 million users who express their opinions through 140-character messages called “tweets.” Restaurant chains are using this platform to update its users of new offerings or deals and, thereby, keeping an eye on their target audience more effectively.
Further, with the increasing usage of social media platforms via mobile phones, restaurant chains need to ensure that platforms they use are optimized for use by smartphones and tablets. Facebook, Foursquare, Twitter, Instagram, and Yelp are some of the social media platforms that can be used by restaurants to update information, deals, events, and promotions. In February 2014, the Wall Street Journal profiled how the social media contributed to adding more sales to pizza companies like Domino’s, Papa John’s, and Pizza Hut—each booked at least 40% of their business online.
Many players in the industry are introducing smartphone apps followed by a tablet version. In Starbuck’s fiscal fourth quarter earnings call for 2013, the company mentioned that its digital strategy (which included a successful mobile app) was one of the contributing factors for its success. In October 2013, Starbucks announced that its 11% sales volume came through its own mobile wallet. Customers use mobile apps to pay by letting patrons display a barcode that is scanned at the point of sale.
On April 10, 2014, Panera Bread unveiled its Panera 2.0—technology to enhance the guest experience for “to go” and “eat in” customers. Key elements of the program include an advanced order option that enables customers to place an online/mobile order up to five days in advance, and pick the food up at a pre-determined time without waiting in line. Customers can also place an online/mobile order from their table. Other key features of Panera 2.0 include payment options and customized ordering. This breakthrough in technology is already up in two markets and 14 cafés, and the whole system is expected to be rolled out by the end of 2014.
In its April 2014 earnings conference call, Yum! Brands, Inc.’s Chairman and CEO David Novak said the company has started rolling out free WiFi and a number of other new digital initiatives, out in over 2,000 restaurants in China by year-end. As part of marketing strategy to reconnect with customers, McDonald’s recently began testing a mobile app across 1,000 stores to send promotional menu offers to customers based on their preferences.
On June 16, 2014, the Economic Times, reported that Domino’s pizza delivery chain will introduce a function on its mobile app that lets customers place orders by speaking with a computer-generated voice named, “Dom.” After pulling up the app, customers type in their address and are taken to the ordering page where they can tap a button to place a voice order. Domino’s mobile and online ordering accounts for 40% of the company’s US sales.
According to a NRN report (dated October 3, 2013), Daniel Burrus of Burrus Research Associates, Inc., predicted that by year 2020, there will be wearable devices that will enter and manage guests’ spoken meal orders using “intelligent agent” software. While technology will help make the operator’s life easier, the main concern is to enhance the customer experience, which he called “hospitality via tech.”
FAST-FOOD CHAINS MOVE OVERSEAS
Although quick-service restaurants have been expanding rapidly overseas, 2013 was a humbling year for Yum! Brands, Inc. due to the recent H7N9 avian influenza in China. While same-store sales grew 1% at Yum!’s international division, same-store sales declined 13% in China. However, Yum! strengthened its category-leading positions in China by adding 740 new restaurants in 2013. The company also extended its global reach, adding 1,055 new restaurants and entering four new emerging markets in 2013 through its segment, Yum! Restaurants International, which serves the emerging markets of Russia, Southeast Asia, Africa, and Latin America.

22 RESTAURANTS / AUGUST 2014 INDUSTRY SURVEYS
McDonald’s revenue base is just as diversified, if not more so. In 2013, about 31% of its revenues were from the US; Europe accounted for about 40%; and Asia Pacific, the Middle East, Africa, and other countries (primarily the Americas ex-US), 23%.
Restaurant companies are increasingly targeting China and the other BRIC countries (Brazil, Russia, and India), and McDonald’s is currently focusing on drive-through outlets in China, which it says are critical to its long-term development. In 2006, McDonald’s entered a strategic alliance with Sinopec Shanghai Petrochemical Co. Ltd., China’s largest gas retailer, in an effort to take advantage of the trend of rising car ownership in China. In 2013, the Oak Brook-based fast-food chain opened 275 restaurants in China and plans to open another 300 this year, adding to its almost 2,000 in the country, its third-largest market behind the US and Japan, according to Chicago Business Journal. McDonald’s China division has contributed to a 6.6% sales growth for the first quarter of 2014.
INDUSTRY FOCUSES ON HEALTH
In recent years, the fast-food industry has been hit with lawsuits alleging that specific corporations are responsible for obesity-related health problems faced by consumers—particularly children. Plaintiffs have sought remedies such as menu changes, nutritional labeling, advertising restrictions, and monetary damages. Lawsuits have also centered on better disclosure of menu contents, as evident by a 2011 suit against Yum! Brand’s Taco Bell that claims the chain’s beef actually only contains 36% beef.
These lawsuits reflect an American culture that has become significantly more health-conscious and litigious over the last several decades. This is a result of rising obesity rates, skyrocketing healthcare costs, and growing concerns about the impact of obesity on overall health. Customers who might have paid lip service to healthy diets in the past are now beginning to practice what they preach.
An important driver in the new health-conscious trend has likely been various diet crazes. While the popularity of low-carbohydrate diets, such as the Atkins Diet and the less intense South Beach Diet, has ebbed, whole-health diets and back-to-basics eating seem to have taken their place. An increasing awareness of foods’ glycemic index (a measure of the effect of carbohydrates on blood sugar levels) also seems to be on the rise.
On January 23, 2014, the US Centers for Disease Control and Prevention reported that restaurant food can be a substantial source of sodium in the American diet, of which the current level was found to be too high to be safe, considering the disease risks associated with sodium intake.
In response to strong customer demand, and perhaps to help insulate themselves from potential liabilities, many restaurant chains have made significant changes to their menu offerings. In the casual dining industry, for instance, Brinker International announced a new menu at its Chili’s unit that includes significant low-fat and low-carbohydrate options. Ruby Tuesday Inc. dedicates a section of its menu to “Smart Eating” foods. Some restaurant companies have sought to distinguish themselves by combining with brands associated with the new trends. For instance, Applebee’s now dedicates a segment of its menu to items that were developed with and approved by Weight Watchers International Inc.
Fast-food operators promote healthier offerings Although dietary health issues have been a point of controversy in the fast-food industry in recent years, they have also played a substantial part in promoting an avenue of “healthy” competition among operators in the industry.
The kids’ menu has become an area of concern for restaurant operators as the problem of childhood obesity has become a rising concern. According to data from the US Centers for Disease Control and Prevention, around 17% of children and adolescents between the ages of 2 to 19 are obese or overweight. Hence, organizations are launching programs in an attempt to solve the problem of obesity in the country. In 2013, the NRA’s “On the Menu: Restaurant Nutrition Initiatives,” highlighted its initiatives and gave restaurant operators the opportunity to consider healthy menus.

INDUSTRY SURVEYS RESTAURANTS / AUGUST 2014 23
Many restaurant operators have indicated their plans to work in favor of the cause. For instance, McDonald’s has developed a wide range of “Healthy Lifestyle” programs and initiatives, including the addition of menu offerings that the company believes will attract health-conscious consumers. The company has put its marketing muscle behind its salad offerings and developed new Happy Meals that include yogurt, milk, vegetables, or fruit, depending on the location. On May 23, 2014, McDonald’s announced a change in its Happy Meal on Monday, introducing a new low-fat yogurt option, and a new animated “Happy Meal ambassador,” who will promote healthier eating options.
Cities, states implement restaurant health guidelines Given the campaigns for healthier food served by restaurants and other food establishments, many cities are becoming more aware and vigilant in providing health initiatives and implementing health grade requirements for restaurant operators. The National Salt Reduction Initiative (NSRI), a partnership of more than 90 state and local health authorities and national health organizations, sets voluntary targets for salt levels in 62 categories of packaged food and 25 categories of restaurant food in an attempt to guide salt reductions in 2012 and 2014.
Different agencies and organizations have joined the group, and are committed to reducing population salt intake by at least 20% in the next five years through defined targets and continuous transparent monitoring. In 2011, Darden Restaurants committed to reducing the amount of salt in its food by 10% across its menu in the next five years, with the aim of achieving a 20% reduction in the next 10 years. Between 2008 and 2010, other fast-food restaurants like Yum! Brand’s Taco Bell reduced sodium by 20% in US products, while KFC also substantially reduced its sodium content in the US, Australia, and New Zealand. Pizza Hut has reduced up to 50% of sodium in its core products in Korea, Canada, and Australia, but has yet to do so in the US.
In New York City, a policy was implemented in July 2010 that subjects restaurants to an annual inspection, after which the restaurant is given a letter grade that must be posted. Health department officials will make more frequent visits to establishments that receive grades lower than “A.” New York is not the only city with such a system, as Los Angeles has been using a similar system for more than 12 years. Other cities now include Dallas, Louisville, and San Diego, as well as states like North Carolina, South Carolina, and Mississippi. S&P expects the health grade trend to continue expanding to new cities, as restaurant goers continue to raise their disclosure expectations.
Other recent governmental efforts are aimed at helping consumers to be better informed about their dining decisions. Various states and municipalities have begun requiring chain restaurants to post calorie and fat information for items on their menu. Various courts subsequently upheld these laws following challenges by the restaurant industry, which has essentially come around to supporting what it views as the lesser of two evils: a national standard for menu labeling, rather than a different standard in each state.
Another alarming health concern in the restaurant industry, is hygiene. On June 11 and 12, 2014, El Patron restaurant was issued an emergency order by the Alabama Department of Public Health to cease operations. The restaurant was inspected following salmonella cases. According to Food Safety News, an online food news provider, Washington state’s King County Public Health agency shut down Ambassel Ehtiopian Cuisine & Bar on March 7, 2014, due to an outbreak of E. coli and because of other food safety violations such as improperly sanitized equipment and inadequate handwashing facilities.
Challenges from fast casuals and other restaurants that offer healthier foods NRN believes that restaurateurs are paying close attention to the spending habits of Millennials (also called Generation Y, people in the age group of 14 to 34) and Baby Boomers (generally considered those born between 1946 and 1964, many of whom are now in or nearing retirement), as they will be the most influential diners by 2020. While Millennials account for 22%–24% of the spending in restaurants today, this figure is expected to increase to 40% by 2020. This group focuses more on healthy eating than prior generations did, while at the same time looking for a more convenient restaurant experience with the flexible menu options offered by the fast-casual restaurants.
24 RESTAURANTS / AUGUST 2014 INDUSTRY SURVEYS
Another cause of concern for quick-service restaurants is the declining sales of hamburgers. According to NPD Group, hamburger sales have been declining since 2010, with quick-service restaurants affected the most as they account for 87% of total industrywide hamburgers sales. Quick-service restaurants are also facing competition from the healthier food category. According to NPD, there is growing demand for healthy/light sandwiches, with orders expected to rise 7% by 2022. Food trucks also pose a threat to quick-service restaurants, according to NPD, as they provide convenience and availability of interesting food, both of which are attributes that have been the traditional strengths of quick-service restaurants.
Food and restaurant companies are also troubled over the trend toward reduced salt, fat, sugar and other ingredients in food. Although most restaurants comply with the guidelines, many are hesitant to admit their concern that consumers will find the healthier food less tasty.
FOOD-AWAY-FROM-HOME TRENDS STABILIZE
The long-term trend toward more eating out ended in 2006 and eroded further in recent years, but appears to be stabilizing somewhat. Food-away-from-home spending refers to food bought at eating and drinking places. According to data from the US Department of Labor’s Bureau of Labor Statistics (BLS), the index for food away from home rose to 0.2% in May 2014, up 2.2% over the 12 months. The BLS’s Consumer Expenditure Midyear Update for the 12 months ended July 2013, showed total expenditure of $2,698 by average American household, up 2.7% from the same period ended July 2012. Consumption of food away from home accounted for 40.6% of total US food expenditures in 2011 (latest available), down from 40.9% in 2010, 41.1% in 2009 and the high of 44.1% in 2006. The percentage spent away from home was down from 2000, at 41.4% of total food spending. The amount per household spent on food away from home in 2011 was $2,620, up from $2,505 in 2010.
It remains to be seen if the percentage of pay spent on away-from-home food will resume its uptrend. Some, but not all, of the factors that supported the long-term climb in eating out over nearly 50 years should eventually support increased demand in the future.
Further boosting the dining-out trend is the decline in free time. Dual-earner households account for more than 50% of US families, according to the Bureau of Labor Statistics. In many families, both parents hold full-time jobs, which leave less time to prepare meals at home. With the rise of dual-income and single-parent families, and with numerous moderately priced restaurants to choose from, dining out is often the most convenient choice. Any prolonged period of high unemployment, sufficient to reduce the expectation of having two incomes to support household spending, could cause a permanent trend change in food consumed away from home.
A key challenge for the restaurant industry as baby boomers start to retire will be to entice this generation of retirees to eat out more than prior retirees. A significant part of demand for food away from home is driven by being at work. According to the NPD, restaurant operators should see increased spending among baby boomers and seniors.
Travel influences restaurant spending Aside from the holiday seasons, travel is another factor that influences consumers’ spending. Since most people tend to travel in groups, they are generally on the lookout for value deals and special offers. Travellers love to eat. Usually, when travellers go to different places and have experienced to eat in a restaurant that caught their interest, they tend to go back to that restaurant the next time they visit the place. Travellers also recommend good restaurants to their friends and relatives who might have plans to visit a certain place. With this, restaurants are challenged to provide means of accommodating travellers, through enhanced services and the right use of marketing techniques.
Changing menus In 2014, as consumers are slowly recovering from the recession and restaurant operators are reinventing menus, the restaurant industry is seeing change. Diners are walking into restaurants with a customized menu in mind. Panera Bread is offering its customers choices to modify their orders online or on tablets while inside the store. Chipotle burger chain customers point to the ingredients they want in their meal and

INDUSTRY SURVEYS RESTAURANTS / AUGUST 2014 25
watch as the staff prepares it. McDonald’s is integrating menu customization by offering customers salad, fruit or vegetable options instead of french fries as a side for their value meals, according to The Wall Street Journal’s MarketWatch.
RESTAURANTS FOCUS ON GLOBAL OPPORTUNITIES
Global expansion is nothing new for most US restaurant operators, especially those in the quick-service segment. Indeed, efforts by companies like Yum! Brands and McDonald’s to expand into the BRIC nations (Brazil, Russia, India, and China) have been ongoing for over a decade due to growth in these economies.
We see China as one of the lucrative regions for these restaurant operators. Companies have accelerated their plans to expand in the region due to factors like rising working population, increasing purchasing power, changing lifestyles and eating habits of the people in the country. In addition, the annual per capita disposable income of the urban population increased with a compound annual growth rate (CAGR) of 13.6% between 1991 and 2011, according to the National Bureau of Statistics of China (NBSC).
In April 2014, the NBSC reported per capita disposable income of urban residents and rural residents for the first quarter, up by 12.3% year-on-year. Earlier in February, the NBSC released a report showing a combined rate of 10.9% for 2013 to reflect a clearer picture of wealth (urban and rural household disposable income of 9.7% and 12.4%, respectively). The quick-service restaurant (QSR) segment in the Chinese market, which has seen considerable growth in the past few years, is expected to continue growing in the years to come.
While top players are benefiting from the growth story in China, according to a research note from Bernstein Research quoted in NRN in February 2012, India might overtake China in the quick-service segment by 2014. India, a $13 billion market, represents less than 20% of China’s market, but it is growing at a rate of 19%, compared with China’s 15% growth rate. According to the United Nations (UN), India will overtake China as the most populous country by 2028.
Companies such as McDonald’s and Yum! Brands have announced expansion plans in India, while players such as Starbucks and Dunkin’ Donuts opened their first outlets in India in 2012. In its first-quarter 2013 earnings call, Yum! Brands noted that it is investing and developing its business in India as it sees substantial future growth coming from the country. According to the NRN, the region will contribute around $1 billion in annual sales to Yum! Brands, $800 million to McDonald’s, and $80 million to Starbucks by 2015.
Yum! Brands Yum! Brands, through its KFC and Pizza Hut brands, is one of the largest QSR operators in China. It operates more than 6,300 restaurants in more than 950 cities in China, which has a population of around 1.4 billion. Early in 2012, the company also acquired Little Sheep, an operator of hot pot restaurants in China. Though the company has faced a challenging environment in China due to the avian flu, it opened 740 new units in 2013 and expects to open 700 more units in the country in 2014. Yum! Brands already opened 123 new units in China in the first quarter. In its first-quarter 2014 earnings call in April 2014, the company noted that it expects to open a record 1,250 new international units in 2014.
In addition, the company and its franchisees’ KFC division opened 77 new international restaurants in 2013, which included 59 units in emerging markets. The company’s Pizza division opened 69 new restaurants, including 39 international units (24 of which are in emerging markets) and 30 US units.
McDonald’s Restaurant operators are channeling a significant share of their capital outlays to opening new restaurants across different geographic regions. For instance, in 2013, McDonald’s opened 275 new restaurants in China. The company plans to open another 800 new stores in 2014, 300 of which are planned for China. McDonald’s sees the market as offering significant opportunities in coming years, and these openings will increase its accessibility in the region.

26 RESTAURANTS / AUGUST 2014 INDUSTRY SURVEYS
Starbucks Starbucks has been operating in China for more than 12 years and now operates over 1,000 stores there. The company opened its one thousandth store in China in its fiscal 2013 fourth quarter ended September, and plans to increase the store count to over 1,500 by 2015. Starbucks entered the China market with a JV partnership model; however, going forward, the company is taking steps to own the full operation in almost all regions. The company has acquired the full ownership of its stores in mainland China, except those in the Shanghai market, where it still operates with a JV partner. The shift in ownership will contribute to the company’s operating profit and its plan to expand in the region. The company had nearly 4,000 stores in China and the Asia-Pacific region, including over 500 new stores in South Korea.
In its first quarter of 2014 conference call, Starbucks stated its plans to develop new stores and renovate existing stores to increase efficiency and throughput. These plans included 50 new licensed stores opened in Canada, and the company is poised to begin the rollout of its two Teavana tea bars in New York and Seattle. In China, Starbucks opened 209 new stores, part of an overall plan to open 750 new stores across China and Asia-Pacific in 2014, including 100 stores in Singapore. Starbuck’s EMEA segment comprises of 2,000 stores, including 64 newly opened stores in the first quarter of 2014.
Domino’s Domino’s also has been focusing on growing its operations through international expansion. According to the company, its international division has been reporting growth for 20 years. The international division added 102 stores in the first quarter of 2014 and reported same-store sales growths of 7.4%. The company expects a global unit growth of 4%–6%, leading to a global retail sales range of 6%–10%.
HOW THE INDUSTRY OPERATES
Over the past 50 years, eating out had gradually become part of the way of life for many Americans. As a percentage of total food expenditures in the United States, meals eaten away from home have risen steadily from just 26% in 1960 to around 49% in 2011, according to the US Department of Agriculture (USDA). Further, the USDA reported that in 2012 (latest available), the share of income spent on food away from home rose to 4.3%. In a study by the USDA Economic Research Service (published in 2013), food prepared away from home accounted for 41% of American’s food expenditures.
According to the National Restaurant Association (NRA), a trade group, projected industry sales for 2014 will reach $683.4 billion, which would account for 4.0% of the projected US gross domestic product (GDP). With an estimated 13.5 million employees in 2014, the industry is the nation’s second largest private-sector employer. Contributing heavily to this trend has been the rise of fast-food dining that began in the 1950s with industry trendsetters Jack in the Box Inc. and McDonald’s Corp. By offering drive-through service and revolutionizing workflow processes, these companies significantly improved customer satisfaction while lowering wait times. The establishment of large chains, in both the fast food and casual dining categories, has helped to streamline operations and lower costs further.
Economic trends have played an important role in the popularity of eating out. With the rise in single-parent and dual-income households, domestic life has become more time-pressured. Restaurants provide a quick option for feeding the family. In addition, median household income has continued to increase, boosting the propensity to eat out. The convenience of eating out and the large number of reasonably priced options mean that restaurant meals will likely remain an integral part of daily life in America.
RESTAURANTS: FROM TAKE-OUT TO FULL-SERVICE
Foodservice businesses are a highly diverse group, ranging from corner pubs and fast-food franchises to such deluxe restaurants as highly regarded Jean-Georges in New York, known for its top restaurants, or Joël Robuchon in Las Vegas, where the restaurant scene has come into its own over the last decade. The industry is divided into three general categories: commercial, institutional, and military.

INDUSTRY SURVEYS RESTAURANTS / AUGUST 2014 27
Commercial restaurant service, which comprises everything from restaurants and cafeterias to ice cream parlors, bars, and cafés, is by far the largest category; its estimated sales in 2014 is $624.3 billion, according to the NRA, up 5.5% from last year’s expected sales.
Institutional foodservice, consisting of sales by institutional organizations and businesses operating their own foodservice, was projected at $56.6 billion in 2014, and military foodservice was worth an estimated $2.5 billion. (Institutional and military foodservice are not covered by this Survey.)
In the commercial foodservice business, the largest segments are full-service and limited-service restaurants. Full-service restaurants usually feature moderate to high prices and sit-down service. Average check prices generally exceed $8. Meals are served with flatware and china, and alcoholic beverages are often available. Limited-service (also called fast-food or quick-service) restaurants typically offer rapid food preparation and low prices, with or without seating. Food packaging is often disposable, and the average check price is usually less than $7. Take-out orders account for a large portion of this business. In recent years, another concept, aptly named “quick casual,” has emerged to bridge the two categories. Quick-casual restaurants have a slightly higher average check price than fast-food concepts, generally $7 to $10, presumably in exchange for higher-quality food and fresher preparation.
LOW ENTRY BARRIERS, HIGH RISK/RETURN
Small operators run a substantial majority of all restaurants, according to the National Restaurant Association (NRA), which estimates that 90% of all operators have fewer than 50 employees. This includes the large number of small franchisees that operate single or a few locations of the major fast-food brands.
The restaurant business’s low barriers to entry are partly responsible for its popularity among small-scale entrepreneurs. Some of these ventures succeed, but the industry’s intense competition and high fixed costs mean that many fail. For those that do succeed, however, the payback on investment can be considerable. Once sales reach the break-even point, a relatively high percentage of incremental revenues can become profit.
Casual dining chain concepts have taken market share from independent operators through geographical expansion. Fast-food chains have long used proliferation to their advantage: as of December 2013, McDonald’s had about 14,278 units in the United States and 35,429 units worldwide. Now, however, multi-concept casual dining operators, such as DineEquity Inc. (formed through the 2007 acquisition of Applebee’s by IHOP) and Darden Restaurants Inc. (operator of the Red Lobster, Olive Garden, and LongHorn Steakhouse chains, among others), have come to dominate the mid-price segment.
Large restaurant chains have been able to realize economies of scale that have made competition extremely difficult for small operators. Advantages include purchasing power in negotiating food and packaging supply contracts, as well as increased sophistication in real estate purchasing, location selection, menu development, and marketing.
FRANCHISING: A QUICK WAY TO GROW
Many restaurant chains choose to grow their concepts by franchising. Franchising permits restaurant companies to expand their brand-name recognition rapidly, without bearing the full cost of acquiring land, buildings, and equipment. In a typical franchise relationship, such costs are borne by the franchisee, which also pays a royalty to the parent company for the right to be part of its chain.
The practice of franchising involves a business contract between two companies: a franchisor (or parent company) and a franchisee (or individual business operator). It gives the franchisee the right to construct and operate a restaurant on a site accepted by the franchisor and to use the franchisor’s operating and management systems.
Under these arrangements, the franchisor charges the franchisee a one-time fee, which may include, for instance, an initial nonrefundable fee of about $5,000 and other technical assistance fees of typically about $50,000. Most also require franchisees to contribute 2%–5% of sales to cover both local and national

28 RESTAURANTS / AUGUST 2014 INDUSTRY SURVEYS
advertising. In addition, the franchisee makes royalty payments based on gross receipts from restaurant operations, with specified minimum payments. In the United States, royalty payments are generally 4%–5% of total receipts. Franchise contracts vary in length, but may be for periods of 10 to 20 years.
Franchising is a widespread phenomenon globally, but it is especially prevalent in the restaurant industry. According to IHS Global Insight’s Franchise Business Economic Outlook for 2014, released in January 2014, franchisees of restaurants were expected to operate 36,981 table/full-service restaurants and 155,571 quick-service restaurants in the US in 2014, up 1.1% and 1.4%, respectively. The percentage of franchised versus company-operated units varies widely among chains. Fast-food giants McDonald’s, and Yum! Brands Inc. franchised 81% and 78% of their US units at year-end 2013, respectively, while it was around 76% at Jack in the Box. Even among concepts owned by the same company, however, franchising strategies can vary. At Jack in the Box Inc.’s Qdoba chain, franchisees accounted for only 49% of total units in its fiscal year ended September 2013.
Why franchise? Many restaurant chains opt to franchise their businesses to enjoy superior returns. Franchising eliminates the need to focus on the day-to-day concerns of operating units, while generating a steady stream of royalty fees. Furthermore, since franchise royalties are based on a percentage of sales, rather than profits, they can ensure a steady stream of revenue even in a difficult operating environment. In return, the franchisee enjoys the benefits of brand-name recognition and, often, training and marketing support from the parent company. The franchisee also can participate in cooperative purchasing, enabling it to sell food at a lower price than an independent operator can.
While franchisors avoid some of the hazards of expansion, they face other risks. Licensing and franchising involve some loss of control of the business. With the day-to-day operating decisions made by franchisees, one poorly run franchised unit can reflect badly on the whole chain. Individual franchisees depend on the overall success of the entire chain to maintain their own standing.
Strong and vital franchisees are essential to the continued success of many restaurant chains, particularly in the fast-food segment. To assure long-term success and safety, companies that employ the franchise business model rely on maintaining successful franchisees and attracting new, entrepreneurial-minded franchisees. A company that tries to profit at the expense of its franchisees (e.g., by charging high prices for supplies) can damage the trust needed to have a good working relationship between franchisor and franchisee.
Successful refranchising Some companies, such as Yum! Brands, regularly buy and sell restaurants as a means of strengthening their operations, a practice known as refranchising. Acquired restaurants, which may not have been performing up to expectations under franchisee ownership, can be improved (and then operated profitably by the company) or sold to another franchisee. In other cases, restaurants may be acquired due to geographic or operational benefits to existing company-operated units. Selling restaurants generates cash that can then be used to fund new development, acquisition, and remodeling programs. The gains can be substantial.
Refranchising frees up invested capital and generates franchise fees. While this tactic can improve overall returns, its ultimate success depends on a company’s ability to find qualified franchisees to purchase its restaurants. Nonetheless, in an industry that requires relatively high capital expenditures, the popularity of these cash-generating programs is easy to understand.
RESTAURANT MANAGEMENT AND TRAINING
There is a strong correlation between the quality of restaurant management and the long-term success of a concept. Restaurant management structure varies by concept and sales volume. Every restaurant typically employs a general manager, an associate manager, and one to five assistant managers. General managers are primarily responsible for the day-to-day operations in one restaurant, overseeing customer relations, foodservice, cost controls, restaurant maintenance, personnel management, implementation of company policies, and the restaurant’s profitability. Associate and assistant managers support the general manager’s

INDUSTRY SURVEYS RESTAURANTS / AUGUST 2014 29
duties and fill in when needed. At chain restaurants, general managers report to district managers, who in turn report to regional managers, who are responsible to the corporate executive management.
Training takes a variety of forms. For employees who have development or supervisory responsibilities, extensive restaurant operations training courses are standard at most companies. CBRL Group Inc., which operates Cracker Barrel Old Country Stores, sends new managers through an 11-week training program, consisting of eight weeks of in-store training and three weeks at corporate headquarters. In addition, training is conducted for all restaurant employees. Brinker International Inc.’s training program includes a four- to five-month period for managers and supervisors. Training teams also instruct employees on opening a new restaurant, remaining on location for two to three weeks to ensure a smooth transition to operating personnel.
Franchisers such as Applebee’s International Inc., McDonald’s, and Wendy’s operate extensive training programs in a classroom setting. These companies also give periodic training to their restaurant employees. McDonald’s dubs its school “Hamburger University.”
Often, a company may raise staffing levels in order to improve service and thus increase sales. In a competitive environment, customer satisfaction levels can be an important determinant in improving sales volumes. If a company can use its increased manpower to speed service times, fast-food restaurants may serve more customers at the register over a period of time, while casual dining restaurants may increase the speed in which tables turn.
COST STRUCTURE
The costs of owning and operating a restaurant vary by format. Obviously, larger units cost more than smaller ones, as do upscale formats with a greater investment in interior design and higher spending on costly food items. To justify the expense, large units are typically located in areas with greater population density or a larger geographic draw. They usually (though not always) generate higher revenues than smaller units. In any event, if a unit’s volume does not meet the company’s revenue projections, its profitability also will be below plan, and it is likely to be shut down. Food and beverages, labor, and real estate constitute the restaurant owner’s largest cost categories.
Food and beverages Not surprisingly, the cost of food and beverages is one of a restaurant’s largest expense categories. Companies negotiate directly with national and regional suppliers to ensure consistent quality, freshness, and competitive prices. The larger the customer, the greater the bargaining power that it has over suppliers.
Many companies engage in forward pricing to stabilize food costs. Forward pricing is a hedging strategy whereby a company negotiates with a supplier to purchase a certain amount of a product at a given price. Some supply contracts signed by larger chains can lock in less volatile food products, such as beef, at stable prices for an entire year. Some of the products subject to the greatest price variability, especially dairy products, can be locked in only for shorter periods.
Labor Labor is the restaurant industry’s second largest expense, though the proportion of total cost varies by restaurant type. We estimate that, at casual dining restaurants (average meal prices of $15.00 to $24.99), salaries, wages, and employee benefits represented about one-third of sales; at major fast-food restaurant chains, these factors accounted for less than 30% of sales. At fine dining establishments, labor typically represents about 40% of sales.
Restaurant sales and profits can be greatly influenced by the efforts of general managers and area managers. In recent years, companies have placed a premium on retaining their best operators. In many cases, managers’ pay relies on incentives and often is tied to restaurant-level profit performance. Companies award stock options to personnel from the highest levels of management down to the restaurant-level manager. Starbucks Corp., Brinker International, and the CBRL Group all issue significant amounts of options to compensate management.

30 RESTAURANTS / AUGUST 2014 INDUSTRY SURVEYS
Real estate A restaurant owner can purchase or lease an existing space, or build a new one. Many chain operators choose to build their own units, so that individual restaurants all conform to the same design concept. The land on which a restaurant is built can be purchased or leased. Both options have pros and cons.
When a company purchases real estate, it must cover the purchase price. To finance such a purchase, the company must have good financial resources, with cash on its balance sheet and borrowing power. Once real estate is purchased, the company can benefit from appreciation. If real estate values decline, however, so does the value of the company’s investments. Brinker International estimates that the average cost for land, or the value of the lease for the land when capitalized (valued as an asset on the balance sheet), is $946,000 for a Chili’s unit and $4.8 million for its upscale Maggiano’s Little Italy chain. Purchases are either financed with loans or paid out of current funds.
Leasing requires less capital and offers greater flexibility than do outright purchases. Leases are finite in duration and eventually expire; thus, they give restaurant operators the option of relocating or closing units, if site selection is poor and the units are not drawing enough volume. On the other hand, leasing leaves operators vulnerable to rising rents or the loss of a lucrative location.
Whether owned or leased, site selection is critical to the success of a new restaurant. Companies devote significant time and resources to analyzing each prospective site. The main criteria are customer traffic levels and convenience. Proximity to sites that draw large crowds, such as retail centers, office complexes, and hotel and entertainment centers, is desirable. Some chains, such as SUBWAY (operated by privately held Doctor’s Associates Inc.), choose to locate units in strip malls or malls to increase visibility. Other chains, such as McDonald’s, prefer freestanding locations in high-traffic areas, to better control their costs. Accessibility concerns, such as the availability of parking and ease of entry, are also important. In addition, a company will review potential competition in a trade area, local market demographics, and site visibility.
The bottom line After food, labor, occupancy, and other expenses are subtracted, what is left is operating profit. Profitability, however, varies widely among the various industry segments and even among individual units in a chain; the level of sales at a given establishment is a key determinant. Expense structures also vary from company to company. Some businesses are simply better than others at reining in costs.
It’s a cash business Because virtually all sales in the restaurant industry are transacted in cash or equivalents (such as credit cards), many restaurant companies operate with negative working capital. (Working capital equals current assets minus current liabilities. It is sometimes referred to as net working capital, as current assets can be considered working capital needed to support the business.) A working capital deficiency occurs when current liabilities exceed current assets. Inventory, financed from normal trade credit, turns rapidly in the restaurant business. This is also one reason why debt levels are relatively low compared with other industries, especially those that must support high levels of slow-moving inventory, such as retailers.
CREATING AND TESTING NEW FOODS
In recent years, competition has fostered innovation as restaurants have sought to boost volume. In the process, they have made new product introductions an important part of the equation. Although customers may not be aware of it, most fast-food and restaurant chains spend a great deal of time researching and developing new products.
Menu offerings evolve along with consumer taste. To develop prototype products, restaurant chains conduct consumer research and keep up on the latest trends in food. When a new product is introduced, three key elements determine its success. The product must meet consumer expectations and thus generate incremental sales. Its day-to-day preparation should be compatible with company standards and operations. Finally, it should deliver financial benefits.

INDUSTRY SURVEYS RESTAURANTS / AUGUST 2014 31
The type of new product introduced—sandwich, salad, main course, dessert, and so forth—must fit clearly into the chain’s menu and meet its customers’ expectations. Thus, while a chain such as Wendy’s would be unlikely to unveil a new pizza topping, it could be expected to create a new sandwich item.
In the highly competitive fast-food category, new menu items can be crucial to driving sales as they can help to raise traffic—without the margin pressure of price discounting. Price wars are common throughout the industry and favor well-financed behemoths McDonald’s and Burger King. Smaller regional companies, such as Jack in the Box, focus on new product development to differentiate themselves from competitors, thereby reducing the potential impact of large-scale industry discounting.
Over the past several years, McDonald’s has had great success in driving sales through new products. Items recently added to the menu, such as the Snack Wrap or Southern Style Chicken biscuits and sandwiches, have helped to both drive customer traffic and raise the average check. The company’s product development process is driven predominantly by customer feedback. Approximately every six weeks, the company gathers 80 to 100 customers at a selected McDonald’s unit to get input on new ideas, as well as existing menu items. New menu item ideas are categorized by food category, price sensitivity, and health concerns.
Armed with an increased understanding of customer trends, the company can experiment with various food ideas at McDonald’s Hamburger University campus in Oak Brook, Illinois. Products are chosen for tests in select markets and then select regions; such tests often last for six months to ensure marketability. Testing often is supported by advertising, which can take anywhere from several weeks to three months to arrange.
Before an item can be rolled out across the McDonald’s restaurant system, the company must arrange for a supply of ingredients. In some cases, this may take several months due to the vastness of the company’s needs. For instance, when the company decided to promote its Apple Dippers product in 2005, the company became the largest single user of apples in the country. A full growing season was actually needed to create a supply equal to the demand. Given the rigors of the McDonald’s testing process, and the operational and procurement efforts needed to support a rollout over the company’s more than 14,000 US restaurants, the company’s new product introduction process generally takes from six months to two years to complete.
KEY INDUSTRY RATIOS AND STATISTICS
Restaurant sales are driven by consumer spending, which in turn is influenced by the health of the overall economy. To gain knowledge of the economy’s current and anticipated state of health, and its potential impact on the restaurant industry, analysts consult the following indicators.
Real growth in gross domestic product (GDP). Reported quarterly by the Bureau of Economic Analysis, part of the US Department of Commerce, inflation-adjusted (or real) GDP growth is a measure of the health of the overall US economy. The Bureau of Economic Analysis also issues advance and preliminary estimates of GDP before reporting the final GDP figure for the quarter. Most major economies are cyclical, advancing and contracting with the business cycle. The business cycle dating committee of the National Bureau of Economic Research establishes the official beginning and end of recessions.
Real GDP increased by 2.6% in 2013, compared with a 2.2% increase in 2012. For the first quarter of 2014, GDP decreased at an annual rate of 2.9%. Although consumer spending had increased, the decline in GDP was attributed to a significant decline in private inventory investment, exports, and state and local spending. As of June, S&P estimated that real GDP would grow 2.3% for 2014 and 3.1% in 2015.
Disposable personal income. Reported each month by the US Bureau of Economic Analysis, disposable personal income (DPI) is a measure of aggregate consumer income, minus taxes and adjusted for inflation. Changes in this measure are important, because they influence the level of consumer spending that can be expected. When personal income is growing, consumers are more willing to loosen their purse strings. Conversely, when it is stagnant or weak, consumers are less willing to spend. They may shift to eating at less expensive restaurants or at quick-service chains or to cooking at home.

32 RESTAURANTS / AUGUST 2014 INDUSTRY SURVEYS
Growth in disposable income slowed in 2013, increasing only 0.2% after a 3.9% increase in 2012. As of June 26, 2014, DPI increased 0.4% in May, the same rate of increase in April.
Consumer confidence. The Conference Board, a private research organization, which polls 5,000 representative US households to gauge consumer sentiment, compiles this index monthly. Its two
components—the present situation index and the expectations index—reflect consumers’ views of current and future business and economic conditions, and consumers’ expectations about how they will be affected. This qualitative measure of consumer attitudes is expressed as an index, with 1985 used as a base year (1985=100). A reading above 90 is considered a strongly positive outlook on the economy.
Factors that influence the index include perceptions of employment availability and current and projected income levels. When consumer confidence is high or rising, it is usually accompanied by increased spending and borrowing. Conversely, consumers who are uncertain about the future are likely to pare or postpone expenditures. In July 2014, the Conference Board’s Consumer Confidence Index (CCI) stood at 90.9, up from 86.4 in June. The present situation index increased to 88.3 from 86.3, while the expectations index edged up to 92.7 from 86.4 in June.
Unemployment rate. Wages are often the largest single expense at restaurants. They rely heavily on the availability of a dependable work force at the low end of the national pay scale. Employee turnover rates are relatively high, especially in quick-service restaurants, where annual turnover often exceeds 200% for non-management positions. When unemployment rates are relatively low, restaurants may have to raise pay levels to attract and retain workers.
Released monthly by the BLS, the unemployment rate tracks the number of working-age people currently searching for employment as a percentage of those employed or looking for work. After bottoming in late 2007, the unemployment rate rose to 10.0% as of December 2009, but then fell to 7.0% in November 2013 as the economy continued its recovery and many of the jobless dropped out of the labor force and therefore were not counted as unemployed.
The unemployment rate decreased 6.1% in June 2014, with 288,000 jobs added. As of June 2014, S&P’s unemployment forecast for the third and last quarter of this year was 6.4% and 6.3%, compared with 6.7% and 6.4% forecast in the first and second quarters. For 2014 and 2015, projected unemployment rates are 6.5% and 6.0%, respectively. This is largely due to the 508,000 jobs expected to be added by restaurant operators, and the fact that many Americans have partially stopped looking for work (having found employment), sending labor-market participation to 62.8%, a 35-year low.
Chart H05: US unemployment rate
Chart H02: CPI for food away from home
4.0
4.5
5.0
5.5
6.0
6.5
7.0
7.5
8.0
8.5
9.0
9.5
10.0
10.5
2003 2004 2005 2006 2007 2008 2009 2010 2011 2012 2013 *2014
US UNEMPLOYMENT RATE (Monthly data; in percent)
* through June.Source: US Bureau of Labor Statistics.
0.0
0.5
1.0
1.5
2.0
2.5
3.0
199394 95 96 97 98 99 00 01 02 03 04 05 06 07 08 09 10 11 12 13 *14
* through June.Source: US Bureau of Labor Statistics.
CONSUMER PRICE INDEX FOR FOOD AWAY FROM HOME(Year-to-year percent change)
INDUSTRY SURVEYS RESTAURANTS / AUGUST 2014 33
The consumer price index (CPI). Released monthly by the Bureau of Labor Statistics (BLS, an agency within the US Department of Labor), the CPI measures changes in the price of commodities, fuel oil, electricity, utilities, telephone services, food, and energy, and thus serves as an inflation indicator. The “core” CPI smoothes out the index by removing the volatile food and energy categories. Restaurants, like most companies, try to pass on increased costs for supplies and labor to customers. However, given the highly competitive environment, restaurant chains are generally reluctant to raise menu prices.
As of May 2014, the BLS reported an increase of 0.4% in CPI, with the food index posting its largest increase since August 2011. In December 2013, the CPI increased 0.3% as consumer prices bounced higher than any other month since June 2013. S&P expects general inflation to rise 1.4% in the second half of 2014.
Commodity costs. Food commodity costs are one of the largest input costs of a restaurant company; they can significantly affect profitability. Rising costs can erode profit margins if the company cannot pass the added expense on to the customer in the form of a price increase.
Industry expansion rates. The growth rate of overall restaurant locations should be in line with increases in demand to ensure a healthy overall business. In the early 1990s, restaurant industry expansion caused supply to outpace demand. This situation led to store closings and concept failures.
Interest rates. Many growth companies cannot finance expansion strategies wholly from current cash flow and must therefore access capital markets. If a company chooses debt financing, prevailing interest rates may affect corporate profitability. Ten-year Treasury notes often are seen as the most reliable indicator of long-term interest rate trends and are traded daily on secondary bond market exchanges.
Reflecting Federal Reserve policy, short-term rates dropped dramatically through 2008, to its current target of 0.0% to 0.3%. Volatility in the credit markets sparked by concerns about subprime mortgage defaults also pushed down 10-year Treasury yields. After hitting a peak of 5.3% in June 2007, the rate on the 10-year Treasury note was about 2.5% as of June 30, 2014. On the conservative side, we expect a drop on the 10-year Treasury yields to 2.7% and 3.3% in 2014 and 2015, respectively, compared with 3.0% on December 31, 2013. On a positive note, lower yield will entail lower borrowing costs, inhibiting a rise in demand. In the long term, this will gradually strengthen the economy and contribute to GDP growth.
HOW TO ANALYZE A RESTAURANT COMPANY
The first, and perhaps the most important, step in analyzing a restaurant company is relating the fundamental outlook for the restaurant industry to the company under consideration. A range of factors, both quantitative and qualitative, can be helpful in comparing and contrasting a company with its competition, sub-industry peer group, and the restaurant industry in general.
Although absolute numbers are critical to the assessment of any company, comparative analysis is needed to measure the relative success of a company under given industry conditions. If a restaurant’s same-store sales are declining while the rest of the industry is showing gains, clearly there is cause for concern and further investigation. However, if a company’s competitors are also experiencing weak financial performance, even as the industry is doing relatively well, then the problem may lie beyond the company itself.
Further study then would likely suggest where the problems lie. Have consumer tastes or preferences shifted? Have costs, prices, or other factors changed in ways that make the potential investment return of the business more or less attractive? Analysis then could suggest how to address the problems or indicate that they may be too large or too broad for the company to fix. Conversely, if a company’s financial performance is stellar versus its peers, analysis could show if or for how long the outperformance can be sustained.
QUANTITATIVE ISSUES
Aspects of a restaurant’s business that can be measured quantitatively include same-store sales, systemwide sales, operating margin, return on assets, and cash flow. These numbers are the basis for analyzing company

34 RESTAURANTS / AUGUST 2014 INDUSTRY SURVEYS
trends over time, in order to determine whether the business is improving its performance. In addition, comparing the company’s results with those of its peers is useful in determining relative performance.
Same-store sales The most closely watched quantitative indicator is same-store sales, defined as year-over-year sales changes for units open and operating at post-startup levels in both years. A company that experiences declining same-store sales while the rest of the industry posts strong revenue gains is losing market share, and reasons for this loss need to be closely examined. It is important to note that some chains compare same-store sales for units open only 13 months—a less reliable indicator of sales strength than the 18-month period. Stores often take several months, if not years, to reach the maturity necessary to make meaningful comparisons.
Gains in same-store sales can be achieved through increases in prices and through increases in customer count, or traffic. Price increases are often necessary to offset wage and commodity cost inflation. From 2001 through 2003, many operators raised prices only modestly (2.3% annually, according to the Bureau of Labor Statistics), due to relatively slower demand growth compared with prior years. From 2004 through 2006, somewhat higher costs for food (especially beef) and utilities led many restaurant chains to raise menu prices at a slightly faster 3.1% annual pace. Hikes in the minimum wage, as well as acceleration of certain food costs starting in late 2007, contributed to increases in prices for food away from home in 2007 (4.0%) and 2008 (5.0%). Prices for food away from home increased only 3.5% in 2009, 1.3% in 2010, 2.3% in 2011, and 2.5% in 2012.
In May 2014, food-away-from-home prices increased 0.2%, up 2.2% from the same month in 2013. Noticeably, food-away-from-home prices are less volatile, as the inputs driving the prices (wages for restaurant workers, rents, and advertising costs) rise and fall less sharply as compared with commodity and fuel prices, according to the USDA. As stated in the Spendifference Survey in May 2014, restaurant operators planned to increase prices by 2.1% at the second half of 2014. We expect prices to increase by 2.5% in 2015, as the new minimum wage of $10.10 is likely to be implemented by January 2015. The ongoing drought in California, Texas, and Oklahoma may also affect the price of fruits, vegetables, dairy, and beef.
Traffic gains often reflect customer satisfaction. Diners are the ultimate judges of whether a restaurant’s food, price, and service meet their needs. If a chain fails to please customers and to report sufficient sales gains, its long-term growth—even its survival—can be in doubt. A company that is expanding rapidly by adding new units can boost overall sales growth, but it is important to monitor sales trends at existing units to be sure the concept is doing well.
One additional component of same-store sales is product mix. Shifts in mix can reflect menu changes, advertising and promotions, or changes in customer preferences—any factor that affects the size of the average check, other than price increases. Restaurants can raise the amount of the average check by adding higher-priced items to the menu, such as an increased assortment of appetizers and alcoholic beverages, or can lower it by featuring value products in an advertising campaign designed to spur traffic. Consumer choices also can alter product mix. In difficult economic times, for example, customers tend to avoid ordering desserts and drinks, or select less expensive options.
The same-store sales trends of a company should be considered within the context of the demographic and geographic markets it serves. A key issue the industry faced in 2013 was how companies responded to slow growth in employment and consumer real income, in particular for the low- and middle-income wage earners that have been negatively affected by higher payroll taxes.
Other nonrecurring factors can influence same-store sales comparisons. These may include the inclusion of an extra 14th week in a quarter or 53rd week in a year. Often these extra weeks are at the end of the year, and the week between Christmas and New Year’s Day is one of the strongest sales weeks throughout the year. Whether this week falls into the fourth quarter of the current fiscal year or the first quarter of the next can skew comparisons.

INDUSTRY SURVEYS RESTAURANTS / AUGUST 2014 35
Average weekly sales Some chains report the average weekly sales of their restaurants. For companies that are expanding rapidly, average weekly sales may be preferable to same-unit sales as an indicator of sales trends. Units that have been in operation for at least 18 months may not comprise a large enough percentage of the store base to give a true indication of the state of the business. Also, if average weekly sales growth is significantly lower (or higher) than same-store sales growth, it may indicate that new locations are opening to lower (higher) volumes than existing stores.
New store openings Opening new stores signifies that the company is expanding—a strategy that enables the company to penetrate the existing markets considering the associated risks involved in the restaurant business. By way of increasing store visibility, brand awareness is also increased. Generally, companies tend toward densely populated areas with heavy foot traffic; hence, population and demographics are important factors to consider when planning to open a new store.
Systemwide sales This measures the total revenues from restaurants operated by the company, its franchisees, and, in some cases, its licensees and affiliates. Sales from franchisees, and from affiliates that are less than 50% company-owned, are not recorded in a company’s revenues, although fees charged by the company to the franchisees are often incorporated.
Systemwide sales growth is an important factor in projecting the top-line growth potential of a company. It can occur through expansion of sales capacity or through same-store sales growth. Many restaurant companies rely more on expansion than same-store sales growth to achieve earnings growth. For instance, The Cheesecake Factory Inc. is an operator that has experienced consistently stellar restaurant traffic, but because it usually increases prices only in response to cost inflation, rather than to boost margins, the same-store sales growth at its restaurants tends to be moderate. However, Cheesecake Factory has been able to outperform the industry in terms of sales per unit and has generally reported higher same-store sales than its peers.
Operating margin Operating margin, which indicates how adept a company is at making a profit on its sales dollar, is arguably the most important profitability measure in assessing a restaurant company. To arrive at this figure, calculate the company’s total cost of restaurant sales, including such income statement line items as food, beverage, labor, and direct operating costs (such as uniforms, linen, china, utensils, menus, and decoration), plus occupancy, and allocated general and administrative expenses. Subtracting the total cost figure from restaurant sales gives the operating profit, which can then be divided by sales to give the operating margin.
Operating margin can be affected by a number of variables, including food and beverage costs, product mix, sales volumes, and competitive pricing pressures. Labor costs also affect margins. A lack of qualified workers can put upward pressure on salaries and benefits. Conversely, an ample supply of people in the 16–24 age category, the traditional source of labor for restaurants, can keep wage costs from escalating.
Another source of wage pressure is legislated increases in the minimum wage. After having remained at $5.15 per hour since 1997, a 41% increase in the federal minimum wage over three years was enacted in 2007. The minimum wage rose in three $0.70 increments on July 24 in 2007, 2008, and 2009, to an ending $7.25 an hour. About three-fifths of the states, however, have state minimum wage laws that set the hourly rate higher than the federal minimum (the remainder either have no minimum or set the state’s lowest wage automatically equal to the federal). For tip-earning employees, employers are required by law to ensure that such employees’ compensation (tips, plus direct hourly pay of a minimum of $2.13 an hour) is at least equal to the federal hourly minimum.
On June 12, 2014, the US Secretary of Labor Thomas E. Perez announced a proposed rule raising the minimum wage to $10.10 per hour starting on January 1, 2015 for workers on federal service and construction contracts. We think that many restaurant employees, particularly in upscale casual dining and fine dining restaurants, earn more than the minimum wage—in some cases, significantly more. Furthermore,

36 RESTAURANTS / AUGUST 2014 INDUSTRY SURVEYS
we think that wage increases at the minimum, or bottom of the scale, put pressure on wages further up for employees who are beyond entry level or have attained seniority.
Companies often pay managers short-term cash bonuses as performance incentives; these vary from year to year depending on how performance measures up against various internally set sales and profitability targets. However, many companies do not regularly report on the details of this expense, making periodic comparisons more difficult. We think that, in recent periods, some restaurant companies may have “managed” how and when they accrue bonuses, in order to meet their publicly stated financial targets.
Margin analysis should always be considered within the context of the segment of the restaurant industry that the company serves. For example, operating expenses may be higher in the casual dining segment than for the fast-food chains because of higher real estate costs, as sit-down dining requires more space both in the restaurant and for parking than high-volume fast-food chains.
Chains have sought to improve margins by rotating menu selections to take advantage of the food products that can be acquired cheaply. For instance, at a time of declining seafood prices, Applebee’s (operated by DineEquity Inc.), and Red Lobster (operated by Darden Restaurants Inc.) are particularly known for seasonal promotions.
Return on assets A company’s decision on whether to purchase or rent its locations can affect its reported operating margins. Chains that own their restaurants tend to have higher profit margins, as the depreciation expense is often less than what they would pay for rent. However, a company that purchases property must invest more capital in its stores. When comparing the financial results of companies that have different ownership profiles, return on assets (ROA) is a useful tool in analyzing relative performance.
Reviewing a company’s ROA over a multiyear period can reveal trends regarding the success of recent investments and may be a valuable guide in estimating prospects for future growth. A company is more likely to reinvest in its current business if its ROA is either high or trending upward, whereas a company with declining or low returns might reevaluate how it invests its capital.
Cash flow A corporation’s financial flexibility reveals much about its health. Projected cash flow—net income, plus noncash items such as depreciation and amortization—can be compared with expected cash needs. Capital resources are needed primarily to undertake the construction, acquisition, maintenance, and refurbishing of restaurants. Some companies are self-financing, with the ability to fund their capital expenditure programs from internally generated funds. Many more, however, require external sources. For the large publicly held chains, capital is generally provided via public stock offerings and debt financing.
Free cash flow (cash flow from operations less capital expenditures) can measure a company’s present ability to return funds to its shareholders and debt holders; it also may be a measure of a company’s maturity. If a company believes that its concepts have significant growth potential and high returns on investment, it is more likely to use its cash from operations to fund capital expenditures. However, as a company’s concepts mature, its return on new investments tends to slow, making the company more likely to return cash to its stakeholders.
Capital expenditures should be analyzed, to separate funds being used to expand a company’s business from investments required simply to maintain existing business. While funds for expansion are intended to increase future funds available for shareholders, amounts required to renovate, remodel, and maintain existing structures can be recurring, and should be seen as a consistent drain on cash from operations. Companies such as CEC Entertainment Inc. (operator of Chuck E. Cheese’s restaurants) have consistently large remodeling requirements that should be factored into the overall analysis.

INDUSTRY SURVEYS RESTAURANTS / AUGUST 2014 37
QUALITATIVE ISSUES
The key qualitative issues affecting a restaurant business are management’s expertise and its design and execution of the business strategy. Although these factors do not lend themselves to numerical analysis, they are nonetheless crucial to success.
In evaluating a restaurant company’s management team, an analyst should first ask whether its strategy makes sense in light of current and long-term industry trends. If the strategy is a good one, is the current management capable of executing it? What is management’s record for working together as a team? The quality of management often spells the difference between success and failure. We look for seasoned management teams that have performed well in both good times and bad.
A company’s expansion strategy is key to its long-term profitability potential. Companies may choose to grow via internal unit expansion or via acquisitions. In addition, many chains are hedging their bets on the success of one format and developing or acquiring other restaurant formats. For example, in April 30, 2014, Red Robin Gourmet Burgers, Inc., a casual dining restaurant chain, announced it acquisition of 32 Red Robin franchised restaurants in the US and Canada for approximately $40 million. The transaction is expected to be completed by late summer 2014.
Darden Restaurants, Inc., aimed at combining a strong portfolio of brands with unique differentiation and significant opportunity when it completed its acquisition of Yard House from TSG Consumer Partners LLC in August 2012 for $585 million. Yard House offers contemporary American cuisine with chef-inspired recipes and ethnic flavors, along with a wide range of draft beers in stylish and energetic settings.
In April 2014, Yum! Brands opened Super Chix, with a limited menu offering of chicken sandwiches and tenders, french fries, a few salads and frozen custards. Dubbed as “the last true chicken sandwich,” it sells at $3.95, $7.20 as a combo with fries and a drink, and $8.95 as a combo with frozen custard. Management’s selection of an industry segment for expansion is a key strategic decision. Certain segments may have lower levels of competition or higher potential growth. For instance, several fast-food chains have purchased concepts in the fast-casual segment to augment growth. In addition, success in the quick growing bar-and-grill and seafood segments may lead to more favorable results than in other areas of casual dining.
Rather than diversify, some companies prefer to focus on one concept or several similar concepts. These strategies allow a company to develop expertise it might not gain from a split focus. In recent years, McDonald’s Corp., Wendy’s International Inc., and Brinker International Inc. are among companies that have either divested or closed down chains that were not part of their core business or key to their future growth. If a chain was once touted as key to the company’s future growth, but the company later determines that this is no longer the case, it may signal that the company has financial or managerial weaknesses.
Finally, an examination of a company’s financial performance in the context of the industry environment and the competition is important. Because every management team portrays its operations in the best possible light, comparing this rhetoric with a company’s actual results is helpful in predicting the firm’s future prospects.
VALUATION MEASURES
Restaurant stocks generally tend to be somewhat volatile, partly reflecting the underlying cyclicality of the industry. S&P Capital IQ thinks prospects for future profit growth are paramount in determining a company’s worth. Common valuation measurements include multiples of earnings per share and cash flow. Keep in mind that valuations depend on various factors, including overall investor sentiment, industry and economic conditions, the level of interest rates, and the extent to which future earnings seem predictable. As is the case with other measures, valuations of a particular company should be compared with those of similar companies in the same industry. An analyst should also examine a company’s or industry’s historical valuations relative to a benchmark price-to-earnings ratio.

38 RESTAURANTS / AUGUST 2014 INDUSTRY SURVEYS
For the restaurant industry, wide swings in the valuation ratios can occur over the business cycle, as the sector’s earnings are affected by changing economic conditions, as well as by the sector going into and out of favor with investors. Thus, caution must be exercised in the interpretation of these metrics. A company that appears cheap relative to its peers, for example, may be at certain competitive disadvantages, such as a relative lack of attractive restaurant concepts, higher debt levels, or lower profit margins, to name a few reasons. As a result, other investors may place a lower valuation on the shares of such a company.
It is also important to take into account how management is performing and how well it is using the company’s capital such as by examining the profitability on various assets, as discussed earlier in this section. A change in management can lead to an increase in the value of a company’s stock if investors perceive that steps will be taken to produce higher returns.
Price-to-earnings (P/E) ratio. The most common means of valuing equities, the price-to-earnings (P/E) ratio is calculated as the share price divided by net earnings per share (EPS), for either the past 12 months or projected EPS for a specified future period.
Enterprise value to EBITDA. As an alternative to the standard P/E ratio, to eliminate distortions caused by differing tax rates and leverage, and to better evaluate a company’s operating performance, analysts compare the company’s enterprise value (combination of net debt and stock market value) to its earnings before interest, taxes, depreciation, and amortization (EBITDA).
INDUSTRY SURVEYS RESTAURANTS / AUGUST 2014 39
GLOSSARY
Fast-casual restaurants—A category within limited-service or quick-service restaurants that offers healthier, fresher, and more varied dishes than traditional fast food at a price point below that of casual dining restaurants. These restaurants are positioned between fast food and casual dining (hence, the hybrid name “fast casual,” also called “quick casual” and “limited service”).
Fast-food restaurants—Also called limited-service or quick-service restaurants, these outlets specialize in rapid food preparation and low prices (the average check is usually less than $7), with or without seating (table service is generally not available). Food packaging is often disposable, and take-out orders account for a large portion of this business.
Franchise agreement—A business contract between two companies: a franchisor (or parent company) and a franchisee (or individual business operator). It gives the franchisee the right to construct and operate a restaurant on a site accepted by the franchisor, and to use the franchisor’s operating and management systems. The franchisee pays the franchisor a one-time franchise fee, and then makes royalty payments based on gross receipts from restaurant operations, with specified minimum payments. In the US, royalty payments are generally 4%–5% of total receipts. Franchise contracts vary in length, but may be for periods of 10 to 20 years.
Full-service restaurants—Restaurants that generally feature moderate to high prices (the average check is generally at least $10) and sit-down service. Meals are often served with flatware and china, and alcoholic beverages may be available.
License—A contract similar to a franchise agreement, except that the contractual period is shorter, the rights are not as broad, and an initial fee may not be required. This contract gives the licensee the right to use the licenser’s name for a fee. Licensing is often used for nontraditional points of distribution, such as airports and gas stations.
Refranchising gains—Gains arising to a company from the purchase and resale of franchised units.
Same-store sales—Year-to-year sales changes at units open for a specified period, often at least 18 months.
Satellite restaurants—Small, low-volume units of a restaurant chain whose menu is an abbreviated version of the chain’s full menu. Satellite restaurants are often located in unique retail settings, like airports or within large retail stores.
Systemwide sales—A figure comprising sales by restaurants operated by the company, franchisees, and affiliates operating under joint venture agreements.
Total revenues—A comprehensive figure consisting of sales by company-operated restaurants and fees from restaurants operated by franchisees and affiliates.

40 RESTAURANTS / AUGUST 2014 INDUSTRY SURVEYS
INDUSTRY REFERENCES
PERIODICALS
Nation’s Restaurant News http://www.nrn.com Weekly; contains articles on a variety of restaurant industry topics.
QSR http://www.qsrmagazine.com Published 10 times annually; covers the quick-service sector of the restaurant industry.
Restaurant Business http://www.restaurantbusinessonline.com/ Published 18 times a year; spotlights various industry segments; customizable website.
Technomic Top 500 http://www.technomic.com Annual publication; detailed study of restaurant trends, and segmented look at industry market shares.
TRADE ASSOCIATIONS
International Franchise Association http://www.franchise.org A membership organization of franchisors, franchisees, and suppliers; provides information, products, and services to members.
National Restaurant Association http://www.restaurant.org Trade organization that works to promote the foodservice industry, and to protect and educate its members. Publishes industry data and research, including the Restaurant Industry Operations Report (annual; co-published with Deloitte & Touche) and an annual Restaurant Industry Forecast.
MARKET RESEARCH FIRMS
NPDFoodworld: CREST http://www.npd.com Part of market research firm NPD Group Inc. that tracks chain and independent restaurants, and consumer behavior and attitudes at commercial restaurants.
Technomic Inc. http://www.technomic.com A market research firm concerned with the restaurant industry.
GOVERNMENT AGENCIES
Economic Research Service http://www.ers.usda.gov Source of annual US statistics regarding food consumption, production, and trends; part of the US Department of Agriculture (USDA).
US Bureau of Labor Statistics http://www.bls.gov Source of weekly, monthly, and annual data on employment, wages, income, and spending; part of the US Department of Labor.
US Census Bureau http://www.census.gov Source of annual and monthly retail and foodservice sales; part of the US Department of Commerce.

INDUSTRY SURVEYS RESTAURANTS / AUGUST 2014 41
COMPARATIVE COMPANY ANALYSIS
Operating Revenues
Million $ CAGR (%) Index Basis (2003 = 100)
Ticker Company Yr. End 2013 2012 2011 2010 2009 2008 2003 10-Yr. 5-Yr. 1-Yr. 2013 2012 2011 2010 2009
RESTAURANTS‡BH § BIGLARI HOLDINGS INC SEP 755.8 C 740.2 709.2 673.8 A 627.0 610.1 499.1 4.2 4.4 2.1 151 148 142 135 126BJRI § BJ'S RESTAURANTS INC DEC 775.1 708.3 620.9 513.9 426.7 374.1 103.0 22.4 15.7 9.4 753 688 603 499 414BOBE § BOB EVANS FARMS # APR NA 1,608.9 A 1,652.4 1,676.9 1,726.8 1,750.5 1,198.0 NA NA NA NA 134 138 140 144EAT † BRINKER INTL INC JUN 2,846.1 2,826.9 2,761.4 2,858.5 D 3,620.6 4,235.2 3,285.4 (1.4) (7.6) 0.7 87 86 84 87 110BWLD § BUFFALO WILD WINGS INC DEC 1,266.7 1,040.5 784.5 613.3 538.9 422.4 126.5 25.9 24.6 21.7 1,001 823 620 485 426
CAKE † CHEESECAKE FACTORY INC DEC 1,877.9 1,809.0 1,757.6 1,659.4 1,602.0 1,606.4 773.8 9.3 3.2 3.8 243 234 227 214 207CMG [] CHIPOTLE MEXICAN GRILL INC DEC 3,214.6 2,731.2 2,269.5 1,835.9 1,518.4 1,329.7 315.5 26.1 19.3 17.7 1,019 866 719 582 481CBRL § CRACKER BARREL OLD CTRY STOR JUL 2,644.6 2,580.2 2,434.4 2,404.5 2,367.3 2,384.5 2,198.2 1.9 2.1 2.5 120 117 111 109 108DRI [] DARDEN RESTAURANTS INC # MAY NA 8,551.9 7,998.7 7,500.2 7,113.1 7,217.5 5,003.4 NA NA NA NA 171 160 150 142DIN § DINEEQUITY INC DEC 640.5 849.9 1,075.2 1,333.1 1,414.0 1,613.6 404.8 4.7 (16.9) (24.6) 158 210 266 329 349
DPZ † DOMINO'S PIZZA INC DEC 1,802.2 1,678.4 1,652.2 1,570.9 1,404.1 1,425.1 1,333.3 3.1 4.8 7.4 135 126 124 118 105JACK § JACK IN THE BOX INC SEP 1,489.9 D 1,545.0 D 2,193.3 2,297.5 2,471.1 A 2,539.6 D 2,058.3 A,F (3.2) (10.1) (3.6) 72 75 107 112 120MCD [] MCDONALD'S CORP DEC 28,105.7 27,567.0 27,006.0 24,074.6 22,744.7 23,522.4 17,140.5 5.1 3.6 2.0 164 161 158 140 133PNRA † PANERA BREAD CO DEC 2,385.0 2,130.1 A 1,822.0 A 1,542.5 A 1,353.5 1,298.9 355.9 21.0 12.9 12.0 670 599 512 433 380PZZA § PAPA JOHNS INTERNATIONAL INC DEC 1,439.0 1,342.7 1,217.9 1,126.4 1,106.0 A 1,132.1 917.4 C 4.6 4.9 7.2 157 146 133 123 121
RRGB § RED ROBIN GOURMET BURGERS DEC 1,017.2 977.1 914.8 860.8 841.0 869.2 A 328.6 12.0 3.2 4.1 310 297 278 262 256RT § RUBY TUESDAY INC # MAY NA 1,251.5 D 1,325.8 A 1,265.2 A 1,194.8 1,248.6 1,041.4 NA NA NA NA 120 127 121 115RUTH § RUTHS HOSPITALITY GROUP INC DEC 408.6 D 398.6 369.6 D 357.6 344.6 D 405.8 NA NA 0.1 2.5 ** ** ** ** NASONC § SONIC CORP AUG 542.6 543.7 546.0 550.9 718.8 804.7 446.6 2.0 (7.6) (0.2) 121 122 122 123 161SBUX [] STARBUCKS CORP SEP 14,892.2 A 13,299.5 A 11,700.4 10,707.4 9,774.6 10,383.0 A 4,075.5 13.8 7.5 12.0 365 326 287 263 240
TXRH § TEXAS ROADHOUSE INC DEC 1,422.6 1,263.3 1,109.2 1,005.0 942.3 880.5 A 286.5 17.4 10.1 12.6 497 441 387 351 329WEN † WENDY'S CO DEC 2,487.4 2,505.2 2,431.4 D 3,416.4 3,580.8 1,822.8 A 293.6 D 23.8 6.4 (0.7) 847 853 828 1,164 1,220YUM [] YUM BRANDS INC DEC 13,084.0 13,633.0 C 12,626.0 11,343.0 10,868.0 11,286.0 8,380.0 4.6 3.0 (4.0) 156 163 151 135 130
OTHER COMPANIES WITH SIGNIFICANT RESTAURANT OPERATIONSCOSI COSI INC DEC 86.3 98.0 102.1 109.7 118.6 135.6 D 107.3 (2.1) (8.6) (11.9) 80 91 95 102 111DNKN DUNKIN' BRANDS GROUP INC DEC 713.8 658.2 628.2 577.1 NA NA NA NA NA 8.5 ** ** ** ** NALUB LUBYS INC AUG 390.4 A 350.1 348.7 D 244.9 A,C 292.9 317.7 318.5 D 2.1 4.2 11.5 123 110 109 77 92
Note: Data as originally reported. CAGR-Compound annual grow th rate. ‡S&P 1500 index group. []Company included in the S&P 500. †Company included in the S&P MidCap 400. §Company included in the S&P SmallCap 600. #Of the follow ing calendar year. **Not calculated; data for base year or end year not available. A - This year's data reflect an acquisition or merger. B - This year's data reflect a major merger resulting in the formation of a new company. C - This year's data reflect an accounting change. D - Data exclude discontinued operations. E - Includes excise taxes. F - Includes other (nonoperating) income. G - Includes sale of leased depts. H - Some or all data are not available, due to a f iscal year change.

42 RESTAURANTS / AUGUST 2014 INDUSTRY SURVEYS
Net Income
Million $ CAGR (%) Index Basis (2003 = 100)
Ticker Company Yr. End 2013 2012 2011 2010 2009 2008 2003 10-Yr. 5-Yr. 1-Yr. 2013 2012 2011 2010 2009
RESTAURANTS‡BH § BIGLARI HOLDINGS INC SEP 140.3 21.6 34.6 28.1 6.0 (23.0) 20.9 20.9 NM 549.6 670 103 165 134 29BJRI § BJ'S RESTAURANTS INC DEC 21.0 31.4 31.6 23.2 13.0 10.3 3.6 19.3 15.3 (33.1) 585 874 879 645 363BOBE § BOB EVANS FARMS # APR NA (2.9) 72.8 54.2 70.3 (5.1) 72.0 NA NA NA ** (4) 101 75 98EAT † BRINKER INTL INC JUN 163.4 151.2 141.1 103.7 79.2 51.7 168.6 (0.3) 25.9 8.0 97 90 84 62 47BWLD § BUFFALO WILD WINGS INC DEC 71.6 57.3 50.4 38.4 30.7 24.4 3.6 34.9 24.0 24.9 1,997 1,599 1,407 1,072 856
CAKE † CHEESECAKE FACTORY INC DEC 114.4 98.4 95.7 81.7 42.8 52.3 57.8 7.1 16.9 16.2 198 170 166 141 74CMG [] CHIPOTLE MEXICAN GRILL INC DEC 327.4 278.0 214.9 179.0 126.8 78.2 (7.7) NM 33.2 17.8 NM NM NM NM NMCBRL § CRACKER BARREL OLD CTRY STOR JUL 117.3 103.1 85.2 85.3 66.0 65.3 106.5 1.0 12.4 13.8 110 97 80 80 62DRI [] DARDEN RESTAURANTS INC # MAY NA 412.6 476.5 478.7 407.0 371.8 227.2 NA NA NA ** 182 210 211 179DIN § DINEEQUITY INC DEC 72.0 127.7 75.2 (2.8) 31.4 (154.5) 36.8 7.0 NM (43.6) 196 347 204 (8) 85
DPZ † DOMINO'S PIZZA INC DEC 143.0 112.4 105.4 87.9 79.7 54.0 39.0 13.9 21.5 27.2 366 288 270 225 204JACK § JACK IN THE BOX INC SEP 82.6 63.0 80.6 70.2 131.0 118.2 73.6 1.2 (6.9) 31.2 112 86 109 95 178MCD [] MCDONALD'S CORP DEC 5,585.9 5,464.8 5,503.1 4,946.3 4,551.0 4,313.2 1,508.2 14.0 5.3 2.2 370 362 365 328 302PNRA † PANERA BREAD CO DEC 196.2 173.4 136.0 111.9 86.1 67.4 30.6 20.4 23.8 13.1 640 566 444 365 281PZZA § PAPA JOHNS INTERNATIONAL INC DEC 69.5 61.7 54.7 51.9 57.5 36.8 34.0 7.4 13.6 12.8 205 181 161 153 169
RRGB § RED ROBIN GOURMET BURGERS DEC 32.2 28.3 20.6 7.3 17.6 27.1 15.7 7.4 3.5 13.8 205 180 131 46 112RT § RUBY TUESDAY INC # MAY NA (23.4) (0.2) 46.9 45.3 (17.9) 109.8 NA NA NA ** (21) (0) 43 41RUTH § RUTHS HOSPITALITY GROUP INC DEC 23.8 16.4 19.1 16.6 2.5 (53.2) NA NA NM 44.8 ** ** ** ** NASONC § SONIC CORP AUG 36.7 36.1 19.2 21.2 49.4 60.3 52.3 (3.5) (9.5) 1.7 70 69 37 41 95SBUX [] STARBUCKS CORP SEP 8.3 1,383.8 1,245.7 945.6 390.8 315.5 268.3 (29.4) (51.7) (99.4) 3 516 464 352 146
TXRH § TEXAS ROADHOUSE INC DEC 80.4 71.2 64.0 58.3 47.5 38.2 23.1 13.3 16.1 13.0 348 308 276 252 205WEN † WENDY'S CO DEC 45.8 5.6 17.9 (4.3) 3.5 (482.0) (13.1) NM NM 720.8 NM NM NM NM NMYUM [] YUM BRANDS INC DEC 1,091.0 1,597.0 1,319.0 1,158.0 1,071.0 964.0 618.0 5.8 2.5 (31.7) 177 258 213 187 173
OTHER COMPANIES WITH SIGNIFICANT RESTAURANT OPERATIONSCOSI COSI INC DEC (11.4) (4.4) (6.5) (3.1) (11.1) (15.9) (26.6) NM NM NM NM NM NM NM NMDNKN DUNKIN' BRANDS GROUP INC DEC 146.9 108.3 34.4 26.9 NA NA NA NA NA 35.6 ** ** ** ** NALUB LUBYS INC AUG 4.2 7.6 2.6 (0.7) (26.2) 2.5 (2.5) NM 11.3 (44.1) NM NM NM NM NM
Note: Data as originally reported. CAGR-Compound annual grow th rate. ‡S&P 1500 index group. []Company included in the S&P 500. †Company included in the S&P MidCap 400. §Company included in the S&P SmallCap 600. #Of the follow ing calendar year. **Not calculated; data for base year or end year not available.

INDUSTRY SURVEYS RESTAURANTS / AUGUST 2014 43
Return on Revenues (%) Return on Assets (%) Return on Equity (%)
Ticker Company Yr. End 2013 2012 2011 2010 2009 2013 2012 2011 2010 2009 2013 2012 2011 2010 2009
RESTAURANTS‡BH § BIGLARI HOLDINGS INC SEP 18.6 2.9 4.9 4.2 1.0 15.9 3.0 5.6 5.2 1.2 30.7 6.9 13.1 10.4 2.1BJRI § BJ'S RESTAURANTS INC DEC 2.7 4.4 5.1 4.5 3.1 3.6 5.9 6.8 5.7 3.6 5.4 8.9 10.2 8.6 5.4BOBE § BOB EVANS FARMS # APR NA NM 4.4 3.2 4.1 NA NM 6.7 4.9 6.2 NA NM 11.0 8.3 11.4EAT † BRINKER INTL INC JUN 5.7 5.3 5.1 3.6 2.2 11.3 10.4 8.5 5.5 3.8 71.1 40.4 24.2 15.1 12.7BWLD § BUFFALO WILD WINGS INC DEC 5.6 5.5 6.4 6.3 5.7 11.0 10.5 11.5 11.1 11.1 16.9 16.3 17.5 16.5 16.1
CAKE † CHEESECAKE FACTORY INC DEC 6.1 5.4 5.4 4.9 2.7 10.3 9.3 9.3 7.9 3.9 19.8 17.5 16.9 14.7 8.8CMG [] CHIPOTLE MEXICAN GRILL INC DEC 10.2 10.2 9.5 9.7 8.4 17.8 18.0 16.9 17.2 14.2 23.5 24.3 23.2 23.6 19.1CBRL § CRACKER BARREL OLD CTRY STOR JUL 4.4 4.0 3.5 3.5 2.8 8.4 7.6 6.5 6.7 5.2 27.1 31.7 37.1 52.1 57.8DRI [] DARDEN RESTAURANTS INC # MAY NA 4.8 6.0 6.4 5.7 NA 6.4 8.4 8.9 7.9 NA 21.2 25.2 25.0 23.3DIN § DINEEQUITY INC DEC 11.2 15.0 7.0 NM 2.2 3.0 5.0 2.7 NM 0.3 23.1 59.7 95.4 NM 53.7
DPZ † DOMINO'S PIZZA INC DEC 7.9 6.7 6.4 5.6 5.7 28.5 23.4 22.4 19.2 17.4 NA NA NA NA NA JACK § JACK IN THE BOX INC SEP 5.5 4.1 3.7 3.1 5.3 5.9 4.3 5.7 4.9 8.9 18.7 15.4 17.4 13.4 26.7MCD [] MCDONALD'S CORP DEC 19.9 19.8 20.4 20.5 20.0 15.5 16.0 16.9 15.9 15.5 35.7 36.8 37.9 34.5 33.2PNRA † PANERA BREAD CO DEC 8.2 8.1 7.5 7.3 6.4 16.0 15.1 13.9 12.7 11.4 25.8 23.5 21.7 18.8 15.8PZZA § PAPA JOHNS INTERNATIONAL INC DEC 4.8 4.6 4.5 4.6 5.2 15.4 14.9 13.6 12.8 14.7 43.6 31.9 27.1 27.7 37.4
RRGB § RED ROBIN GOURMET BURGERS DEC 3.2 2.9 2.2 0.8 2.1 5.2 4.8 3.5 1.2 2.9 9.9 9.4 6.9 2.5 6.3
RT § RUBY TUESDAY INC # MAY NA NM NM 3.7 3.8 NA NM NM 4.2 4.1 NA NM NM 8.3 9.5
RUTH § RUTHS HOSPITALITY GROUP INC DEC 5.8 4.1 5.2 4.6 0.7 10.4 6.7 6.6 5.6 0.9 26.0 17.4 18.0 23.1 6.4
SONC § SONIC CORP AUG 6.8 6.6 3.5 3.8 6.9 5.5 5.3 2.7 2.7 5.9 53.7 65.1 51.9 234.7 NA
SBUX [] STARBUCKS CORP SEP 0.1 10.4 10.6 8.8 4.0 0.1 17.8 18.1 15.8 6.9 0.2 29.2 30.9 28.1 14.1
TXRH § TEXAS ROADHOUSE INC DEC 5.7 5.6 5.8 5.8 5.0 9.6 9.3 8.9 8.5 7.4 14.5 14.0 12.9 12.7 12.2
WEN † WENDY'S CO DEC 1.8 0.2 0.7 NM 0.1 1.1 0.1 0.4 NM 0.1 2.3 0.3 0.9 NM 0.1
YUM [] YUM BRANDS INC DEC 8.3 11.7 10.4 10.2 9.9 12.3 17.9 15.4 15.0 15.7 50.5 80.3 77.6 89.0 233.6
OTHER COMPANIES WITH SIGNIFICANT RESTAURANT OPERATIONSCOSI COSI INC DEC NM NM NM NM NM NM NM NM NM NM NM NM NM NM NMDNKN DUNKIN' BRANDS GROUP INC DEC 20.6 16.5 5.5 4.7 NA 4.6 3.4 1.1 NA NA 39.0 19.8 32.6 NA NALUB LUBYS INC AUG 1.1 2.2 0.7 NM NM 1.8 3.3 1.1 NM NM 2.4 4.5 1.6 NM NM
Note: Data as originally reported. ‡S&P 1500 index group. []Company included in the S&P 500. †Company included in the S&P MidCap 400. §Company included in the S&P SmallCap 600. #Of the follow ing calendar year.

44 RESTAURANTS / AUGUST 2014 INDUSTRY SURVEYS
Debt as a % ofCurrent Ratio Debt / Capital Ratio (%) Net Working Capital
Ticker Company Yr. End 2013 2012 2011 2010 2009 2013 2012 2011 2010 2009 2013 2012 2011 2010 2009
RESTAURANTS‡BH § BIGLARI HOLDINGS INC SEP 1.7 2.8 2.1 1.2 1.2 25.0 36.0 39.6 30.6 30.2 256.6 102.6 173.0 744.8 857.1BJRI § BJ'S RESTAURANTS INC DEC 0.8 1.0 1.2 1.3 1.1 0.0 0.0 0.0 0.0 1.8 NM 0.0 0.0 0.0 66.2BOBE § BOB EVANS FARMS # APR NA 0.4 0.5 0.7 0.4 NA 0.1 12.1 15.8 17.5 NA NM NM NM NMEAT † BRINKER INTL INC JUN 0.5 0.5 0.5 1.1 0.9 83.9 65.5 53.4 41.9 52.8 NM NM NM NM NMBWLD § BUFFALO WILD WINGS INC DEC 1.1 0.9 1.2 1.7 1.5 0.0 0.0 0.0 0.0 0.0 0.0 NM 0.0 0.0 0.0
CAKE † CHEESECAKE FACTORY INC DEC 0.9 0.9 0.8 0.9 0.9 8.9 7.6 7.8 7.1 20.1 NM NM NM NM NMCMG [] CHIPOTLE MEXICAN GRILL INC DEC 3.3 2.9 3.2 3.3 2.9 0.0 0.3 0.3 0.4 0.5 NM 0.9 1.0 1.3 1.9CBRL § CRACKER BARREL OLD CTRY STOR JUL 1.0 1.1 0.9 0.8 0.7 42.5 54.1 62.1 69.8 76.9 NM NM NM NM NMDRI [] DARDEN RESTAURANTS INC # MAY NA 0.5 0.4 0.5 0.5 NA 51.3 41.2 39.1 40.4 NA NM NM NM NMDIN § DINEEQUITY INC DEC 1.2 1.1 1.1 1.3 1.3 67.5 67.3 76.0 81.4 77.0 NM NM NM NM NM
DPZ † DOMINO'S PIZZA INC DEC 1.4 1.3 1.7 1.6 1.3 657.7 653.0 528.7 530.0 664.5 NM NM NM NM NMJACK § JACK IN THE BOX INC SEP 0.6 0.8 0.9 1.0 0.9 42.5 49.6 52.1 40.4 40.4 NM NM NM NM NMMCD [] MCDONALD'S CORP DEC 1.6 1.4 1.3 1.5 1.1 44.5 44.8 43.5 41.9 40.8 751.5 897.5 NM 796.3 NMPNRA † PANERA BREAD CO DEC 1.0 1.7 1.5 1.6 2.3 0.7 0.7 0.2 0.0 0.0 NM 3.1 1.3 0.0 0.0PZZA § PAPA JOHNS INTERNATIONAL INC DEC 1.3 1.1 1.2 1.2 1.0 48.1 29.6 18.5 33.2 35.9 581.0 586.6 376.1 456.6 NM
RRGB § RED ROBIN GOURMET BURGERS DEC 0.6 0.7 0.8 0.6 0.6 20.2 30.4 33.3 31.6 37.3 NM NM NM NM NM
RT § RUBY TUESDAY INC # MAY NA 1.1 1.0 0.7 0.7 NA 35.7 33.9 34.2 32.4 NA NM NM NM NM
RUTH § RUTHS HOSPITALITY GROUP INC DEC 0.5 0.4 0.4 0.4 0.4 15.9 35.3 15.1 32.9 75.0 NM NM NM NM NM
SONC § SONIC CORP AUG 1.9 1.3 1.3 1.1 1.7 80.4 84.7 86.6 93.8 96.6 678.3 NM NM NM 805.7
SBUX [] STARBUCKS CORP SEP 1.0 1.9 1.8 1.5 1.3 22.4 9.7 11.1 13.0 15.2 NM 27.6 32.0 56.2 120.8
TXRH § TEXAS ROADHOUSE INC DEC 0.8 0.8 0.8 1.0 0.7 7.9 8.8 11.0 9.3 19.2 NM NM NM NM NM
WEN † WENDY'S CO DEC 2.6 2.5 2.0 1.8 1.8 37.1 37.3 35.4 37.6 34.8 248.8 341.6 356.6 466.2 371.6
YUM [] YUM BRANDS INC DEC 0.7 0.9 0.9 0.9 0.7 55.5 55.4 61.6 64.2 74.6 NM NM NM NM NM
OTHER COMPANIES WITH SIGNIFICANT RESTAURANT OPERATIONSCOSI COSI INC DEC 0.8 1.6 0.8 1.1 0.6 0.0 0.0 0.0 0.0 0.0 NM 0.0 NM NM NMDNKN DUNKIN' BRANDS GROUP INC DEC 1.3 1.2 1.3 1.0 NA 65.2 66.7 52.4 67.5 NA NM NM NM NM NALUB LUBYS INC AUG 0.3 0.4 0.4 0.3 0.2 9.8 7.0 11.5 20.5 0.0 NM NM NM NM NM
Note: Data as originally reported. ‡S&P 1500 index group. []Company included in the S&P 500. †Company included in the S&P MidCap 400. §Company included in the S&P SmallCap 600. #Of the follow ing calendar year.
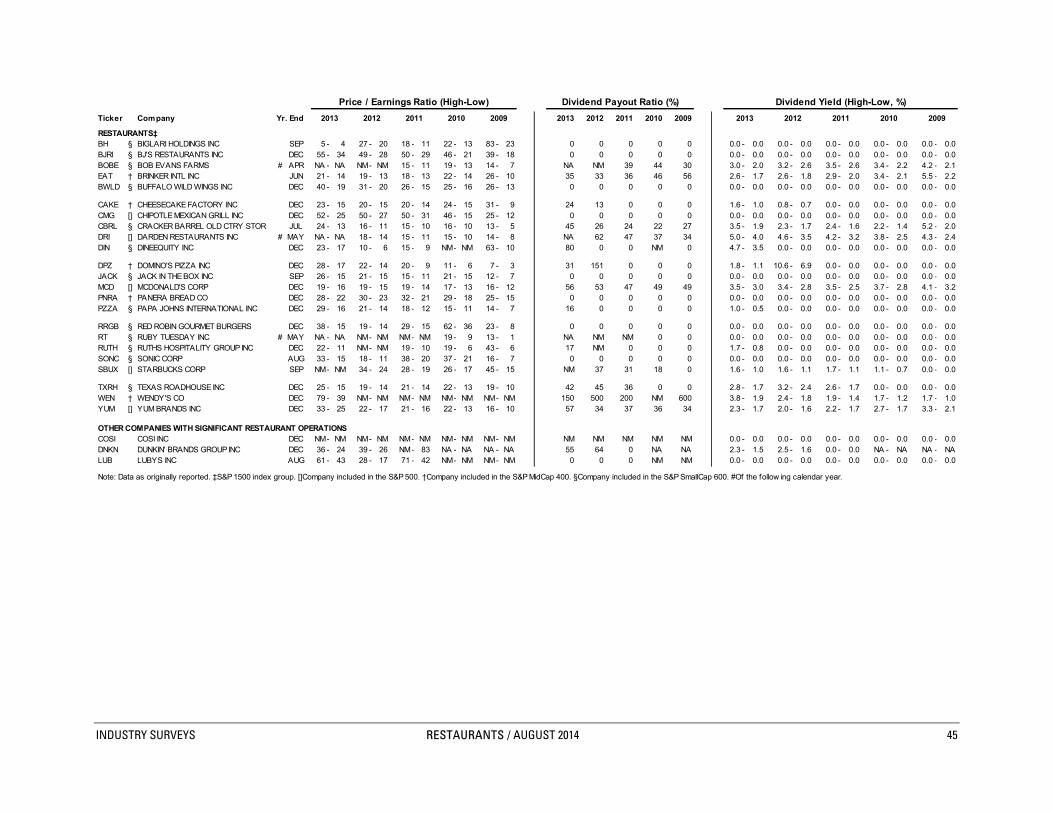
INDUSTRY SURVEYS RESTAURANTS / AUGUST 2014 45
Price / Earnings Ratio (High-Low) Dividend Payout Ratio (%) Dividend Yield (High-Low, %)
Ticker Company Yr. End 2013 2012 2011 2010 2009 2013 2012 2011 2010 2009
RESTAURANTS‡BH § BIGLARI HOLDINGS INC SEP 5 - 4 27 - 20 18 - 11 22 - 13 83 - 23 0 0 0 0 0 0.0 - 0.0 0.0 - 0.0 0.0 - 0.0 0.0 - 0.0 0.0 - 0.0BJRI § BJ'S RESTAURANTS INC DEC 55 - 34 49 - 28 50 - 29 46 - 21 39 - 18 0 0 0 0 0 0.0 - 0.0 0.0 - 0.0 0.0 - 0.0 0.0 - 0.0 0.0 - 0.0BOBE § BOB EVANS FARMS # APR NA - NA NM- NM 15 - 11 19 - 13 14 - 7 NA NM 39 44 30 3.0 - 2.0 3.2 - 2.6 3.5 - 2.6 3.4 - 2.2 4.2 - 2.1EAT † BRINKER INTL INC JUN 21 - 14 19 - 13 18 - 13 22 - 14 26 - 10 35 33 36 46 56 2.6 - 1.7 2.6 - 1.8 2.9 - 2.0 3.4 - 2.1 5.5 - 2.2BWLD § BUFFALO WILD WINGS INC DEC 40 - 19 31 - 20 26 - 15 25 - 16 26 - 13 0 0 0 0 0 0.0 - 0.0 0.0 - 0.0 0.0 - 0.0 0.0 - 0.0 0.0 - 0.0
CAKE † CHEESECAKE FACTORY INC DEC 23 - 15 20 - 15 20 - 14 24 - 15 31 - 9 24 13 0 0 0 1.6 - 1.0 0.8 - 0.7 0.0 - 0.0 0.0 - 0.0 0.0 - 0.0CMG [] CHIPOTLE MEXICAN GRILL INC DEC 52 - 25 50 - 27 50 - 31 46 - 15 25 - 12 0 0 0 0 0 0.0 - 0.0 0.0 - 0.0 0.0 - 0.0 0.0 - 0.0 0.0 - 0.0CBRL § CRACKER BARREL OLD CTRY STOR JUL 24 - 13 16 - 11 15 - 10 16 - 10 13 - 5 45 26 24 22 27 3.5 - 1.9 2.3 - 1.7 2.4 - 1.6 2.2 - 1.4 5.2 - 2.0DRI [] DARDEN RESTAURANTS INC # MAY NA - NA 18 - 14 15 - 11 15 - 10 14 - 8 NA 62 47 37 34 5.0 - 4.0 4.6 - 3.5 4.2 - 3.2 3.8 - 2.5 4.3 - 2.4DIN § DINEEQUITY INC DEC 23 - 17 10 - 6 15 - 9 NM- NM 63 - 10 80 0 0 NM 0 4.7 - 3.5 0.0 - 0.0 0.0 - 0.0 0.0 - 0.0 0.0 - 0.0
DPZ † DOMINO'S PIZZA INC DEC 28 - 17 22 - 14 20 - 9 11 - 6 7 - 3 31 151 0 0 0 1.8 - 1.1 10.6 - 6.9 0.0 - 0.0 0.0 - 0.0 0.0 - 0.0JACK § JACK IN THE BOX INC SEP 26 - 15 21 - 15 15 - 11 21 - 15 12 - 7 0 0 0 0 0 0.0 - 0.0 0.0 - 0.0 0.0 - 0.0 0.0 - 0.0 0.0 - 0.0MCD [] MCDONALD'S CORP DEC 19 - 16 19 - 15 19 - 14 17 - 13 16 - 12 56 53 47 49 49 3.5 - 3.0 3.4 - 2.8 3.5 - 2.5 3.7 - 2.8 4.1 - 3.2PNRA † PANERA BREAD CO DEC 28 - 22 30 - 23 32 - 21 29 - 18 25 - 15 0 0 0 0 0 0.0 - 0.0 0.0 - 0.0 0.0 - 0.0 0.0 - 0.0 0.0 - 0.0PZZA § PAPA JOHNS INTERNATIONAL INC DEC 29 - 16 21 - 14 18 - 12 15 - 11 14 - 7 16 0 0 0 0 1.0 - 0.5 0.0 - 0.0 0.0 - 0.0 0.0 - 0.0 0.0 - 0.0
RRGB § RED ROBIN GOURMET BURGERS DEC 38 - 15 19 - 14 29 - 15 62 - 36 23 - 8 0 0 0 0 0 0.0 - 0.0 0.0 - 0.0 0.0 - 0.0 0.0 - 0.0 0.0 - 0.0RT § RUBY TUESDAY INC # MAY NA - NA NM- NM NM- NM 19 - 9 13 - 1 NA NM NM 0 0 0.0 - 0.0 0.0 - 0.0 0.0 - 0.0 0.0 - 0.0 0.0 - 0.0RUTH § RUTHS HOSPITALITY GROUP INC DEC 22 - 11 NM- NM 19 - 10 19 - 6 43 - 6 17 NM 0 0 0 1.7 - 0.8 0.0 - 0.0 0.0 - 0.0 0.0 - 0.0 0.0 - 0.0SONC § SONIC CORP AUG 33 - 15 18 - 11 38 - 20 37 - 21 16 - 7 0 0 0 0 0 0.0 - 0.0 0.0 - 0.0 0.0 - 0.0 0.0 - 0.0 0.0 - 0.0SBUX [] STARBUCKS CORP SEP NM- NM 34 - 24 28 - 19 26 - 17 45 - 15 NM 37 31 18 0 1.6 - 1.0 1.6 - 1.1 1.7 - 1.1 1.1 - 0.7 0.0 - 0.0
TXRH § TEXAS ROADHOUSE INC DEC 25 - 15 19 - 14 21 - 14 22 - 13 19 - 10 42 45 36 0 0 2.8 - 1.7 3.2 - 2.4 2.6 - 1.7 0.0 - 0.0 0.0 - 0.0WEN † WENDY'S CO DEC 79 - 39 NM- NM NM- NM NM- NM NM- NM 150 500 200 NM 600 3.8 - 1.9 2.4 - 1.8 1.9 - 1.4 1.7 - 1.2 1.7 - 1.0YUM [] YUM BRANDS INC DEC 33 - 25 22 - 17 21 - 16 22 - 13 16 - 10 57 34 37 36 34 2.3 - 1.7 2.0 - 1.6 2.2 - 1.7 2.7 - 1.7 3.3 - 2.1
OTHER COMPANIES WITH SIGNIFICANT RESTAURANT OPERATIONSCOSI COSI INC DEC NM- NM NM- NM NM- NM NM- NM NM- NM NM NM NM NM NM 0.0 - 0.0 0.0 - 0.0 0.0 - 0.0 0.0 - 0.0 0.0 - 0.0DNKN DUNKIN' BRANDS GROUP INC DEC 36 - 24 39 - 26 NM- 83 NA - NA NA - NA 55 64 0 NA NA 2.3 - 1.5 2.5 - 1.6 0.0 - 0.0 NA - NA NA - NALUB LUBYS INC AUG 61 - 43 28 - 17 71 - 42 NM- NM NM- NM 0 0 0 NM NM 0.0 - 0.0 0.0 - 0.0 0.0 - 0.0 0.0 - 0.0 0.0 - 0.0
Note: Data as originally reported. ‡S&P 1500 index group. []Company included in the S&P 500. †Company included in the S&P MidCap 400. §Company included in the S&P SmallCap 600. #Of the follow ing calendar year.
20092013 2012 2011 2010

46 RESTAURANTS / AUGUST 2014 INDUSTRY SURVEYS
Earnings per Share ($) Tangible Book Value per Share ($) Share Price (High-Low, $)
Ticker Company Yr. End 2013 2012 2011 2010 2009 2013 2012 2011 2010 2009 2013 2012 2011 2010 2009
RESTAURANTS‡BH § BIGLARI HOLDINGS INC SEP 98.11 16.19 25.99 20.11 4.20 337.74 261.89 205.50 179.35 186.80 523.00 - 365.00 431.74 - 326.55 464.77 - 279.86 448.00 - 254.01 350.00 - 98.40BJRI § BJ'S RESTAURANTS INC DEC 0.75 1.12 1.14 0.86 0.49 14.02 13.08 11.81 10.36 9.27 40.99 - 25.50 54.46 - 31.03 56.64 - 32.84 39.32 - 18.42 19.29 - 8.76BOBE § BOB EVANS FARMS # APR NA (0.10) 2.45 1.79 2.29 NA 20.35 21.50 20.57 19.59 60.22 - 39.63 41.83 - 33.22 36.98 - 27.41 34.86 - 23.10 32.84 - 16.14EAT † BRINKER INTL INC JUN 2.28 1.93 1.55 1.02 0.78 0.11 2.42 3.80 5.95 5.05 47.85 - 30.85 36.24 - 24.92 27.35 - 19.50 22.56 - 13.96 20.09 - 7.95BWLD § BUFFALO WILD WINGS INC DEC 3.81 3.08 2.75 2.11 1.70 21.01 16.63 15.06 13.14 10.63 152.53 - 71.46 94.81 - 62.19 70.47 - 42.42 52.99 - 34.33 44.80 - 21.30
CAKE † CHEESECAKE FACTORY INC DEC 2.19 1.85 1.70 1.39 0.72 10.79 10.52 9.66 9.85 8.49 49.74 - 32.63 36.24 - 28.58 34.07 - 23.65 34.00 - 20.75 22.63 - 6.84CMG [] CHIPOTLE MEXICAN GRILL INC DEC 10.58 8.82 6.89 5.73 3.99 48.86 39.37 32.71 25.39 21.65 550.28 - 266.02 442.40 - 233.82 347.94 - 213.06 262.77 - 86.00 98.66 - 46.46CBRL § CRACKER BARREL OLD CTRY STOR JUL 4.95 4.47 3.70 3.71 2.94 20.34 16.30 11.73 8.43 5.97 118.63 - 63.40 69.30 - 49.53 55.53 - 37.31 57.79 - 36.17 39.50 - 15.44DRI [] DARDEN RESTAURANTS INC # MAY NA 3.20 3.66 3.50 2.92 NA 3.49 5.79 6.50 5.96 55.25 - 44.11 57.93 - 43.80 53.81 - 40.69 50.83 - 33.72 41.21 - 23.32DIN § DINEEQUITY INC DEC 3.75 6.81 3.96 (1.74) 0.55 (61.78) (62.23) (78.02) (82.05) (86.36) 85.74 - 64.44 68.47 - 40.28 60.11 - 35.20 57.80 - 22.13 34.71 - 5.24
DPZ † DOMINO'S PIZZA INC DEC 2.58 1.99 1.79 1.50 1.39 (23.43) (24.01) (21.24) (20.42) (22.85) 71.17 - 43.81 43.74 - 28.17 35.30 - 15.80 16.32 - 8.41 10.07 - 4.58JACK § JACK IN THE BOX INC SEP 1.91 1.43 1.63 1.27 2.31 7.20 5.79 6.39 7.90 7.34 50.45 - 28.34 29.47 - 21.01 24.51 - 18.25 26.37 - 18.42 28.35 - 16.59MCD [] MCDONALD'S CORP DEC 5.59 5.41 5.33 4.64 4.17 13.26 12.46 11.49 11.44 10.78 103.70 - 89.25 102.22 - 83.31 101.00 - 72.14 80.94 - 61.06 64.75 - 50.44PNRA † PANERA BREAD CO DEC 6.85 5.94 4.59 3.65 2.81 17.96 20.68 16.18 14.89 15.52 194.77 - 150.33 175.26 - 135.15 145.46 - 94.62 106.87 - 64.89 68.94 - 42.30PZZA § PAPA JOHNS INTERNATIONAL INC DEC 1.58 1.32 1.10 0.99 1.03 1.40 2.31 2.72 2.44 1.86 46.49 - 24.94 28.21 - 18.13 19.46 - 13.48 14.42 - 10.76 14.63 - 7.66
RRGB § RED ROBIN GOURMET BURGERS DEC 2.27 1.97 1.36 0.47 1.14 17.29 14.80 13.30 12.55 11.51 86.83 - 34.04 37.98 - 27.18 39.32 - 20.23 29.10 - 16.85 26.44 - 9.27RT § RUBY TUESDAY INC # MAY NA (0.38) 0.00 0.73 0.74 NA 8.17 8.47 8.63 8.29 9.90 - 5.40 9.39 - 4.98 15.57 - 6.35 14.06 - 6.77 9.38 - 0.85RUTH § RUTHS HOSPITALITY GROUP INC DEC 0.69 (0.58) 0.38 0.35 0.11 0.87 0.33 0.83 0.15 (1.45) 15.30 - 7.27 7.75 - 5.07 7.10 - 3.79 6.60 - 2.11 4.74 - 0.70SONC § SONIC CORP AUG 0.65 0.60 0.31 0.35 0.81 (0.10) (0.42) (0.55) (1.05) (1.52) 21.48 - 9.87 10.94 - 6.50 11.86 - 6.35 13.11 - 7.28 12.86 - 6.05SBUX [] STARBUCKS CORP SEP 0.01 1.83 1.66 1.27 0.53 4.44 6.09 5.31 4.50 3.66 82.50 - 52.52 62.00 - 43.04 46.50 - 30.75 33.15 - 21.26 23.95 - 8.12
TXRH § TEXAS ROADHOUSE INC DEC 1.15 1.02 0.90 0.82 0.68 6.58 5.83 5.38 5.19 4.20 29.07 - 16.90 19.35 - 14.59 18.52 - 12.21 18.28 - 10.56 12.75 - 6.72WEN † WENDY'S CO DEC 0.12 0.02 0.04 (0.01) 0.01 (0.56) (0.49) (0.46) (0.19) 0.14 9.51 - 4.68 5.50 - 4.09 5.62 - 4.29 5.55 - 3.83 5.80 - 3.55YUM [] YUM BRANDS INC DEC 2.41 3.46 2.81 2.44 2.28 1.44 0.95 1.83 0.94 (0.16) 78.68 - 59.68 74.75 - 58.40 59.79 - 46.27 52.47 - 32.49 36.96 - 23.37
OTHER COMPANIES WITH SIGNIFICANT RESTAURANT OPERATIONSCOSI COSI INC DEC (0.64) (0.28) (0.52) (0.24) (1.08) 0.14 0.75 0.40 0.88 0.87 3.92 - 1.30 5.20 - 2.08 6.72 - 2.24 5.84 - 2.33 4.84 - 0.65DNKN DUNKIN' BRANDS GROUP INC DEC 1.38 0.94 0.28 0.22 NA (18.16) (19.08) (13.75) (70.69) NA 49.48 - 33.06 37.02 - 24.35 31.94 - 23.24 NA - NA NA - NALUB LUBYS INC AUG 0.15 0.27 0.09 (0.02) (0.93) 5.29 5.17 4.86 4.70 5.83 9.19 - 6.49 7.48 - 4.60 6.40 - 3.81 6.97 - 3.30 5.88 - 3.23
Note: Data as originally reported. ‡S&P 1500 index group. []Company included in the S&P 500. †Company included in the S&P MidCap 400. §Company included in the S&P SmallCap 600. #Of the follow ing calendar year. J-This amount includes intangibles that cannot be identif ied.
The analysis and opinion set forth in this publication are provided by S&P Capital IQ Equity Research and are prepared separately from any other analytic activity of Standard & Poor’s.
In this regard, S&P Capital IQ Equity Research has no access to nonpublic information received by other units of Standard & Poor’s.
The accuracy and completeness of information obtained from third-party sources, and the opinions based on such information, are not guaranteed.

INDUSTRY SURVEYS RESTAURANTS / AUGUST 2014 47
General Disclaimers S&P Capital IQ’s Industry Surveys Reports (the “Industry Surveys”) have been prepared and issued by S&P Capital IQ and/or one of its affiliates. In the United States and United Kingdom, the Industry Surveys are prepared and issued by Standard & Poor’s Financial Services LLC; in Hong Kong, by Standard & Poor’s Investment Advisory Services (HK) Limited, which is regulated by the Hong Kong Securities Futures Commission; in Singapore, by McGraw Hill Financial Singapore Pte. Limited, which is regulated by the Monetary Authority of Singapore; in Malaysia, by Standard & Poor’s Malaysia Sdn Bhd, which is regulated by the Securities Commission of Malaysia; in Australia, by Standard & Poor’s Information Services (Australia) Pty Ltd, which is regulated by the Australian Securities & Investments Commission; and in Japan, by McGraw Hill Financial Japan KK, which is registered by Kanto Financial Bureau. No content (including ratings, credit-related analyses and data, valuations, model, software or other application or output therefrom) or any part thereof (Content) may be modified, reverse engineered, reproduced or distributed in any form by any means, or stored in a database or retrieval system, without the prior written permission of Standard & Poor’s Financial Services LLC or its affiliates (collectively, S&P). The Content shall not be used for any unlawful or unauthorized purposes. S&P and any third-party providers, as well as their directors, officers, shareholders, employees or agents (collectively S&P Parties) do not guarantee the accuracy, completeness, timeliness or availability of the Content. S&P Parties are not responsible for any errors or omissions (negligent or otherwise), regardless of the cause, for the results obtained from the use of the Content, or for the security or maintenance of any data input by the user. The Content is provided on an “as is” basis. S&P PARTIES DISCLAIM ANY AND ALL EXPRESS OR IMPLIED WARRANTIES, INCLUDING, BUT NOT LIMITED TO, ANY WARRANTIES OF MERCHANTABILITY OR FITNESS FOR A PARTICULAR PURPOSE OR USE, FREEDOM FROM BUGS, SOFTWARE ERRORS OR DEFECTS, THAT THE CONTENT’S FUNCTIONING WILL BE UNINTERRUPTED OR THAT THE CONTENT WILL OPERATE WITH ANY SOFTWARE OR HARDWARE CONFIGURATION. In no event shall S&P Parties be liable to any party for any direct, indirect, incidental, exemplary, compensatory, punitive, special or consequential damages, costs, expenses, legal fees, or losses (including, without limitation, lost income or lost profits and opportunity costs or losses caused by negligence) in connection with any use of the Content even if advised of the possibility of such damages. Credit-related and other analyses, including ratings, and statements in the Content are statements of opinion as of the date they are expressed and not statements of fact. S&P’s opinions, analyses and rating acknowledgment decisions (described below) are not recommendations to purchase, hold, or sell any securities or to make any investment decisions, and do not address the suitability of any security. S&P assumes no obligation to update the Content following publication in any form or format. The Content should not be relied on and is not a substitute for the skill, judgment and experience of the user, its management, employees, advisers and/or clients when making investment and other business decisions. S&P does not act as a fiduciary or an investment adviser except where registered as such. While S&P has obtained information from sources it believes to be reliable, S&P does not perform an audit and undertakes no duty of due diligence or independent verification of any information it receives. S&P keeps certain activities of its business units separate from each other in order to preserve the independence and objectivity of their respective activities. As a result, certain business units of S&P may have information that is not available to other S&P business units. S&P has established policies and procedures to maintain the confidentiality of certain non-public information received in connection with each analytical process. S&P provides a wide range of services to, or relating to, many organizations, including issuers or underwriters of securities or obligors, investment advisers, broker-dealers, investment banks, other financial institutions and financial intermediaries. As a result, S&P may receive fees or other economic benefits from organizations whose securities or services it may recommend, analyze, rate, include in model portfolios, evaluate, price or otherwise address. The Industry Surveys are not intended to be investment advice and do not constitute any form of invitation or inducement by S&P Capital IQ to engage in investment activity. This material is not intended as an offer or solicitation for the purchase or sale of any security or other financial instrument. Any opinions expressed herein are given in good faith, are subject to change without notice, and are only current as of the stated date of their issue. Past performance is not necessarily indicative of future results. For details on the S&P Capital IQ conflict-of-interest policies, please visit: www.spcapitaliq.com/Policies
Notice to all Non-US Residents: S&P Capital IQ’s Industry Surveys may be distributed in certain localities, countries and/or jurisdictions (“Territories”) by independent third parties or independent intermediaries and/or distributors (the “Intermediaries” or “Distributors”). Intermediaries are not acting as agents or representatives of S&P Capital IQ. In Territories where an Intermediary distributes S&P Capital IQ’s Industry Surveys, the Intermediary, and not S&P Capital IQ, is solely responsible for complying with all applicable regulations, laws, rules, circulars, codes and guidelines established by local and/or regional regulatory authorities, including laws in connection with the distribution of third-party investment research, licensing requirements, supervisory and record keeping obligations that the Intermediary may have under the applicable laws and regulations of the territories where it distributes the Industry Surveys. Industry Surveys are not directed to, or intended for distribution to or use by, any person or entity who is a citizen or resident of or located in any locality, state, country or other jurisdiction where such distribution, publication, availability or use would be contrary to law or regulation or which would subject S&P Capital IQ or its affiliates to any registration or licensing requirements in such jurisdiction. Industry Surveys are not directed to, or intended for distribution to or use by, any person or entity who is not in a class qualified to receive Industry Surveys (e.g., a qualified person and/or investor), as defined by the local laws or regulations in the country or jurisdiction where the person is domiciled, a citizen or resident of, or the entity is legally registered or domiciled. S&P Capital IQ’s Industry Surveys are not intended for distribution in or directed to entities, residents or investors in: Albania, Belarus, Bosnia, Burma, Cote d’Ivoire, Croatia, Cuba, Democratic Republic of the Congo, Former Yugoslav Republic of Macedonia, Herzegovina, Iran, Iraq, Kosovo, Lebanon, Libya, Montenegro and Serbia, North Korea, Somali, Sudan, Syria, Taiwan, Yemen and Zimbabwe. For residents of Australia: Industry Surveys are issued and/or distributed in Australia by SPIS. Any express or implied opinion contained in an Industry Survey is limited to “General Advice” and based solely on consideration of the investment merits of the financial product(s) alone. The information in an Industry Survey has not been prepared for use by retail investors and has been prepared without taking account of any particular investor’s financial or investment objectives, financial situation or needs. Before acting on any advice, any investor using the advice should consider its appropriateness having regard to their own or their clients’ objectives, financial situation and needs. Investors should obtain a Product Disclosure Statement relating to the product and consider the statement before making any decision or recommendation about whether to acquire the product. Each opinion must be weighed solely as one factor in any investment decision made by or on behalf of any adviser and any such adviser must accordingly make their own assessment taking into account an individual’s particular circumstances. SPIS holds an Australian Financial Services License Number 258896. Please refer to the SPIS Financial Services Guide for more information at: www.spcapitaliq.com/FinancialServicesGuide For residents of China: Industry Surveys are not distributed in or directed to residents in The People’s Republic of China. Neither S&P Capital IQ nor its affiliates target investors in China. For residents of Kuwait: The Distributor, and not S&P Capital IQ, is responsible for complying with all relevant licensing requirements as set forth by the Kuwait Capital Markets Law (“CML”) and Kuwait Capital Markets Authority (“CMA”) and with all relevant rules and regulations set out in the CML and CMA rule books. For residents of Malaysia: All queries in relation to Industry Surveys should be referred to Ahmad Halim at [email protected]. For residents of Mexico: S&P Capital IQ is not regulated or supervised by the Mexican National Banking and Securities Commission (“CNBV”). S&P Capital IQ has a licensed rating agency affiliate in Mexico (Standard & Poor’s, S.A. De C.V.), of which S&P maintains firewalls and seeks to avoid conflicts of interest, pursuant to approved policies. For residents of Qatar: The Distributor, and not S&P Capital IQ, is responsible for complying with all relevant licensing requirements as set forth by the Qatar Financial Markets Authority or the Qatar Central Bank, and with all relevant rules and regulations set out in the Qatar Financial Markets Authority’s rule book, including third party branded investment research distribution of securities that are admitted for trading on a Qatari securities exchange (Admitted Securities). Copyright © 2014 Standard & Poor’s Financial Services LLC. All rights reserved. STANDARD & POOR’S, S&P, S&P 500, S&P EUROPE 350 and STARS are registered trademarks of Standard & Poor’s Financial Services LLC. S&P CAPITAL IQ is a trademark of Standard & Poor’s Financial Services LLC.