r&s fsv-k54 emi measurement application user manual · pdf filer&s®fsv-k54 emi...
TRANSCRIPT
R&S®FSV-K54EMI Measurement ApplicationUser Manual
User
Man
ual
1176.7555.02 ─ 03(;ÚÙÅ2)
Test
& Me
asur
emen
t

This manual covers the following products:● R&S FSV-K54 (1310.0425.02)
for the R&S FSVR Realtime Spectrum Analyzer and the R&S FSV/FSVA Signal and Spectrum Analyzer.This manual describes the following R&S FSV/FSVA models with firmware version 3.00 and higher:● R&S®FSV4 (1321.3008K04)
● R&S®FSVA4 (1321.3008K05)
● R&S®FSV7 (1321.3008K07)
● R&S®FSVA7 (1321.3008K08)
● R&S®FSV13 (1321.3008K13)
● R&S®FSVA13 (1321.3008K14)
● R&S®FSV30 (1321.3008K30)
● R&S®FSVA30 (1321.3008K31)
● R&S®FSV40 (1321.3008K39/1321.3008K40)
● R&S®FSVA40 (1321.3008K41)
It also applies to the following R&S®FSV models. However, note the differences described in Chapter 1.1,"Notes for Users of R&S FSV 1307.9002Kxx Models", on page 5.● R&S®FSV3 (1307.9002K03)
● R&S®FSV7 (1307.9002K07)
● R&S®FSV13 (1307.9002K13)
● R&S®FSV30 (1307.9002K30)
● R&S®FSV40 (1307.9002K39/1307.9002K40)
© 2015 Rohde & Schwarz GmbH & Co. KGMühldorfstr. 15, 81671 München, GermanyPhone: +49 89 41 29 - 0Fax: +49 89 41 29 12 164Email: [email protected]: www.rohde-schwarz.comSubject to change – Data without tolerance limits is not binding.R&S® is a registered trademark of Rohde & Schwarz GmbH & Co. KG.Trade names are trademarks of the owners.
The following abbreviations are used throughout this manual: R&S®FSV/FSVA is abbreviated as R&S FSV.

ContentsR&S®FSV-K54
3User Manual 1176.7555.02 ─ 03
Contents1 Preface.................................................................................................... 5
1.1 Notes for Users of R&S FSV 1307.9002Kxx Models.................................................. 5
2 Introduction............................................................................................ 6
3 Measurement Background....................................................................73.1 Selecting a Detector......................................................................................................7
3.2 Selecting the Measurement Bandwidth.................................................................... 10
3.3 Setting the Number of Sweep Points........................................................................ 11
3.4 Controlling V-Networks (LISN)...................................................................................11
3.5 Using Transducer Factors..........................................................................................12
3.6 Performing a Peak Search..........................................................................................12
3.7 Measuring at the Marker Position..............................................................................14
3.8 Evaluating the Results................................................................................................14
4 Configuring and Performing the Measurement.................................164.1 Measurement Configuration...................................................................................... 16
4.2 Peak Search.................................................................................................................18
4.3 Final Evaluation...........................................................................................................20
5 Remote Commands for EMI Measurements......................................235.1 Configuring the Measurement................................................................................... 23
5.2 Performing a Peak Search..........................................................................................27
5.3 Evaluating the Results................................................................................................30
List of Commands................................................................................35
Index......................................................................................................36

ContentsR&S®FSV-K54
4User Manual 1176.7555.02 ─ 03

PrefaceR&S®FSV-K54
5User Manual 1176.7555.02 ─ 03
1 Preface
1.1 Notes for Users of R&S FSV 1307.9002Kxx Models
Users of R&S FSV 1307.9002Kxx models should consider the following differences tothe description of the newer R&S FSV/FSVA 1321.3008Kxx models:● Functions that are based on the Windows7 operating system (e.g. printing or set-
ting up networks) may have a slightly different appearance or require different set-tings on the Windows XP based models. For such functions, refer to the Windowsdocumentation or the documentation originally provided with the R&S FSV instru-ment.
● The R&S FSV 1307.9002K03 model is restricted to a maximum frequency of3 GHz, whereas the R&S FSV/FSVA1321.3008K04 model has a maximum fre-quency of 4 GHz.
● The bandwidth extension option R&S FSV-B160 (1311.2015.xx) is not available forthe R&S FSV 1307.9002Kxx models. The maximum usable I/Q analysis bandwidthfor these models is 28 MHz, or with option R&S FSV-B70, 40 MHz.
Notes for Users of R&S FSV 1307.9002Kxx Models
IntroductionR&S®FSV-K54
6User Manual 1176.7555.02 ─ 03
2 IntroductionThe R&S FSV-K54 EMI measurement application is a firmware option that adds func-tionality to perform EMI measurements to the base unit. With its features, theR&S FSV-K54 is suitable for measurements according to commercial and military EMCstandards. The functionality of the option is particularly useful in research and develop-ment.
The firmware option is available for the R&S FSVR realtime spectrum analyzer and theR&S FSV signal and spectrum analyzer.
The R&S FSV-K54 features
● EMI measurement marker functionality● marker demodulation (with option R&S FSV-B3)● measurement bandwidths and detectors for EMI measurements● logarithmic scaling of the frequency axis● additional predefined limit lines for EMC standards● predefined transducer factors● LISN control (with option R&S FSV-B5)
The R&S FSV-K54 integrates its functionality into the measurement and marker func-tions that are available in spectrum mode. This manual describes the functionality thatis part of the R&S FSV-K54 only. All functions not discussed in this manual work asdescribed in the documentation for the R&S FSVR or the R&S FSV (e.g. frequency oramplitude settings).
The latest version is available for download at the product homepage (http://www2.rohde-schwarz.com/product/FSVR.html).
The latest version is available for download at the product homepage (http://www2.rohde-schwarz.com/product/FSV.html).

Measurement BackgroundR&S®FSV-K54
7User Manual 1176.7555.02 ─ 03
3 Measurement BackgroundEMI measurements can be very time-consuming, especially if weighting detectors arerequired for the measurement. In addition, EMC testing often requires various proce-dures to locate local EMI maxima. Such procedures are, for example, movements ofan absorbing clamp, variations in the height of the test antenna or the rotation of theDUT.
Covering all test setups with one of the (slow) EMI weighting detectors over therequired frequency range would lead to very high measurement times.
Splitting the measurement procedure into several stages, however, can eliminate thisproblem.
The first stage, or peak search, is used to get a rough idea about the location of peakpowers that may indicate interference over the required frequency range. You can usea detector that allows for a fast sweep time, e.g. the peak detector.
During the second stage, or final evaluation, the R&S FSV/FSVA performs the actualEMC test, with detectors designed for and required by EMC standards. To keep mea-surement times brief, the R&S FSV/FSVA performs a measurement only on frequen-cies you have marked with a marker or delta marker. You can assign a different detec-tor to every marker and thus test a particular frequency easily for compliance.
3.1 Selecting a Detector......................................................................................................7
3.2 Selecting the Measurement Bandwidth.................................................................... 10
3.3 Setting the Number of Sweep Points........................................................................ 11
3.4 Controlling V-Networks (LISN)...................................................................................11
3.5 Using Transducer Factors..........................................................................................12
3.6 Performing a Peak Search..........................................................................................12
3.7 Measuring at the Marker Position..............................................................................14
3.8 Evaluating the Results................................................................................................14
3.1 Selecting a Detector
The R&S FSV-K54 adds new detectors to those already available with the base unit.The additional detectors are especially designed for and required by EMI applications.
Positive and negative peak detector
The maximum and minimum peak detectors displays the maximum and minimum sig-nal level that was detected during the specified dwell time.
Regarding measurement time,
● you can use the shortest time possible when measuring unmodulated signals
Selecting a Detector

Measurement BackgroundR&S®FSV-K54
8User Manual 1176.7555.02 ─ 03
● you should set a time that is long enough to capture at least one complete pulsewhen measuring pulsed singals
The minimum and maximum peak detectors are already available with the base unit.
Average detector
The average detector displays the average signal level of the samples that were collec-ted during the specified dwell time.
Regarding measurement time,
● you can use shortest time possible when measuring unmodulated signals● you should set a time that is long enough to capture several complete pulses (at
least 10) when measuring pulsed signals● you should be aware that the time is determined by the lowest modulation fre-
quency to be averaged
The average detector is already available with the base unit.
RMS detector
The RMS detector evaluates the root mean square (RMS) value over the specifieddwell time and displays the resulting value. The integration time is the specified dwelltime.
Regarding measurement time, you can follow the guidelines of the average detector.
The RMS detector is already available with the base unit.
Sample detector
The sample detector displays the last value from the samples allocated to a pixel.
The sample detector is used for noise or phase noise marker calculation. However, it isunreliable if the displayed span is much greater then the resolution bandwidth or if thetuning steps of the local oscillator are too large.
The sample detector is available in spectrum or real-time mode.
Quasipeak detector (R&S FSV-K54 only)
The quasipeak detector displays the maximum signal level weighted to CISPR 16-1-1that was detected during the dwell time.
Regarding measurement time,
● you should select a dwell time of at least 1 second when measuring unknown sig-nals. This value makes sure that pulses down to a frequency of 5 Hz are weightedcorrectly.
● you can select a shorter time when measuring known signals as the signal leveldoes not change during the sweep.
After an internal switch, the R&S FSV/FSVA waits until the measurement result hasstabilized before it starts the actual measurement.
The quasipeak detector is available with the R&S FSV-K54.
Selecting a Detector

Measurement BackgroundR&S®FSV-K54
9User Manual 1176.7555.02 ─ 03
CISPR Average detector (R&S FSV-K54 only)
The CISPR Average detector displays a weighted average signal level according toCISPR 16-1-1.
The average value according to CISPR 16-1-1 is the maximum value of the linear aver-age value that was detected during the specified dwell time.
The CISPR Average detector is applied to measure pulsed sinusoidal signals with alow pulse frequency, for example. It is calibrated with the RMS value of an unmodula-ted sinusoidal signal. The average value is determined by lowpass filters of the 2ndorder (the simulation of a mechanical instrument).
The filter bandwidth and time constants of the detector are coupled to the receiver fre-quency.
Band A Band B Band C/D Band E
Frequency range <150 kHz 150 kHz to 30 MHz 30 MHz to 1 GHz >1 GHz
IF bandwidth 200 Hz 9 kHz 120 kHz 1 MHz
Time constant ofinstrument
160 ms 160 ms 100 ms 100 ms
Regarding measurement time,
● you should select a dwell time of at least 1 second when measuring unknown sig-nals. This time makes sure that pulses down to a frequency of 5 Hz are weightedcorrectly.
● you should select a long time for measurement on pulsed signals or signals thatfluctuate slowly.
● you can select a short time when measuring unmodulated signals or signals with ahigh modulation frequency.
When you change the receiver frequency or the attenuation, the R&S FSV/FSVA waitsuntil the the lowpass filter has settled before starting the measurement. The measure-ment time in that case depends on the resolution bandwidth and the characteristics ofthe signal.
The CISPR Average detector is available with the R&S FSV-K54.
RMS Average detector (R&S FSV-K54 only)
The RMS Average detector is a combination of the RMS detector (for pulse repetitionfrequencies above a corner frequency) and the Average detector (for pulse repetitionfrequencies below the corner frequency). It thus achieves a pulse response curve withthe following characteristics: 10 dB/decade above the corner frequency and 20 dB/decade below the corner frequency. The average value is determined by lowpass fil-ters of the 2nd order (simulation of a mechanical instrument).
The detector is used, for example, to measure broadband emissions and may replacethe quasipeak detector in the future.
Selecting a Detector

Measurement BackgroundR&S®FSV-K54
10User Manual 1176.7555.02 ─ 03
Band A Band B Band C/D Band E
Frequency range <150 kHz 150 kHz to 30 MHz 30 MHz to 1 GHz >1 GHz
IF bandwidth 200 Hz 9 kHz 120 kHz 1 MHz
Time constant ofinstrument
160 ms 160 ms 100 ms 100 ms
Corner frequency 10 Hz 100 Hz 100 Hz 1 kHz
Regarding measurement time, you can follow the guidelines of the CISPR Averagedetector.
The RMS Average detector is available with the R&S FSV-K54.
3.2 Selecting the Measurement Bandwidth
EMI testing require resolution filters with a 6 dB bandwidth. The R&S FSV/FSVA addsthe following bandwidths that comply to civil and military standards to those alreadyavailable with the base unit:
Commercial (CISPR, FFC etc.)● 200 Hz● 9 kHz● 120 kHz● 1 MHz
Military (MIL Std)● 10 Hz● 100 Hz● 1 kHz● 10 kHz● 100 kHz● 1 MHz
If you select the bandwidth with the "Res BW CISPR" or "Res BW Mil Std" softkey, theR&S FSV/FSVA automatically selects the 6 dB EMI filter.
If you select the bandwidth with the "Res BW" softkey, you have to select one of the6 dB filters (commercial or military) in the "Bandwidth" menu first to access those band-widths.
You have to select the bandwidth with the rotary knob or enter the bandwidth directlywith the alphanumeric keypad.
If you are using the Quasipeak, CISPR Average or Average RMS detector, the band-width is fixed depending on the frequency. For more information see Chapter 3.1,"Selecting a Detector", on page 7.
Selecting the Measurement Bandwidth
Measurement BackgroundR&S®FSV-K54
11User Manual 1176.7555.02 ─ 03
3.3 Setting the Number of Sweep Points
The number of sweep points defines the number of measurement values collected dur-ing one sweep. Thus, increasing the sweep points also increases the accuracy of theresults regarding the frequency resolution.
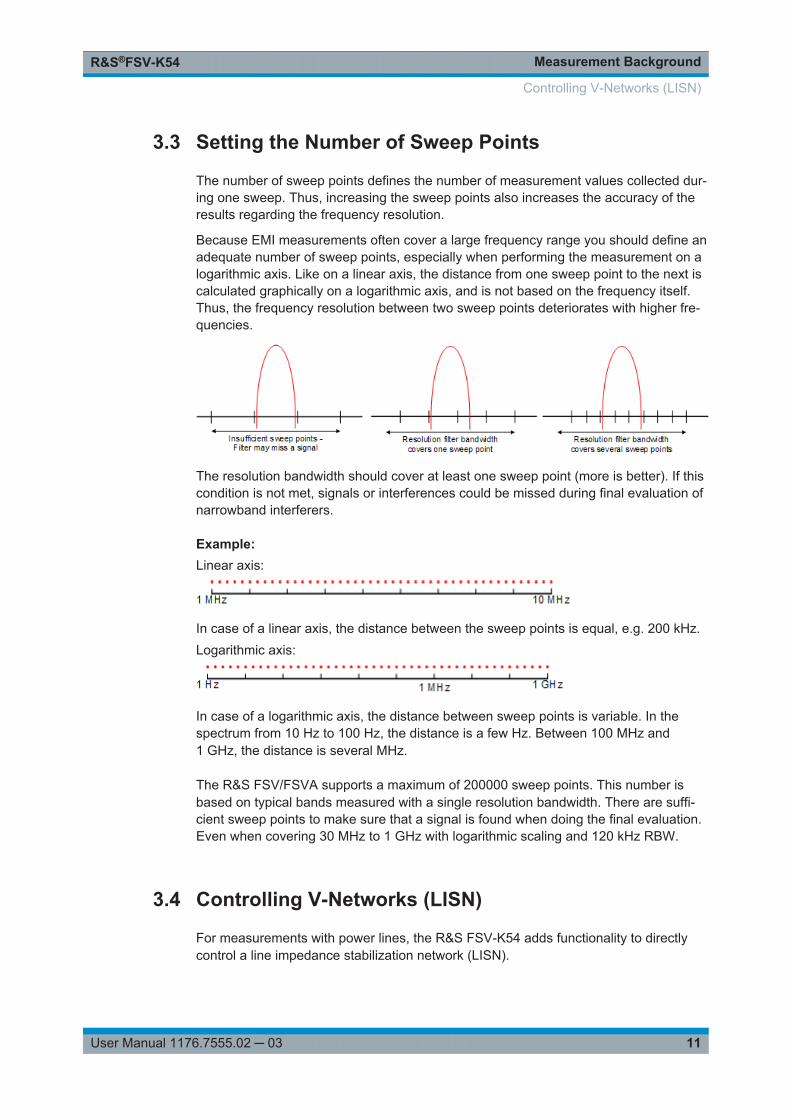
Because EMI measurements often cover a large frequency range you should define anadequate number of sweep points, especially when performing the measurement on alogarithmic axis. Like on a linear axis, the distance from one sweep point to the next iscalculated graphically on a logarithmic axis, and is not based on the frequency itself.Thus, the frequency resolution between two sweep points deteriorates with higher fre-quencies.
The resolution bandwidth should cover at least one sweep point (more is better). If thiscondition is not met, signals or interferences could be missed during final evaluation ofnarrowband interferers.
Example: Linear axis:
In case of a linear axis, the distance between the sweep points is equal, e.g. 200 kHz.Logarithmic axis:
In case of a logarithmic axis, the distance between sweep points is variable. In thespectrum from 10 Hz to 100 Hz, the distance is a few Hz. Between 100 MHz and1 GHz, the distance is several MHz.
The R&S FSV/FSVA supports a maximum of 200000 sweep points. This number isbased on typical bands measured with a single resolution bandwidth. There are suffi-cient sweep points to make sure that a signal is found when doing the final evaluation.Even when covering 30 MHz to 1 GHz with logarithmic scaling and 120 kHz RBW.
3.4 Controlling V-Networks (LISN)
For measurements with power lines, the R&S FSV-K54 adds functionality to directlycontrol a line impedance stabilization network (LISN).
Controlling V-Networks (LISN)

Measurement BackgroundR&S®FSV-K54
12User Manual 1176.7555.02 ─ 03
You can connect the LISN to the userport. The R&S FSV-K54 supports several V-net-works.
● Four-line V-networks– ESH2-Z5– ENV4200
● Two-line V-networks– ESH3-Z5– ENV216
After selecting the type of network, you can define the phase you want to test for inter-ferences. Phase N and L1 are available for two-line networks. Four-line networks inaddition have access to phase L2 and L3. The R&S FSV-K54 allows you to test onephase at a time.
For the ENV 216 network, a 150 kHz high pass filter is available for protection of theinput.
Note that LISN control is possible only with option R&S FSV-B5 (Additional Interfaces).Control cables for the various LISNs are available as accessories.
3.5 Using Transducer Factors
The R&S FSV-K54 supports the use of transducers in that it provides functionality toinclude transducer factors in the test setup. Transducers are devices like antennas,probes or current probes that are connected to the R&S FSV/FSVA to measure inter-ferences or useful signals. The transducer converts the measurand like field strength,current or RFI voltage into a voltage across 50 Ω. During the measurement, the trans-ducer is considered a part of the instrument.
A transducer usually has a frequency-dependent transducer factor that includes thefrequency response of the corresponding device. During level measurement, the trans-ducer factor automatically converts the results into the correct unit and magnitude. Atransducer factor consists of a maximum of 625 reference values. Each referencevalue includes frequency, unit and transducer factor.
The R&S FSV-K54 adds several predefined transducer factors. In addition you canalso create and edit new and existing transducer factors.
For more information see the documentation of the base unit.
3.6 Performing a Peak Search
The purpose of a peak search is to find signals with a high interference level quickly.Usually the peak search is done with a fast detector like the peak or average detector.The marker peak search is the basis for a possible final evaluation of interferences withthe detectors specific to EMI measurements.
Performing a Peak Search
Measurement BackgroundR&S®FSV-K54
13User Manual 1176.7555.02 ─ 03
You can control markers in the Marker Configuration dialog box or turn them on withthe "Marker <x>" softkey. The results of the peak search are summarized in the MarkerTable.
There are two ways to perform a peak search, automatic and manual.
Automatic peak search
By default, the automatic peak search starts as soon as you turn on the EMI measure-ment marker. During the peak search, the application looks for the strongest peaks inthe frequency range you are measuring and positions a marker on those peaks. Whena limit line is assigned to the trace, the level difference between the trace and the limitline determines the peak search. The number of peaks it will find during the searchdepends on the number of markers you have turned on. You can use up to 16 markerssimultaneously.
The first marker is always on the most powerful peak while the last marker is always onthe least powerful peak. If the application finds a more powerful peak, it will move oneof the markers to that position and adjust the order of the other markers.
The application allows you to distribute markers among several traces. If you do so,the marker with the lowest number assigned to a particular trace will be positioned onthe most powerful peak of the corresponding trace.
Manual peak search
If you turn the automatic peak search off, you can put the markers manually to any fre-quency you need more information about. You can change the marker position with therotary knob, the cursor keys or position it to a particular frequency with the numberkeys.
Setting markers is the same as setting markers in normal spectrum mode. For moreinformation see the manual of the base unit.
Searching for peaks over several traces
You can measure on six traces with a different weighting detector simultaneously.
In that case, the application searches for peaks on all traces separately, given that youhave assigned at least one marker to that trace.
A typical selection for EMI measurement is to use the peak and the average detector. Ifthe premeasurement is done, the application would look for peaks on the peak traceand the average trace separately so that the distribution of narrowband and widebandsources of interference can be taken into account.
For example, the frequency of the maximum determined with the average detector canbe used for the final measurement performed with this detector and the frequencyfound in the premeasurement carried out with the peak detector is taken for the finalmeasurement using the quasipeak detector.
Performing a Peak Search
Measurement BackgroundR&S®FSV-K54
14User Manual 1176.7555.02 ─ 03
3.7 Measuring at the Marker Position
Finding peaks with the help of a peak search reduces data to be evaluated and thusmeasurement time.
The R&S FSV-K54 performs the final evaluation automatically if the EMI measurementmarker is turned on. The measurement at the marker frequency starts immediatelyafter the marker has been set. The advantage of an immediate final evaluation is that iteliminates the risk of measurement errors based on frequency drifts of the disturbancesignal.
The measurement at the marker frequency may have a different detector during thepeak search. This way, the measurement consumes much less time because detectorswith a long measurement time are needed only at the critical frequency.
The application also allows you to use multiple detectors for the final evaluation. Theadvantage of multiple detection is that you will only need one test run to see if theresults comply with the limits specified in a standard. You can select and assign detec-tors for EMI markers in the "Marker Configuration" on page 18 dialog box.
As EMC tests often require special measurement times, you can also specify a dwelltime for the measurement with the EMI markers.
The application shows the results in the Marker Table.
Defining a Dwell Time for the Final Measurement
The dwell time defines for how long the R&S FSV/FSVA measures the signal at thefrequencies of the marker positions. Thus the dwell time defines the amount of datathat is included in the detection of the displayed results. As each detector needs a dif-ferent period of time to fully charge and discharge, the minimum dwell time should notbe shorter than the slowest detector in use.
3.8 Evaluating the Results
The R&S FSV-K54 provides functionality to evaluate the results.
Marker Demodulation
The R&S FSV/FSVA is able to demodulate AM and FM signals for acoustic tests andmonitoring purposes. When the demodulator is active, the R&S FSV-K54 demodulatesthe signal for all EMI marker positions. The demodulation begins when the marker isturned on. You can listen to the results during the measurement with headphones orwith the internal speaker.
In case of frequency domain measurements, the duration of the demodulation at eachmarker position is limited by the dwell time of the EMI measurement marker. Measure-ments in the time domain result in continuous demodulation of the signal on the centerfrequency.
Note that marker demodulation is only available with option R&S FSV-B3 (AM/FMAudio Demodulator).
Evaluating the Results

Measurement BackgroundR&S®FSV-K54
15User Manual 1176.7555.02 ─ 03
Limit Lines
General limit line functionality is already available for the base unit. The base unit alsoprovides various predefined limit lines that you can use for various applications.
For easier evaluation of EMI measurement results, the R&S FSV-K54 adds additionalpredefined limit lines to those already present. The limit lines specific for EMI measure-ment have been designed in compliance with several EMC standards.
When you are using limit lines in combination with EMI measurements, note that thelimit check does not respond to the marker level and position. That means that youwon't necessarily see if a peak violates a limit. Instead it only responds if the trace itselfviolates the limit line.
For more information on using limit lines see the documentation of the base unit.
Evaluating the Results

Configuring and Performing the MeasurementR&S®FSV-K54
16User Manual 1176.7555.02 ─ 03
4 Configuring and Performing the Measure-mentThis chapter contains a description of all functions available with the EMI measurementapplication.
4.1 Measurement Configuration...................................................................................... 16
4.2 Peak Search.................................................................................................................18
4.3 Final Evaluation...........................................................................................................20
4.1 Measurement Configuration
The reference section contains an overview of all functions that are part of the chapterand lists the associated elements of the user interface.
Filter TypeOpens a submenu to select the filter type.
The submenu contains the following softkeys:● Normal (3 dB)● CISPR (6 dB)● MIL Std (6 dB)
For more information see Chapter 3.2, "Selecting the Measurement Bandwidth",on page 10.
● Channel● RRC● 5-Pole (not available for sweep type "FFT")
Remote command: [SENSe:]BANDwidth|BWIDth[:RESolution]:TYPE on page 25
Res BW CISPR / CISPR (6 dB)Selects the measurement bandwidth for commercial EMC standards according toCISPR.
If you select the bandwidth with the "Res BW CISPR" softkey, the R&S FSV/FSVAautomatically changes the filter type to a 6 dB bandwidth.
For more information see Chapter 3.2, "Selecting the Measurement Bandwidth",on page 10.
Remote command: Filter type:[SENSe:]BANDwidth|BWIDth[:RESolution]:TYPE on page 25Filter bandwidth:[SENSe:]BANDwidth|BWIDth[:RESolution] on page 25
Measurement Configuration

Configuring and Performing the MeasurementR&S®FSV-K54
17User Manual 1176.7555.02 ─ 03
Res BW Mil Std / MIL Std (6 dB)Selects the measurement bandwidths for military EMC standards.
If you select the bandwidth with the "Res BW Mil Std" softkey, the R&S FSV/FSVAautomatically changes the filter type to a 6 dB bandwidth.
For more information see Chapter 3.2, "Selecting the Measurement Bandwidth",on page 10.
Remote command: Filter type:[SENSe:]BANDwidth|BWIDth[:RESolution]:TYPE on page 25Filter bandwidth:[SENSe:]BANDwidth|BWIDth[:RESolution] on page 25
Sweep PointsOpens an edit dialog box to enter the number of measured values collected during asingle measurement.
For more information see Chapter 3.3, "Setting the Number of Sweep Points",on page 11.
Remote command: [SENSe:]SWEep:POINts on page 27
Freq (Lin Log)Turns logarithmic scaling of the frequency axis on and off.
By default, the frequency axis has linear scaling. Logarithmic scaling of the frequencyaxis, however, is common for EMI measurements over large frequency ranges as itenhances the resolution of the lower frequencies. On the other hand, high frequenciesget more crowded and become harder to distinguish.
Because it shows the lower frequencies more clearly, logarithmic scaling is used fortests that focus on those frequencies, for example acoustic tests and measurements.
Remote command: DISPlay[:WINDow<n>]:TRACe<t>:X:SPACing on page 23
LISN ControlOpens a dialog box to control a LISN.
Measurement Configuration

Configuring and Performing the MeasurementR&S®FSV-K54
18User Manual 1176.7555.02 ─ 03
The dialog box contains the following elements.● LISN
Selects the V-network that you have in use. The R&S FSV-K54 supports the fol-lowing networks:– R&S ESH3-Z5 and R&S ENV216 (two-line networks)– R&S ESH-Z5, R&S ENV432 and R&S ENV4200 (four-line networks)
● PhaseSelects the phase to be measured. Phase N and L1 are included in all four LISN.Phase L2 and L3 are only included in four-line networks.You can select one phase for a measurement only.
● 150 kHz HPTurns on a 150 kHz highpass filter. The filter is available for the ENV 216 networkonly.
For more information see Chapter 3.4, "Controlling V-Networks (LISN)", on page 11.
Remote command: LISN type:INPut:LISN:TYPE on page 24Phase:INPut:LISN:FILTer:HPASs[:STATe] on page 24Highpass filter:INPut:LISN:TYPE on page 24
4.2 Peak Search
The reference section contains an overview of all functions that are part of the chapterand lists the associated elements of the user interface.
Auto Peak SearchTurns the automatic marker peak search on and off.
For more information see Chapter 3.6, "Performing a Peak Search", on page 12.
Remote command: CALCulate<n>:MARKer<m>:FUNCtion:FMEasurement:PSEarch:AUTOon page 29
Marker ConfigurationTo make the process of configuring markers as easy as possible, the R&S FSV-K54features a "Marker Configuration" dialog box that contains all marker characteristicsnecessary to perform successful EMI measurements.
The dialog box is made up out of two tabs. The first tab controls markers 1 to 8, thesecond tab controls markers 9 to 16.
Peak Search

Configuring and Performing the MeasurementR&S®FSV-K54
19User Manual 1176.7555.02 ─ 03
● SelectedSelects one of the markers. The currently selected marker is highlighted in orangecolor. The label indicates the marker type and its number.
● StateTurns the marker on and off.
● TypeSelects the marker type.The first marker always is a normal marker (abbreviated 'N'). Normal markersdetermine absolute signal levels. In the diagram area, they are drawn as a trianglepointing up ( ).If you add more markers, these will be delta markers by default (abbreviated 'D').Delta markers show signal levels in relation to another (normal) marker, by defaultin relation to the first marker. If necessary, you can still change the referencemarker in the "Ref" column. In the diagram area, delta markers are drawn as a tri-angle pointing down ( ).When performing EMI measurements however, you usually want to have absolutemarker readouts for all markers that you are using.
● RefSelects the reference marker for delta markers.By default, the reference marker for all delta markers is the first marker.This is active only for delta markers.
● TraceSelects the trace number the marker is positioned on.You can place markers on any of the active traces. The R&S FSV-K54 supportsthe use of up to four traces.
Peak Search
Configuring and Performing the MeasurementR&S®FSV-K54
20User Manual 1176.7555.02 ─ 03
● DetectorSelects the detector for the final measurement.For more information see Chapter 3.1, "Selecting a Detector", on page 7.
● Auto PeakTurns automatic peak search for all markers on and off.For more information see Chapter 3.6, "Performing a Peak Search", on page 12.
● Dwell TimeSets the dwell time for all markers.For more information see Chapter 3.7, "Measuring at the Marker Position",on page 14.
● All Markers OffTurns all markers off.
Remote command: Reference marker:CALCulate<n>:DELTamarker<m>:MREFTrace:CALCulate<n>:DELTamarker<m>:TRACe on page 27CALCulate<n>:MARKer<m>:TRACe on page 30Detector:CALCulate<n>:MARKer<m>:FUNCtion:FMEasurement:DETector on page 28CALCulate<n>:DELTamarker<m>:FUNCtion:FMEasurement:DETectoron page 29Auto peak:CALCulate<n>:MARKer<m>:FUNCtion:FMEasurement:PSEarch:AUTOon page 29Dwell time:CALCulate<n>:MARKer<m>:FUNCtion:FMEasurement:DWELl on page 33All marker off:CALCulate<n>:MARKer<m>:AOFF on page 28CALCulate<n>:DELTamarker<m>:AOFF on page 27See also the documentation of the base unit for information on how to remotely workwith markers in general.
4.3 Final Evaluation
The reference section contains an overview of all functions that are part of the chapterand lists the associated elements of the user interface.
Dwell TimeSets the dwell time for the EMI marker measurement.
For more information see Chapter 3.7, "Measuring at the Marker Position", on page 14.
Final Evaluation
Configuring and Performing the MeasurementR&S®FSV-K54
21User Manual 1176.7555.02 ─ 03
Remote command: CALCulate<n>:MARKer<m>:FUNCtion:FMEasurement:DWELl on page 33
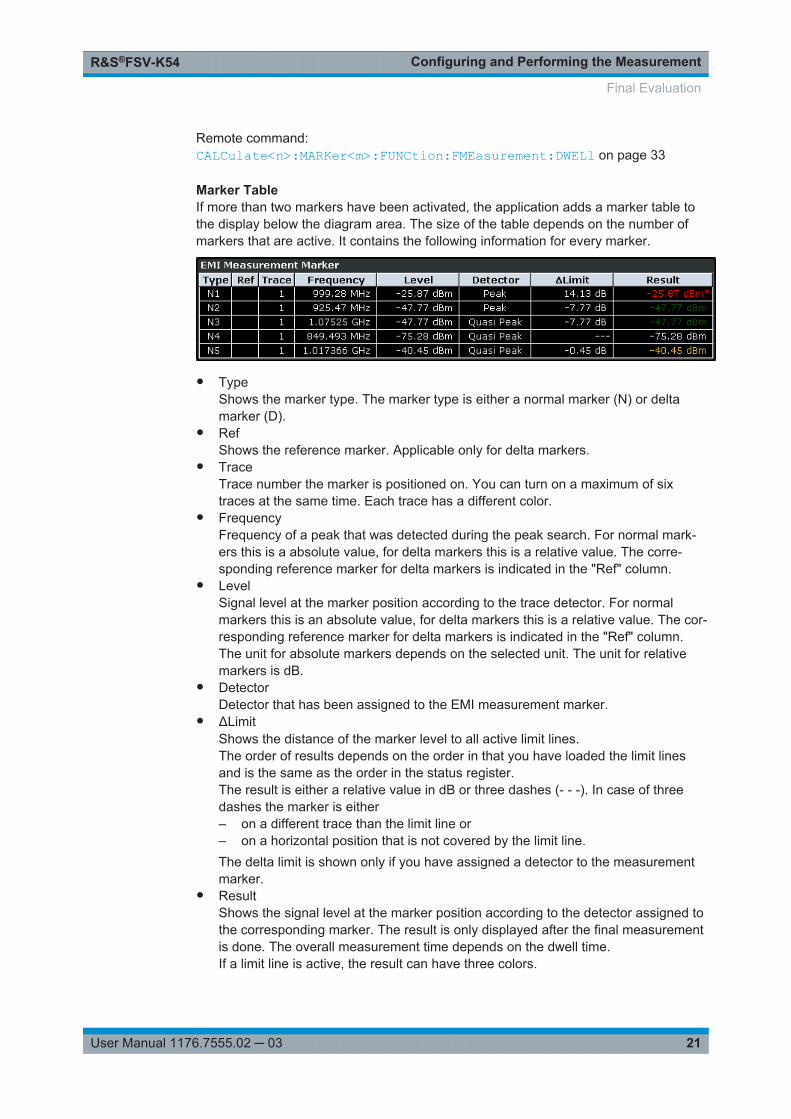
Marker TableIf more than two markers have been activated, the application adds a marker table tothe display below the diagram area. The size of the table depends on the number ofmarkers that are active. It contains the following information for every marker.
● TypeShows the marker type. The marker type is either a normal marker (N) or deltamarker (D).
● RefShows the reference marker. Applicable only for delta markers.
● TraceTrace number the marker is positioned on. You can turn on a maximum of sixtraces at the same time. Each trace has a different color.
● FrequencyFrequency of a peak that was detected during the peak search. For normal mark-ers this is a absolute value, for delta markers this is a relative value. The corre-sponding reference marker for delta markers is indicated in the "Ref" column.
● LevelSignal level at the marker position according to the trace detector. For normalmarkers this is an absolute value, for delta markers this is a relative value. The cor-responding reference marker for delta markers is indicated in the "Ref" column.The unit for absolute markers depends on the selected unit. The unit for relativemarkers is dB.
● DetectorDetector that has been assigned to the EMI measurement marker.
● ΔLimitShows the distance of the marker level to all active limit lines.The order of results depends on the order in that you have loaded the limit linesand is the same as the order in the status register.The result is either a relative value in dB or three dashes (- - -). In case of threedashes the marker is either– on a different trace than the limit line or– on a horizontal position that is not covered by the limit line.The delta limit is shown only if you have assigned a detector to the measurementmarker.
● ResultShows the signal level at the marker position according to the detector assigned tothe corresponding marker. The result is only displayed after the final measurementis done. The overall measurement time depends on the dwell time.If a limit line is active, the result can have three colors.
Final Evaluation
Configuring and Performing the MeasurementR&S®FSV-K54
22User Manual 1176.7555.02 ─ 03
– green indicates that the marker has passed the limit check.– yellow indicates that the marker is in the margins of the limit line.– red and a star (*) indicate that the marker has failed the limit check.For more information on limit lines see the documentation of the base unit.
The result is shown only if you have assigned a detector to the measurement marker.
Remote command: Detector:ΔLimit:CALCulate<n>:MARKer<m>:FUNCtion:FMEasurement:LIMit<k>:DELTa?on page 31CALCulate<n>:MARKer<m>:FUNCtion:FMEasurement:LIMit<k>:CONDition ? on page 31CALCulate<n>:DELTamarker<m>:FUNCtion:FMEasurement:LIMit<k>:DELTa? on page 33CALCulate<n>:DELTamarker<m>:FUNCtion:FMEasurement:LIMit<k>:CONDition ? on page 32Result:CALCulate<n>:MARKer<m>:FUNCtion:FMEasurement:RESult? on page 32CALCulate<n>:DELTamarker<m>:FUNCtion:FMEasurement:RESult?on page 33
Final Evaluation
Remote Commands for EMI MeasurementsR&S®FSV-K54
23User Manual 1176.7555.02 ─ 03
5 Remote Commands for EMI MeasurementsThis chapter features all remote commands specific to the R&S FSV-K54. It also fea-tures remote commands that are available with the base unit, but whose functionality isexpanded or modified. For remote commands controlling base unit functionality refer tothe documentation of the base unit.
5.1 Configuring the Measurement
CALCulate<n>:MARKer<m>:FUNCtion:FMEasurement:STATe............................................ 23DISPlay[:WINDow<n>]:TRACe<t>:X:SPACing.................................................................... 23INPut:LISN:PHASe...........................................................................................................24INPut:LISN:FILTer:HPASs[:STATe] ...................................................................................24INPut:LISN:TYPE.............................................................................................................24[SENSe:]BANDwidth|BWIDth[:RESolution]......................................................................... 25[SENSe:]BANDwidth|BWIDth[:RESolution]:TYPE................................................................ 25[SENSe:][WINDow:]DETector<trace>[:FUNCtion]................................................................26[SENSe:][WINDow:]DETector<trace>[:FUNCtion]:AUTO......................................................26[SENSe:]SWEep:POINts...................................................................................................27
CALCulate<n>:MARKer<m>:FUNCtion:FMEasurement:STATe <State>
This command turns the EMI measurement marker functionality on and off.
Suffix: <n>
.irrelevant
<m> irrelevant
Parameters:<State> ON | OFF
DISPlay[:WINDow<n>]:TRACe<t>:X:SPACing <ScalingType>
This command toggles between linear and logarithmic display of the x-axis.
Suffix: <n>
.window; For applications that do not have more than 1 measure-ment window, the suffix <n> is irrelevant.
<t> irrelevant
Parameters:<ScalingType> LOGarithmic | LINear
LOGarithmicSelects logarithmic scaling.LINearSelects linear scaling.*RST: LINear
Configuring the Measurement
Remote Commands for EMI MeasurementsR&S®FSV-K54
24User Manual 1176.7555.02 ─ 03
Example: DISP:TRAC:X:SPAC LOGMode: A, ADEMOD
Manual operation: See "Freq (Lin Log)" on page 17
INPut:LISN:PHASe <Phase>
This command selects the phase of the LISN you want to measure.
Parameters:<Phase> L1
L2L3N*RST: L1
Example: INP:LISN:PHAS NSelects the N phase.
Mode: R
INPut:LISN:FILTer:HPASs[:STATe] <State>
This command turns the 150 kHz highpass filter for the ENV216 network on and off.
Parameters:<State> ON | OFF
value 1 description*RST: OFF
Example: INP:LISN:HPAS ONTurns the filter on.
Mode: R
Manual operation: See "LISN Control" on page 17
INPut:LISN:TYPE <LISNType>
This command selects the type of network.
Configuring the Measurement
Remote Commands for EMI MeasurementsR&S®FSV-K54
25User Manual 1176.7555.02 ─ 03
Parameters:<LISNType> TWOPhase
2-Phase networksFOURphase4-Phase networksESH3z5ESH2z5ENV4200ENV216*RST: ---
Example: INP:LISN:TYPE ESH3z5Selects the ESH3z5 network.
Mode: R
Manual operation: See "LISN Control" on page 17
[SENSe:]BANDwidth|BWIDth[:RESolution] <Bandwidth>
This command defines the resolution bandwidth.
In realtime mode, the resolution bandwidth is always coupled to the span. In all othermodes, a change of the resolution bandwidth automatically turns the coupling to thespan off.
Note that EMI measurements (R&S FSV-K54) provide additional 6 dB bandwidths.
Parameters:<Bandwidth> refer to data sheet
*RST: (AUTO is set to ON)
Example: BAND 1 MHzSets the resolution bandwidth to 1 MHz
Manual operation: See "Res BW CISPR / CISPR (6 dB)" on page 16See "Res BW Mil Std / MIL Std (6 dB)" on page 17
[SENSe:]BANDwidth|BWIDth[:RESolution]:TYPE <FilterType>
This command selects the type of resolution filter.
When changing the filter type, the next larger filter bandwidth is selected if the samefilter bandwidth is not available for the new filter type.
5 Pole filters are not available when using the sweep type "FFT".
Configuring the Measurement
Remote Commands for EMI MeasurementsR&S®FSV-K54
26User Manual 1176.7555.02 ─ 03
Parameters:<FilterType> NORMal
Gaussian filtersCFILterchannel filtersRRCRRC filtersP55 Pole filtersCISPr (PULSe)6 dB CISPR filter (commercial EMI standards)6 dB filters are available with firmware option R&S FSV-K54(EMI measurements).Note: when the filter type is queried, the CISPR filter returns'PULS'.MIL6 dB MIL Std filter (military EMI standard)6 dB filters are available with firmware option R&S FSV-K54(EMI measurements).*RST: NORMal
Example: BAND:TYPE NORMManual operation: See "Filter Type" on page 16
See "Res BW CISPR / CISPR (6 dB)" on page 16See "Res BW Mil Std / MIL Std (6 dB)" on page 17
[SENSe:][WINDow:]DETector<trace>[:FUNCtion] <Function>
This command selects the detector for the data acquisition in the selected trace.
Suffix: <trace>
.1...6Selects the trace.
<trace> 1...6trace
Parameters:<Function> APEak | NEGative | POSitive | SAMPle | RMS | AVERage |
QPEak | CAVerage | CRMS*RST: APEak
Example: DET POSSets the detector to "positive peak".
[SENSe:][WINDow:]DETector<trace>[:FUNCtion]:AUTO <State>
This command either couples the detector to the current trace setting or turns couplingoff.
Configuring the Measurement
Remote Commands for EMI MeasurementsR&S®FSV-K54
27User Manual 1176.7555.02 ─ 03
Suffix: <trace>
.1...6trace
Parameters:<State> ON | OFF
*RST: ON
Example: DET:AUTO OFF
[SENSe:]SWEep:POINts <NumberPoints>
This command defines the number of measurement points to be collected during onesweep.
Parameters:<NumberPoints> Range: 101 to 200000
*RST: 691
Example: SWE:POIN 251Manual operation: See "Sweep Points" on page 17
5.2 Performing a Peak Search
CALCulate<n>:DELTamarker<m>:AOFF............................................................................27CALCulate<n>:DELTamarker<m>:TRACe..........................................................................27CALCulate<n>:MARKer<m>:AOFF....................................................................................28CALCulate<n>:MARKer<m>:FUNCtion:FMEasurement:DETector.........................................28CALCulate<n>:DELTamarker<m>:FUNCtion:FMEasurement:DETector.................................29CALCulate<n>:MARKer<m>:FUNCtion:FMEasurement:PSEarch:AUTO................................29CALCulate<n>:MARKer<m>:TRACe..................................................................................30
CALCulate<n>:DELTamarker<m>:AOFF
This command turns all active delta markers off.
Suffix: <n>
.Selects the measurement window.
<m> Selects the marker.
Example: CALC:DELT:AOFFSwitches off all delta markers.
Manual operation: See "Marker Configuration" on page 18
CALCulate<n>:DELTamarker<m>:TRACe <TraceNumber>
This command selects the trace a delta marker is positioned on.
The corresponding trace must have a trace mode other than "Blank".
Performing a Peak Search

Remote Commands for EMI MeasurementsR&S®FSV-K54
28User Manual 1176.7555.02 ─ 03
In the persistence spectrum result display, the command also defines if the deltamarker is positioned on the persistence trace or the maxhold trace.
Suffix: <n>
.Selects the measurement window.
<m> Selects the marker.
Parameters:<TraceNumber> 1 ... 6
Trace number the marker is positioned on.MAXHoldDefines the maxhold trace as the trace to put the delta markeron.This parameter is available only for the persistence spectrumresult display.WRITeDefines the persistence trace as the trace to put the deltamarker on.This parameter is available only for the persistence spectrumresult display.
Example: CALC:DELT3:TRAC 2Assigns delta marker 3 to trace 2.
Manual operation: See "Marker Configuration" on page 18
CALCulate<n>:MARKer<m>:AOFF
This command all markers off, including delta markers and marker measurement func-tions.
Suffix: <n>
.Selects the measurement window.
<m> depends on modeirrelevant
Example: CALC:MARK:AOFFSwitches off all markers.
Usage: Event
Manual operation: See "Marker Configuration" on page 18
CALCulate<n>:MARKer<m>:FUNCtion:FMEasurement:DETector <Detector>
This command selects the detector for a specific marker during the final measurement.
If the marker hasn't been active yet, the command also turns the marker on.
Suffix: <n>
.irrelevant
<m> marker
Performing a Peak Search

Remote Commands for EMI MeasurementsR&S®FSV-K54
29User Manual 1176.7555.02 ─ 03
Parameters:<Detector> OFF
turns the marker offAVERaverage detectorCAVCISPR Average detectorCRMSRMS Average detectorPOSmaximum peak detectorQPEquasipeak detector*RST: OFF
Manual operation: See "Marker Configuration" on page 18
CALCulate<n>:DELTamarker<m>:FUNCtion:FMEasurement:DETector <Detector>
This command selects the detector for a specific deltamarker during the final evalua-tion.
If the deltamarker hasn't been active yet, the command also turns the deltamarker on.
Suffix: <n>
.irrelevant
<m> deltamarker
Parameters:<Detector> OFF
turns the deltamarker offAVERaverage detectorCAVCISPR Average detectorCRMSRMS Average detectorPOSmaximum peak detectorQPEquasipeak detector*RST: OFF
Manual operation: See "Marker Configuration" on page 18
CALCulate<n>:MARKer<m>:FUNCtion:FMEasurement:PSEarch:AUTO
This command initiates a marker peak search.
Performing a Peak Search
Remote Commands for EMI MeasurementsR&S®FSV-K54
30User Manual 1176.7555.02 ─ 03
Instead of the syntax element PSEarch you can also use PEAKsearch.
Suffix: <n>
.irrelevant
<m> irrelevant
Usage: Event
Manual operation: See "Auto Peak Search" on page 18See "Marker Configuration" on page 18
CALCulate<n>:MARKer<m>:TRACe <Trace>
This command selects the trace a marker is positioned on.
The corresponding trace must have a trace mode other than "Blank".
If necessary, the corresponding marker is switched on prior to the assignment.
In the persistence spectrum result display, the command also defines if the marker ispositioned on the persistence trace or the maxhold trace.
Suffix: <n>
.Selects the measurement window.
<m> depends on modeSelects the marker.
Parameters:<Trace> 1 ... 4
Trace number the marker is positioned on.MAXHoldDefines the maxhold trace as the trace to put the delta markeron.This parameter is available only for the persistence spectrumresult display.WRITeDefines the persistence trace as the trace to put the deltamarker on.This parameter is available only for the persistence spectrumresult display.
Example: CALC:MARK3:TRAC 2Assigns marker 3 to trace 2.
Manual operation: See "Marker Configuration" on page 18
5.3 Evaluating the Results
CALCulate<n>:MARKer<m>:FUNCtion:FMEasurement:LIMit<k>:CONDition ?.......................31CALCulate<n>:MARKer<m>:FUNCtion:FMEasurement:LIMit<k>:DELTa?............................. 31CALCulate<n>:MARKer<m>:FUNCtion:FMEasurement:RESult?.......................................... 32
Evaluating the Results
Remote Commands for EMI MeasurementsR&S®FSV-K54
31User Manual 1176.7555.02 ─ 03
CALCulate<n>:DELTamarker<m>:FUNCtion:FMEasurement:LIMit<k>:CONDition ?...............32CALCulate<n>:DELTamarker<m>:FUNCtion:FMEasurement:LIMit<k>:DELTa?..................... 33CALCulate<n>:MARKer<m>:FUNCtion:FMEasurement:DWELl............................................ 33CALCulate<n>:DELTamarker<m>:FUNCtion:FMEasurement:RESult?...................................33
CALCulate<n>:MARKer<m>:FUNCtion:FMEasurement:LIMit<k>:CONDition ?<Condition>
This command queries the condition of a marker position in relation to a certain limitline.
Suffix: <n>
.irrelevant
<m> 1...16marker
<k> 1...8limit line
Return values: <Condition> 0
The marker has passed the limit check.1The marker is inside the margins of a limit line.2The marker has failed the limit check.
Example: CALC:MARK1:FUNC:FME:LIM2:COND?Queries the condition of marker 1 in relation to limit line 2.
Usage: Query only
Manual operation: See "Marker Table" on page 21
CALCulate<n>:MARKer<m>:FUNCtion:FMEasurement:LIMit<k>:DELTa?<Amplitude>
This command queries the vertical distance from the marker position to the limit line.The unit is dB.
If the marker has been assigned to a different trace than the limit line, the commandreturns -200.
Suffix: <n>
.irrelevant
<m> 1...16marker
<k> 1...8limit line
Return values: <Amplitude> Vertical distance to the limit line in dB.
Evaluating the Results
Remote Commands for EMI MeasurementsR&S®FSV-K54
32User Manual 1176.7555.02 ─ 03
Example: CALC:MARK3:FUNC:FME:LIM2:DELT?Queries the distance of marker 3 to the second limit line.
Usage: Query only
Manual operation: See "Marker Table" on page 21
CALCulate<n>:MARKer<m>:FUNCtion:FMEasurement:RESult? <Result>
This command queries the result of the EMI measurement at the marker position.
Suffix: <n>
.irrelevant
<m> 1...16marker
Return values: <Result> Power level. The unit depends on the one you have currently
set.
Example: CALC:MARK1:FUNC:FME:RES?Queries the result of marker 1.
Usage: Query only
Manual operation: See "Marker Table" on page 21
CALCulate<n>:DELTamarker<m>:FUNCtion:FMEasurement:LIMit<k>:CONDition ? <Condition>
This command queries the condition of a deltamarker position in relation to a certainlimit line.
Suffix: <n>
.irrelevant
<m> 1...16deltamarker
<k> 1...8limit line
Return values: <Condition> 0
The deltamarker has passed the limit check.1The deltamarker is inside the margins of a limit line.2The deltamarker has failed the limit check.
Example: CALC:DELT2:FUNC:FME:LIM2:COND?Queries the condition of deltamarker 2 in relation to limit line 2.
Usage: Query only
Evaluating the Results

Remote Commands for EMI MeasurementsR&S®FSV-K54
33User Manual 1176.7555.02 ─ 03
Manual operation: See "Marker Table" on page 21
CALCulate<n>:DELTamarker<m>:FUNCtion:FMEasurement:LIMit<k>:DELTa?
This command queries the vertical distance from the deltamarker position to the limitline. The unit is dB.
If the deltamarker has been assigned to a different trace than the limit line, the com-mand returns -200.
Suffix: <n>
.irrelevant
<m> 1...16deltamarker
<k> 1...8limit line
Return values: <Amplitude> Vertical distance to the limit line in dB.
Example: CALC:DELT3:FUNC:FME:LIM2:DELT?Queries the distance of deltamarker 3 to the second limit line.
Usage: Query only
Manual operation: See "Marker Table" on page 21
CALCulate<n>:MARKer<m>:FUNCtion:FMEasurement:DWELl <Time>
This command defines the dwell time during the final measurement.
Suffix: <n>
.irrelevant
<m> irrelevant
Parameters:<Time> Range: min value to max value
*RST: 1 sDefault unit: seconds
Manual operation: See "Marker Configuration" on page 18See "Dwell Time" on page 20
CALCulate<n>:DELTamarker<m>:FUNCtion:FMEasurement:RESult? <Result>
This command queries the result of the EMI measurement at the deltamarker position.
Suffix: <n>
.irrelevant
<m> 1...16marker
Evaluating the Results

Remote Commands for EMI MeasurementsR&S®FSV-K54
34User Manual 1176.7555.02 ─ 03
Return values: <Result> Power level in dB related to the reference marker you have set
for that delta marker.
Example: CALC:DELT3:FUNC:FME:RES?Queries the result of delta marker 3.
Usage: Query only
Manual operation: See "Marker Table" on page 21
Evaluating the Results

List of CommandsR&S®FSV-K54
35User Manual 1176.7555.02 ─ 03
List of Commands[SENSe:][WINDow:]DETector<trace>[:FUNCtion]...........................................................................................26[SENSe:][WINDow:]DETector<trace>[:FUNCtion]:AUTO................................................................................26[SENSe:]BANDwidth|BWIDth[:RESolution]..................................................................................................... 25[SENSe:]BANDwidth|BWIDth[:RESolution]:TYPE...........................................................................................25[SENSe:]SWEep:POINts................................................................................................................................. 27CALCulate<n>:DELTamarker<m>:AOFF........................................................................................................ 27CALCulate<n>:DELTamarker<m>:FUNCtion:FMEasurement:DETector........................................................ 29CALCulate<n>:DELTamarker<m>:FUNCtion:FMEasurement:LIMit<k>:CONDition ?.................................... 32CALCulate<n>:DELTamarker<m>:FUNCtion:FMEasurement:LIMit<k>:DELTa?........................................... 33CALCulate<n>:DELTamarker<m>:FUNCtion:FMEasurement:RESult?.......................................................... 33CALCulate<n>:DELTamarker<m>:TRACe......................................................................................................27CALCulate<n>:MARKer<m>:AOFF.................................................................................................................28CALCulate<n>:MARKer<m>:FUNCtion:FMEasurement:DETector.................................................................28CALCulate<n>:MARKer<m>:FUNCtion:FMEasurement:DWELl.....................................................................33CALCulate<n>:MARKer<m>:FUNCtion:FMEasurement:LIMit<k>:CONDition ?............................................. 31CALCulate<n>:MARKer<m>:FUNCtion:FMEasurement:LIMit<k>:DELTa?.................................................... 31CALCulate<n>:MARKer<m>:FUNCtion:FMEasurement:PSEarch:AUTO.......................................................29CALCulate<n>:MARKer<m>:FUNCtion:FMEasurement:RESult?...................................................................32CALCulate<n>:MARKer<m>:FUNCtion:FMEasurement:STATe.....................................................................23CALCulate<n>:MARKer<m>:TRACe...............................................................................................................30DISPlay[:WINDow<n>]:TRACe<t>:X:SPACing................................................................................................23INPut:LISN:FILTer:HPASs[:STATe] ................................................................................................................24INPut:LISN:PHASe.......................................................................................................................................... 24INPut:LISN:TYPE.............................................................................................................................................24

IndexR&S®FSV-K54
36User Manual 1176.7555.02 ─ 03
Index
A
Auto peak search ........................................................ 12, 18
C
CISPR Average ................................................................... 7CISPR bandwidth ........................................................ 10, 16
D
Detector ...............................................................................7Dwell time ....................................................................14, 20
E
EMI detector ........................................................................ 7EMI marker ........................................................................18EMI marker evaluation ................................................ 14, 21
F
Filter type (EMI) ...........................................................10, 16Final evaluation ........................................................... 14, 21Frequency axis scaling ......................................................17
L
Limit lines .......................................................................... 14Linear scaling .................................................................... 17LISN ............................................................................ 11, 17Logarithmic scaling ........................................................... 17
M
Manual peak search .......................................................... 12Marker demodulation ........................................................ 14Marker table ...................................................................... 21Marker wizard ....................................................................18Measurement time ............................................................ 20MIL Std bandwidth ...................................................... 10, 17
P
Peak search ................................................................ 12, 18Phase .......................................................................... 11, 17
R
Resolution bandwidth (EMI) ........................................ 10, 16RMS Average ...................................................................... 7
S
softkeyDetector Auto Select (remote control) ........................ 26Detector Manual Select (remote control) .................... 26Filter Type ................................................................... 16Filter Type (remote control) ........................................ 25Freq Axis (Lin/Log) (remote control) ........................... 23Marker to Trace (remote control) ................................ 27Range Lin. Unit (remote control) .................................23Range Linear % (remote control) ................................23Res BW (remote control) ............................................ 25
Res BW Manual (remote control) ............................... 25Sweep Points (remote control) ................................... 27
SoftkeyMarker to Trace (remote control) ................................ 30
Sweep points .....................................................................11
T
Transducer factor .............................................................. 12
V
V network .................................................................... 11, 17