rrcasd feeding and nutrition webinar 1 14 15 - w.cm edits ......copyright 2015, university of...
TRANSCRIPT

Copyright 2015, University of Rochester 1
1
Feeding Disorders: Behavioral and Nutritional Assessment, Treatment, and
Research
Kimberly A Brown, PhDLicensed Pediatric Psychologist
Brianne L Schmidt, RDPediatric Registered Dietitian
Neurodevelopmental and Behavioral PediatricsGolisano Children’s Hospital at Strong
2
*House Keeping• To reduce background noise during the webinar, please put
yourself on ‘mute’ through your phone or computer.
• Due to the size of our group, we will not be answering questions during the webinar. Instead, please type in your questions into the ‘chat’ box on your screen. We will review/answer all questions at the end.
• If you experience any technical problems at any point during the webinar, the problem is likely to be on your end, so you will need to follow‐up with your technology support person.
• The Webinar will end promptly at 5:00. If you would like to speak with us after the webinar, please e‐mail the [email protected] to set up a time to speak by phone.
2
Copyright 2015, University of Rochester 2
3
Learning Objectives ‐ Nutrition
• Discuss the nutritional needs of children and adolescents with autism spectrum disorder (ASD)
• Outline the nutrients of concern in the diets of children and adolescents
• Discuss recommendations for improving nutritional status
• Review common dietary supplements and concerns with the use of supplements
4
Learning Objectives – Feeding & Behavior
• Understand common feeding problems in children with Autism Spectrum Disorder (ASD)
• Distinguish between picky eaters and children with feeding disorders
• Learn about behavioral strategies frequently used to treat feeding problems
• How to obtain a feeding evaluation

Copyright 2015, University of Rochester 3
5
Nutrition Related Health Concerns
• Concern with Dietary Intake – Deficiencies and Excesses– Limited or Special Diets (celiac, allergies, cultural, etc.)– Supplementation (concern with safety and/or interactions)– Socioeconomic (access to healthy foods)
• Weight Management– Decreased weight/appetite
• limited diet • side effect of medications (ie. stimulants)• other (ie. malabsorption)
– Increased weight/appetite• limited (energy dense) diet• medications• lack of physical activity • other (ie. Prader‐Willi)
6
Nutrition Related Health Concerns
• Abnormal Lab Values (vitamin D, iron, lipids, etc.)– Limited/Selective diet– Decreased absorption– Medications
• Gastrointestinal Issues (constipation, diarrhea, delayed emptying, abdominal pain)– Low fiber intake– Low fluid intake– Medications– Supplementation– Withholding
• Enteral Feeding (Feeding Tube)– Initiation and management– Adjustment when working to increase oral intake

Copyright 2015, University of Rochester 4
7
Nutrition Vocabulary and Definitions:
Term Definition Use
Dietary Reference Intake (DRI)
Set of recommended nutrient reference standards; includes EAR, RDA, AI, UL, EER, AMDR
Diet planning and assessment for healthy individuals/groups, applies to all nutrient sources
Estimated Average Requirement (EAR)
Nutrient intake estimated to meet the needs of 50% ofindividuals in a particular group
Assess prevalence of nutrient inadequacy in groups
Recommended Dietary Allowance (RDA)
Average daily nutrient intake that meets needs of 98% of individuals
Goal for intake by individuals
Adequate Intake (AI) Recommended average daily nutrient intake when no RDA can be established
Used to plan and evaluate diets of individuals or groups
Upper Limit (UL) Highest nutrient intake likely to pose no risk
Used to assess excess nutrient intake
Daily Value (DV) Food label guide to amount of nutrients in one serving based on highest DRI
Useful for comparing nutrient content of foods/beverages
8
Nutrition Vocabulary and Definitions:
Term Definition Use
Dietary Reference Intake (DRI)
Set of recommended nutrient reference standards; includes EAR, RDA, AI, UL, EER, AMDR
Diet planning and assessment for healthy individuals/groups, applies to all nutrient sources
Estimated Average Requirement (EAR)
Nutrient intake estimated to meet the needs of 50% ofindividuals in a particular group
Assess prevalence of nutrient inadequacy in groups
Recommended Dietary Allowance (RDA)
Average daily nutrient intake that meets needs of 98% of individuals
Goal for intake by individuals
Adequate Intake (AI) Recommended average daily nutrient intake when no RDA can be established
Used to plan and evaluate diets of individuals or groups
Upper Limit (UL) Highest nutrient intake likely to pose no risk
Used to assess excess nutrient intake
Daily Value (DV) Food label guide to amount of nutrients in one serving based on highest DRI
Useful for comparing nutrient content of foods/beverages
Use to assess nutrient adequacy of a given group
Goal for intake by individuals and used to assess dietary adequacy
Red flag – does this pose a risk?
How does this contribute to goals for the entire day’s intake?
Goal for intake by individuals

Copyright 2015, University of Rochester 5
9
`
10
Nutrient 100% DailyValue
RDA2‐3 yr old
RDA4‐8 yr old
RDA9‐13 yr old
M/F
Iron (mg) 18 7 10 8
Calcium (mg) 1000 500 800 1300
Vitamin A (IU) 5000 1000 1333 600
Vitamin C (mg) 60 15 25 45
Fiber (g) 23 14‐19 19‐23 31/26
Vitamin D (IU) 400 600 600 600
One Serving (3/4 cup) = Iron – 4.5mg
Vitamin D – 40 IU
Daily Value vs. Daily Recommended Intake

Copyright 2015, University of Rochester 6
11
Dietary Recommendations for Children
Years 1 2 ‐ 34 – 8FemaleMale
9 ‐13FemaleMale
14 ‐18FemaleMale
Calories(kcal/d)
900 10001200
1400
1600
1800
1800
2200
Protein(gm/kg/d)
1.1 1.1 .95 .95 .80
Fat(% kcal)
30 ‐ 40 30 ‐ 40 25 – 35 25 ‐ 35 25 – 35
CHO(% kcal)
45 ‐ 65 45 ‐ 65 45 ‐ 65 45 ‐ 65 45 ‐65
Sodium(mg/d)
1000 1000 1200 1500 1500
Fiber(gm/d)
19 19 2526
31
26
38
12
Choose MyPlate
• Make half your plate fruits and vegetables
• Make at least half your grains, whole grains
• Switch to fat‐free or low fat (1%) milk
• Keep your protein choices lean and about the size of a deck of cards

Copyright 2015, University of Rochester 7
13
Recommended Servings by Age
Age (yr)1 2 - 3 4 - 8
F/M9 -13F/M
14 -18F/M
Milk/Dairy (cups) 2 2 2.5 3 3
Meats/Bean (oz)1.5 2 3
45 5
6
Fruits (cups)1 1 1.5 1.5 1.5
2
Veggies (cups)¾ 1 1
1.52
2.52.53
Grains (oz)2 3 4
556
67
14
Top Sources of Calories Among Americans 2 Years and Older
• 1. Grain‐based desserts (139 calories)– Cake, cookies, pie, cobbler, sweet rolls, pastries, and donuts
• 2. Yeast breads (121)– White bread and rolls, mixed‐grain bread, flavored bread,
whole‐wheat bread, and bagels
• 3. Chicken and chicken mixed dishes (121)– Fried and baked chicken parts, chicken strips/patties, stir‐fries,
casseroles, sandwiches, salads, and other chicken mixed dishes
• 4. Soda/energy/sports drinks (114)– Sodas, energy drinks, sports drinks, and sweetened bottled
water including vitamin water
• 5. Pizza (98)
Source: NHANES 2005‐2006, Available at http://riskfactor.cancer.gov/diet/foodsources/

Copyright 2015, University of Rochester 8
15
Top Calorie ContributorsAge Group (Mean kcal/day)
2‐3(1471 kcal/day)
4 – 8(1802 kcal/day)
9 – 13(2035 kcal/day)
14 – 18(2427 kcal/day)
1. Whole Milk(104 kcal/day)
Grain based desserts
(136 kcal/day)
Grain based desserts
(145 kcal/day)
Sodas/energy/sports drinks(226 kcal/day)
2. Reduced Fat Milk(91 kcal/day)
Yeast bread(98 kcal/day)
Pizza(128 kcal/day)
Pizza(213 kcal/day)
3. Pasta and pasta dishes
(86 kcal/day)
Pasta and pasta dishes
(97 kcal/day)
Chicken and chicken mixed
dishes(122 kcal/day)
Grain based desserts
(157 kcal/day)
4. Grain based (68 kcal/day)
Pizza(95 kcal/day)
Yeast bread(109 kcal/day)
Yeast bread(151 kcal/day)
5. Yeast Breads(65 kcal/day)
Low Fat Milk(95 kcal/day)
Sodas/energy/sports drinks(105 kcal/day)
Chicken and chicken mixed
dishes(143 kcal/day)
Source: NHANES 2005‐2006, Available at http://riskfactor.cancer.gov/diet/foodsources/
16
History of Beverage Consumption
• From 1978 to 1998, average daily soft drink consumption:– almost doubled among adolescent females (increasing from 6 ounces to 11
ounces)– almost tripled among adolescent males (increasing from 7 ounces to 19
ounces)
• From 1999‐2008 and 2007‐2008:– Total SSB consumption decreased
• children (78% to 66%)• adolescents (87% to 77%).
– Soda was the most heavily‐consumed SSB in all age groups except for children.– Prevalence of soda consumption decreased, whereas heavy sports/energy
drink consumption tripled (4% to 12%) among adolescents
• http://www.ncbi.nlm.nih.gov/pmc/articles/PMC3662243/
Copyright 2015, University of Rochester 9
17
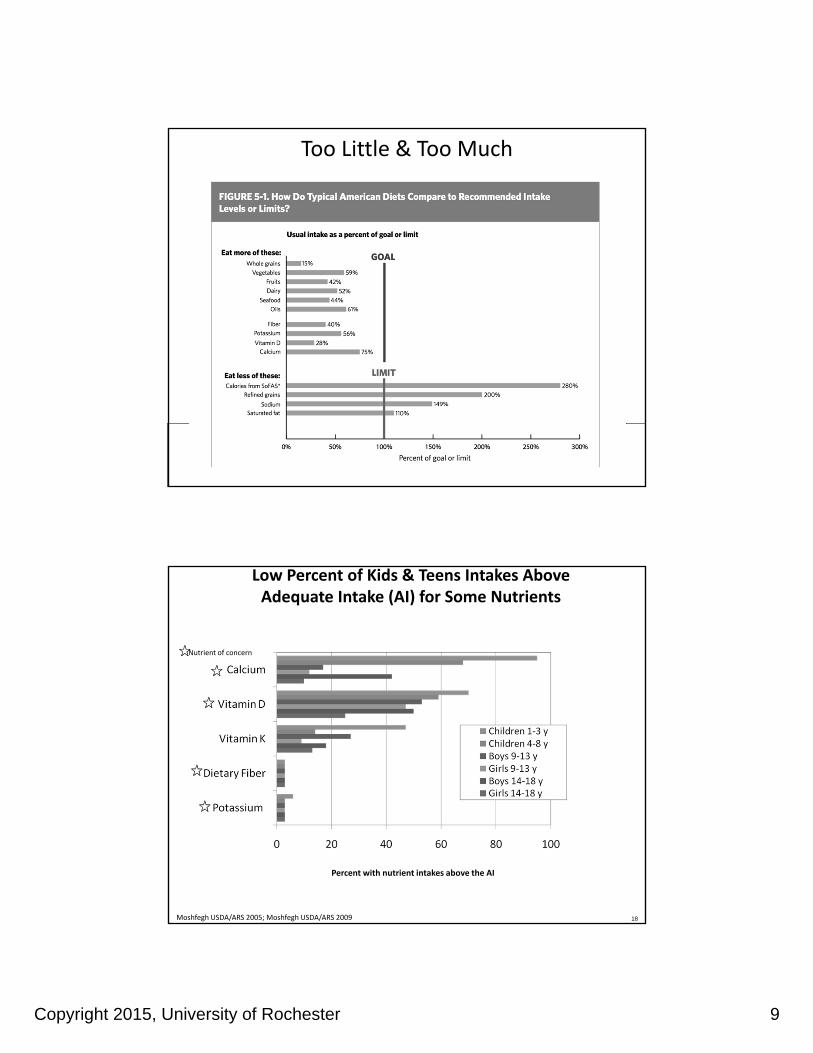
Dietary intakes in comparison to recommended intake levels or limits
Too Little & Too Much
18Moshfegh USDA/ARS 2005; Moshfegh USDA/ARS 2009
Low Percent of Kids & Teens Intakes Above Adequate Intake (AI) for Some Nutrients
Nutrient of concern
Percent with nutrient intakes above the AI
Copyright 2015, University of Rochester 10
19
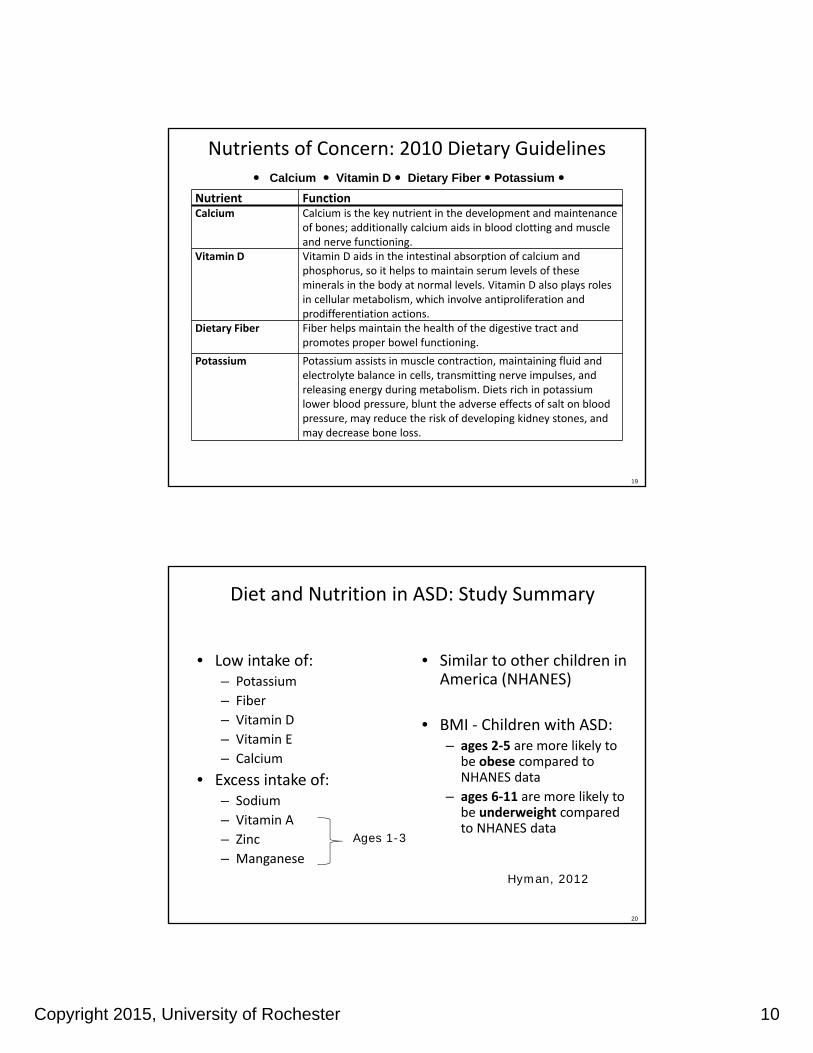
Calcium Vitamin D Dietary Fiber Potassium
Nutrients of Concern: 2010 Dietary Guidelines
Nutrient Function Calcium Calcium is the key nutrient in the development and maintenance
of bones; additionally calcium aids in blood clotting and muscle and nerve functioning.
Vitamin D Vitamin D aids in the intestinal absorption of calcium and phosphorus, so it helps to maintain serum levels of these minerals in the body at normal levels. Vitamin D also plays roles in cellular metabolism, which involve antiproliferation and prodifferentiation actions.
Dietary Fiber Fiber helps maintain the health of the digestive tract and promotes proper bowel functioning.
Potassium Potassium assists in muscle contraction, maintaining fluid and electrolyte balance in cells, transmitting nerve impulses, and releasing energy during metabolism. Diets rich in potassium lower blood pressure, blunt the adverse effects of salt on blood pressure, may reduce the risk of developing kidney stones, and may decrease bone loss.
20
Diet and Nutrition in ASD: Study Summary
• Low intake of: – Potassium
– Fiber
– Vitamin D
– Vitamin E
– Calcium
• Excess intake of:– Sodium
– Vitamin A
– Zinc
– Manganese
• Similar to other children in America (NHANES)
• BMI ‐ Children with ASD:– ages 2‐5 are more likely to
be obese compared to NHANES data
– ages 6‐11 are more likely to be underweight compared to NHANES data
Ages 1-3
Hyman, 2012

Copyright 2015, University of Rochester 11
21
Other Concerning Nutrients for Certain Populations
• Folate
– women who may become pregnant
• B12
– Individuals 50 years of age and older (decreased absorption of natural forms of B12)
• Iron
– women who may become pregnant
– teenage girls
22
Food Record – 6 yo male

Copyright 2015, University of Rochester 12
23
24
Recommendations for Calcium and Dairy
DRI Age GroupIOM Recommendation s for Calcium
RDA (mg) UL
1–3 years old 500 2500
4‐8 years old 800 2500
9‐13 years old 1300 3000
14‐18 years old 1300 3000
Age GroupCups of Dairy
Per Day
2‐3 years old 2
4‐8 years old 2.5
9‐13 years old 3
14‐18 years old 3
• During the last 25 years, consumption of milk, the largest source of calcium, has decreased 36% among adolescent females.
• About 85% of adolescent females do not consume enough calcium.

Copyright 2015, University of Rochester 13
25
Calcium Sources
Food Serving Size
Calcium(mg)
Yogurt 8 oz 415
Mozzarella 1.5 oz 333
Cheddar Cheese 1.5 oz 307
Milk 1 cup 276‐299
Fortified O.J. 1 cup 261
Fortified Milk Alt. 1 cup 299
Tofu ½ cup 253
Cereal Bar 1 200
Fortified Cereal 1 cup 100‐1,000
Frozen Yogurt ½ cup 103
26
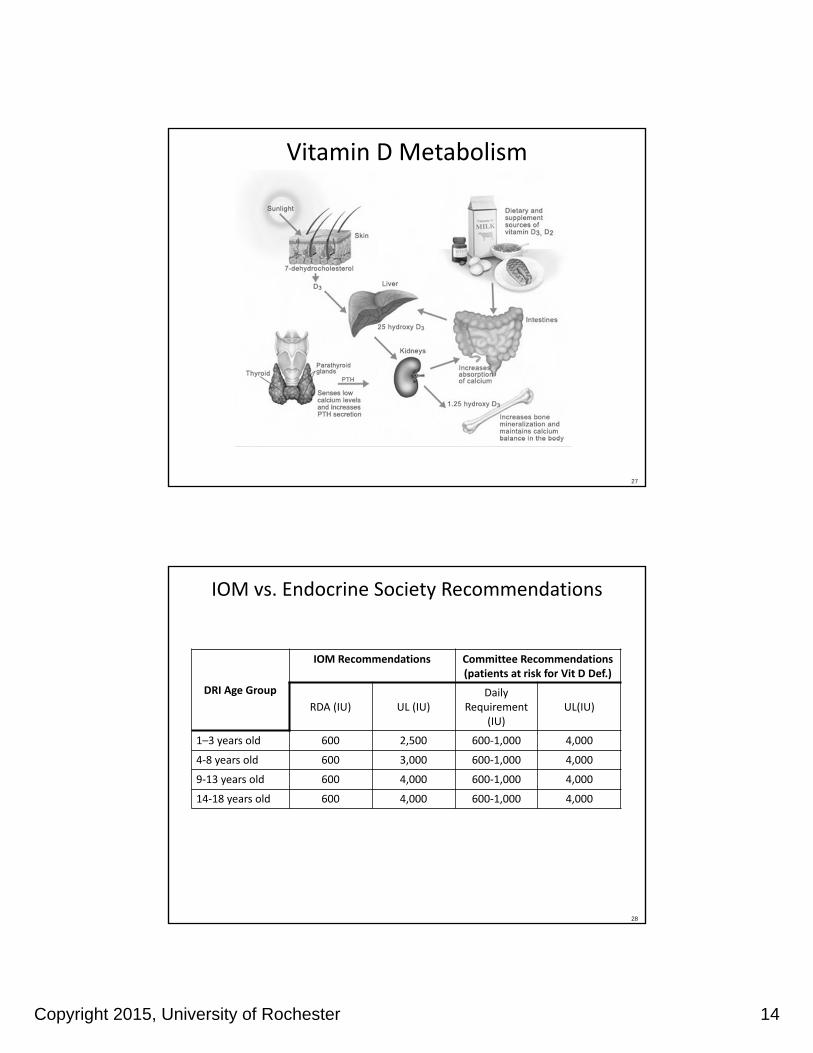
What is Vitamin D?
• Fat soluble vitamin that is produced endogenously when exposed to sunlight (UVB)
• Technically a hormone
– Converted in liver, kidney
• Vitamin D3 (also known as cholecalciferol) and vitamin D2 (ergocalciferol) promote absorption of calcium, iron, magnesium, phosphate, zinc
Copyright 2015, University of Rochester 14
27
Vitamin D Metabolism
28
IOM vs. Endocrine Society Recommendations
DRI Age Group
IOM Recommendations Committee Recommendations (patients at risk for Vit D Def.)
RDA (IU) UL (IU)Daily
Requirement (IU)
UL(IU)
1–3 years old 600 2,500 600‐1,000 4,000
4‐8 years old 600 3,000 600‐1,000 4,000
9‐13 years old 600 4,000 600‐1,000 4,000
14‐18 years old 600 4,000 600‐1,000 4,000

Copyright 2015, University of Rochester 15
29
Vitamin D Sources
Food Serving Size
Vit. D (IU)
Sockeye Salmon 3 oz 794
Canned Tuna 3 oz 154‐229
Ovaltine – Malt ¼ cup 200
Fortified Milk 1 cup 100
Fortified O.J. 1 cup 100
Fortified Milk Alt. 1 cup 80‐120
Fortified Marg. 1 TBSP 60‐80
Fortified Yogurt ½ cup 50
Shiitake Mushrooms 1 cup 45 IU
Fortified Cereal ¾ cup 40
30
Vitamin D & Calcium in Milk

Copyright 2015, University of Rochester 16
31
At Risk for Deficiency(Who to Screen)
• Inadequate exposure to Sunlight – SPF 30 reduces Vit D
production by 95%– Dark skin tones require 3‐5
times more sun exposure
• Obesity (BMI > 30) • Age (older adults) • Pregnant/lactating
women • Fat Malabsorption
Syndromes / Bariatric Surgery
• Medications
– Anticonvulsants
– Glucocorticoids
– AIDS/HIV meds
• Chronic Conditions:
– Chronic Granuloma Forming disorders
– Lymphoma
– Primary Hyperparathyroidism
32
(25‐OH) Vitamin D Serum Levels
Range (ng/ml ) Risk/Benefit
Adequate 30‐50 Maximum Ca & Phosabsorption
Insufficiency 20‐29 Maintains bone health / low risk
Deficiency < 20 High risk for bone‐related diseases
Excess > 50 Increase in all‐cause mortality

Copyright 2015, University of Rochester 17
33
Vitamin D Supplementation
34
Increasing Dietary Fiber Intake
• Change to Whole Grain Products– White Whole Grain Bread
– Whole Grain Crackers
• Bake with whole wheat flour
• Use a healthy cereal as a snack
• Increase Fruits & Vegetables– Smoothies
– Veggies and Fruit with Dips
– Kabobs

Copyright 2015, University of Rochester 18
35
Potassium Choline
36
Increasing Dietary Iron
• Heme:– Meat (beef, turkey, chicken,
fish, chicken nuggets, tuna and pork)
• Non‐Heme:– Breakfast Cereal
– Beans
– Molasses
– Tofu
– Oatmeal
– Raisins
– Whole Grain Crackers
– Granola Bars
Copyright 2015, University of Rochester 19
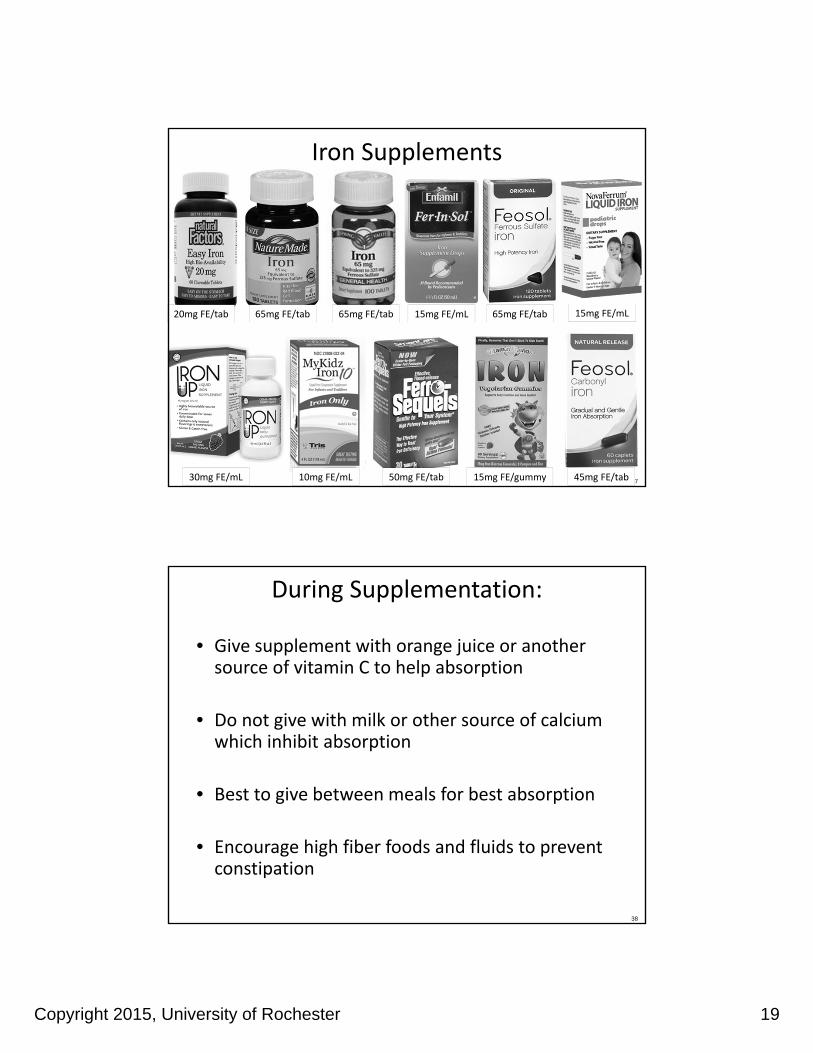
37
20mg FE/tab 65mg FE/tab 65mg FE/tab 15mg FE/mL 65mg FE/tab 15mg FE/mL
30mg FE/mL 10mg FE/mL 50mg FE/tab 15mg FE/gummy 45mg FE/tab
Iron Supplements
38
During Supplementation:
• Give supplement with orange juice or another source of vitamin C to help absorption
• Do not give with milk or other source of calcium which inhibit absorption
• Best to give between meals for best absorption
• Encourage high fiber foods and fluids to prevent constipation

Copyright 2015, University of Rochester 20
39
During Supplementation:
• Use age appropriate supplements (if using MVI)– Gummy MVI’s typically DO NOT contain iron
• Give orange juice or brush teeth right after a dose of liquid iron to prevent staining of teeth
• Ensure that the iron supplement is kept out of reach to prevent overdose which could be fatal
• Do not start iron supplementation without the guidance of a health care professional
• Follow recommendations for ROUTINE FOLLOW UP LABS and adjust supplementation as directed
40
Tips for Weight Management:
– Increase physical activity (non‐food reward)
– Use smaller plates
– Serve away from table
– Monitor “seconds”
– Drink low‐calorie beverage between bits (put down fork –encourages slower eating)
– Provide healthy snacks (“snack drawer”)
– Minimize fast food consumption
– Use small plastic bags for portion control
– Increase fiber intake
– Switch to 1% or skim milk
– Monitor juice intake
– Reduce soda intake (try adding soda water to 100% juice)
– Meal time and snack schedule
Overweight or Obese
Copyright 2015, University of Rochester 21
41
Nutrition Factors that May Increase Risk of Weight Gain
• Low fruit and vegetable intake
• High intake of sweetened beverages
• Frequency and energy density of snacks
• Frequency of eating out the home
• Skipping breakfast
• Increased portion size
2010 Dietary Guidelines
42
Tips for Weight Management:
– Structured meals and snacks – Increase % fat milk– Peanut butter on crackers or with apples– Add butter to bread, sandwiches, pasta, muffins – Use oils in cooking– Top food with cream sauces and dressing– Add cheese to potatoes, salads, vegetables, etc.– Use trail mix with dried fruit, nuts and candy as a snack
– Have healthy high‐energy snack available
Underweight

Copyright 2015, University of Rochester 22
43
Example: Gummy Multivitamin
• Nutrients of Concern
– Fiber
– Vitamin D
– Potassium
– Calcium
– Choline
– Iron
44
Supplement Use In Children
• 34% general pediatric population
• 61% with children with chronic illness
• 66% of children with autism
• Parents who use dietary supplements are more likely to have children who do so
• Multivitamin/mineral supplements are the most commonly used type of dietary supplement
• Other frequently used supplements are vitamins A, C, D, and calcium and iron
.

Copyright 2015, University of Rochester 23
45
Top 10 Dietary Supplements in Children (2004)
1. Multivitamins/minerals2. Calcium3. B‐Vitamins4. Vitamin C5. Glucosamine/Chondroitin6. Vitamin E7. Other vitamin combinations8. Coenzyme Q109. Fish Oils10.Vitamin A/β‐Carotene
46
AAP Recommendations for Infants & Toddlers
• Vitamin D– Breastfed infants
– Infants & toddlers without adequate consumption (fortified food sources) and/or sun exposure
• Iron– Depends on risk (e.g., breastfeeding at 6 months, formula‐fed, pre‐term or low birth weight, toddlers consuming limited iron‐rich foods)
• Fluoride– 6 months ‐ 3 years in areas with low fluoride concentration of community water supply

Copyright 2015, University of Rochester 24
47
Pediatric Supplement Recommendations
“Routine supplementation of healthy children and adolescents is unnecessary except in special cases.”
‐ AAP 2009
48
Adverse Effects of Excess Consumption
Nutrient Effect
Vitamin A (preformed) Birth defects, liver toxicity, increased intracranial pressure, dizziness, nausea, headaches, skin irritation, pain in joints and bones, coma, death
Zinc Reduced copper status, altered iron function, reduced immune function, reduced HDL cholesterol, nausea, vomiting, loss of appetite, abdominal cramps, diarrhea,headaches, possible effect on kidney function
Folate (synthetic) Masks neurological complication in individuals with vitamin B12 deficiency, may accelerate progression of pre‐cancerous lesions
Manganese Neurotoxicity, may be present in specialty supplements
Copper Gastrointestinal distress, liver damage

Copyright 2015, University of Rochester 25
49
Safety Concerns with Supplements
• Dietary supplements are not required to be standardized in the United States– no legal or regulatory definition exists in the United States for standardization as it applies to dietary supplements.
• Independent organizations offer quality testing:– U.S. Pharmacopeia
– ConsumerLab.com
– NSF International
– assurance that the product was :• properly manufactured
• contains the ingredients listed on the label
• and does not contain harmful levels of contaminants
– do not guarantee that a product is safe or effective
50
Safety Concerns with Supplements
• Iron:– keep iron preparations out of the reach of children– monitor iron status closely when supplementing
• Fish Oils:– supplements may contain vitamins A and D; these vitamins can be toxic in high doses
– Omega‐3 supplements may interact with drugs that affect blood clotting
– It is uncertain whether people with fish or shellfish allergies can safely consume fish oil supplements
– Side Effects (seen at >3g/day) • bleeding, aftertaste, loose stools, gas, bloating, belching, nausea
Copyright 2015, University of Rochester 26
51
Safety Concerns with Supplements
• Seek guidance from physician and dietitian with knowledge in the area of supplementation
• Encourage families to trial separately
• Gather detailed information about supplements, doses and timing as well as other medications the patient is taking
– Use a local drug interaction line
• Compare nutrient amounts in supplements to age appropriate Upper Limits and counsel parents on potential side effects of high dose
52
Nutrition Resources
• Academy of Nutrition and Dietetics
– http://www.eatright.org/
• Autism Speaks Toolkits
– http://www.autismspeaks.org/site‐wide/tool‐kit
• Dietary Guidelines
– http://www.health.gov/dietaryguidelines/
• DRI Books – Institute of Medicine
– http://www.nap.edu/catalog.php?record_id=9956
• DRI Tables (United States Department of Agriculture
– http://fnic.nal.usda.gov/dietary‐guidance/dietary‐reference‐intakes/dri‐tables
• Office of Dietary Supplements (NIH)
– http://ods.od.nih.gov/
• Lexicomp Online
– http://online.lexi.com/lco/action/home/switch
• National Center for Complementary and Alternative Medicine (NIH)
– http://nccam.nih.gov/
• UpToDate
• http://www.uptodate.com/home

Copyright 2015, University of Rochester 27
53
Nutrition Take Home Points• We recommend initiating one
intervention at a time– Identify clear outcomes and
timeline– Weigh pros and cons (cost, burden on family, etc.)
• Focus on nutrients of greatest concern– Vitamin D, calcium, iron (source),
fiber and potassium– These nutrients may not come
from traditional food sources –– Be Creative!
• Increasing variety is KEY – If consuming < 20 foods, less
likely to meet nutritional needs
•Encourage physical activity– Limit screen time (<2 hours)
• avoid eating while watching TV– 6 to 17 yo - at least 60 min daily
•Focus decreasing intake of sugar sweetened beverages and grain based desserts
– Soda/Energy Drinks in 14-18 yo
•Supplements – Do Ask, Do Tell– Make sure your child’s doctor
aware of the supplements your child is taking
•Seek guidance from a registered dietitian with experience working with children with ASD
54
Feeding & Behavior
Copyright 2015, University of Rochester 28
55
DSM IV (1994, Rev 2000)
• Persistent failure to eat adequately or gain weight, or significant weight loss over at least one month
• Not due to existing medical condition
• Not better accounted for by another mental health disorder or lack of food
• Onset before age 6
56
Focus on Failure to Thrive
• Debate about organic vs. nonorganic FTT
• FTT admissions, fed by nursing
• Multiple labs and procedures
• If they gained weight, it was environmental
• Faulted the parent for poor weight gain

Copyright 2015, University of Rochester 29
57
Are Parents to Blame?
• 60 children from Montreal clinic, ages 1‐4
• N=22 for OFTT and N=38 for NOFTT
• Did parent behaviors affect negative eating behaviors?
• Parent affect and interaction styles
• Child ‐ Tracked meal length, interest in food (appetite), texture tolerance and food refusal
• Questionnaires and Meal Observations
• Ramsay, Gisel, Boutry 1993
58
Results – Not the Parents’ Fault
• NOFTT had hx of neurophysiological symptoms
• Parent affect and interactions were similar across families and groups of OFTT vs. NOFTT
• All children displayed some refusal behavior
• Only half of the parent child interactions were negative
• Behaviors/interactions may represent long term problems
• Not indicators of parental psychopathology
• Early feeding problems may trigger negative parent‐child interactions

Copyright 2015, University of Rochester 30
59
Picky Eaters vs. Feeding Disorders
Component of Feeding Picky Eaters Feeding Disorder
Nutrition 1‐2 foods per food group
Missing food groups
Refusal Behavior Mild, verbal Disruptive, screamingBrand and Container
Social Interactions Involving Foods
Can eat at a restaurant, Friends house, parties
Bring food from homeEat before going out
What is the Motivation to Try New Foods
Peers, favorite foods No interest
60
New Definition of a Feeding Disorder
• A. Persistent failure to meet nutritional/ energy needs with 1 (or more) of the following
– Weight loss, failure to maintain weight (fall off growth chart
– Nutritional deficiency (significant)
– Depends on enteral feedings or oral supplements
– Marked interference with social functioning
• DSM 5 (2013)

Copyright 2015, University of Rochester 31
61
Diagnostic Criteria
• B. Not due to lack of food or cultural practice
• C. Does not occur with Anorexia Nervosa or Bulimia Nervosa (no body image issues)
• D. Not due to concurrent medical condition or mental health disorder
– Unless, severity of feeding concerns exceeds what is typically seen with that condition
– Warrants additional clinical attention
62
Behavioral Eating/Feeding Disturbance
• Lack of interest in food or eating
Don’t seem to care about what other people eat
Don’t show hunger
• Concerns about aversive consequences of eating
It might make me sick, It tastes bad
• Avoidance based on sensory characteristics of food
That looks gross, It’s too sticky

Copyright 2015, University of Rochester 32
63
Diagnostic Features
• Sensory Characteristics
– Smell, texture, taste, temperature, color, shape
– Brand and Container
Food selectivity
Food refusal
Food neophobia Anxiety
64
Origins of Feeding Disorders
• Aversive event was paired with eating,
• Reflux, pneumonia, feeding tube, choking
• Treat the illness, but food aversion remains
• Classical Conditioning Model
– What foods have you had a bad experience with?

Copyright 2015, University of Rochester 33
65
Medical Disorders
• GERD, Chronic vomiting
• Delayed emptying
• Food allergies
• Eosinophilic esophagitis
• Celiac disease
• G‐tube dependence
• Swallowing dysfunction
• Upper respiratory infections
66
Associated Diagnoses
• Autism Spectrum Disorder
• Prematurity
• Cystic Fibrosis
• Cerebral Palsy, Down Syndrome
• Oral Motor/ Structural (i.e., Cleft lip/palate)– Aspiration
• 40‐80% of children with disabilities have a feeding problem
Copyright 2015, University of Rochester 34
67
Neuro/Dev/Beh Issues
• Developmental levels
• Oral motor skills
• Protect airway
• Sit at a 90‐90‐90 angle
• Coordinate hand to mouth for independence
• Encouragement, interaction, opportunity
• Breathing, Positioning, Eating
68
When do feeding problems start?
• Sudden illness
• Onset of behaviors associated with ASD
• Introduce solids/table foods
• Disruptions in the developmental food continuum

Copyright 2015, University of Rochester 35
69
Developmental Food ContinuumAge Foods/Fluids Feeding Skills Motor Development
1‐4 months Breast milk thru 6 mo per AAP
Suckle pattern Improved head control at 4 mo
4‐6 months Thin cereals Decreasing tongue thrustMove gag reflex back
Grasp objectsBring hands to mouth
6‐8 months Thick cerealsStage 1‐2Start w/ veggies
Lip closure MunchingTongue moves front to back
Sits with balance (6 mo)Start holding bottle/cup
8‐10 months Table pureesMashed foodsMeltables
Lateralize tongueStarts chewingFinger feeding
Coordinates hand –mouthImproved cup drinkingIncreases solid intake
10‐12 months Chopped foodsSoft meatsMixed textures
Rotary chewBite and tear
Works on spoon feeding
70
Critical /Sensitive Periods
• Need certain experiences/stimuli to move through developmental stages
• There are periods of development where we learn certain skills better than others
• Language, oral motor skills• 4‐6 months decrease tongue thrust, gag reflex• 6‐12 for munching, tongue movement, chewing• Missing these stages can cause oral motor delays and create difficulty advancing textures
Illingsworth & Lister, 1964

Copyright 2015, University of Rochester 36
71
Common Feeding Problems
• Food selectivity by type and/or texture
• Food selectivity by brand and/or container
– Perseverative interests, obsessions, meal presentation and routines
– Food neophobia, anxiety
• Food refusal
• Oral motor delay
• Parent‐child interactions
72
Food Selectivity
• Type
• Texture
• Brand
• Container
• Visual presentation

Copyright 2015, University of Rochester 37
73
Perseverative Behaviors at Meals
• Bottles to cups
• Favorite utensils, plates, bowls
• How food is presented on plate
• Food can’t touch, only eat 1 food at a time
• Significant disruptive behaviors if food items are not exactly the same
74
Disruptive Behaviors
• Head turning
• Batting at the spoon
• Throwing food
• Spitting food out
• Screaming
• Holding food in the mouth (packing)
• Leaving the table – refusing to sit

Copyright 2015, University of Rochester 38
75
Oral Motor Delays
• Delayed chewing skills
• Poor tongue lateralization
• Hypersensitive gag reflex
• Hypotonia
• Difficulty biting/tearing food
• Tactile and oral defensiveness
76
Parent‐Child Interactions
• Attention
• Follow‐through
• Distractions
• Siblings

Copyright 2015, University of Rochester 39
77
Food Neophobia
• Anxiety responses around food increasing in young children
• Shaking, staring off, flush red, turn pale, fidgety, sit on their hands.
• Flap hands with touch, facial grimaces with smell
• They don’t have good insight
78
How Kids Think About Food
• “It looks gross.”
• “It’s gonna make me puke.”
• “I’ve tried it before.” (over a year ago)
• “That’s not mine.”
• Different means bad.
• Once they think it will taste bad, it will.
• Becomes a “cognitive‐behavior” problem

Copyright 2015, University of Rochester 40
79
Matching Stress to Strategies
• Take the Pressure off Eating
• Positive Self Talk
• Humor and Logic
– “Taste with our tongue, not with our eyes.”
• Distraction
• Rating Scales
80
Myth or Fact?
• Take away preferred foods (junk foods) and the child will get hungry enough to eat what you serve the family.
• Children won’t starve themselves.

Copyright 2015, University of Rochester 41
81
Do Children Get Hungry?
• Children do not appear to be hungry
• No interest in other people’s food
• Do not typically request food
• Do not eat when they do request food
• Eat a few bites and then are done
82
What does hunger feel like?
• Kids sometimes say their stomach grumbles
• Pain, nausea, always feels this way
• Take edge off hunger with grazing (solids & liquids)
• Typically cant describe being “full”
• Children are left to try and regulate their own systems.

Copyright 2015, University of Rochester 42
83
Hunger–Satiety Cycles
• Our Hunger‐Satiety cycle runs about every 4 hours.
• We recognize our hunger and satiety cues by pains in our stomach – growling for hunger, low throb for fullness.
• Scheduling meals helps establish hunger.
84
Myth or Fact?
• Leaving food out all day will increase the amount of food a child eats
Copyright 2015, University of Rochester 43
85
Grazing and Hunger
• Adults eat small frequent meals throughout the day to lose weight.
• It takes the edge off our hunger so we never feel really hungry or full.
• Affects children in the same way.
• Milk alone can curb hunger and keep a child from eating their meal.
86
Positive Mealtime Routine
• Meals/snacks at the same time every day
• No grazing, Water only
• Activities between meals
• Appropriate seating
• Eat meals together
• Limit distractions
• Rules/set limits (Time limits, sitting, clean up)
• Fun and positive (Ignore whining)

Copyright 2015, University of Rochester 44
87
3 Core Strategies to Increase Variety
1. Reinforcement – What follows behavior increases behavior
a. Layers
2. Shaping – Shape a Response
a. The Steps to Eating
3. Fading – Fade a Stimulus
a. Food Chaining
88
Myth or Fact?
• Offer preferred foods as rewards for eating non‐preferred foods (Grandma’s rule)

Copyright 2015, University of Rochester 45
89
1. Reinforcement
• Before: Prepare meal/snack
• During: TV/toys, technology, praise, games
• After: Fun activity for cooperation
• Document: Food logs, charts, checklists
• Later: Change rewards
• Layers of reinforcement help reduce refusal and anxiety
90
Characteristics of Reinforcement
• Contingent – applied just to target behavior
• Specific – child should know exactly what behaviors to emit and what will happen
• Reasonable – relatively easy to complete
• Immediate – as soon as behavior occurs
• Value – must be worth the effort to earn
• Each time – reward each instance of behavior
• Use reminders – Charts, PECS, etc

Copyright 2015, University of Rochester 46
91
Common Questions?
• Why don’t sticker charts work?
• Rewards work for a little while and then stop.
• Child never consistently plays with the same thing.
• How do I chose a reinforcer if my child doesn’t like to “play?”
• Why do I have to buy prizes for my child just to take a few bites?
92
Myth or Fact?
• Takes 10‐ 20 offers of a new/novel food for a child to learn to like it
• Put something new on their plate every day
Copyright 2015, University of Rochester 47
93
2. SHAPING‐ The Steps to Eating
• Increase tolerance to foods– On the table, near or on child’s plate
• Increase interaction with foods– Stab, stir, touch with hands, serving others
• Increase nearness of food to mouth– Smell, touch to lips
• Increase tasting of food with tongue– Licking, touching food to tongue
• Take a small bite
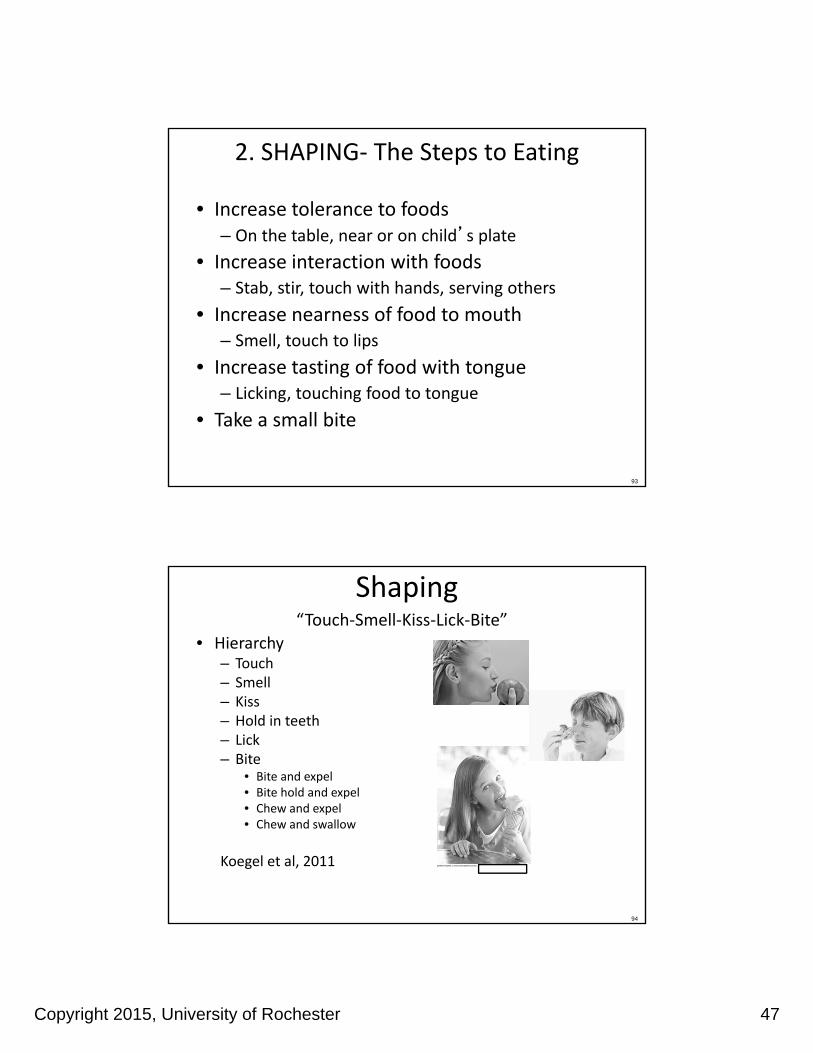
94
Shaping
• Hierarchy– Touch– Smell– Kiss– Hold in teeth– Lick– Bite
• Bite and expel• Bite hold and expel• Chew and expel• Chew and swallow
Koegel et al, 2011
“Touch‐Smell‐Kiss‐Lick‐Bite”

Copyright 2015, University of Rochester 48
95
3. Fading
• Slow introduction of
– Volume of food presented
– Types of foods
– Changing cups or plates
– Different seating
• Helps with kids who are rigid and have set preferences
96
Where to Start
• Foods to offer
– Similar to foods they already eat
– Foods fed to the family
– Foods they used to eat but don’t eat now
– Match by texture, taste, shape
• Foods to Avoid• Foods that have made them sick
• Foods they show clear dislike for

Copyright 2015, University of Rochester 49
97
Food Chaining
• Food chaining uses fading to introduce new foods.
• Pair preferred foods with similar, but different foods (e.g. plain cheerios with honey nut cheerios)
• Compare and Contrast
• Continue to pair different flavors, or different brands to expand the repertoire of a preferred food.
98
Chicken Nuggets Food Chain
• Chicken Nuggets – McDonald’s
– Wendy’s
– KFC
– White meat frozen nuggets
– Pop corn chicken
– Chicken tenders or strips
– Fried chicken (skin and chicken only, no bone)
– Baked chicken (Rotisserie)
– Grilled chicken

Copyright 2015, University of Rochester 50
99
Feeding Therapy Case Study
• Manny – 3 y/o, ASD
– Food selectivity by type, brand
– Food refusal & disruptive behaviors
– Previous therapy had mixed results
– 36 outpatient sessions over 1 year
– Continued to have some therapy from school
– Mom carried out all recommendations at home
100
Manny’s Protocol
• Layers of Positive Reinforcement
– Monitor how it’s delivered
• Shaping
• Food Chaining
• Choices – “Illusion of control”

Copyright 2015, University of Rochester 51
101
Manny’s Foods:
Initial Foods – 11/2012
•Carbs – Waffles, Pretzels, Toast
•Dairy – Baby yogurt
•Fruit – Apple
•Other – Baby foods, smooth (multiple flavors)
Current Foods – 5/2014•Carbs – Bread variety, Brown rice, Spaghetti with sauce •Dairy – Soy yogurt variety, Cheese (plain, sandwich, grilled)•Fruit – Applesauce variety, Bananas•Vegetables – Carrots, Broccoli potato cakes•Protein – Variety of Chicken, meatloaf, pizza, Peanut butter•Healthy snacks – Nutri‐Grain bars, organic fruit snacks•Eliminated baby foods
102
Take Home Points
• Think about the difference of picky eating vs feeding problems – more than just about growth
• Be specific when talking with professionals
• Children need mealtime structure – sitting
• Allow food interactions to be fun and not stressful
• Make nutritionally sound food choices,
– based on need rather than opinion
– but also realistic

Copyright 2015, University of Rochester 52
103
Picky Eaters vs. Feeding Disorders
Component of Feeding Picky Eaters Feeding Disorder
Nutrition 1‐2 foods per food group
Missing food groups
Refusal Behavior Mild, verbal Disruptive, screamingBrand and Container
Social Interactions Involving Foods
Can eat at a restaurant, Friends house, parties
Bring food from homeEat before going out
What is the Motivation to Try New Foods
Peers, favorite foods, activities
No interest
104
Kirch Developmental Center: Feeding Team Members
At the initial assessment the parent and child may meet with a psychologist, registered dietitian, and speech therapist.
Psychologist
DietitianSpeech
Therapist
Behaviors
NutritionOral Motor
Parenting

Copyright 2015, University of Rochester 53
105
Kirch Feeding Disorder Program
• Initial evaluation often includes meal observation
• Learn about the child’s behavioral, oral motor, and nutritional status – Match nutrition needs with child’s feeding patterns (follow‐up visit)
• Identify needed services for therapy/follow‐up• May start with 4‐6 sessions of therapy depending on needs of the child
and family.
• Families would bring their child, preferred foods, and new/novel foods to try.
• Cost:
– Feeding therapy may be covered by insurance, self‐pay, or grant funding.
– Family should talk with their insurance company to determine what services are covered.
106
Kirch Feeding Disorder Program
• Strategies such as positive reinforcement, shaping and fading will be used to increase acceptance of new foods.
• Ongoing nutritional analysis to determine the foods your child need to improve their nutritional status.
• Provide homework so families can practice these strategies at home.
• Parents call to schedule evaluation– (585)275‐2986 – ask to speak with Lisa Snow– determine what services needed on intake (SLP and/or RD)

Copyright 2015, University of Rochester 54
107
*Resources
• Rochester Regional Center for Autism Spectrum Disorder (RRCASD).– On‐line educational resources, webinars, Information & Referral services.
– Contact information: • Website: www.golisano.urmc.edu/rrcasd‐nyautism
• E‐mail: [email protected]• Tele: 1‐855‐508‐8485
• Autism Speaks: website: www.autismspeaks.org
• This site contains various toolkits and guides for home, school, work, safety, health/medical, etc.
108
Behavioral Feeding Resouces
• Fraker, C., Fishbein, M., Cox, S., and Walburt, L. (2007). Food Chaining: The proven 6 step plan to stop picky eating, solve feeding problems, and expand your child’s diet. Philadelphia, PA, Da Capo Press.
• Satter, E. (1987). How to get your kid to eat…but not too much
• Jana, L., and Shu, J. Food Fights. (2008). Amercican Academy of Pediatrics, Department of Marketing and Publication Staff.
• www.dole5aday.com
• www.eatright.org/kids/

Copyright 2015, University of Rochester 55
109
Question & Answer
A Webinar Evaluation Survey will be sent to your e‐mail.
Please complete to receive a Certificate of Attendance.
110
Thank You!