rps: remedial priority system - state
TRANSCRIPT

RPS: Remedial Priority SystemRPS: Remedial Priority System
Site Remediation’s GIS Tool for Measuring Potential Receptor Risk
1
Measuring Potential Receptor RiskGeneral Public Presentation, May 24, 2010

1993 : A Hand Crafted Score
2
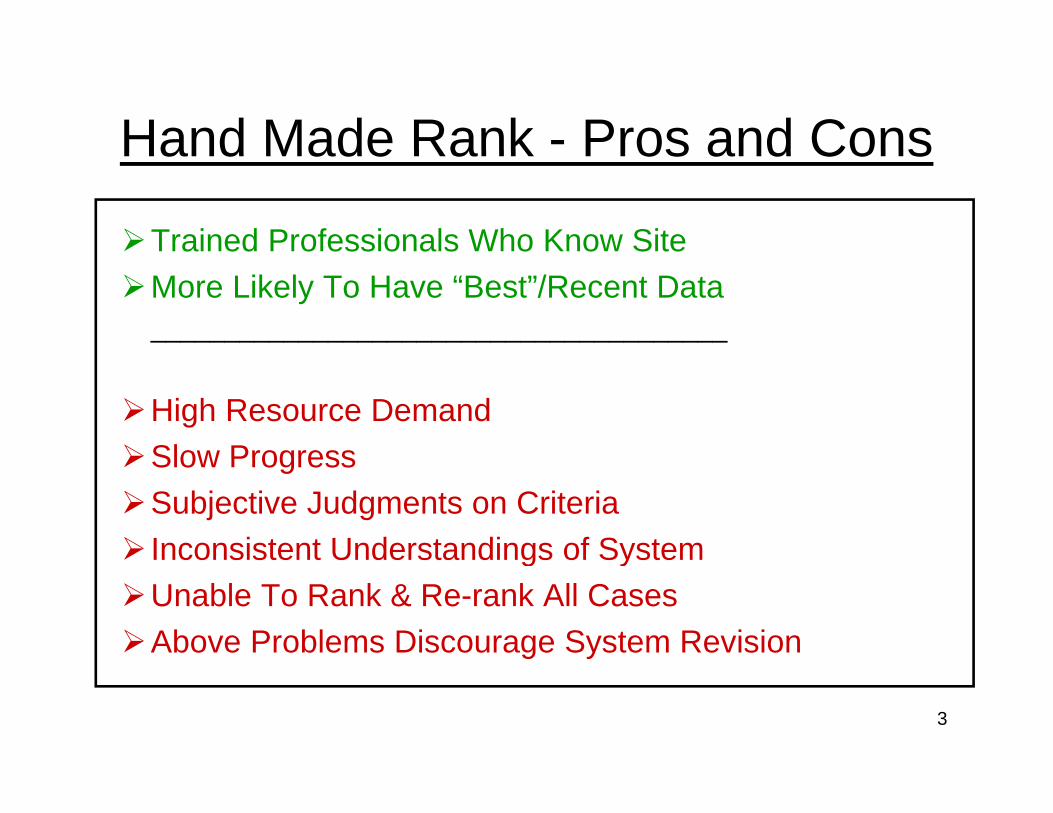
Hand Made Rank - Pros and ConsHand Made Rank Pros and Cons
Trained Professionals Who Know SiteMore Likely To Have “Best”/Recent Data
_______________________________________
High Resource Demand Slow ProgressSlow ProgressSubjective Judgments on Criteria Inconsistent Understandings of System g yUnable To Rank & Re-rank All CasesAbove Problems Discourage System Revision
3

2009 : SRRA Marching Ordersg
M 7 2010 R k All Sit b C tMay 7, 2010 - Rank All Sites by Category
Base Ranking Upon:
1. risk to the public, environment2. length of time undergoing remediation3. economic impact 4. other factors deemed relevant
4

What is RPS?It is NOT a completed RI/FS
It is NOT an electronic Case Manager
It is NOT a Crystal Ball
It IS a Triage Tool to Sort Sites forSort Sites for Further Consideration
5
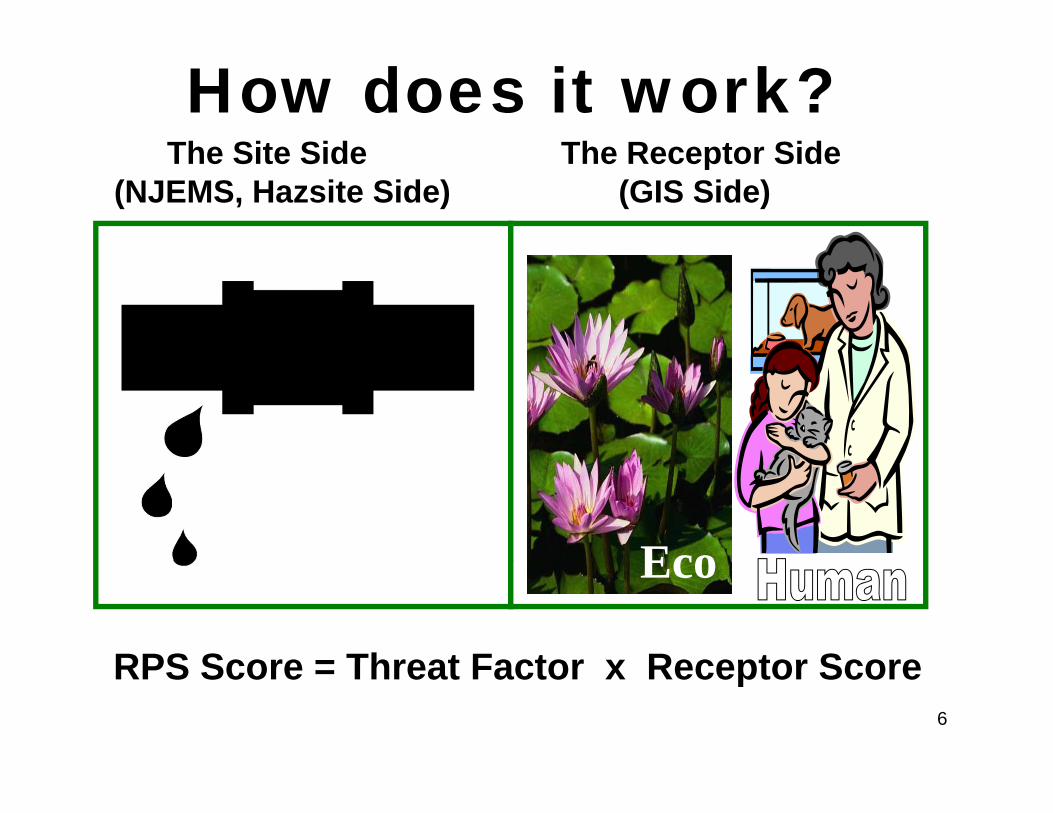
The Site Side The Receptor SideHow does it work?
The Site Side The Receptor Side(NJEMS, Hazsite Side) (GIS Side)
The Site Side The Receptor Side
EcoEco
RPS Score = Threat Factor x Receptor Score6
RPS Score = Threat Factor x Receptor Score
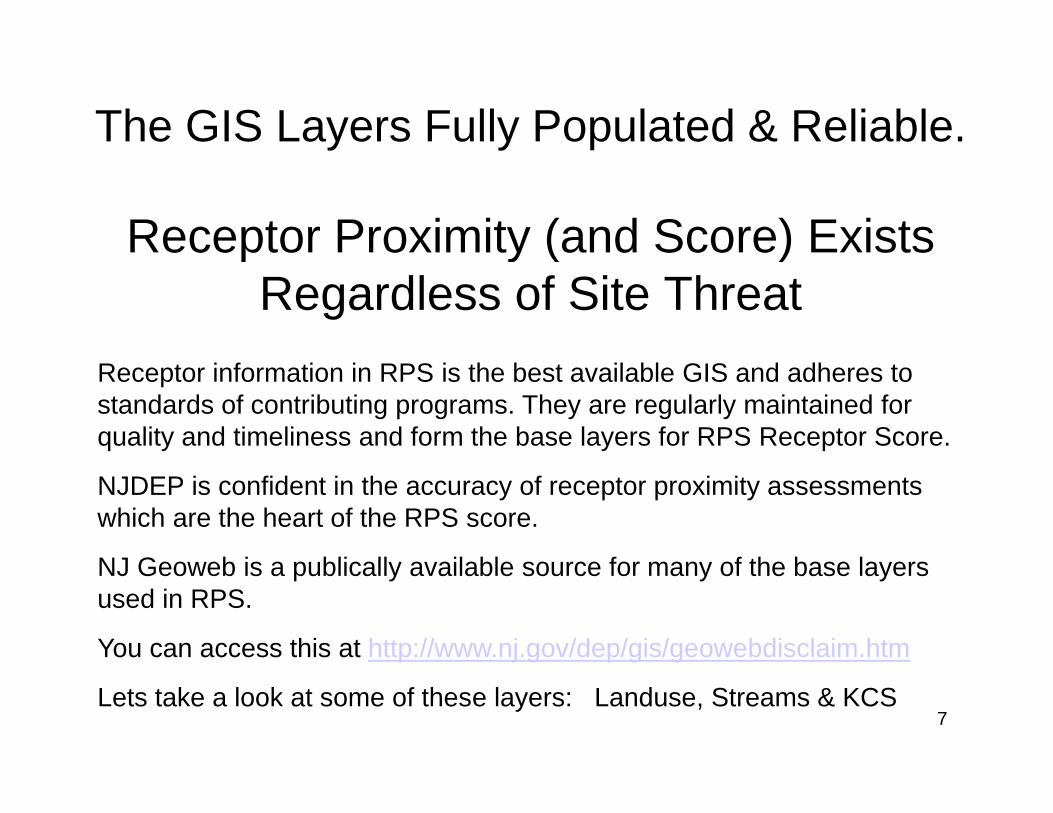
The GIS Layers Fully Populated & Reliable.y y
Receptor Proximity (and Score) Exists ecep o o y (a d Sco e) s sRegardless of Site Threat
Receptor information in RPS is the best available GIS and adheres to standards of contributing programs. They are regularly maintained for quality and timeliness and form the base layers for RPS Receptor Score.
NJDEP is confident in the accuracy of receptor proximity assessments which are the heart of the RPS score.
NJ G b i bli ll il bl f f th b lNJ Geoweb is a publically available source for many of the base layers used in RPS.
You can access this at http://www.nj.gov/dep/gis/geowebdisclaim.htm
7Lets take a look at some of these layers: Landuse, Streams & KCS
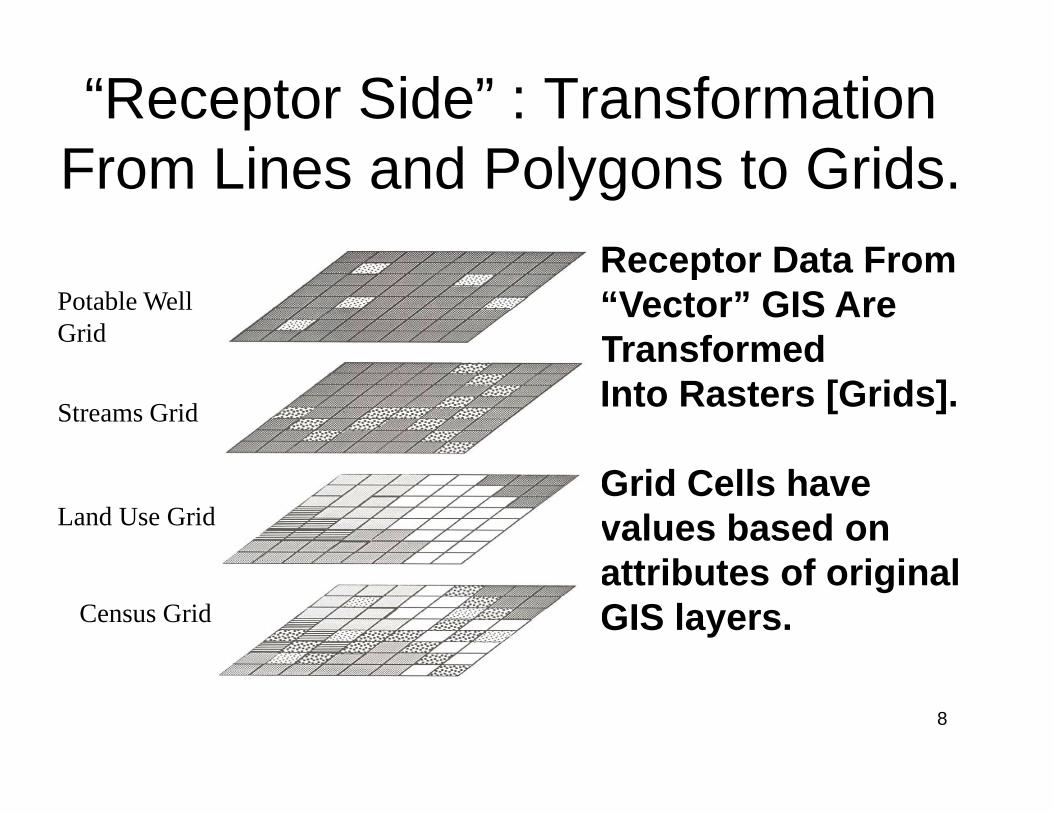
“Receptor Side” : Transformation F Li d P l t G idFrom Lines and Polygons to Grids.
Receptor Data FromReceptor Data From “Vector” GIS Are Transformed
Potable Well Grid Transformed
Into Rasters [Grids]. Streams Grid
Grid Cells have values based on
tt ib t f i i lLand Use Grid
attributes of original GIS layers.Census Grid
8
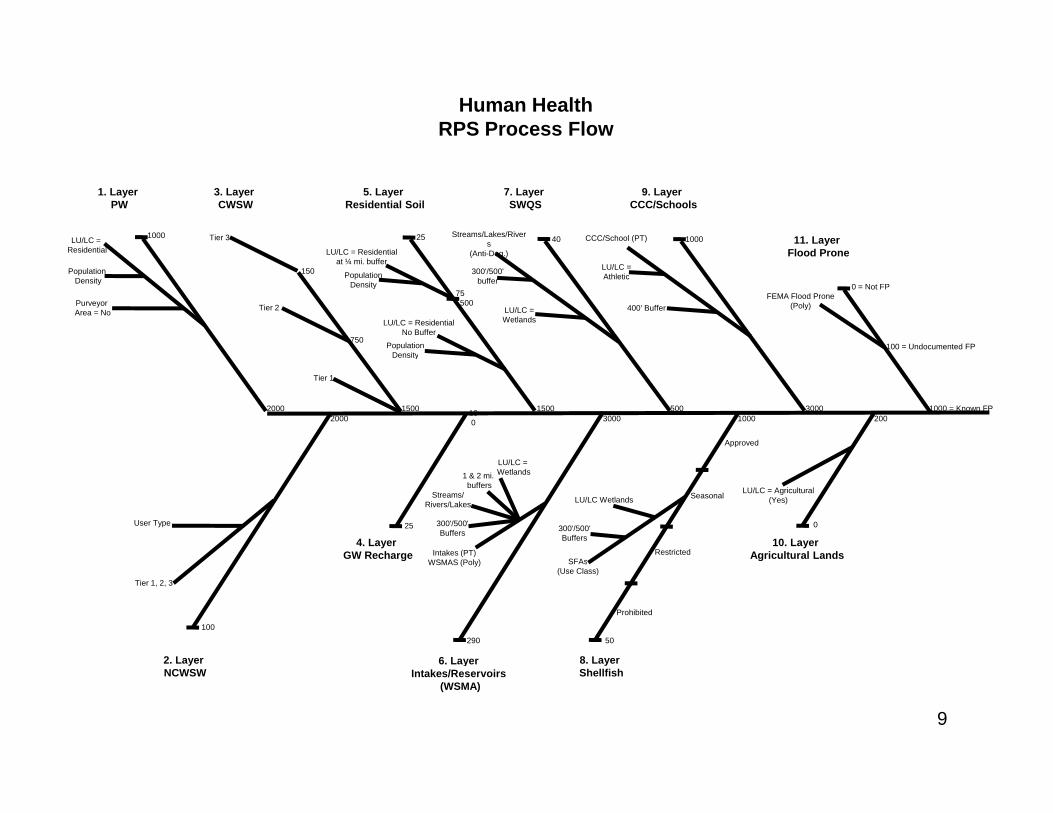
Human HealthRPS Process Flow
1. Layer PW
LU/LC = Residential
25Tier 3
3. Layer CWSW
5. Layer Residential Soil
7. Layer SWQS
40Streams/Lakes/Rivers
(Anti Deg )
9. Layer CCC/Schools
1000CCC/School (PT) 11. Layer Flood Prone
1000LU/LC = Residential
75500
PopulationDensity
LU/LC = Residentialat ¼ mi. buffer
150
750
Tier 2
LU/LC = Residential No Buffer
PopulationDensity
LU/LC = Wetlands
300'/500'buffer
(Anti-Deg.)
400' Buffer
LU/LC =Athletic
Flood Prone
0 = Not FP
100 = Undocumented FP
FEMA Flood Prone(Poly)
Population Density
Purveyor Area = No
2000 1500 1500
Tier 1
Density
500 3000 1000 = Known FP2000
100 3000 1000
Approved
200
4. Layer GW Recharge
10. Layer Agricultural Lands
User Type 25
LU/LC = Wetlands1 & 2 mi.
buffersStreams/
Rivers/Lakes
300'/500'Buffers
Intakes (PT)WSMAS (P l ) SFAs
LU/LC Wetlands
300'/500'Buffers
Seasonal
Restricted
LU/LC = Agricultural(Yes)
0
2. Layer
g
6. Layer 8. Layer
g
Tier 1, 2, 3
100
WSMAS (Poly)
290
SFAs(Use Class)
50
Prohibited
9
2. Layer NCWSW
6. Layer Intakes/Reservoirs
(WSMA)
8. Layer Shellfish
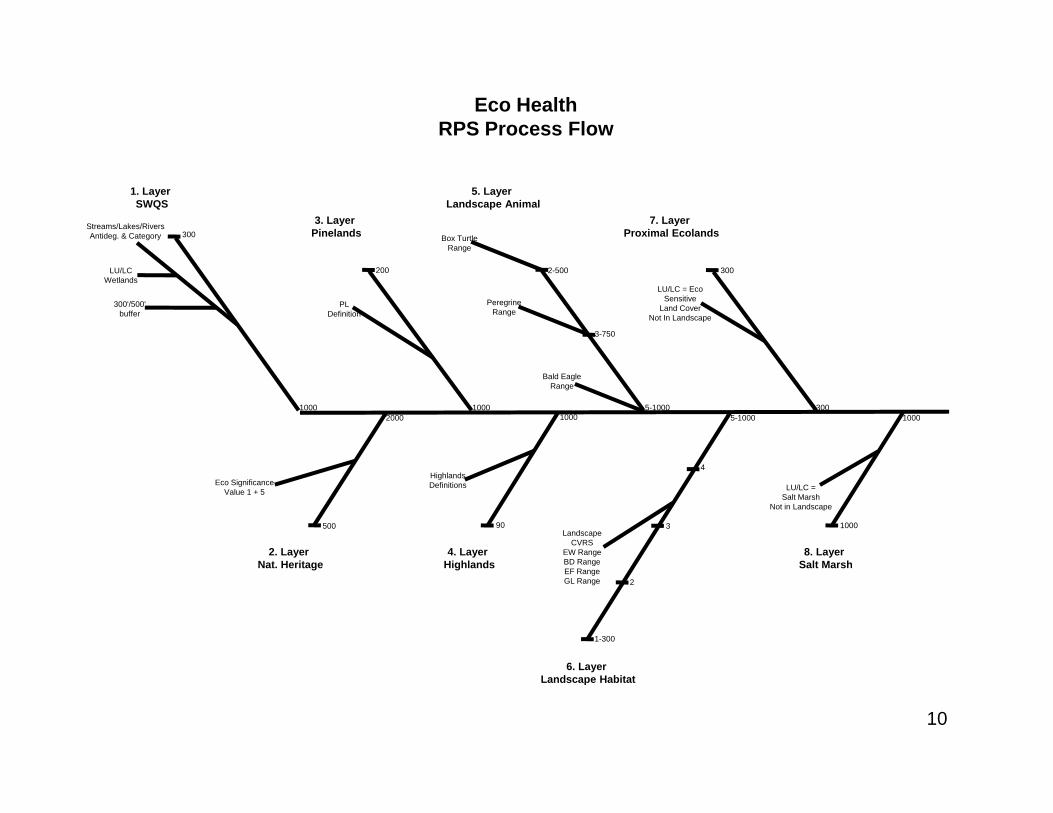
Eco HealthRPS Process Flow
7. Layer Proximal Ecolands
1. Layer SWQS
300Streams/Lakes/RiversAntideg. & Category
3. Layer Pinelands Box Turtle
Range
5. Layer Landscape Animal
300
LU/LC = Eco Sensitive
Land CoverNot In Landscape
LU/LCWetlands
300'/500'buffer
200
PL Definition
3-750
2-500
PeregrineRange
3002000 5-1000 1000
1000 1000 5-1000
Bald EagleRange
1000
2. Layer N H i
500
Eco SignificanceValue 1 + 5
4
3Landscape
CVRSEW RangeBD Range
8. Layer S l M h
LU/LC =Salt Marsh
Not in Landscape
1000
4. Layer Hi hl d
90
HighlandsDefinitions
Nat. Heritage
6 L
2
1-300
BD RangeEF RangeGL Range
Salt MarshHighlands
10
6. Layer Landscape Habitat

SITE SIDE - Think of a “Site Threat” for d “ i ” hgroundwater as a “contaminant extent” that
“reaches” over receptors. The sum of cell values inside that extent equals the Receptor Score.
“Site Side”Threat Radius
11
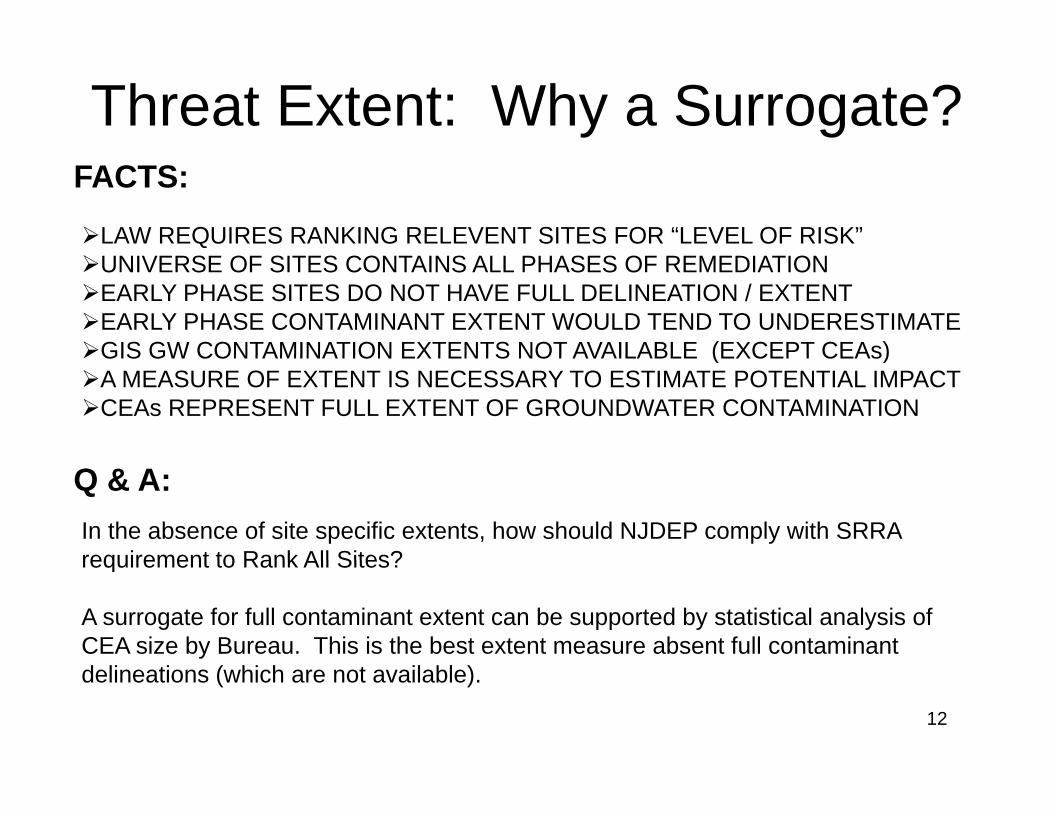
Threat Extent: Why a Surrogate?
LAW REQUIRES RANKING RELEVENT SITES FOR “LEVEL OF RISK”
FACTS:
UNIVERSE OF SITES CONTAINS ALL PHASES OF REMEDIATIONEARLY PHASE SITES DO NOT HAVE FULL DELINEATION / EXTENTEARLY PHASE CONTAMINANT EXTENT WOULD TEND TO UNDERESTIMATEGIS GW CONTAMINATION EXTENTS NOT AVAILABLE (EXCEPT CEAs)GIS GW CONTAMINATION EXTENTS NOT AVAILABLE (EXCEPT CEAs)A MEASURE OF EXTENT IS NECESSARY TO ESTIMATE POTENTIAL IMPACTCEAs REPRESENT FULL EXTENT OF GROUNDWATER CONTAMINATION
Q & A:In the absence of site specific extents, how should NJDEP comply with SRRA requirement to Rank All Sites?requirement to Rank All Sites?
A surrogate for full contaminant extent can be supported by statistical analysis of CEA size by Bureau. This is the best extent measure absent full contaminant
12
delineations (which are not available).
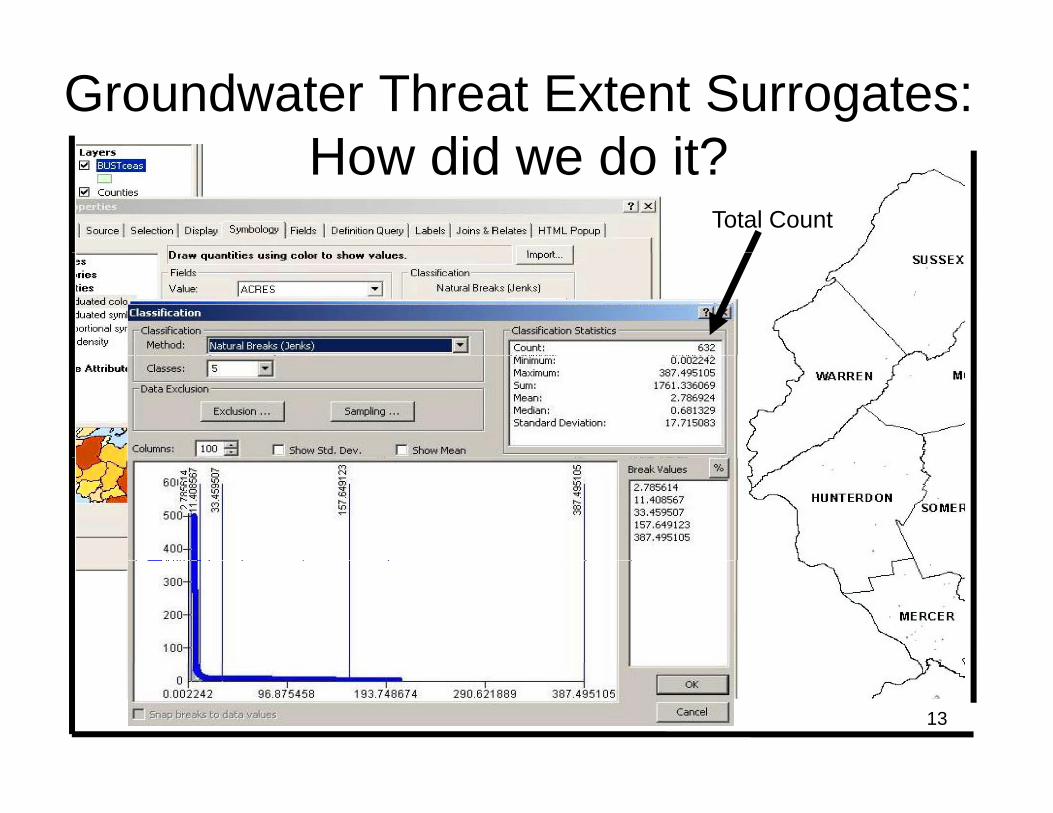
Groundwater Threat Extent Surrogates:How did we do it?
Total Count
How did we do it?
13

THE CONCEPT OF FLOW DIRECTION VARIABILITY SUPPORTS A LARGER THREAT RADIUS THAN AVERAGE.
The NJ Geologic Survey published a Report which maintains that “A statistical analysis of the data showed that a total variation…of the flow direction was as much as 48 degrees”
14From Guidelines for Delineation of Well Head Protection Areas in NJ
See http://www.state.nj.us/dep/njgs/whpaguide.pdf
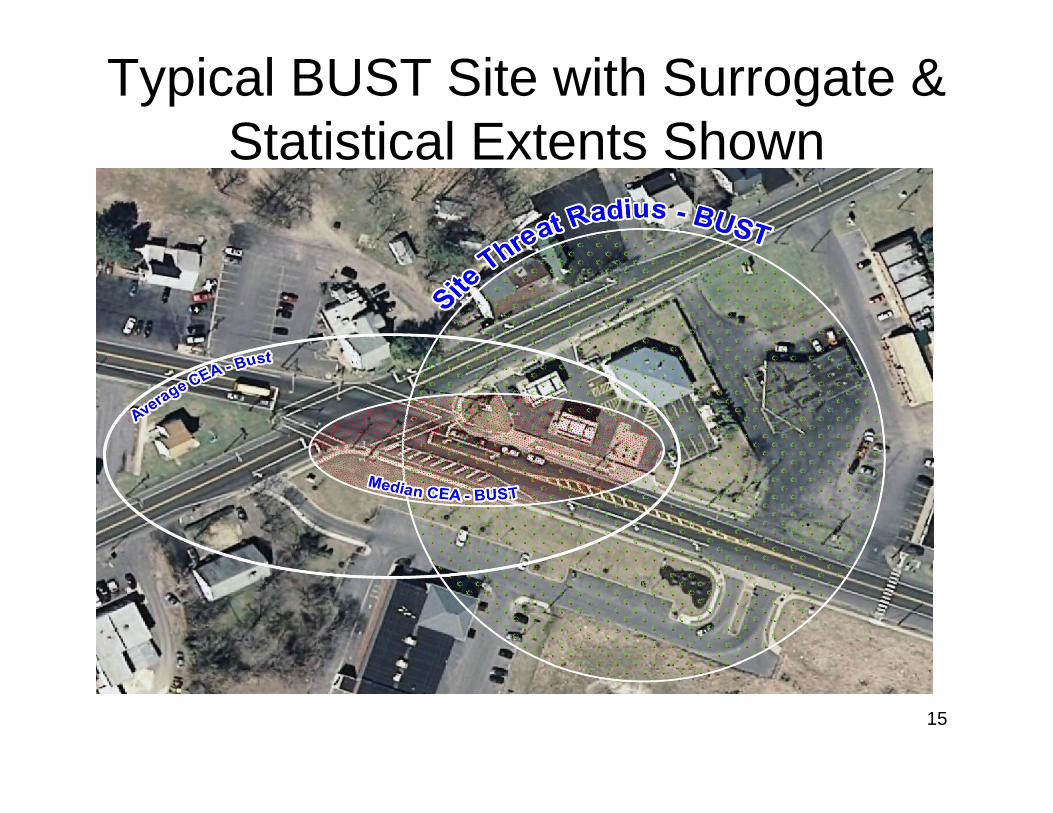
Typical BUST Site with Surrogate & Statistical Extents ShownStatistical Extents Shown
15
Measuring Contamination
IntroducinggExceedance Quotient (EQ)
RPS was previewed with DEP Case Managers.
They asked: “Is it a ppb site or a ppm site?”
EQ was produced to answer this question.
16
“Raw” EQ- The Foundation of H i U i RPSHazsite Use in RPS
Divide sample result by its standard. p y
Example: Analytical result of 800 ppb with a p y ppstandard of 70 ppb. EQ = (800/70) = 11.43.
This EQ value, called the “Raw EQ” is about 11 times greater than its standard.
17
g
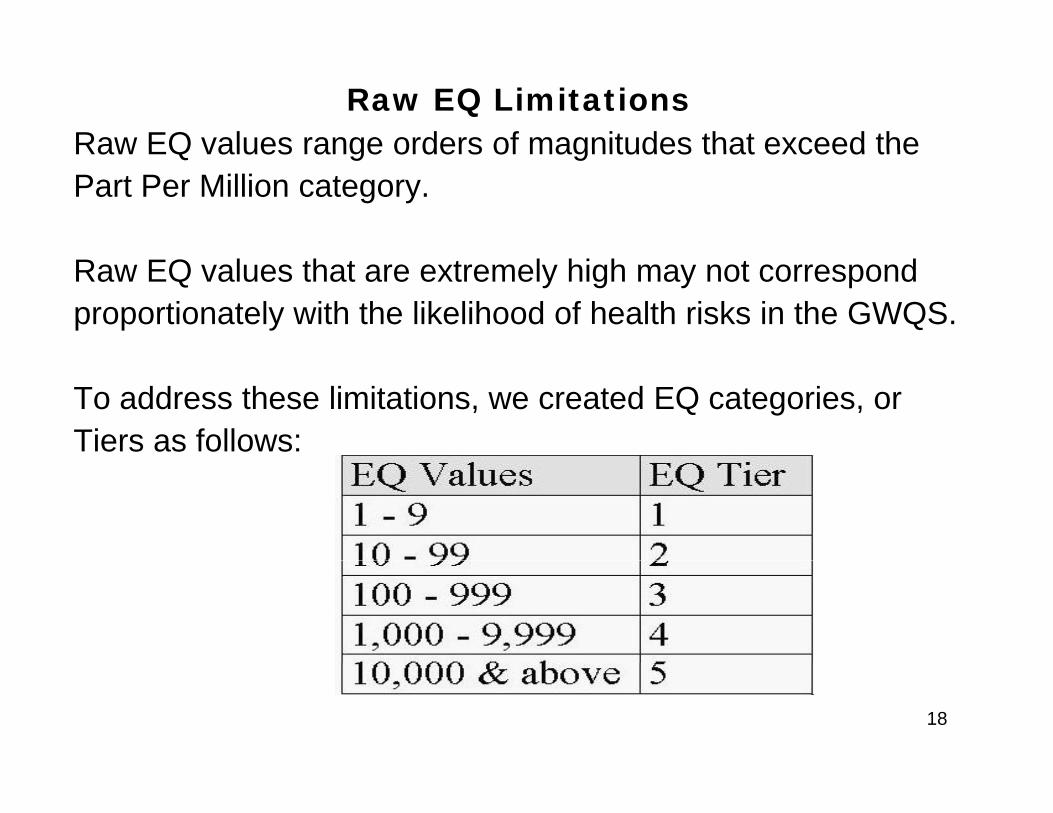
Raw EQ LimitationsRaw EQ values range orders of magnitudes that exceed theRaw EQ values range orders of magnitudes that exceed thePart Per Million category.
Raw EQ values that are extremely high may not correspondproportionately with the likelihood of health risks in the GWQS.
To address these limitations, we created EQ categories, orTiers as follows:
18
EQ Tier and Relative RiskEQ Tier and Relative RiskGWQS consider multiple human health outcomes including Carcinogenic effects, Teratogenic outcomes and Neurological effects.
RPS does not address the question of precise relative risk associated with theRPS does not address the question of precise relative risk associated with the EQ Tiers for different standards. For instance, a Tier 2 does not imply a doubled risk for a particular health outcome described by a GWQS.
RPS uses a defendable and simple principle: As EQ Tier increases, contamination threat also increases in terms of migration and health outcomes.
EQ Tier relies upon the order of magnitude threshold, which NJDEP has previously used in administrative code.
19

EQ Site Recipe. Whi h R i B S NJ?Which Recipe Best Serves NJ?
20

Tier Value = Site Threat Factor
21
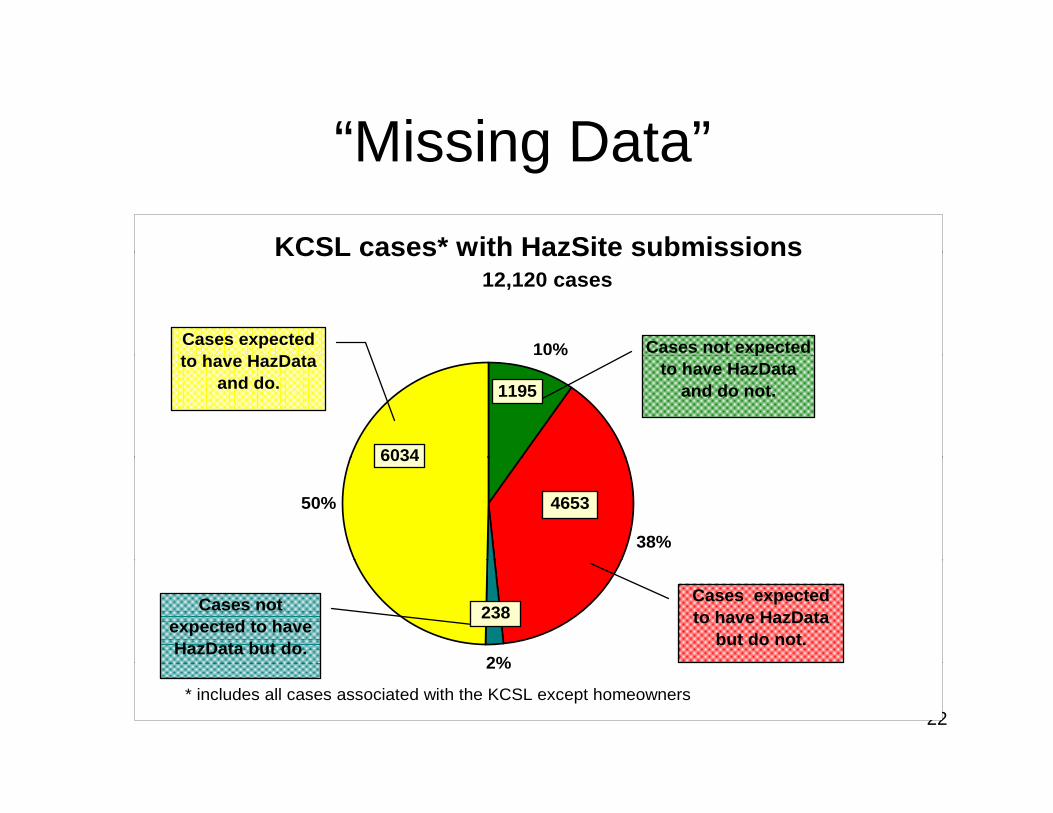
“Missing Data”Missing DataKCSL cases* with HazSite submissionsKCSL cases with HazSite submissions
10%Cases expected t h H D t
Cases not expected
12,120 cases
%to have HazData and do.
pto have HazData
and do not.1195
6034
38%
50%
6034
4653
2%
Cases expected to have HazData
but do not.
Cases not expected to have HazData but do.
238
22
2%
* includes all cases associated with the KCSL except homeowners
Filling in the Hazsite GapsFilling in the Hazsite Gaps
Sites in early phases should not be treatedSites in early phases should not be treated like those in later phases. Currently they are assigned at contamination level = Tier 1.assigned at contamination level Tier 1.
Sites in later phases should have “Hazsite”Sites in later phases should have Hazsite submissions. Where data is not available for these, the assumption is that these sites arethese, the assumption is that these sites are at the 75th percentile of EQ values. This can be changed by inclusion of data into the
23
be changed by inclusion of data into the Hazsite database.

We Seek Accuracy Comments will be taken via emailWe Seek Accuracy via email.
24