royal philips electronicsimages.philips.com/is/content/philipsconsumer/campaigns... · 2015. 10....
TRANSCRIPT


Royal Philips ElectronicsThird Quarter 2008Information booklet
October 13th, 2008

3
Important informationForward-looking statementsThis document and the related oral presentation, including responses to questions following the presentation may contain certain forward-looking statements with respect to the financial condition, results of operations and business of Philips and certain of the plans and objectives of Philips with respect to these items. We caution readers that no forward-looking statement is a guarantee of future performance and that actual results could differ materially from those contained in the forward-looking statements. Examples of forward-looking statements include statements made about our strategy, estimates of sales growth, future EBITA and cost savings and future developments in our organic business as well as the benefit of future acquisitions, and our capital position. By their nature, forward-looking statements involve risk and uncertainty because they relate to future events and circumstances and there are many factors that could cause actual results and developments to differ materially from those expressed or implied by these forward-looking statements. These factors include but are not limited to domestic and global economic and business conditions, the successful implementation of our strategy and our ability to realize the benefits of this strategy, our ability to develop and market new products, changes in legislation, legal claims, changes in exchange and interest rates, changes in tax rates, pension costs, raw materials and employee costs, our ability to identify and complete successful acquisitions and to integrate those acquisitionsinto our business, our ability to successfully exit certain businesses or restructure our operations, the rate of technological changes, political, economic and other developments in countries where Philips operates, industry consolidation and competition. As a result, Philips’ actual future results may differ materially from the plans, goals, and expectations set forth in such forward-looking statements.Additional risks and factors are identified in our Annual Report for the fiscal year ended December 31, 2007 and our Annual Report on Form 20-F filed with the U.S. Securities and Exchange Commission (the “SEC”), which is available on the SEC’s website at www.sec.gov. Readers should consider the disclosures in that Report and any additional disclosures that we have made or may make in documents that we have filed or furnished to the SEC or may file with or furnish to the SEC or other regulatory authorities. Any forward-looking statements made by or on our behalf speak only as of the date they are made. We do not undertake to update forward-looking statements to reflect any changes in expectations with regard thereto or any changes in events, conditions or circumstances on which any such statement is based. Statements regarding market share, including as to Philips’ competitive position, contained in this document are based on outside sources such as specialized research institutes, industry and dealer panels in combination with management estimates. Where information is not yet available to Philips, those statements may also be based on estimates and projections prepared by outside sources or management. Rankings are based on sales unless otherwise stated.
US GAAP basis of presentationThe financial information included in this document is based on US GAAP, unless otherwise indicated. As used in this document, the term EBIT has the same meaning as Income from operations (IFO).
Use of non-GAAP InformationIn presenting and discussing the Philips Group’s financial position, operating results and cash flows, management uses certain non-US GAAP financial measures, like: comparable growth; EBITA; NOC; net debt (cash); and cash flow before financing activities. These non-US GAAP financial measures should not be viewed in isolation as alternatives to the equivalent US GAAP measures. In our Quarterly report, Annual report or form 20-F we’ve included a reconciliation of such non-US GAAP financial measures to the most directly related US GAAP measures.
Use of fair value measurementsIn presenting the Philips Group’s financial position, fair values are used for the measurement of various items in accordance with the applicable accounting standards. These fair values are based on market prices, where available, and are obtained from sources that are deemed to be reliable. Readers are cautioned that these values are subject to changes over time and are only valid at the balance sheet date. When a readily determinable market value does not exist, fair values are estimated using valuation models, which we believe are appropriate for their purpose. They require management to make significant assumptions with respect to future developments which are inherently uncertain and may therefore deviate from actual developments. Critical assumptions used are disclosed in the financial statements. In certain cases, independent valuations are obtained to support management’s determination of fair values. 3

4
Agenda
Philips – who we are
• Results Q3 2008
• Moving to Philips ‘Vision 2010’
• Sector insights – Healthcare, Consumer Lifestyle & Lighting
• Management agenda 2008
4

5
• Founded in 1891; headquarters in Amsterdam, The Netherlands
• One of the largest global diversified industrial companies with sales in 2007of almost € 27 billion
• Multinational workforce of over 128,000employees*
• R&D expenditures € 1.6 billion; owner of 60,000 patents
• Strong position in emerging markets
• Number 43 of the world’s most valuable brands
* As per September 2008 5

6
We are everywhere you go on the planet
• 70% of the top-50 US hospitals have chosen Philips solutions for cardiology
• We light 65% of world’s top airports, 30% of offices and hospitals, and landmarks such as the Eiffel Tower, the Sydney Opera House, the Great Pyramids
• One-in-three cars worldwide uses Philips automotive lighting
• Each day more than a million of our consumer lifestyle products are purchased
6

7
Agenda
• Philips – who we are
Results Q3 2008
• Moving to Philips ‘Vision 2010’
• Sector insights – Healthcare, Consumer Lifestyle & Lighting
• Management agenda 2008
7

8
Highlights
Healthcare and Lighting maintained solid growth in much tougher markets, with sales up 5% and 6% respectively on a comparable basis.
Sales at Consumer Lifestyle declined by € 600 million, of which more than half was attributable to the implementation of the new TV strategy.
Net income amounted to € 357 million, including a € 302 million gain on the sale of the remaining stake in TSMC.
EBITA of € 128 million was negatively impacted by net incidental charges totaling € 285 million, notably a charge for the final settlement of an asbestos liability.
Repurchases under the current share buy-back program reached almost € 3 billion by the end of Q3.
8
9
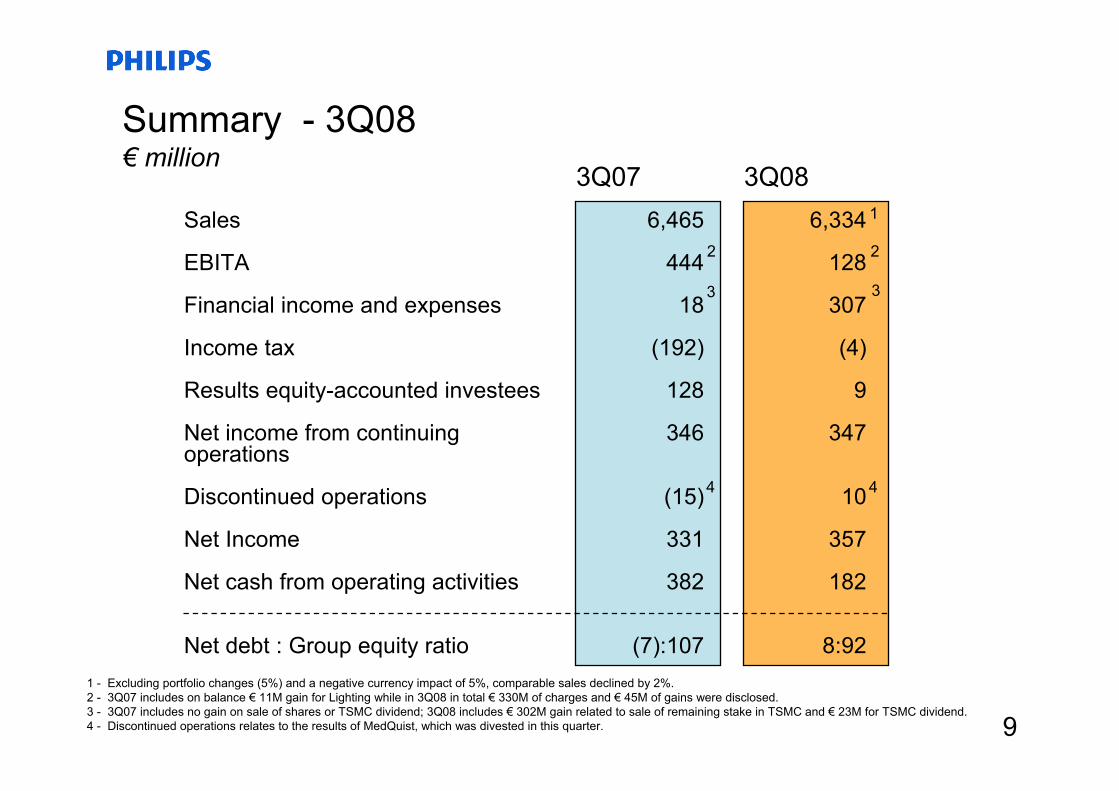
Summary - 3Q08 € million
3Q083Q076,465
444
18
(192)
128
346
(15)
331
382
(7):107
6,334
128
307
(4)
9
347
10
357
182
8:92
Sales
EBITA
Financial income and expenses
Income tax
Results equity-accounted investees
Net income from continuing operations
Discontinued operations
Net Income
Net cash from operating activities
Net debt : Group equity ratio
4
2
1
3 3
9
1 - Excluding portfolio changes (5%) and a negative currency impact of 5%, comparable sales declined by 2%.2 - 3Q07 includes on balance € 11M gain for Lighting while in 3Q08 in total € 330M of charges and € 45M of gains were disclosed.3 - 3Q07 includes no gain on sale of shares or TSMC dividend; 3Q08 includes € 302M gain related to sale of remaining stake in TSMC and € 23M for TSMC dividend.4 - Discontinued operations relates to the results of MedQuist, which was divested in this quarter.
2
4

10
Sales to thirds by sector – 3Q08€ million
Healthcare
Consumer Lifestyle
Lighting
I&EB
Group sales
19
(18)
14
3Q07 3Q08
(2)
6
(8)
5
(2)
% nom
6,465
(31) (27)
% comp
6,334
1,585
3,238
1,496
102
1,806
2,639
1,785
70
GMS (23) (19)44 34
10
11
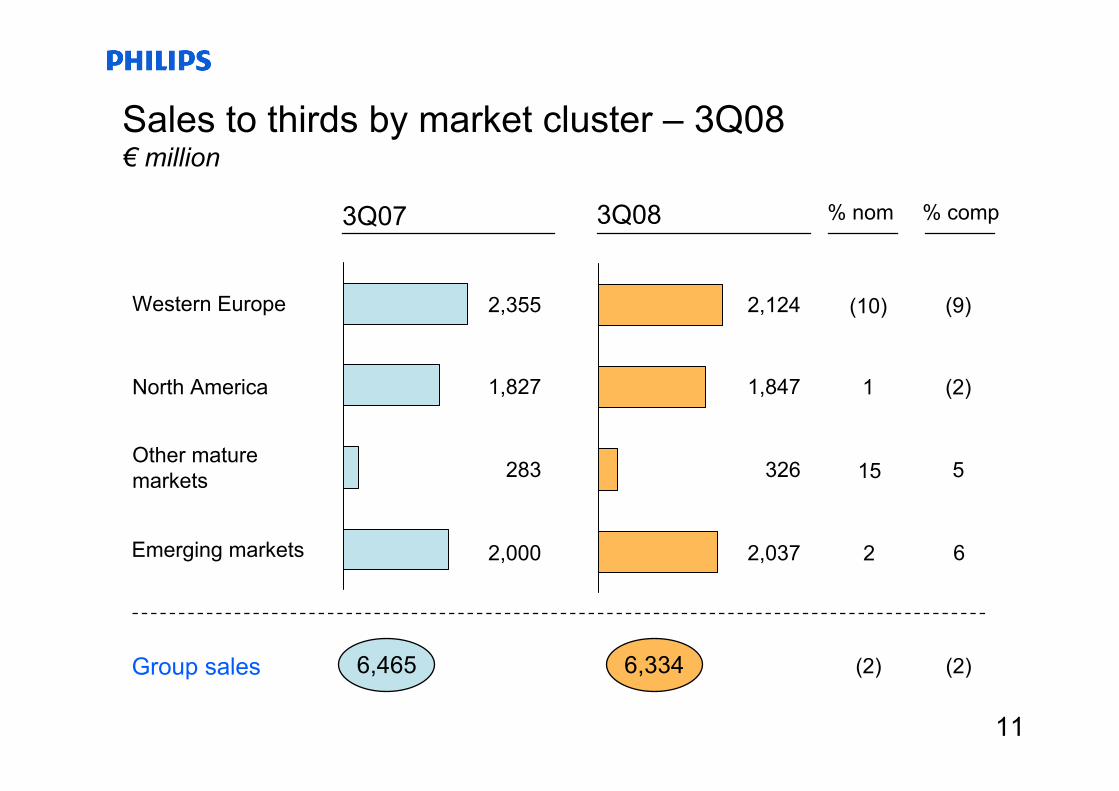
Sales to thirds by market cluster – 3Q08€ million
Western Europe
North America
Other mature markets
Emerging markets
Group sales
15
1
(10)
3Q07 3Q08
(2)
5
(2)
(9)
(2)
% nom
6,465
2 6
% comp
6,334
2,355
1,827
283
2,000
2,124
1,847
326
2,037
11

1212
EBITA by sector – 3Q08 € million
Healthcare
Consumer Lifestyleof which Television
Lighting
Innovation & Emerging Bus.
Group Mgt & Services
Philips Group
as % of sales
3Q083Q07
188
171 (43)
190
(35)
(70)
444
6.9
197
95(73)
196
(46)
(314)
128
2.01 - includes € 17M of acquisition and integration-related charges and € 45M gain related to sale of Philips Speech Recognition Systems2 - includes € 61M of restructuring charges , of which € 40M related to Television and € 21M mostly to the other former CE businesses3 - includes € 11M of restructuring and acquisition-related charges in 3Q08; 3Q07 includes on balance € 11M gain4 - includes € 241M for the final settlement of asbestos-related claims and associated legal fees as announced on September 26, 2008
2
1
3 3
4

13
Cash Flow from continuing operations – 3Q08€ million
3Q07
331
15
209
(59)
(128)
(10)
24
382
(147)
(363)
(128)
Net income
Income/loss discontinued operations
Depreciation / amortization / impairments
Net gain on sale of assets
Income from equity accounted investees
Decrease in WC/other current assets
Other
CF from operations
Gross capital investments
Acquisitions/divestments/other
CF before financing activities
3Q08
357
(10)
267
(403)
(5)
(36)
12
182
(188)
852
846
13

14
Fixed assets expenditures & Depreciation by sector *€ million
3Q083Q07
38
38
56
13
2
147
64
35
87
2
0
188
Healthcare
Consumer Lifestyle
Lighting
I&EB
GMS
Group
Gross CapEx
3Q083Q07
22
39
57
10
14
142
36
41
60
7
13
157
Depreciation
* Excluding software related capital expenditures and depreciation 14

15
• The Philips brand is a long-established household name in key emerging markets
• Driven by enhanced consumer insight, we create products specifically tailored to emerging markets needs/tastes
• We continue to enhance our position through smaller but targeted JV or acquisitions of leading companies in emerging markets, particularly in Healthcare
– Philips-Neusoft JV in China (X-Ray) – VMI in Brazil (X-Ray)– Goldway in China (Patient Monitoring)– Dixtal in Brazil (Patient Monitoring)– Alpha X-Ray in India (X-Ray)
Emerging Markets: reached 30% of sales in 2007 and continue to show strong growth
Emerging
Mature
30%
Growth in emerging markets
0%2%4%6%8%
10%12%14%16%18%
2005 2006 2007 1Q08 2Q08 3Q08 15

16
Emerging MarketsSales in emerging markets Q3 2008
Philips Group
16
Healthcare 15%
ConsumerLifestyle 42%
Lighting 35%
15%
42%
35%
Mature 68%
Emerging 32%

17
Emerging marketsSales growth in emerging markets
Healthcare
Consumer Lifestyle
Lighting
Philips Group
FY 2007Q3 2007
8 %
15 %
14 %
15 %
8 %
7 %
16 %
10 %
Q3 2008
5 %
2 %
17 %
6 %
17

18
-
500
1,000
1,500
2,000
2,500
3,000
2008 2009 2010 2011 2012 2013 2014 2015 2016 2017 2018 2025 2026 2038
Other debt LT debt Undrawn committed facilities
Philips proactively refinanced maturing debt earlier in the year and first maturity is now in 2011€ millions
Note: Other debt consists mainly of local credit facilities that are being rolled forward on a continuing basis
Long Term funding has been restructured: • Maturities up to 2038• Average tenor of outstanding debt is at 9.4 years• No financial covenants
18

19
2,400Total 565Several countries with best rated banks
57AA- bank178AAA bank600Dutch state AAA
1,000Dutch state owned banks AAA1,835Cash in KPENV
Q3 2008in millions of eurosCash position per Q3 2008
AAA bank
AA- bank
Dutch state owned banks
AAA
DutchState AAA
Several countries with best
rated banks
€ 2.4 billion cash with at least 74% of the cash deposited with AAA banks and government
19

20
Acceleration of plans to improve margins
20
• Healthcare will accelerate a number of initiatives to improve margins and to further optimize its operations structure, particularly in Imaging Systems. This is expected to lead to charges of approximately € 50 million in Q4.
• Consumer Lifestyle expects to incur further restructuring charges of around € 60 million in Q4, largely in the Television business. This will bring the total amount to approximately € 190 million for the full year, of which € 130 million relates to Television.
• Lighting expects to take a charge of up to € 100 Million in the fourth quarter to further increase organizational effectiveness and strengthen its position as the industry leader.
In view of macro-economic developments, Philips will accelerate their planned initiatives to further increase organizational effectiveness by streamlining operations and simplifying the structure.

21
Share repurchase program
21
Philips has a strong balance sheet. To date, we have completed € 3.1 billion of our current € 5 billion share repurchase program which we announced in December 2007.
Going forward, in light of both the risks and opportunities presented by the deterioration of the economy and the financial market turbulence, we will slow down the completion of the program.
* To date € 3.1 billion is bought back compared to € 2.9 billion end of Q3 2008.
Status Share Buy Back Actual Actual Actual Actual ActualEnd 2007 Q1 '08 Q2 '08 Q3 '08 Q3 YTD
Shares repurchased (in € M) (975) (1,139) (811) (2,925) Numbers of shares (in M) 37 47 38 123 Average share price 26.10 24.12 21.25 23.83
Shares outstanding 1,065 1,028 984 946

2222
• Equipment order intake grew 4% on a currency-comparable basis, supported largely by growth at Patient Monitoring and Clinical Care Systems. Year-to-date equipment order intake growth now stands at 5%.
• Sales grew 5% comparably year-on-year, with higher sales visible in all businesses, and particularly strong growth at Customer Services and Patient Monitoring. Respironics grew in line with expectation at 14% compared to 3Q07.
• EBITA included a € 45M gain on the sale of Speech Recognition Systems. Adjusted for this gain and € 17M of acquisition and integration-related charges, EBITA was below 3Q07 at € 169M or 9.4% of sales. Higher earnings at Clinical Care Systems and Home Healthcare Solutions were offset by lower earnings at Imaging Systems, which was impacted by lower volume and margin pressures.
• Net operating capital and the number of employees increased, mainly due to acquisitions.
Sales % sales growth comp.EBITAEBITA as % of salesEBITEBIT as % of salesNOCEmployees (FTEs)
Healthcare€ million unless otherwise stated
Emerging
Looking ahead
3Q07
1,5854
18811.91549.7
4,75128,473
2Q08
1,8065
19710.91387.6
8,76935,841
3Q08
• For 2008, acquisition and integration charges are estimated at approximately € 95M, of which around € 25M is expected to impact EBITA in Q4.
• Healthcare will accelerate a number of initiatives to improve margins and to further optimize its operations structure, particularly in Imaging Systems. This is expected to lead to charges of approximately € 50M in Q4.
• Philips will become the first-ever MR equipment maker in Latin America when it commences production at its factory in Brazil in late October ‘08, further strengthening Philips’ industrial footprint in emerging markets
Financial performanceKey figures
Sales per region 3Q08 Emerging markets
1,8003
19510.81387.7
8,38235,087
North America
50%
Latin America
5%
Asia Pacific17%
Europe/ Africa28% 15%
2323
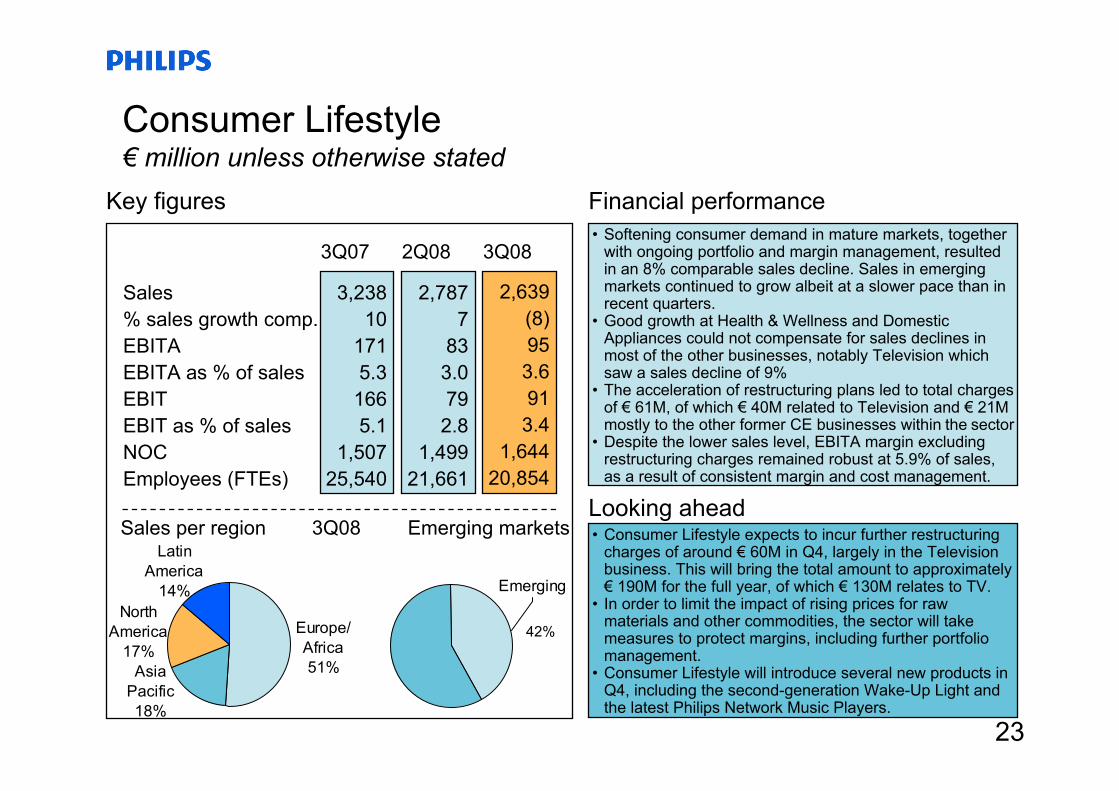
Sales% sales growth comp.EBITAEBITA as % of salesEBITEBIT as % of salesNOCEmployees (FTEs)
Consumer Lifestyle € million unless otherwise stated
Emerging
3,23810
1715.3
1665.1
1,50725,540
2,639(8)953.6913.4
1,64420,854
Key figures Financial performance
3Q07 2Q08 3Q08
2,7877
833.0792.8
1,49921,661
• Softening consumer demand in mature markets, together with ongoing portfolio and margin management, resulted in an 8% comparable sales decline. Sales in emerging markets continued to grow albeit at a slower pace than in recent quarters.
• Good growth at Health & Wellness and Domestic Appliances could not compensate for sales declines in most of the other businesses, notably Television which saw a sales decline of 9%
• The acceleration of restructuring plans led to total charges of € 61M, of which € 40M related to Television and € 21M mostly to the other former CE businesses within the sector
• Despite the lower sales level, EBITA margin excluding restructuring charges remained robust at 5.9% of sales, as a result of consistent margin and cost management.
Looking ahead• Consumer Lifestyle expects to incur further restructuring
charges of around € 60M in Q4, largely in the Television business. This will bring the total amount to approximately € 190M for the full year, of which € 130M relates to TV.
• In order to limit the impact of rising prices for raw materials and other commodities, the sector will take measures to protect margins, including further portfolio management.
• Consumer Lifestyle will introduce several new products in Q4, including the second-generation Wake-Up Light and the latest Philips Network Music Players.
Sales per region 3Q08 Emerging markets
North America
17%
Latin America
14%
Asia Pacific18%
Europe/ Africa51%
42%

2424
Sales% sales growth comp.EBITAEBITA as % of salesEBITEBIT as % of salesNOCEmployees (FTEs)
Lighting € million unless otherwise stated
Emerging
Looking ahead
• Comparable sales grew 6% compared to Q3 2007, driven by continued strong growth in emerging markets (17%) and energy-efficient lighting applications (18%), including very strong growth in LED solutions. This growth was tempered by a continued market slowdown in Western Europe and North America.
• Despite the visible market slowdown, both the European Professional Luminaires business and Genlyte in North America delivered comparable sales growth year-over-year
• Earnings of € 196M, including € 11M of restructuring and acquisition-related charges, were € 6M above the level of Q3 2007, which included net incidental gains of € 11M. The positive impact of the addition of the Genlyte EBITA was offset by margin compression in mature markets as a result of slowing demand, particularly in the construction and automotive segments.
• The increase in net operating capital and employees was primarily a result of the Genlyte acquisition in Q1 2008.
1,4962
19012.717811.9
4,11654,951
1,7856
19611.01689.4
6,34959,875
Financial performanceKey figures
3Q07 2Q08 3Q08
1,7396
20211.617510.1
6,12059,788
• Lighting expects to take a charge of up to € 100M in Q4 to further increase organizational effectiveness and strengthen its position as the industry leader.
• Lighting will also continue to focus on working capital and selectively increase prices further to protect margins.
• In the coming months, Lighting will expand its LED offerings for the professional and consumer segments, launching a range of innovative LED products.
Sales per region 3Q08 Emerging markets
North America
27%
Latin America
6%
Asia Pacific22%
Europe/ Africa45%
35%

2525
Sales% sales growth comp.
EBITA Technologies / Incubators
EBITA Others
EBITA
EBIT
NOCEmployees (FTEs)
Innovation & Emerging Businesses€ million unless otherwise stated
Looking ahead
• EBITA of Innovation & Emerging Businesses was in line with expectation. The earnings decline compared to Q3 2007 was attributable to higher investment in the Incubators and emerging markets, as well as lower IP license income.
1038
(35)
(6)
(41)
(41)
1895,534
10238
(33)
(2)
(35)
(35)
2176,057
70(27)
(40)
(6)
(46)
(46)
1525,509
Financial performanceKey figures
3Q07 2Q08 3Q08
• Investment in Innovation & Emerging Businesses is expected to be lower than the run rate of € 40 million per quarter, consistent with previous guidance.
• Triggered by the ongoing weakness in the semiconductor market, Assembléon expects restructuring activities in Q4, leading to charges estimated at € 18 million
2626
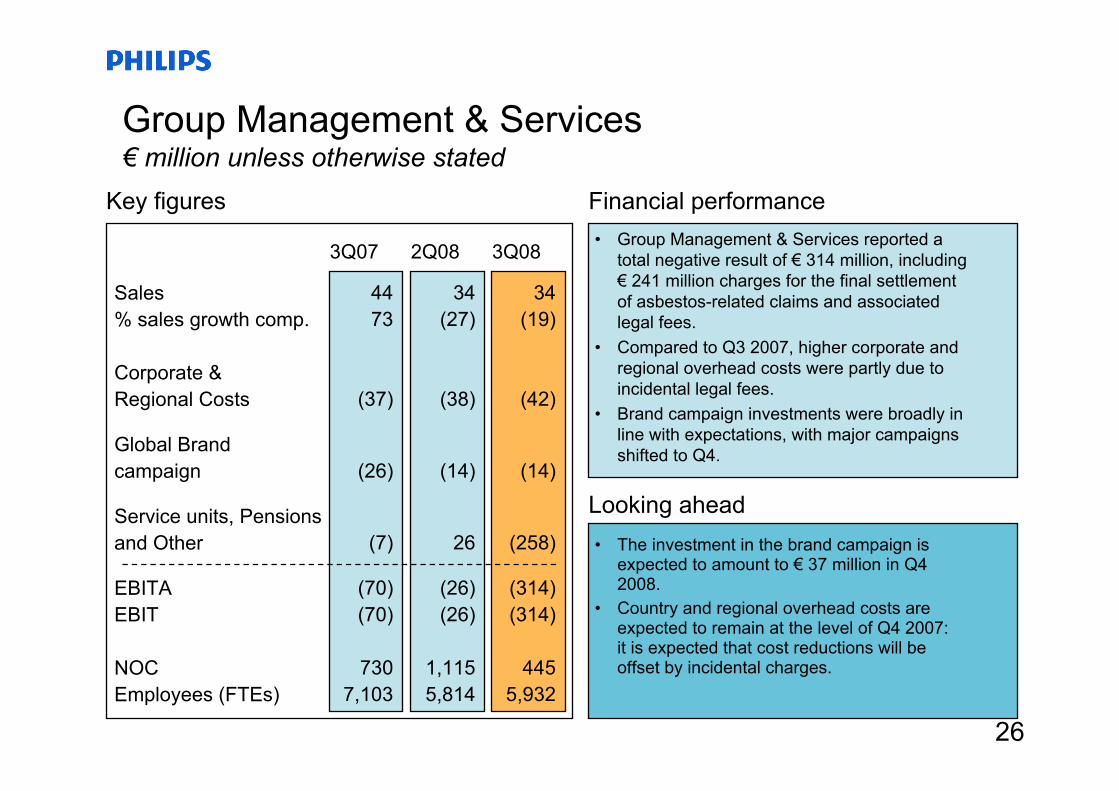
Sales% sales growth comp.
Corporate & Regional Costs
Global Brandcampaign
Service units, Pensionsand Other
EBITAEBIT
NOCEmployees (FTEs)
Group Management & Services€ million unless otherwise stated
Looking ahead
• Group Management & Services reported a total negative result of € 314 million, including € 241 million charges for the final settlement of asbestos-related claims and associated legal fees.
• Compared to Q3 2007, higher corporate and regional overhead costs were partly due to incidental legal fees.
• Brand campaign investments were broadly in line with expectations, with major campaigns shifted to Q4.
4473
(37)
(26)
(7)
(70)(70)
7307,103
34(19)
(42)
(14)
(258)
(314)(314)
4455,932
• The investment in the brand campaign is expected to amount to € 37 million in Q4 2008.
• Country and regional overhead costs are expected to remain at the level of Q4 2007: it is expected that cost reductions will be offset by incidental charges.
Financial performanceKey figures
3Q07 2Q08 3Q08
34(27)
(38)
(14)
26
(26)(26)
1,1155,814

27
Agenda
• Philips – who we are
• Results Q3 2008
Sector insights – Healthcare, Consumer Lifestyle & Lighting
• Moving to Philips ‘Vision 2010’
• Management agenda 2008
27

28
Simplified business structure in 3 core sectors: Healthcare, Lighting and LifestyleLTM September 2008
Net Operating CapitalSales100% = € 27.3B * 100% = € 16.8B *100% = € 2.4B *
EBITA
HealthcareConsumerLifestyle
Lighting
HealthcareConsumerLifestyle
Lighting
28%
34%
38%27%
27%
46%53%
9%
38%
ConsumerLifestyle
LightingHealthcare
* Excluding Central sectors (I&EB; GM&S), including pro forma numbers for Respironics and GenlyteSales of € 0.7B is included for 4Q07 and 1Q08 for Respironics and Genlyte EBITA of € 0.1B is included for 4Q07 and 1Q08 for Respironics and Genlyte 28

29
Recent acquisitions & divestments, coupled with further organic growth, leads to an increasingly well-balanced portfolioSales split
* Excluding Central sectors (I&EB; GM&S)
Healthcare
ConsumerLifestyle
Lighting
ConsumerLifestyle
Lighting
Healthcare
2007 > 2008
29

30
We simplify healthcare by focusing on the people in the care cycle – patients and care providers. Through combining human insights and clinical expertise, we aim to improve patient outcomes while lowering the burden on the healthcare system.
Healthcare
30

31
13%
15%
13%
25%
34%
Healthcare: Sales growth* 6 – 8%; 2010 margin 15 – 17%
15%
4%
53%
28%
Europe
North America
LatinAmerica
AsiaPacific
Imagingsystems
Customer services
HealthcareInformatics
Sales LTM September 2008
4% HomeHealthcare
• Strong market position and market share. • Focused approach to care cycles: Oncology, Cardiology, Women's Health• Ongoing growth, particularly in Monitoring/HI, Service and Clinical Care • Leader in new, growing Home Healthcare: Respironics, Lifeline, Raytel • Strong growth in emerging markets driven by brand and acquisitions• Margin improvement through increased low-cost sourcing, improved
supply chain & industrial footprint and lower IT costs
Including pro forma LTM Sep-2008 sales of € 0.4B for Respironics * Annual average comparable sales growth 31
Clinical care

3232
Key products and services of Philips HealthcareProviding comprehensive support

33
… we apply our technology to improve healthcare quality and reduce cost
The Philips healthcare difference
because meaningful innovations create valuefor patients and care providers.
33
34
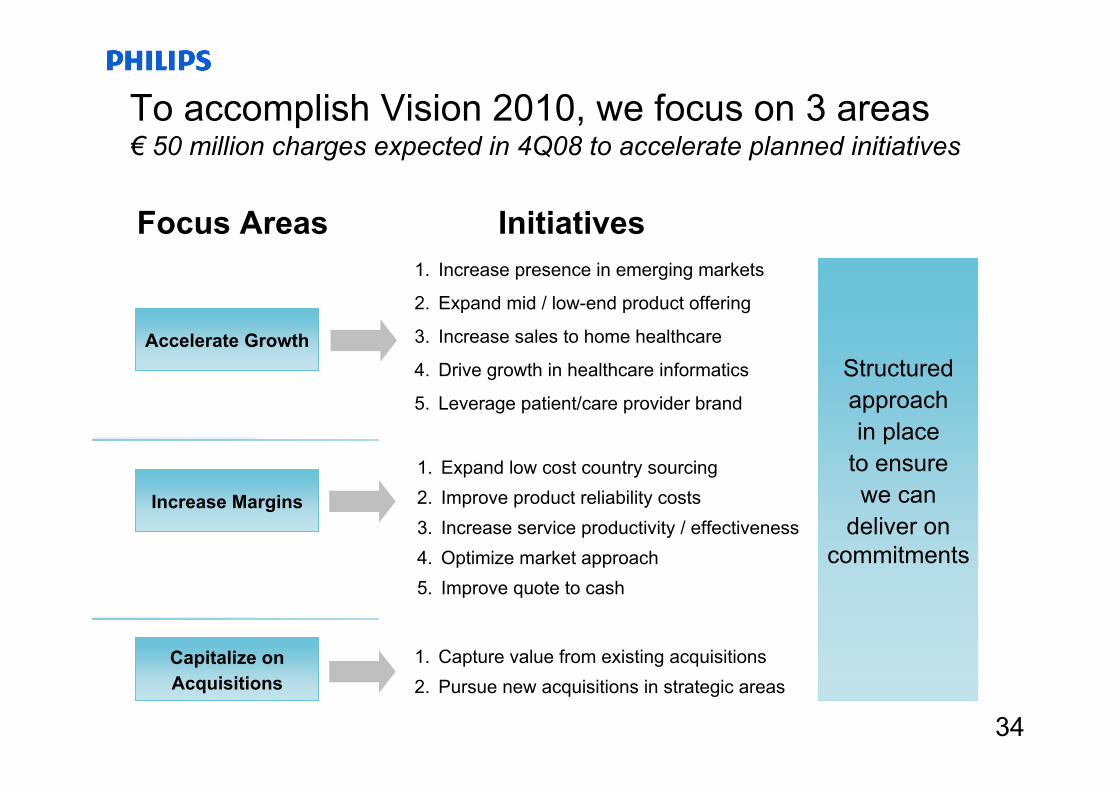
1. Increase presence in emerging markets
2. Expand mid / low-end product offering
3. Increase sales to home healthcare
4. Drive growth in healthcare informatics
5. Leverage patient/care provider brand
To accomplish Vision 2010, we focus on 3 areas€ 50 million charges expected in 4Q08 to accelerate planned initiatives
1. Expand low cost country sourcing2. Improve product reliability costs3. Increase service productivity / effectiveness4. Optimize market approach5. Improve quote to cash
1. Capture value from existing acquisitions2. Pursue new acquisitions in strategic areas
Focus Areas Initiatives
Accelerate Growth
Increase Margins
Capitalize on Acquisitions
34
Structuredapproachin place
to ensurewe can
deliver on commitments

35
• Announced on December 21, 2007; Closing March 10, 2008.• Respironics, with calendar ‘07 revenues of US$ 1.3B, EBITA of US$ 200M and a
CAGR in previous 5-years of 19%, strengthens Philips’ leadership position in Home Healthcare as well as “hospital based” healthcare given Respironics’ strong non-invasive ventilation and respiratory products for hospitals and clinics.
• Acquisition presents Philips with a leading position in the high growth respiratory devices and sleep apnea market and top 5 positions in oxygen therapy and ventilation
• The transaction further strengthens Philips’ strategy of developing solutions across the patient care cycle and expands its presence in home healthcare
• Respironics is an acquisition that positively differentiates us from our key competitorsby market segment, device segment, care cycle focus and disease focus
• Based on Respironics' management plan and our synergies, value would be created after the third year and with a more conservative view that we have used in our decision-making, we will be creating value within year five. The transaction will add to revenue growth and EBITA margin. Expected cost synergies approximately US$ 50M by 2010 run rate, and revenue synergies of approx US$ 180M by 2012 with an EBITA contribution of US$ 50M
• Q3 sales and EBITA in line with plan
Respironics: Leading player in respiratory marketEnterprise value € 3.2 billion
35

36
Guided by our brand promise of “sense and simplicity” and starting from our consumer insights, Philips offers rich, new consumer experiences that meet consumers’ desire for health and wellbeing.
Consumer Lifestyle
36

37
Consumer Lifestyle: Sales growth* around 6%; 2010 margin 8–10%
15%
11%
18%
56%
EuropeNorth
America
LatinAmerica
AsiaPacific
5%9%
14%
48%
10%
4%10%
Shaving &Beauty Health &
WellnessDomestic
Appliances
Television
Peripherals & Accessories
Other
AVM
• Strong marketing & sales capabilities; leveraging Philips brand• Focused on innovative lifestyle solutions for personal well-being• Consumer-driven insights and dedicated business models driving
innovation and differentiation• Expand category management to all businesses and regions • Deal with unsatisfactory EBITA margins in Television• Drive growth by strengthening presence in Emerging Markets
Excluding LTM Sep-2008 sales of € 0.3B for Home Network business that was divested in Q2 2008
* Annual average comparable sales growth
TVN-A
37
Sales LTM September 2008
Television Audio, Video &Multimedia
Shaving & Beauty
DomesticAppliances
Peripherals & Accessories
Health & Wellness

38
Process optimization
Realizing the cost synergies in Consumer lifestyleIn total € 190 million restructuring charges expected for the full year
38
Overall we are well on track to realize the upper end of the € 150 – 200 million savings as announced in September 2007
Organizational Structure
Geographical Footprint
• Functions focused on value delivery for increased efficiency• Rationalization of back office support• Greater relevance with 3rd party suppliers and partners• Improved supply chain effectiveness through shared platforms• Increased marketing effectiveness
• Elimination of duplication in functions at the executive level• Optimization of sales structure through clusters• Delayering our overall organization
• Footprint rationalization – Sales organization– Manufacturing & Supply– R&D
• Increased efficiency in locations and offices

39
As the world’s leader in Lighting, Philips is driving the switch to energy-efficient solutions, as well as shaping the future with exciting new lighting applications and technologies.
Lighting
39

40
Lighting: Sales growth* around 6%; 2010 margin 12 – 14%
21%
6%
28%
45% Europe
North America
LatinAmerica
AsiaPacific
• Global Leader in Lighting• Strong presence across the complete Solid State Lighting value chain• Readily available portfolio of innovative, energy efficient lighting solutions• Technology base and application IP will help to lead the changeover to new
lighting solutions• Profitable growth in fast-growing economies and innovative new market segments • End-user driven Innovation and Brand both drive our profitable growth
Including pro forma LTM Sep-2008 sales of € 0.3B for Genlyte* Annual average comparable sales growth 40
37%
11% 11% 4%
37%Lamps
LumiledsAutomotive & Spec.Light.Applic. Lighting Electronics
Luminaires
Sales LTM September 2008

41
Philips Lighting – balanced portfolio
Business structure * Geographic distribution *
37%
31%
11%
11%Lamps
ConsumerLuminaires
5%
ProfessionalLuminaires
Automotive &Spec. LightingApplications
LEDcomponents
4%
48% Applications 52% Components, Light sources
*) as if Genlyte would be consolidated, LTM Sept-2008**) as if Genlyte would be consolidated, 2007
33% of Philips Lighting sales from emerging markets
Market segmentation **
Homes
22%
19%
15%
13%
13%
8%4% 6%
Offices
OutdoorIndustry
Shops
TransportHospitality
Other
6%
5 key segments cover82% of our market
LightingElectronics
17%
4%
35%
WesternEurope
KeyEmerging
OtherMature 28%
OtherEmerging
NorthAmerica
16%
41

42
Lighting sales breakdown
Total WENA Other regions
Residential * 11% = 7% + 4%
Commercial * 30% = 20% + 10%
New build 41% = 27% + 14%
* Residential: Residential, Housing Commercial: Retail, Office, Industrial, Hospitals, Schools, Hotels, …Other: Road & Tunnel, City Beatification, Sport & Area, AutomotiveSource: Philips Lighting estimates
There is a significant correlation between the ‘Building & Construction industry dynamics’and ‘Residential & Commercial sales for Philips Lighting in Western-Europe & North-America (WENA)’ which accounts for around 27% of Lighting sales.
42
Lighting market - dynamic economic conditions
26%7%19%Other
100%39%61%Total
52%22%30%Commercial
22%11%11%Residential
TotalReplace-ment
NewBuild

43
Lighting market – full spectrum of measures€ 100 million charges expected in 4Q08 to further increase organizational effectiveness
State-of-the-art price management Focus on renovation & Total Cost of Ownership
Adequate strategies to deal with the Lighting industry dynamics
• Mix management• Cost productivity and efficiency• Purchasing effectiveness• Supply chain optimization• Channel diversification• Acquisition pipeline
Rundbau Gerling Konzern, Cologne, Germany• Renovation, 40 year old building.• TL-5 luminaires with omnisense;
– Presence detection– Daylight regulation
• Energy saving of up to 70%
Effective execution of Philips Lighting initiatives
e.g. Lumileds e.g. Lamps Prof Lum Cons Lum
ApplicationsLight SourcesComponents
Trade PricingTransaction Pricing Project Pricing
• Active price management in all parts of our business• Active focus on customer profitability
• Highly energy efficient solutions • New Solid State Lighting applications• Symbiosis between art and science,
function and fashion
Best practices and new ways of working Faster and better innovation
43

44
# 1
Philips Lighting – global leadership
Lamps
Professional Luminaires
Lighting Electronics
Solid State Lighting
AutomotiveLighting
Special Lighting
Western Europe
Eastern Europe
North America
Latin America
Japan Asia/ Pacific
Total# 2 or 3Philips position < # 3
ConsumerLuminaires
No data
44

45
Genlyte: Leading N-A Luminaires manufacturerEnterprise value € 1.8 billion
• Closed on January 22, 2008.
• Acquisition is consistent with Philips’ strategy to strengthen its leadership position in Lighting. Combination created the #1 Lighting company in North America and established Philips as the largest Luminaires company globally.
• Luminaires & Controls are a spearhead in developing “green” lighting markets, including Solid State Lighting (SSL). Genlyte will be a cornerstone of growth in SSL.
• Post merger integration is well on track to deliver the expected synergies.
• Sales growth in Q3 was 2%, despite softer market conditions.
45

46
Agenda
• Philips – who we are
• Results Q3 2008
• Sector insights – Healthcare, Consumer Lifestyle & Lighting
Moving to Philips ‘Vision 2010’
• Management agenda 2008
46

47
Having delivered on our 3 year target in 2007, we have announced a new ‘Vision 2010’ ambitionAnnounced April 2008
Doubling of 2010 EBITA per share compared to 2007 through:
• Improvement of Group EBITA from 7.7% in 2007 to 10-11% in 2010
• Driving comparable growth at a minimum of 6% average per year for the period 2008-2010
Achieve a return on invested capital for 2010 at the level of 12% - 13%
47
Healthcare
Lighting
Consumer Lifestyle
Reduce group overhead cost as % of sales
13.2%
11.9%
6.4%
15 – 17%
12 – 14%
8 – 10%
20102007EBITA margin

48
Vision 2010 scorecard
IMPROVEMENT OF EBITA % TO 10 – 11%
ANNUAL AVG. GROWTH OF 6% FOR '08-'10
SHARE BUY-BACK OF € 5B
M&A
ROIC of 12 – 13% by 2010
48
Doubling of EBITA per
share by 2010 compared to
2007
- Acceleration of plans to improve margins
- Impacted by macro economic developments
- € 3.1B* worth of shares bought back- Significantly slowdown of completion
- Post merger integration on track- Further acquisitions
* per October 10, 2008

49
Well-positioned to leverage a number of key global trends centered around health & well-being
Global trends
Climate Change
Aging population
Globalization, urbanization and rise of emerging markets
Consumer empowerment
Sustainable development
Better healthcare for all at lower cost
Home care, independent living
Personalized experiences and atmospheres
Personal well-being
Energy efficiency
Philips opportunities Philips focus
Brand“sense and simplicity”
InnovationOpen innovation
49

50
0
1000
2000
3000
4000
5000
6000
7000
1970 1980 1990 2000 2005
CanadaFranceItalyJapanUnited KingdomUnited StatesChina
Healthcare trends – aging population, cost pressures, health-at-home, emerging markets growth
Source: UN, 2006 Revision of World Population Prospects and World Health Organization website
• Global population is increasing and continues to age
• People are living longer with chronic diseases
• Healthcare costs – especially in mature economies – are becoming unsustainable
• Healthcare at home is an increasingly viable and cost effective complement to in-hospital care
• People are becoming increasingly aware of the impact of lifestyle on health
World population by age group, 1950-2050
Healthcare expenditure per capita, US $
People over 60
50

5151
ActiveCrystals
Arcitec
PortableMedia devices
Flexcare
Lifestyle trends – healthy living/healthy home, more personal care, technology-made-easy, design
• Core well-being consumer shows attractive demographics and is likely to be a highly profitable customer
• The Lifestyle targeted market is 3x the size of the CE market + DAP market
• Increased demand for personal care product categories and technology-advanced, easy-to-use customer solutions
• Design has become an important competitive differentiator
• Consumers are becoming increasingly ‘eco-aware’of issues facing the planet

52
0
20
40
60
80
100
120
1995 '96 '97 '98 '99 '00 '01 '02 '03 '04 '05 '06 '07 2008
Oil at a historical high, yearly average price (US dollar) *
Huge potential for energy saving
Area of lighting Energy saving
CO2 savings per lamp per year
Road lightingShop LightingOffice & Industrial LightingHome LightingLEDs
57%80%61%80%80%
132 kg CO2
140 kg CO2
93 kg CO2
41 kg CO2
41 kg CO2
• Energy costs are rising across the globe, driven by high oil prices
• Increased awareness/legislation around climate change is driving a reduction in CO2
• Atmosphere-creating and safety-enhancing lighting solutions increasingly become part of individual and community well-being
• Demand for (energy-efficient) lighting in emerging markets continues to grow
• Future LED solutions: application IP and luminaries will be key
Lighting trends – rising energy costs, increasing awareness of climate change, product innovation
* Source: OPEC Reference Basket (ORB), www.opec.org 52
US dollar
53
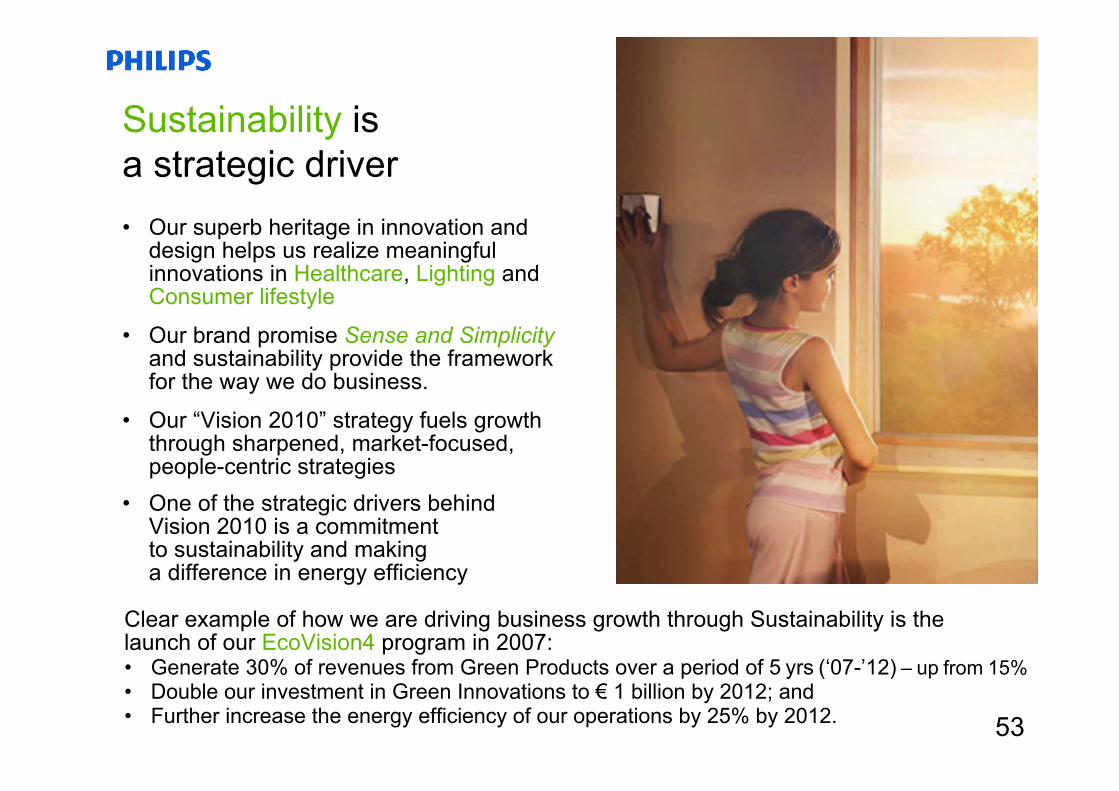
Sustainability is a strategic driver• Our superb heritage in innovation and
design helps us realize meaningful innovations in Healthcare, Lighting and Consumer lifestyle
• Our brand promise Sense and Simplicityand sustainability provide the framework for the way we do business.
• Our “Vision 2010” strategy fuels growth through sharpened, market-focused, people-centric strategies
• One of the strategic drivers behind Vision 2010 is a commitment to sustainability and making a difference in energy efficiency
Clear example of how we are driving business growth through Sustainability is the launch of our EcoVision4 program in 2007:• Generate 30% of revenues from Green Products over a period of 5 yrs (‘07-’12) – up from 15%• Double our investment in Green Innovations to € 1 billion by 2012; and• Further increase the energy efficiency of our operations by 25% by 2012. 53

54
Agenda
• Philips – who we are
• Results Q3 2008
• Sector insights – Healthcare, Consumer Lifestyle & Lighting
• Moving to Philips ‘Vision 2010’
Management agenda 2008
54

55
In 2008, our focus will be on executionThe Management Agenda for this year
• Integrate and leverage recent acquisitions, delivering anticipated return on investment
• Take decisive steps to structurally deal with unsatisfactory EBITA margins in Television business
• Improve productivity as a driver for margin expansion
• Step up resource investment in Developing Markets to accelerate growth in excess of 2x GDP
• Increase innovation focus in support of Philips growth ambition
• Continue to drive a culture of superior customer experience
• Bring employee engagement to high performance benchmark
55

56
Summary
CreatingShareholder
Value
• Simplified portfolio of world-class businesses built around a strong, global brand
• Well-positioned to leverage a number of important global trends to drive future growth and profitability
• Superior user-insight driving application of our technology in the simplest way possible resulting in smartly-designed, innovate, easy-to use products and applications
• Focus on integration and leverage of recent acquisitions
• Continued investment in growth in emerging markets
• Improved predictability of results
• Ambition to more than double EBITA per share by 2010
56


58
Appendix
58

59
SalesComparable sales growth %
EBITAEBITA as % of sales
Net income
Cash flow from operations
Dividend per share
Dividend yield
2006 2007
26,6826.4%
1,3865.2%
5,383
330
0.60
2.0%
26,7934.9%
2,0657.7%
4,168
1,519
0.70
2.3%
1 – MedQuist has been restated to Discontinued Operations in all years2 – Dividend per share based on its year’s profit; payout in next year; in €.3 – Dividend yield is calculated as dividend based on prior-year profit divided by average share price of prior year
3
Solid progress on key financials€ million
2005
25,4454.5%
1,6526.5%
2,868
1,147
0.44
1.9%
Includingproduct reliability charges of € 256 million
IncludingPension funding and TSMC tax payment totaling € 1 billion
1
2
59

60
–
–
–
1,831
670
–
–
2,501
Total
950
1,106
1,604
6,684
3,155
154
6,960
20,613
2007
–
–
–
4,083
1,547
–
(99)
5,531
2008
Cash generated from sale of major participations€ million
Sale securities
Atos Origin
NAVTEQ
TSMC
LG Displays
FEI
Semiconductors (NXP)
Total
20052004
883
552
672
–
–
–
–
2,107
67
554
932
770
938
–
–
3,261
2006
–
–
–
–
–
154
7,059
7,213
60

61
Cash utilization€ million
Acquisition StentorAcquisition Witt BiomedicalAcquisition LifelineAcquisition Intermagnetics Acquisition VISICUAcquisition RespironicsAcquisition LumiledsAcquisition PLIAcquisition Color KineticsAcquisition GenlyteAcquisition Avent
Extra funding pensions (UK&US)Share repurchase programDividend
€ 5.0 billion buy-back program
Total
2005/2007194110583993
––
788561515
–689683
5,1871,686
–
11,989
Announced /being implemented
––––
1983,196
–––
1,805–––
6985,000
10,897
Total
9,63242.1 %
6833.0 %
12,57154.9 %
22,886* Still to be completed** Excluding acquisitions of Bodine, Power Sentry, TIR, Health Watch, DLO, LTI, Ximis,
Raytel, Emergin, Tomcat, Goldway and Dixtal because of relative size.
*
**C
onsu
mer
Life
styl
e, L
ight
ing
&H
ealth
care
61

6262
1,2821,201
1,107 1,098 1,063 1,065 1,028984 946
848
1,087
4Q04 4Q05 4Q06 1Q07 2Q07 3Q07 4Q07 1Q08 2Q08 3Q08 **
Basic shares outstandingMillion
(34)%
* After finalizing the € 5B repurchase program; calculation includes avg. purchase price of € 21/share for remaining buy-back** Going forward, in light of both the risks and opportunities presented by the deterioration of the economy and the financial
market turbulence, we will slow down the completion of the program.
Estimate on completion of
€ 5B buy-back *

6363
Peer group adapted to Philips’ transformation
Previous peer group (until 2006)
ElectroluxEmerson ElectricGeneral ElectricHitachiPanasonicSiemens
EricssonGilletteIBMIntelLG ElectronicsLucentMarconiMotorolaNEC
Maintained membersElectroluxEmerson ElectricGeneral ElectricHitachiPanasonicSiemens
New membersHoneywellJohnson & JohnsonSchneider ElectricToshiba3M
Existing peer group (2007-)
NokiaSamsungSanyo ElectricSharpSonyTexas InstrumentsTyco InternationalWhirlpool
Maintained members

64
Major investments
Quoted
LG Displays
TPV
Non-quoted
NXP
Total
number shares rounded in millions
47
263
18
% ownership
13.2
13.4
19.9
Market value
644
48
Book value
555
1,247
1
October 9th, 2008in € million
1 Economic ownership 64

65
Major investmentsDevelopment of major investments
% Holding TSMC
0%2%4%6%8%
10%12%14%16%18%20%
Q1 Q2 Q3 Q4 Q1 Q2 Q3 Q4 Q1 Q2 Q3 Q4 Q1 Q2 Q3
2005 2006 2007 2008
% Holding LG Displays
0%5%
10%15%20%25%30%35%40%45%50%
Q1 Q2 Q3 Q4 Q1 Q2 Q3 Q4 Q1 Q2 Q3 Q4 Q1 Q2 Q3
2005 2006 2007 2008
65

66
Overview€ million
66
Sales and Comparable growth by sector 2006 2007 per quarter 2007 2008 per quarterJan.-Dec. 1st 2nd 3rd 4th Jan.-Dec. 1st 2nd 3rd
Healthcare 6,562 1,431 1,625 1,585 1,997 6,638 1,474 1,800 1,8064% 4% 4% 3% 4% 5% 3% 5%
Consumer Lifestyle * 13,108 2,816 2,786 3,238 4,490 13,330 2,662 2,787 2,639-2% -6% 10% 11% 4% 0% 7% -8%
Lighting 5,466 1,474 1,464 1,496 1,659 6,093 1,711 1,739 1,7858% 6% 2% 8% 6% 3% 6% 6%
I&EB 1,379 160 110 102 163 535 79 103 70
GMS 167 49 48 44 56 197 39 34 34
Philips Group 26,682 5,930 6,033 6,465 8,365 26,793 5,965 6,463 6,3343% 0% 7% 8% 5% 1% 6% -2%
* of which Television business 6,559 1,293 1,258 1,511 2,208 6,270 1,227 1,359 1,195
EBITA and EBITA% by sector 2006 2007 per quarter 2007 2008 per quarterJan.-Dec. 1st 2nd 3rd 4th Jan.-Dec. 1st 2nd 3rd
Healthcare 860 119 218 188 348 873 121 195 19713% 8% 13% 12% 17% 13% 8% 11% 11%
Consumer Lifestyle * 692 141 106 171 430 848 77 83 955% 5% 4% 5% 10% 6% 3% 3% 4%
Lighting 608 186 161 190 185 722 200 202 19611% 13% 11% 13% 11% 12% 12% 12% 11%
I&EB -75 (31) (36) (35) 21 (81) (68) (41) (46)
GMS -699 (45) (63) (70) (119) (297) (65) (26) (314)
Philips Group 1,386 370 386 444 865 2,065 265 413 1285% 6% 6% 7% 10% 8% 4% 6% 2%
* of which Television business 155 (51) (69) (43) 95 (68) (95) (112) (73)2% -4% -5% -3% 4% -1% -8% -8% -6%
