royal bank of canada 2014 & fourth quarter results - rbc · royal bank of canada 2014 &...
TRANSCRIPT

Royal Bank of Canada2014 & Fourth Quarter ResultsDecember 3, 2014
Financial information is presented on a consolidated basis in Canadian dollars and is based on International Financial Reporting Standards (IFRS), unless otherwise noted. Our 2014 Annual Report and Q4/2014 Supplementary Financial Information are available on our website at rbc.com/investorrelations.

2014 and Fourth Quarter Results 1
Caution regarding forward-looking statements
From time to time, we make written or oral forward-looking statements within the meaning of certain securities laws, including the “safe harbour”provisions of the United States Private Securities Litigation Reform Act of 1995 and any applicable Canadian securities legislation. We may makeforward-looking statements in this presentation and in the accompanying management’s comments and responses to questions during the December 3, 2014 analyst conference call (Q4 presentation), in filings with Canadian regulators or the United States (U.S.) Securities and Exchange Commission (SEC), in reports to shareholders and in other communications. Forward-looking statements in this presentation include, but are not limited to, statements relating to our financial performance objectives, vision and strategic goals. The forward-looking information contained in this Q4 presentation is presented for the purpose of assisting the holders of our securities and financial analysts in understanding our financial position and results of operations as at and for the periods ended on the dates presented, and our financial performance objectives, vision and strategic goals, and may not be appropriate for other purposes. Forward-looking statements are typically identified by words such as “believe”, “expect”, “foresee”, “forecast”, “anticipate”, “intend”, “estimate”, “goal”, “plan” and “project” and similar expressions of future or conditional verbs such as “will”, “may”, “should”, “could” or “would”.
By their very nature, forward-looking statements require us to make assumptions and are subject to inherent risks and uncertainties, which give rise to the possibility that our predictions, forecasts, projections, expectations or conclusions will not prove to be accurate, that our assumptions may not be correct and that our financial performance objectives, vision and strategic goals will not be achieved. We caution readers not to place undue reliance on these statements as a number of risk factors could cause our actual results to differ materially from the expectations expressed in such forward-looking statements. These factors – many of which are beyond our control and the effects of which can be difficult to predict – include: credit, market, liquidity and funding, insurance, regulatory compliance, operational, strategic, reputation, competitive and systematic risks and other risks discussed in the Risk management and Overview of other risks sections of our 2014 Annual Report; anti-money laundering; growth in wholesale credit; the high levels ofCanadian household debt; cybersecurity; the business and economic conditions in Canada, the U.S. and certain other countries in which we operate; the effects of changes in government fiscal, monetary and other policies; tax risk and transparency; our ability to attract and retain employees; the accuracy and completeness of information concerning our clients and counterparties; the development and integration of our distribution networks; model, information technology, information management, social media, environmental and third party and outsourcing risk.
We caution that the foregoing list of risk factors is not exhaustive and other factors could also adversely affect our results. When relying on our forward-looking statements to make decisions with respect to us, investors and others should carefully consider the foregoing factors and other uncertainties and potential events. Material economic assumptions underlying the forward looking-statements contained in this Q4 presentation are set out in the Overview and outlook section and for each business segment under the heading Outlook and priorities in our 2014 Annual Report. Except as required by law, we do not undertake to update any forward-looking statement, whether written or oral, that may be made from time to time by us or on our behalf.
Additional information about these and other factors can be found in the Risk management and the Overview of other risks sections in our 2014 Annual Report.
Information contained in or otherwise accessible through the websites mentioned does not form part of this Q4 presentation. All references in this Q4 presentation to websites are inactive textual references and are for your information only.

OverviewDave McKay President and Chief Executive Officer

2014 and Fourth Quarter Results 3
Consolidated Results Reported Adjusted(1)
($ millions, except EPS and ROE) 2014 2013 YoY 2014 2013 YoY
Net income $9,004 $8,342 8% $9,136 $8,342 10%
Diluted earnings per share (EPS) $6.00 $5.49 9% $6.09 $5.49 11%
Return on Equity (ROE)(2) 19.0% 19.7% (70) bps 19.3% 19.7% (40) bps
Common Equity Tier (CET) 1 Ratio 9.9% 9.6% 30 bps
Record earnings of over $9.0 billion in 2014
Record performance across all business segments
Strong ROE even with an increase in capital levels
(1) Adjusted measures exclude specified items and are non-GAAP. For additional information and reconciliation, see slides 33 and 34.(2) ROE may not have a standardized meaning under generally accepted accounting principles (GAAP) and may not be comparable to similar measures disclosed by other financial
institutions. For additional information, see slide 34.
Delivered record earnings while strengthening our capital position
2014 and Fourth Quarter Results 4
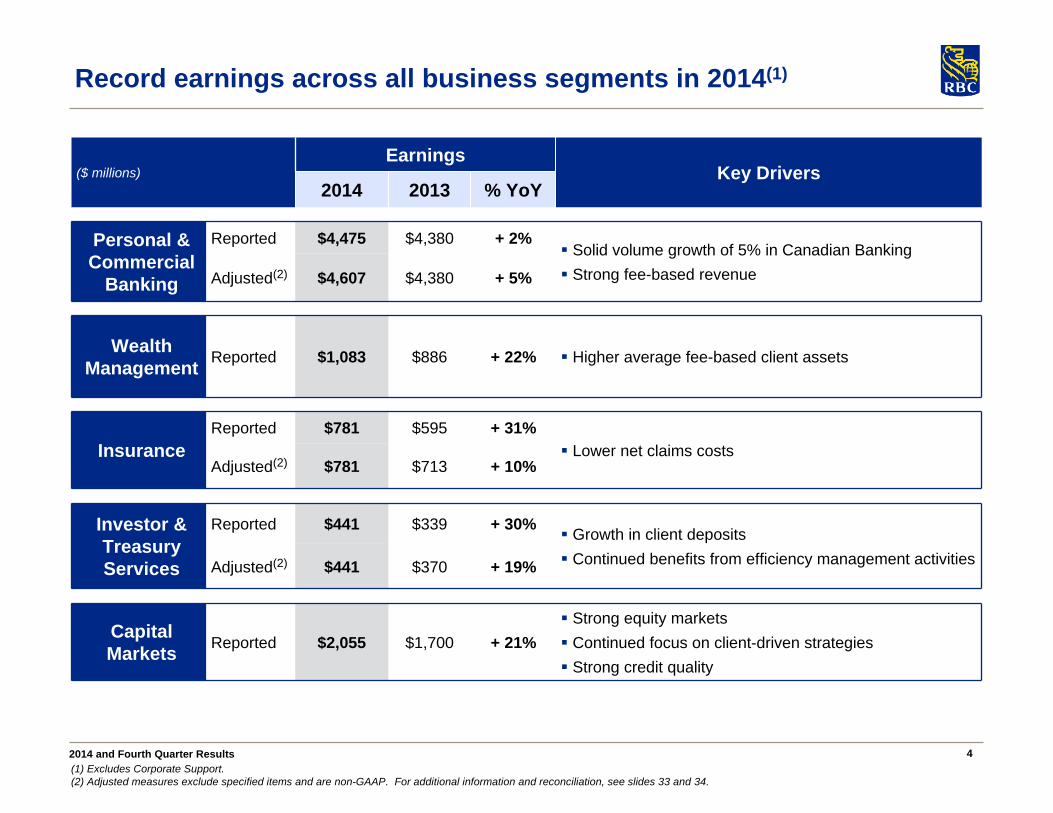
Record earnings across all business segments in 2014(1)
($ millions)Earnings
Key Drivers2014 2013 % YoY
Personal & Commercial
Banking
Reported $4,475 $4,380 + 2% Solid volume growth of 5% in Canadian Banking Strong fee-based revenueAdjusted(2) $4,607 $4,380 + 5%
Wealth Management Reported $1,083 $886 + 22% Higher average fee-based client assets
InsuranceReported $781 $595 + 31%
Lower net claims costsAdjusted(2) $781 $713 + 10%
Investor & Treasury Services
Reported $441 $339 + 30% Growth in client deposits Continued benefits from efficiency management activities Adjusted(2) $441 $370 + 19%
Capital Markets Reported $2,055 $1,700 + 21%
Strong equity markets Continued focus on client-driven strategies Strong credit quality
(1) Excludes Corporate Support. (2) Adjusted measures exclude specified items and are non-GAAP. For additional information and reconciliation, see slides 33 and 34.

2014 and Fourth Quarter Results 5
51%
12%
9%
5%
23%
A diversified business model – RBC’s key strength
(1) Amounts exclude Corporate Support. These are non-GAAP measures. For more information, see the Business segment results and Results by geographic segment sections of our 2014 Annual Report and slide 34.
Diversified business mix, with the right balance of retail and wholesale
Almost two-thirds of revenue from Canada
Strategic approach in key businesses in the U.S. and select international markets
19%
18% 63%
Earnings by business segment(1)For the year ended October 31, 2014
CanadaU.S.
International
Personal & Commercial
Banking
Wealth Management
Insurance
Capital Markets
Investor & Treasury Services
Revenue by geography(1)For the year ended October 31, 2014

2014 and Fourth Quarter Results 6(1) Annualized TSR is calculated based on common share price appreciation plus reinvested dividend income. Source: Bloomberg, as at October 31, 2014. RBC is compared to our global peer group. The peer group average excludes RBC; for the list of peers, please refer to our 2014 Annual Report.
Achieved all financial performance objectives
Total Shareholder Returns(1) 1-Year 3-Year 5-Year 10-Year
RBC 19% 23% 12% 14%Peer Group Average(1) 11% 19% 8% 5%
Financial performance objectives 2014 Reported Results Achieved
Diluted EPS growth of 7%+ 9.3%
ROE of 18%+ 19.0%
Strong capital ratios (CET 1 ratio) 9.9%
Dividend payout ratio 40% - 50% 47%
Increased quarterly dividend twice during the year, for a total increase of 12%
Delivered total shareholder returns (TSR) in excess of our peer group average
Continued to deliver returns to shareholders in excess of peer group average

2014 and Fourth Quarter Results 7
Key strategic priorities aligned to our long-term goals
Offering a differentiated experience: value for money, advice, access and service Making it easier to do
business with us and be the lower cost producer Converging into an
integrated multi-channel network Enhancing client
experience and improving efficiency in the Caribbean and U.S.
Personal & Commercial Banking
Building a high-performing global asset management business Focusing on high net
worth and ultra-high net worth clients to build global leadership Leveraging RBC and
RBC Wealth Management strengths and capabilities
Wealth Management
Strategic goals
Improving distribution efficiency and deepening client relationships Making it easier for
clients to do business with us Pursuing select
international opportunities to grow our reinsurance business
Insurance
Providing excellence in custody, asset servicing and payments, with an integrated funding and liquidity management business Focusing on organic
growth through developing new client relationships, deepening existing relationships and promoting the RBC brand Leveraging I&TS as a
driver of enterprise growth strategies with a focus on cross-selling and deposit gathering
Investor & Treasury Services (I&TS)
Maintaining our leadership position in Canada Expanding and
strengthening client relationships in the U.S. Building on core
strengths and capabilities in Europe and Asia Optimizing capital use
to earn high risk-adjusted returns on assets and equity
Capital Markets
Strategic priorities
In Canada, to be the undisputed leader in financial services Globally, to be a leading provider of capital markets, investor and wealth management solutions In targeted markets, to be a leading provider of select financial services complementary to our core
strengths

Financial ReviewJanice FukakusaChief Administrative Officer and Chief Financial Officer

2014 and Fourth Quarter Results 9
Strong performance across our retail businesses in Q4/2014
(1) Adjusted measures exclude specified items and are non-GAAP. For more information and reconciliation, see slides 33 and 34. (2) ROE does not have a standardized meaning under GAAP and may not be comparable to similar measures disclosed by other financial institutions. For more information, see slide 34. (3) Q4/2014 results include a $105MM charge ($51MM after tax and variable compensation) reflecting the implementation of valuation adjustments related to funding costs on uncollateralized over-the-counter derivatives (FVA). For further information, refer to Note 2 of our 2014 Condensed Consolidated Financial Statements.
($ millions, except for EPS and ROE)Q4/2014 Q3/2014 Q4/2013
Reported Reported Adjusted(1) Reported
Revenue $8,382 $8,990 $8,990 $7,919
Non-interest expense $4,340 $4,602 $4,562 $4,151
Net income $2,333 $2,378 $2,418 $2,101
Diluted earnings per share (EPS) $1.57 $1.59 $1.62 $1.39
Return on common equity (ROE)(2) 19.0% 19.6% 20.0% 18.8%
Earnings up $232million or 11% YoY
Strong performance across our retail businesses Strong growth in fee-based revenue and 5% volume growth in Canadian Banking Higher average fee-based client assets in Global Asset Management and Canadian
Wealth Management Lower net claims in Insurance
Continued strength in Investor & Treasury Services
Lower Capital Markets earnings reflect our exit of certain proprietary trading strategies to comply with the Volcker Rule and implementation of FVA(3)
Adjusted earnings down $85 million or
4% QoQ (1)
Lower trading and investment banking revenue in Capital Markets from very robust Q3/2014 levels and items noted above
Higher PCL in Capital Markets and Caribbean Banking
Partially offset by lower net claims in Insurance

2014 and Fourth Quarter Results 10
9.9%9.5%
(0.02%)(0.09%)0.16%0.32%
Q3/2014* Internal capitalgeneration
RWA reduction(CapitalMarkets)
Businessgrowth
Other Q4/2014*
Strong Basel III Common Equity Tier 1 (CET1) ratio(1) of 9.9%
Strong internal capital generation
Exit of certain proprietary trading strategies in Capital Markets in compliance with the Volcker Rule lowered risk-weighted assets
Partially offset by higher risk-weighted assets due to business growth, primarily in Capital Markets and Canadian Banking
* Represents rounded figures.(1) For more information, refer to the Capital management section of our 2014 Annual Report. (2) Includes impact of lower pension discount rate and foreign exchange.
Increased our capital position by 40 bps this quarter
(2)

2014 and Fourth Quarter Results 11
Continued strength in Canadian Banking
1,1381,070
1,151
1,178
Q4/2013 Q3/2014 Q4/2014
Canadian Banking
Net income of $1,210 million, up 11% YoY and 2% QoQ
Includes favourable net cumulative accounting adjustments of $55 million ($40 million after-tax)
NIM of 2.66% down 7 bps QoQ
Excluding accounting adjustments of 6 bps, NIM was 2.72%(2) (see slide 24)
Strong growth in fee-based revenue (up 14% YoY) from mutual fund distribution fees and card services revenue
Solid volume growth of 5% YoY
Loan growth of 4%
Deposit growth of 6%
Positive operating leverage and improved efficiency ratio YoY
Caribbean & U.S. Banking Results reflect increased provisions and a
restructuring charge in the Caribbean
Percentage Change YoY QoQ
Reported Net Income 8% 1%
Adjusted Net Income(1) n/a (2%)
(1)
(1) Excludes $40 million (before- and after-tax) loss related to the closing of the sale of RBC Jamaica in Q3/2014. These are non-GAAP measures. For more information and reconciliation, see slides 33 and 34. (2) Excludes the impact of net cumulative accounting adjustments totaling (6) bps. This is a non-GAAP measure. For more information and reconciliation, see slides 24 and 34.
Q4/2014 HighlightsNet Income – P&CB($ millions)

2014 and Fourth Quarter Results 12
Continued strength in Wealth Management
202
285 285
Q4/2013 Q3/2014 Q4/2014
Q4/2014 Highlights Net income up 41% YoY
Higher average fee-based client asset growth(1):
Global Asset Management: 50% capital appreciation, 50% net sales
Canadian Wealth Management: 70% capital appreciation, 30% net sales
Restructuring costs of $18 million after-tax(2)
related to our U.S. and International Wealth Management businesses
Positive operating leverage
PCL was nil in Q4/2014. Last year included provisions of $42 million on a few accounts
Net income flat QoQ
Net Income($ millions)
Amount ($ billions) YoY QoQ
AUA $718 12% 2%
AUM $452 17% 2%
Loans(3) $17 25% 6%
Deposits(3) $38 14% 6%
(1) Includes the impact of currency translation. (2) Restructuring costs of $27 million ($18 million after-tax). (3) Average balances.
Percentage Change YoY QoQ
Net Income 41% –

2014 and Fourth Quarter Results 13
Record earnings in Insurance
107
214
118
256225
Q4/2013 Q3/2014 Q4/2014
Q4/2014 Highlights Net income up $149 million YoY and up $42
million QoQ
Excluding a charge related to a change in tax legislation in Canada last year, net income was up $31 million or 14% YoY(1)
Lower net claims costs including a favourable cumulative adjustment related to outstanding claims in our life retrocession business
New U.K. annuity contract
Net Income($ millions)
Percentage Change YoY QoQ
Reported Net Income 139% 20%Adjusted Net Income(1) 14% n/a
(1) Excluding a charge of $160 million ($118 million after-tax) as a result of a change in tax legislation in Canada in Q4/2013. This is a non-GAAP measure. For additional information and reconciliation, see slides 33 and 34.
(1)

2014 and Fourth Quarter Results 14
Higher earnings in Investor & Treasury Services
Q4/2014 HighlightsNet Income($ millions)
91
110 113
Q4/2013 Q3/2014 Q4/2014
Net income up 24% YoY
Higher net interest income from growth in client deposits
Continuing benefits from efficiency management activities
Higher foreign exchange revenue
Net income up 3% QoQ
Higher custodial fees and foreign exchange revenue
Last quarter benefitted from seasonally higher securities lending
Percentage Change YoY QoQ
Net Income 24% 3%

2014 and Fourth Quarter Results 15
Markets, Volcker Rule and FVA impacted Capital Markets results
469
641
402
Q4/2013 Q3/2014 Q4/2014
Percentage Change YoY QoQ
Net Income (14)% (37)%
Q4/2014 HighlightsNet Income($ millions)
(1) For further description on FVA implementation, refer to footnote 3 on slide 9. (2) Includes $69 million in lower trading revenue and $6 million in costs.
Corporate & Investment Banking Revenue of $846 million
Up 8% YoY driven by higher lending and M&A activity, mainly in the U.S.
Down 12% QoQ due to lower loan syndication fees, partially offset by higher M&A activity, mainly in the U.S.
Global Markets Revenue of $650 million, down 27% YoY and 47%
QoQ
$105 million charge ($51 million after tax and variable compensation) from implementation of FVA(1)
Challenging trading conditions when compared to very robust Q3/2014
Q3 had a couple of outsized trades totaling approximately $100 million
$75 million(2) ($46 million after tax and variable compensation) in lower trading revenue and costs associated with the exit of certain proprietary trading strategies in compliance with the Volcker Rule
Variable compensation decreased YoY and QoQ on lower results

Risk ReviewMark HughesChief Risk Officer

2014 and Fourth Quarter Results 17
249 258204 230 236
26 7816
27
54
(2)
1
32
11
-
1319
42
0.27%0.23% 0.26%
0.31%0.32%
334 292 244 283 345
-5 0
0
5 0
1 00
1 5 0
2 00
2 5 0
3 00
3 5 0
4 00
Q4/2013 Q1/2014 Q2/2014 Q3/2014 Q4/2014
Canadian Banking Caribbean and U.S. BankingCapital Markets Wealth ManagementPCL Ratio
Credit quality remains strong
Personal & Commercial Banking (P&CB)
Caribbean PCL was up $23 million QoQ primarily due to increased provisions on our impaired residential mortgages portfolio of $50 million
Canadian Banking PCL was up $6 million or 3% QoQ driven by higher provisions in residential mortgages and business partially offset by lower write-offs in our credit card portfolio and lower provisions in our personal lending portfolio
Capital Markets
PCL of $32 million related to a single account
(1) PCL ratio is PCL on impaired loans as a percentage of average net loans & acceptances (annualized).
Total PCL ($ millions, except percentage amounts)
(1)
Selected PCL Ratios Q4/2013 Q1/2014 Q2/2014 Q3/2014 Q4/2014Personal & Commercial Banking 0.32% 0.31% 0.27% 0.32% 0.35%
Canadian Banking 0.29% 0.30% 0.25% 0.26% 0.27%
Capital Markets 0.08% (0.01)% 0.08% 0.01% 0.19%

2014 and Fourth Quarter Results 18
0.03% 0.02% 0.01% 0.01% 0.02%
0.44%0.44%0.42%0.55%0.53%
2.69%
2.46%2.31%2.33%2.30%
1.25%
0.91% 0.96%0.76%
0.92%
-0.2 0%
0.3 0%
0.8 0%
1 .3 0%
1 .8 0%
2 .3 0%
2 .8 0%
3 .3 0%
3 .8 0%
Q4/2013 Q1/2014 Q2/2014 Q3/2014 Q4/2014
Stable credit quality in Canadian Banking retail portfolio in Q4/2014
Average retail loans ($296 billion)(1,4) PCL Ratio(2) by product
Residential mortgages
Credit cards
Small business(3,4)
Personal(4)
Residential mortgages
(1) As at October 31, 2014. (2) PCL ratio is PCL on impaired loans as a percentage of average net loans & acceptances (annualized). (3) Since Q2/2013, includes Ally Canada non-personal loan portfolio. In Q1/2014, we aligned Ally Canada to RBC’s methodology. (4) In Q2/2014, certain indirect auto loans were reclassified retroactively from personal loans to small business loans.
Credit performance continues to be strong in Canadian Banking
5%
2%
29%
64%
Residential mortgages
Personal
Credit cards
Small business

2014 and Fourth Quarter Results 19
Diversified residential mortgage portfolio in Canadian Banking
Condo exposure is 9.5%(3) of Canadian residential mortgage portfolio
Total exposure to condo developers is approximately $4 billion
Drawn exposure of $1.5 billion, representing 2% of our commercial loan book, and undrawn exposure of $2.5 billion
Geographic DiversificationAs at October 31, 2014
Insured vs. Uninsured mortgages(2)
As at October 31, 2014
Insured
Uninsured
(1) Excludes mortgages of $5 billion related to commercial clients which are reported as business loans and does not include Canadian Banking HELOC. (2) Excludes Canadian Banking HELOC and percentages are based on spot balances. (3) Based on $192 billion in residential mortgages and $44 billion in Home Equity Line of Credit in Canada.
Broad geographic diversification across Canada Strong underwriting practices resulting in continued low loss rates and stable delinquency rates with good LTV coverage and low exposure to condo market
Condo ExposuresAs at October 31, 2014
Canadian Residential Mortgage Portfolio: $192 billion(1)
7%41%
13%
15%
19%
5%
Atlantic Quebec OntarioMan/Sask Alberta British Columbia
40%
60%Uninsured
Insured

2014 and Fourth Quarter Results 20
1,872 1,891 1,905 1,929
50
1,913
229 139 56 50
0.52% 0.49% 0.45%0.45% 0.44%
1,9771,9991,9752,111
2,201
0
5 00
1 ,000
1 ,5 00
2 ,000
2 ,5 00
Q4/2013 Q1/2014 Q2/2014 Q3/2014 Q4/2014Personal & Commercial Banking (P&CB) Capital MarketsWealth Management Investor & Treasury ServicesCorporate Support RBC GIL Ratio
Gross Impaired Loans (GIL) ($ millions, except percentage amounts)
GIL Ratio by Segment(1) Q4/2013 Q1/2014 Q2/2014 Q3/2014 Q4/2014
P&CB 0.54% 0.54% 0.55% 0.55% 0.53%
Canadian Banking 0.35% 0.35% 0.36% 0.33% 0.32%
Capital Markets 0.40% 0.23% 0.09% 0.08% 0.07%
(1) GIL Ratio for Corporate Support is not meaningful.
New Impaired Formations ($ millions)
Gross Impaired Loans and Formations
402
309 324 313
71
292
85
24 344
17
0
1 00
2 00
3 00
4 00
5 00
6 00
7 00
Q4/2013 Q1/2014 Q2/2014 Q3/2014 Q4/2014
Personal & Commercial Banking Capital MarketsWealth Management Investor & Treasury ServicesCorporate Support Total
Total Gross Impaired Loans decreased in Personal & Commercial Banking and Wealth Management
New impaired formations remain stable
326330324
337
558

2014 and Fourth Quarter Results 21
Trading Revenue and VaR
Lower trading revenue in Q4/2014 largely reflects the exit of certain proprietary strategies, in compliance with the Volcker rule during a period of increased market volatility in October
The market volatility in October also negatively impacted our fixed income trading businesses
(in millions)

Appendices

2014 and Fourth Quarter Results 23
Continued leadership in Canadian Banking
Leadership in most personal products and in all business products
#1 position in most Canadian retail banking products
#1 position in Business Loans ($0-$25 million) and gaining market share (up 40 bps YoY)
#2 in Personal core deposits and GICs, and gaining market share (up 20 bps YoY)
Canadian Market ShareQ4/2014 Q4/2013
Rank Market Share(1) Rank Market Share(1)
Consumer Lending(2) 1 23.7% 1 23.7%
Personal Core Deposits + GICs 2 20.2% 2 20.0%
Long-Term Mutual Funds(3) 1 14.2% 1 14.2%
Business Loans ($0 - $25 million) 1 25.3% 1 24.9%
Business Deposits(4) 1 26.0% 1 26.0%
(1) Market share is calculated using most current data available from OSFI (M4), Investment Funds Institute of Canada (IFIC) and Canadian Bankers Association (CBA). OSFI, IFIC and Consumer Lending CBA data is at July 2014 and July 2013, Business Loans CBA data is at June 2014 and June 2013. Market share is of total Chartered Banks except for Business Loans which is of total 7 Banks (RBC, BMO, BNS, CIBC, TD, NBC, CWB). (2) Consumer Lending market share is of 6 banks (RBC, TD, CIBC, BMO, BNS and National). Consumer Lending comprises residential mortgages (excluding acquired portfolios), personal loans and credit cards. (3) Mutual fund market share is per IFIC and is compared to total industry. (4) Business Deposits market share excludes Fixed Term, Government and Deposit Taking Institution balances.

2014 and Fourth Quarter Results 24
Canadian Banking net interest margin (1)
Net interest margin (NIM) decreased 7 bps QoQ and 4 bps YoY primarily reflecting net cumulative accounting adjustments, including:
A change in the recording of certain business loan fees from Net interest income to Non-interest income, which will continue to impact margins going forward (-3 bps)
Other accounting adjustments which are not expected to recur (-3 bps)
NIM continues to be impacted by lower rate environment and competitive pressures
2.66%
2.73%2.74%2.73%2.70%
2.72%
Q4/2013 Q1/2014 Q2/2014 Q3/2014 Q4/2014
(1) Net interest margin: net interest income as a percentage of average total earning assets.(2) Excludes the impact of net cumulative accounting adjustments totaling (6) bps as noted above. This is a non-GAAP measure. For more information, see slide 34.
(2)

2014 and Fourth Quarter Results 25
56 58
187 191183
85 8685
151414
59
Q4/2013 Q3/2014 Q4/2014
161 166 168
93 98 102
Q4/2013 Q3/2014 Q4/2014
Continued volume growth in Canadian Banking
Combined loan and deposit growth of 5% YoY
Percentage Change(1) YoY QoQ
Business (inc. small business) 5.4% 0.9%
Credit Cards 5.8% 2.8%
Personal Lending 0.9% 0.6%
Residential Mortgages 4.3% 2.1%
(1) Total loans & acceptances and percentage change may not reflect the average loans & acceptances balances for each loan type shown due to rounding.(2) Total deposits and percentage change may not reflect the average deposits for each deposit type shown due to rounding.
345 264338 350 254
270
Percentage Change(2) YoY QoQ
Business Deposits 9.4% 3.2%
Personal Deposits 4.6% 1.4%
Average Loans & acceptances(1)
($ billions)Average deposits(2)
($ billions)
+ 4%+ 2%
+ 6%
+ 2%

2014 and Fourth Quarter Results 26
Continuing to diversify our Asset Management business
0
5 0
1 00
1 5 0
2 00
2 5 0
3 00
3 5 0
2007 2014
International InstitutionalU.S. InstitutionalCanadian InstitutionalCanadian Retail
U.S.U.S.
Equity
(1) Data as of October 31, 2014.
Extending our leadership position in Canada in both retail and institutional asset management
Continuing to see momentum in our international institutional business driven by market share gains in higher fee-based solutions such as equities and credit strategies
AUM by Client Segment(1) AUM by Asset Class(1)
2007 2014
20%
13%
21%
46%100%
48%
52%
U.S.U.S.
16%
55%
29%Equity
Fixed Income
Cash & Short-term
investments
2014 and Fourth Quarter Results 27
14.5%14.4%14.4%14.5%14.6%14.7%14.6% 14.5%14.5%
0
20
40
60
80
100
120
140
160
180
200
Sep-12 Dec-12 Mar-13 Jun-13 Sep-13 Dec-13 Mar-14 Jun-14 Sep-140.0%
3.0%
6.0%
9.0%
12.0%
15.0%
(1) Source: IFIC (as of September 2014) and RBC reporting.
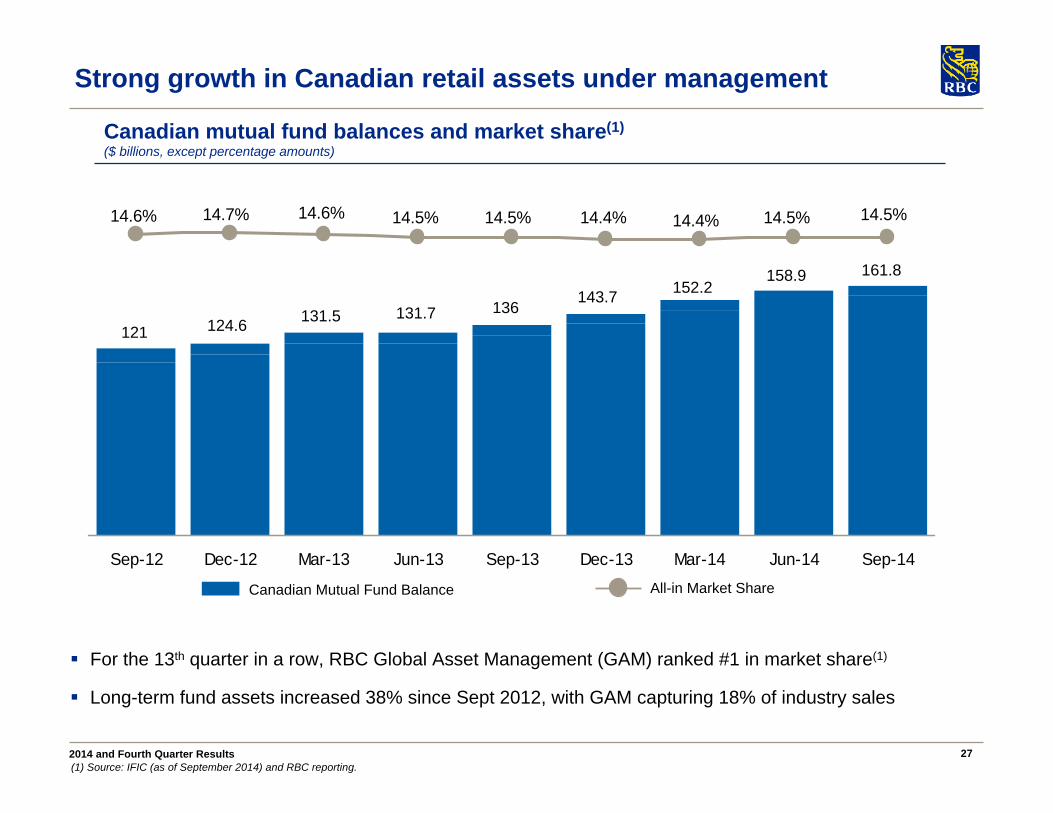
For the 13th quarter in a row, RBC Global Asset Management (GAM) ranked #1 in market share(1)
Long-term fund assets increased 38% since Sept 2012, with GAM capturing 18% of industry sales
Canadian mutual fund balances and market share(1)($ billions, except percentage amounts)
Strong growth in Canadian retail assets under management
Canadian Mutual Fund Balance All-in Market Share
121 124.6 131.5 131.7 136143.7 152.2
158.9 161.8

2014 and Fourth Quarter Results 28
Capital Markets revenue – diversified by business
($ millions) Q4/2014 Q3/2014 Q4/2013 QoQ YoY
Investment banking 414 511 430 (19)% (4)%
Lending and other 432 454 356 (5)% 21%
Corporate & Investment Banking $846 $965 $786 (12)% 8%
Fixed income, currencies and commodities (FICC) 164 574 446 (71)% (63)%
Global equities (GE) 256 364 270 (30)% (5)%
Repo and secured financing 230 282 172 (18)% 34%
Global Markets (teb) $650 $1,220 $888 (47)% (27)%
Other $3 - $9 n.m. (67)%
Capital Markets total revenue (teb) $1,499 $2,185 $1,683 (31)% (11)%
Corporate & Investment Banking YoY increase reflects robust growth in lending and M&A activity, mainly in the U.S., and higher distributions on private equity
investments, partially offset by lower loan syndication in the U.S. compared to robust levels last year
QoQ decrease driven by lower loan syndication in the U.S. and Europe and lower equity and debt origination due to market conditions and an exceptionally strong third quarter. These factors were partially offset by higher M&A activity, mainly in the U.S.
Global Markets YoY and QoQ decreases reflect:
$105 million charge from implementation of FVA(1)
$69 million in lower revenue associated with the exit of certain proprietary trading strategies in compliance with the Volcker Rule
Challenging market conditions, particularly in our fixed income business, following a very robust Q3/2014
(1) For further description on FVA implementation, refer to footnote 3 on slide 9.

2014 and Fourth Quarter Results 29
Capital Markets revenue – diversified by geography
($ millions) Q4/2014 Q3/2014 Q4/2013 QoQ YoY
Canada 541 645 451 (16)% 20%
U.S. 906 1,164 941 (22)% (4)%
Europe 196 323 200 (39)% (2)%
Asia and Other 47 51 38 (8)% 24%
Geographic revenue excluding certain items(1) $1,621 $2,183 $1,630 (25)% 0%Add / (Deduct):
BOLI(2) - 4 - (4) -
CVA(3) (17) (2) 27 (15) (44)
Fair value adjustment on RBC debt(3)(4) - - 26 - (26)
FVA implementation(3)(5) (105) - - (105) (105)
Exit of certain proprietary trading strategies(2)(6) (69) - - - -
Capital Markets total revenue (teb) $1,499 $2,185 $1,683 (31)% (11)%
Canada YoY increase driven by equity origination and trading activity, as well as distributors from private equity investments
U.S. YoY decrease reflects weaker fixed income and equities trading, as well as lower loan syndications and debt
underwriting compared to robust levels in the U.S. last year, partially offset by solid lending growth
Europe YoY was largely flat as weaker fixed income and equities trading, and lower equity origination were offset by higher
lending and M&A activity(1) These are non-GAAP measures. For more information, see slide 34. (2) Excluded from U.S. (3) Excluded from all geographies. (4) In Q2/2014 we prospectively adopted the own credit provisions of IFRS 9 Financial Instruments. Changes in fair value in own liabilities attributable to changes in credit spreads are now recorded in other comprehensive income. For more information, refer to the Accounting and control matters section of our Q2/2014 Report to Shareholders and Note 2 of our Q2/2014 Interim Condensed Consolidated Financial Statements. (5) For further description on FVA implementation, refer to footnote 3 on slide 9. (6) Q4/2014 results include $69MM of lower trading revenue associated with the exit of certain proprietary trading strategies in compliance with the Volcker Rule.

2014 and Fourth Quarter Results 30
Prudently growing Capital Markets’ loan book
Lending and Syndication Revenue and Loans Outstanding by Region(1) ($ billions)
Loans Outstanding by Industry(1)Q4/2014
Diversification driven by strict limits on single name, country, industry and product levels across all businesses, portfolios, transactions and products
Consistent lending standards throughout the cycle, with PCL levels in line with our risk appetite
Approximately 66% of our authorized Capital Markets loan portfolio is investment grade
In the last 3 years, our lending and syndication revenue grew by 24%, exceeding our loan book growth of 18%(2)
15 16 18 20 21
1016
2126
31
4
5
7
7
90.91.0
1.4
1.7 1.9
2010 2011 2012 2013 2014Canada U.S.Other International Lending & Syndication Revenue
29
46
53
37
(1) Average loans & acceptances, and letters of credit and guarantees for our Capital Markets portfolio, on single name basis. It excludes mortgage investments, securitized mortgages and other non-core items. (2) Based on a compounded annual growth rate. (3) Mainly includes: Aerospace and Transportation.
15%
15%12%
9%
7%5%
21%
3%
13%
Public, Municipal
Energy, Mining, Exploration & Production, Forestry
Infrastructure
Consumer Industrials, Health Care
Real Estate
Financials Services, Financial Institutions
Utilities, Diversified
Communications, Media & Entertainment, Technology
Other(3)
61

2014 and Fourth Quarter Results 31
Capital Markets’ trading revenue
($ millions) Q4/2014 Q3/2014 Q4/2013 QoQ YoY
Capital Markets total revenue (teb) $1,499 $2,185 $1,683 (31)% (11)%
Capital Markets non-trading revenue(1) $1,107 1,250 1,022 (11)% (8)%
Capital Markets trading revenue (teb) $392 $935 $661 (58)% (41)%
Add / (Deduct):
BOLI - (4) -
CVA 17 2 (27)
FVA implementation(2) 105 - -
Fair value adjustment on RBC debt(3) - - (26)
Exit of certain proprietary trading strategies(4) 69 - -
Capital Markets trading revenue (teb) excl. certain items $583 $933 $608 (38%) (4%)
Lower trading revenue due to challenging market conditions, particularly in the latter half of the quarter
Trading revenue was also impacted by the implementation of FVA(2) and the exit of certain proprietary trading strategies in compliance with the Volcker Rule(4)
Last quarter we had very favourable market conditions and a couple of outsized trades totaling approximately $100 million
(1) Non-trading revenue primarily includes Corporate & Investment Banking and Global Markets origination and cash equities businesses. (2) For further description on FVA implementation, refer to footnote 3 on slide 9. (3) In Q2/2014 we prospectively adopted the own credit provisions of IFRS 9 Financial Instruments. Changes in fair value in own liabilities attributable to changes in credit spreads are now recorded in other comprehensive income. For more information, refer to the Accounting and control matters section of our Q2/2014 Report to Shareholders and Note 2 of our Q2/2014 Interim Condensed Consolidated Financial Statements. (4) Q4/2014 results include $69MM of lower trading revenue associated with the exit of certain proprietary trading strategies in compliance with the Volcker Rule.

2014 and Fourth Quarter Results 32
Other – other income
($ millions) Q4/2014 Q3/2014 Q4/2013
Other income – segments 273 89 95
FV adjustments on RBC debt(1) - - 3
CDS on corporate loans (3) 2 (10)
Funding related and other hedging items 78 10 (29)
Total Other – other income $348 $101 $59
(1) Effective Q2/2014, we prospectively adopted the own credit provisions of IFRS 9 Financial Instruments with an initial application date of November 1, 2013. Changes in fair value in our financial liabilities designated as at fair value through profit or loss (FVTPL) attributable to changes in RBC credit risk are now recorded in Other comprehensive income (OCI). Prior periods were not restated.

2014 and Fourth Quarter Results 33
Specified items impacting results (FY 2013 & 2014)
(1) These are non-GAAP measures. For more information, see slide 34.
($ millions, except for earnings per share (EPS) amounts) Reported
Personal & Commercial Banking (P&CB) Insurance I&TS
Adjusted(1)
Loss related to sale of RBC
Jamaica
Provisions for post-employment benefits and restructuring charge in
the Caribbean
Charge related to certain Individual life insurance
policiesRestructuring
Charges
Q3/2014
ConsolidatedNon-interest expense $4,602 ($40) - - - $4,562
Net income $2,378 $40 - - - $2,418
Diluted EPS $1.59 $0.03 - - - $1.62
P&CBNet income $1,138 $40 - - - $1,178
FY 2014Consolidated
Net income $9,004 $100 $32 - - $9,136
Diluted EPS $6.00 $0.07 $0.02 - - $6.09 P&CB
Net income $4,475 $100 $32 - - $4,607 Q4/2013Insurance
PBCAE $878 - - ($160) - $718 Net Income $107 - - $118 - $225
FY 2013Insurance
PBCAE $2,784 - - ($160) - $2,624Net Income $595 - - $118 - $713
Investor & Treasury ServicesNet Income $339 - - - $31 $370

2014 and Fourth Quarter Results 34
Note to users
Amy Cairncross, VP & Head (416) 955-7803Lynda Gauthier, Director (416) 955-7808Christopher Taylor, Associate Director (416) 955-7872
www.rbc.com/investorrelations
Investor Relations Contacts
We use a variety of financial measures to evaluate our performance. In addition to generally accepted accounting principles (GAAP) prescribed measures, we use certain key performance and non-GAAP measures we believe provide useful information to investors regarding our financial condition and result of operations. Readers are cautioned that key performance measures, such as ROE and non-GAAP measures such as earnings and revenue excluding Corporate Support, earnings excluding specified items related to sale of RBC Jamaica as previously announced on January 29, 2014, and provisions related to post-employment benefits and restructuring charges in the Caribbean, earnings excluding charges related to new tax legislation in Canada, adjusted net interest margin and Capital Markets trading and geographic revenue excluding specified items do not have any standardized meanings prescribed by GAAP, and therefore are unlikely to be comparable to similar measures disclosed by other financial institutions.
Additional information about our ROE and non-GAAP measures can be found under the “Key performance and non-GAAP measures” section of our 2014 Annual report.
Definitions can be found under the “Glossary” sections in our Q4/2014 Supplementary Financial Information and our 2014 Annual Report.