royal bank of canada 2009 annual report - rbc business, public sector and institutional clients...
TRANSCRIPT

Royal Bank of Canada2009 Annual Report

Vision Values Strategic goals
• Always earning the right to be ourclients’ first choice
• Excellent service to clients and eachother
• Working together to succeed
• Personal responsibility for highperformance
• Diversity for growth and innovation
• Trust through integrity in everything wedo
• In Canada, our goal is to be theundisputed leader in financialservices.
• In the U.S., our goal is to be a leadingprovider of capital markets, wealthmanagement and banking services bybuilding on and leveragingour considerable capabilities.
• Outside North America, our goal is tobe a premier provider of select capitalmarkets, wealth management andbanking services in markets of choice.
ROYAL BANK OF CANADA (RY on TSX and NYSE) and its subsidiaries operate under the master brand name RBC. We are Canada’slargest bank as measured by assets and market capitalization, and among the largest banks in the world, based on marketcapitalization. We are one of North America’s leading diversified financial services companies, and provide personal andcommercial banking, wealth management services, insurance, corporate and investment banking and transaction processingservices on a global basis. We employ approximately 80,000 full- and part-time employees who serve more than 18 millionpersonal, business, public sector and institutional clients through offices in Canada, the U.S. and 53 other countries. For moreinformation, please visit rbc.com.
CONTENTS
1 Chief Executive Officer’s message
4 Chairman’s message
5 Management’s Discussion and Analysis
6 Overview
10 Financial performance
14 Quarterly financial information
16 Business segment results
33 Financial condition
37 Risk, capital and liquidity management
54 Overview of other risks
56 Additional risk factors that may affect future results
57 Additional financial information
61 Key performance and non-GAAP measures
63 Accounting and control matters
67 Related party transactions
68 Supplemental information
75 Management’s Responsibility for Financial Reporting
75 Report of Independent Registered Chartered Accountants
75 Comments by Independent Registered CharteredAccountants on Canada-United States of America ReportingDifference
76 Management’s Report on Internal Control over FinancialReporting
76 Report of Independent Registered Chartered Accountants
77 Consolidated Balance Sheets
78 Consolidated Statements of Income
79 Consolidated Statements of Comprehensive Income andChanges in Shareholders’ Equity
80 Consolidated Statements of Cash Flows
81 Notes to the Consolidated Financial Statements
147 Glossary
150 Directors and executive officers
151 Principal subsidiaries
152 Shareholder information
See our Glossary for definitions of terms used throughout thisdocument.
This annual report contains forward-looking statements within the meaning of certain securities laws, including the “safe harbour” provisions ofthe United States Private Securities Litigation Reform Act of 1995 and applicable Canadian securities legislation. We caution readers not to placeundue reliance on these statements as a number of risk factors could cause our actual results to differ materially from the expectationsexpressed in such forward-looking statements. Additional information about our forward-looking statements and risk factors can be found underthe Caution regarding forward-looking statements on page 5.

CHIEF EXECUTIVE OFFICER’S MESSAGE
At the end of a very challenging year, RBC stands apart as aglobally significant, strong and stable financial institution. Wehad top quartile shareholder returns for one-, three-, five- and10-year time horizons versus our North American peer groupand today we are one of the largest banks in the world basedon market capitalization. We are one of only a handful ofbanks globally with a Aaa-rating by Moody’s Investors Service,and are among the most respected and well recognized banksfor our corporate citizenship.
In fiscal 2009, we generated net income of $3.858 billion,which reflects a goodwill impairment charge of $1 billion onboth a pre-tax and after-tax basis that did not affect ourongoing operations. Excluding the goodwill impairmentcharge, adjusted net income of $4.9 billion1 was up 7 per centfrom a year ago, reflecting strong performances in CanadianBanking, Capital Markets, Wealth Management, andInsurance.
Our consistently strong performance is due to our diversifiedbusiness model, our strong balance sheet, a comprehensiveapproach to risk management, a clear long-term strategy andthe efforts of employees who are proud to be part of RBC andcommitted to always putting our clients first.
The financial crisis and resulting economic downturn poseddifficult conditions for our clients, but our people workeddiligently to help them achieve better outcomes by extendingcredit and providing advice and service that leveraged ourglobal capabilities, expertise as well as our competitive andfinancial strengths.
While the environment last year proved the strength of ourbusiness model, it also spurred all our businesses to find newways to be more efficient and productive. In addition to a Tier 1capital ratio of 13 per cent and low leverage relative to ourglobal peers, our sharper focus on cost management willensure that we are able to reinvest those savings in the solidgrowth opportunities provided by improving investorconfidence, stronger credit and equity markets and recoveringasset values.
We are a better company today than we were before the crisisbegan. We are armed with the wherewithal to invest andinnovate so that we may further enhance our strengths andtake the necessary steps to address our challenges. Ourcompetitors are retreating from businesses in the face of
capital constraints, government ownership, new regulatoryhurdles or re-focused strategic priorities. In contrast, ourstrength, stability and diversified business model, combinedwith our risk management and financial performance havegiven us an unprecedented range of strategic opportunities.We are actively looking to invest in key business areas, as wellas to explore potential acquisitions that meet our stricteconomic, strategic, and cultural criteria.
2009 Strategic goalsA large driver of our success has been our focus on ourlong-term strategy, which will continue to guide our businessdecisions. Specifically, our strategic goals are:• In Canada, to be the undisputed leader in financial
services.• In the U.S., to be a leading provider of capital markets
services, wealth management and banking by building onand leveraging our considerable capabilities.
• Outside North America, to be a premier provider of selectcapital markets, wealth management and bankingservices in markets of choice.
In Canada, RBC is an iconic brand and we are recognized as aclear Canadian business leader. While 2009 was a verydifficult competitive environment, nearly all our businessescontinued to build on their leadership position in each marketand product category.
We continued to take steps to make it easier for clients of ourretail bank to do business with us by expanding our branchand ATM networks, and by extending the hours of operation inmore than half our branches. Over the past five years, weinvested significantly in our business by adding client-facingemployees and we redesigned processes to make it easier forour employees to serve our clients. We are beginning to seethe results of these changes: more business from both newand existing clients, higher market shares in consumerlending, business loans and business deposits, andrecognition by third-party organizations such as Synovate andForrester Research Inc.
Our Canadian wealth management business is the largest inthe country and includes the country’s largest full servicebrokerage and largest mutual fund company. Despite thedownturn, net sales of our mutual funds continued toincrease, demonstrating the power of our distribution
(1) Adjusted net income is a non-GAAP measure. For more information, please see the Key performance and non-GAAP measures section of our Management’s Discussion and Analysis.
Chief Executive Officer’s message Royal Bank of Canada: Annual Report 2009 1

network, rising financial markets, clients’ increasing riskappetite and confidence in our fund management expertise.Private Banker International named RBC the “OutstandingPrivate Bank – North America” for 2009, recognizing ourgrowth potential, strength, stability and leadership.
We are the largest bank-owned insurance company in Canada,and we are building our client base by providing more value toclients. We offer travel, life, and home and auto, and travelproducts and services through growing proprietary channels,including retail insurance branches, call centres, the Internet,a career sales force as well as through independent insuranceadvisors and travel agencies. Notably, we recently reorganizedour business to be more responsive to client needs andexpanded our Canadian retail insurance network to 49branches in 2009, from 35 branches in 2008.
We continue to be Canada’s leading global investment bank,and were again named Dealmaker of the Year in Canada(Financial Post), Best Investment Bank in Canada (Euromoney)and a leader in Canadian equity underwriting and corporatedebt financing (Bloomberg, Thomson Reuters). We acted asglobal coordinator for the largest bought deal ever.
In the U.S., we are the sixth largest full-service retail brokeragefirm with almost 2,300 financial consultants – up over 100from last year following successful competitive recruitment.We successfully integrated our Ferris, Baker Watts Inc. and J.B.Hanauer & Co. acquisitions and announced an agreement toacquire J.P. Morgan’s Third Party Registered InvestmentAdvisory Servicing Business to expand the breadth and depthof our custody and clearing services. That acquisition issubject to regulatory approvals and other customary closingconditions and is expected to close in the second quarter of2010.
For our capital markets business, our recent designation as aprimary dealer in the U.S. by the Federal Reserve Bank ofNew York allows us to participate in all U.S. treasury auctions,giving us a broader product offering to better serve clientsaround the world and demonstrating the health and stabilityof our U.S. fixed income trading business.
The challenging economic conditions in the U.S. continue toaffect our U.S. retail banking operations, which we arerestructuring to improve client service and to achieve greateroperational efficiency. We have over 430 branches in the
southeastern U.S. serving retail, small business andcommercial clients.
Outside North America, we are the only Canadian bank with aglobal wealth management capability, capitalizing on thesector’s long-term growth around the world. The currentmarket environment has presented significant growthopportunities for this business and we will continue toconsider suitable acquisitions. In 2009, our U.K. wealthmanagement operations completed the acquisition of Jersey-based Mourant Private Wealth, enhancing our ability toprovide integrated private wealth management services tointernational clients.
Our global capital markets businesses also took advantage ofthe market dislocation by recruiting hundreds of talentedprofessionals, acquiring new clients, and participating inlarger transactions. Our fixed income and energy and miningbusinesses are now successful on a global basis.
In our Caribbean banking operation, we are integrating ourRBTT acquisition with the goal of establishing a commonoperating platform to support our growth in the region. Weestablished our Caribbean headquarters in Port of Spain,Trinidad and Tobago, to serve as the centre of our Caribbeanbanking network, which is currently the second largest in theEnglish speaking Caribbean.
Our joint venture, RBC Dexia Investor Services, is a top 10global custodian in terms of assets under administration,providing unique offshore and onshore solutions toinstitutions worldwide in 16 countries on four continents. Itcontinues to pursue select client and market initiatives, suchas the agreement to acquire the depositary bank business ofUnione di Banche Italiane Scpa. The acquisition enhances ourpresence in key markets in Europe, broadens the scope of ourcapabilities and strengthens our client base. This deal isexpected to close in the first half of 2010 and is subject tocustomary regulatory approvals from the relevant authorities.
2009 Progress on medium-term objectivesIn 2008, we anticipated challenging financial marketconditions – including more cyclical and structural changes inthe financial services industry – and established a set ofmedium-term objectives (shown on page 3) that reflected ourfocus on both current performance as well as on long-termopportunities. We continue to make progress toward theseobjectives.
2 Royal Bank of Canada: Annual Report 2009 Chief Executive Officer’s message
CHIEF EXECUTIVE OFFICER’S MESSAGE

CHIEF EXECUTIVE OFFICER’S MESSAGE
2009 Progress on medium-term objectivesMedium-term
objectives2009
ProgressDiluted EPS growth 7%+ (24)%Defined operating leverage (1) > 3% 3.5%ROE 18%+ 11.9%Tier 1 capital ratio 8.5%+ 13.0%Dividend payout ratio 40% - 50% 78%(1) Our defined operating leverage is a non-GAAP measure and refers to the difference between our revenue growth rate (as adjusted) and non-interest expense growth rate (as adjusted). For
further information, refer to the Key performance and non-GAAP measures section of our Management’s Discussion and Analysis.
In line with these expectations, the recessionary environment,challenging market conditions, and the need to strengthencapital positions hurt our earnings per share (EPS) growth,return on equity (ROE) and dividend payout ratio, though wemade positive progress toward our objectives for definedoperating leverage and Tier 1 capital.
Our defined operating leverage for 2009 was 3.5 per cent, verystrong in the current environment, reflecting strong revenuegrowth and effective cost management. If we exclude thereduction of the Enron Corp.-related litigation provision in2008, as it does not reflect our normal course operatingexpenses, our defined operating leverage is 8.2 per cent.
Common and preferred share issuances significantlystrengthened our Tier 1 capital ratio during the year butcontributed to a dilutive impact on our EPS and ROE growth:Despite the fact that adjusted net income (excluding thegoodwill impairment charge) grew by 7 per cent, the sharedilution caused EPS and ROE to fall.
2010 OutlookWe remain committed to these medium term objectives for2010. We expect our businesses to benefit modestly fromrecoveries in Canadian and global economies but we also expectcredit concerns to persist through at least the middle of 2010.
The Canadian economy is currently forecast to grow by 2.6 percent in 2010, reflecting increased consumer spending,improvements in the U.S. economy, continued low borrowingcosts and the impact of government stimulus projects. Creditquality is expected to remain under pressure, although withsome improvement in 2010, as we anticipate theunemployment rate in Canada to peak early in 2010. Ourforecast for the U.S. economy is for 2.5 per cent growth in thenext year as consumer spending and the housing market showmodest signs of improvement. Credit quality is expected toremain under pressure in the U.S. but should begin tostabilize through 2010 reflecting modest improvements inconsumer and business spending and continuedimprovement in financial markets. Outside North America, weexpect a gradual recovery in global economies in 2010 with aslower pace of growth in advanced economies, such as theU.K. and Eurozone countries. We anticipate solid growth inChina will lead emerging economies, as a result of continued
fiscal stimulus, increased domestic demand, and modestexport growth. We project global capital markets will continueto stabilize and credit spreads will tighten further as theglobal economic recovery continues and access to creditimproves.
Positioned to seize opportunities for long-term growthIn the midst of the most difficult financial conditions in ageneration, RBC has proved equal to the challenge. As manyglobal competitors stumbled or fell, RBC operated withintegrity and continued to produce results of which we arejustifiably proud. Where we encountered difficult conditions,we faced our challenges head on. Guided by our long-termstrategy, our efforts generated momentum across all ourbusinesses and give us greater confidence as we seek toextend our performance into and through 2010.
Despite our success, we will not become complacent. Ourclients’ needs are changing and to remain relevant we willcontinue to use our financial strength and expert capabilities toprovide them with sound advice and excellent service. Ourexperience in 2009 has reinforced our appreciation for the needto continue to improve and adapt the way we deliver productsand services as well as to continue investing in the infrastructurenecessary to support our businesses now and in the future. Ourcost discipline will enable us to reinvest in our growth andcapabilities at a time when many of our competitors cannot.
I believe RBC is now one of the better positioned financialcompanies in the world because our employees have beenrelentless about pursuing all aspects of our business with thebest interests of our clients in mind. At every chance, each ofour 80,000 employees has focused on helping our clients bemore confident about their future. I thank all of them sincerelyfor their professionalism, and for their continued commitmentto our clients and to each other.
Finally, I want to thank all our clients for their trust throughthese difficult times. We will continue to work hard so that weearn the right to serve you every day.
Gordon M. NixonPresident and Chief Executive Officer
Chief Executive Officer’s message Royal Bank of Canada: Annual Report 2009 3

CHAIRMAN’S MESSAGE
The hallmark of a high performing board is collective businessexperience that can be brought to bear in changingcircumstances. Over the past two years, global marketuncertainty has presented the Board of Directors with bothopportunities and challenges, while confirming the relativestrength and stability of RBC. During this challenging time forthe financial services industry worldwide, RBC has continuedto demonstrate the resilience and prudent management thatshareholders count on. In RBC’s boardroom this period hasbeen marked by thoughtful analysis, active engagement withmanagement and shareholders, and openness to change.
Your board has responded with a sharp focus on the oversightof key risks, while continuing to apply its sound andprogressive governance practices and policies.Comprehensive discussion and analysis of exposures tocomplex risks and reviews of the quality and adequacy of riskcontrols throughout the year positioned directors to carefullyassess the ability of RBC to execute its business strategy in arapidly changing business and regulatory environment. Weactively engage in reviewing the organization’s risk profilerelative to its risk appetite and provide advice and support tothe senior management team in their effort to continuouslyenhance the strength of RBC’s risk capabilities. This includesoverseeing a structured approach to defining the type andamount of risk that is appropriate to accept and seeking toensure there is an appropriate balance of return for the risksthat are prudently assumed. The impact of our stewardship inthis area translates into a strong, enterprise-wide riskmanagement culture, supported by risk managementpractices and frameworks that have proven to be effective androbust.
This response has been enabled by the diverse and broadbusiness expertise represented on the Board of Directorswhich has been augmented by our continuing directoreducation program. Over the past year, in addition topresentations on the organization’s risk profile and appetite,and methodologies used in assessing and controlling complexrisks, these education sessions have emphasized liquidityand funding risk management, accounting standards, andgovernance and compensation, further equipping directors toprovide current and knowledgeable advice to management.
Your Board of Directors has long been proactive in adoptingbest practice compensation principles and processes, but thepast year has seen particular attention paid to the governanceand controls in place for executive compensation. RBC’sapproach to compensation governance aligns with thePrinciples for Sound Compensation Practices issued this yearby the Financial Stability Board, the forum of internationalregulators created by the G20 to promote financial stability.While pay for performance remains a key principleunderpinning long term shareholder value creation, we remainequally committed to ensuring our compensation programdesign and governance practices align with sound riskmanagement principles.
Transparency is another fundamental aspect of goodgovernance. Your board takes seriously RBC’s commitment toshareholder engagement and clear and comprehensivedisclosure. The coming year will mark shareholders’ firstopportunity to participate in a “say on pay” advisory vote onthe executive compensation report in our 2010 proxy circular.The Board of Directors believes shareholders should have theopportunity to review and fully understand the objectives,philosophy and principles that the board has used to makecompensation decisions and is confident shareholders willreview the compensation disclosure thoughtfully. In additionto the advisory vote, the board looks forward to direct andconstructive interaction with shareholders on this and otherimportant issues.
As Chairman, my goal is to instill a common vision andprovide leadership for your Board of Directors, advancing ourdynamic approach to corporate governance. The board isproud to be actively engaged in the achievements of RBC andextends appreciation to management and employees aroundthe world for their contributions to the success of theorganization. While continuing to operate in a challengingenvironment, the Board of Directors, management andemployees remain focused on enhancing the stability andstrength of RBC and creating value for shareholders.
On behalf of the Board of Directors,
David P. O’BrienChairman of the Board
4 Royal Bank of Canada: Annual Report 2009 Chairman’s message

MANAGEMENT’S DISCUSSION AND ANALYSIS
Management’s discussion and analysis (MD&A) is provided to enable a reader to assess our results of operations and financial conditionfor the fiscal year ended October 31, 2009, compared to the preceding two years. This MD&A should be read in conjunction with ourConsolidated Financial Statements and related notes and is dated December 3, 2009. All amounts are in Canadian dollars, unlessotherwise specified, and are based on financial statements prepared in accordance with Canadian generally accepted accountingprinciples (GAAP), unless otherwise noted.
Additional information about us, including our 2009 Annual Information Form, is available free of charge on our website at rbc.com/investorrelations, on the Canadian Securities Administrators’ website at sedar.com and on the EDGAR section of the United StatesSecurities and Exchange Commission’s (SEC) website at sec.gov.
6 Overview6 Selected financial and other
highlights7 About Royal Bank of Canada7 Vision and strategic goals8 Overview and outlook
10 Financial performance10 Overview11 Results of operations
14 Quarterly financial information14 Fourth quarter 2009
performance14 Results and trend analysis
16 Business segment results16 Results by business segment16 How we measure and report
our business segments17 Canadian Banking20 Wealth Management23 Insurance26 International Banking
28 Capital Markets31 Corporate Support
32 Results by geographic segment
33 Financial condition33 Condensed balance sheets33 Off-balance sheet arrange-
ments
37 Risk, capital and liquiditymanagement37 Overview40 Credit risk43 Credit quality performance45 Market risk47 Operational risk48 Capital management52 Liquidity and funding
management
54 Overview of other risks54 Reputation risk54 Regulatory and legal risk
55 Insurance risk55 Environmental risk56 Additional risk factors that
may affect future results
57 Additional financial information57 Total RBC available-for-sale
portfolio58 CICA section 3855 –
reclassification of securities toloans
59 Market environment impacts
61 Key performance and non-GAAPmeasures
63 Accounting and control matters
67 Related party transactions
68 Supplemental information
See our Glossary for definitions of terms usedthroughout this document.
Caution regarding forward-looking statementsFrom time to time, we make written or oral forward-looking statementswithin the meaning of certain securities laws, including the “safeharbour” provisions of the United States Private Securities LitigationReform Act of 1995 and any applicable Canadian securities legislation.We may make forward-looking statements in this document, in otherfilings with Canadian regulators or the SEC, in reports to shareholdersand in other communications. Forward-looking statements in thisdocument include, but are not limited to, statements relating to ourmedium-term objectives, our vision and strategic goals, the 2010economic and market outlook for the Canadian, U.S. and globaleconomies, the outlook and priorities for each of our businesssegments, and liquidity and funding management. The forward-lookinginformation contained in this document is presented for the purpose ofassisting the holders of our securities and financial analysts inunderstanding our financial position and results of operations as atand for the periods ended on the dates presented and our vision andstrategic goals and medium-term objectives, and may not be appro-priate for other purposes. Forward-looking statements are typicallyidentified by words such as “believe”, “expect”, “forsee”, “forecast”,“anticipate”, “intend”, “estimate”, “goal”, “plan” and “project” andsimilar expressions of future or conditional verbs such as “will”,“may”, “should”, “could” or “would”.
By their very nature, forward-looking statements require us tomake assumptions and are subject to inherent risks anduncertainties, which give rise to the possibility that our predictions,forecasts, projections, expectations or conclusions will not prove tobe accurate, that our assumptions may not be correct and that ourmedium-term objectives, vision and strategic goals will not beachieved. We caution readers not to place undue reliance on thesestatements as a number of risk factors could cause our actual resultsto differ materially from the expectations expressed in such forward-looking statements. These factors – many of which are beyond ourcontrol and the effects of which can be difficult to predict – include:credit, market, operational and liquidity and funding risks, and other
risks discussed in the Risk, capital and liquidity management andOverview of other risks sections; general business, economic andfinancial market conditions, including the ongoing impact from themarket environment, the lack of liquidity in certain markets, the levelof activity and volatility of the capital markets and recessionaryconditions in Canada, the United States and certain other countries inwhich we conduct business; changes in accounting standards,policies and estimates, including changes in our estimates ofprovisions, allowances and valuations; the effects of changes ingovernment fiscal, monetary and other policies; the effects ofcompetition in the markets in which we operate; the impact of changesin laws and regulations, including tax laws; judicial or regulatoryjudgments and legal proceedings; the accuracy and completeness ofinformation concerning our clients and counterparties; our ability tosuccessfully execute our strategies and to complete and integratestrategic acquisitions and joint ventures successfully; anddevelopment and integration of our distribution networks.
We caution that the foregoing list of risk factors is not exhaustiveand other factors could also adversely affect our results. When relyingon our forward-looking statements to make decisions with respect tous, investors and others should carefully consider the foregoingfactors and other uncertainties and potential events. Except asrequired by law, we do not undertake to update any forward-lookingstatement, whether written or oral, that may be made from time totime by us or on our behalf.
Additional information about these and other factors can befound in the Risk, capital and liquidity management and Overview ofother risks sections.
Information contained in or otherwise accessible through thewebsites mentioned does not form part of this document. Allreferences in this document to websites are inactive textual refer-ences and are for your information only.
Management’s Discussion and Analysis Royal Bank of Canada Annual Report 2009 5

Overview
Selected financial and other highlights Table 1
(C$ millions, except per share, number of and percentage amounts) 2009 2008 20072009 vs. 2008
Increase (decrease)
Total revenue $ 29,106 $ 21,582 $ 22,462 $ 7,524 34.9%Provision for credit losses (PCL) 3,413 1,595 791 1,818 114.0%Insurance policyholder benefits, claims and acquisition
expense (PBCAE) 4,609 1,631 2,173 2,978 182.6%Non-interest expense 14,558 12,351 12,473 2,207 17.9%Goodwill impairment charge 1,000 – – 1,000 n.m.Net income before income taxes and non-controlling interest
in subsidiaries 5,526 6,005 7,025 (479) (8.0)%Net income $ 3,858 $ 4,555 $ 5,492 $ (697) (15.3)%
Segments – net income (loss)Canadian Banking $ 2,663 $ 2,662 $ 2,545 $ 1 –Wealth Management 583 665 762 (82) (12.3)%Insurance 496 389 442 107 27.5%International Banking (1,446) (153) 242 (1,293) n.m.Capital Markets 1,768 1,170 1,292 598 51.1%Corporate Support (206) (178) 209 (28) n.m.
Net income $ 3,858 $ 4,555 $ 5,492 $ (697) (15.3)%
Selected informationEarnings per share (EPS) – basic $ 2.59 $ 3.41 $ 4.24 $ (.82) (24.0)%
EPS – diluted $ 2.57 $ 3.38 $ 4.19 $ (.81) (24.0)%Return on common equity (ROE) (1) 11.9% 18.1% 24.7% n.m. (620) bpsReturn on risk capital (RORC) (2) 19.5% 29.6% 37.4% n.m. (1,010) bpsNet interest margin (NIM) (3) 1.65% 1.39% 1.33% n.m. 26 bpsSpecific PCL to average net loans and acceptances .97% .53% .33% n.m. 44 bpsGross impaired loans (GIL) as a % of loans and acceptances 1.86% .96% .45% n.m. 90 bps
Capital ratios and multiples (4)
Tier 1 capital ratio 13.0% 9.0% 9.4% n.m. 400 bpsTotal capital ratio 14.2% 11.0% 11.5% n.m. 320 bpsAssets-to-capital multiple 16.3X 20.1X 20.0X (3.8)X n.m.Tangible common equity (Tier 1 common capital) ratio (5) 9.2% 6.5% n.m. 270 bps
Selected balance sheet and other informationTotal assets $ 654,989 $ 723,859 $ 600,346 $ (68,870) (9.5)%Securities 186,272 171,134 178,255 15,138 8.8%Retail loans (6) 205,224 195,455 169,462 9,769 5.0%Wholesale loans (6) 78,927 96,300 69,967 (17,373) (18.0)%Deposits 398,304 438,575 365,205 (40,271) (9.2)%Average common equity (1) 30,450 24,650 21,850 5,800 23.5%Average risk capital (2) 18,600 15,050 14,450 3,550 23.6%Risk-adjusted assets (4) 244,837 278,579 247,635 (33,742) (12.1)%Assets under management (AUM) 249,700 226,900 161,500 22,800 10.0%Assets under administration (AUA) – RBC 648,800 623,300 615,100 25,500 4.1%
– RBC Dexia IS (7) 2,484,400 2,585,000 2,713,100 (100,600) (3.9)%Common share information
Shares outstanding (000s) – average basic 1,398,675 1,305,706 1,273,185 92,969 7.1%– average diluted 1,412,126 1,319,744 1,289,314 92,382 7.0%– end of period 1,417,610 1,341,260 1,276,260 76,350 5.7%
Dividends declared per share $ 2.00 $ 2.00 $ 1.82 $ – n.m.Dividend yield (8) 4.8% 4.2% 3.3% n.m. 60 bpsCommon share price (RY on TSX) – close, end of period $ 54.80 $ 46.84 $ 56.04 $ 7.96 17.0%Market capitalization (TSX) 77,685 62,825 71,522 14,860 23.7%
Business information (number of)
Employees (full-time equivalent) 71,186 73,323 64,815 (2,137) (2.9)%Bank branches 1,761 1,741 1,541 20 1.1%Automated teller machines (ATM) 5,030 4,964 4,419 66 1.3%Period average US$ equivalent of C$1.00 (9) $ .858 $ .969 $ .915 $ (.111) (11.5)%Period-end US$ equivalent of C$1.00 .924 .830 1.059 .09 11.3%
(1) Average common equity and ROE are calculated using methods intended to approximate the average of the daily balances for the period.(2) Average amounts are calculated using methods intended to approximate the average of the daily balances for the period. For further discussion on Average risk capital and RORC, refer to the
Key performance and non-GAAP measures section.(3) NIM is calculated as Net interest income divided by Average assets. Average assets are calculated using methods intended to approximate the average of the daily balances for the period.(4) 2009 and 2008 capital ratios and risk-adjusted assets were calculated using the Basel II framework, 2007 capital ratios and risk-adjusted assets were calculated using the Basel I framework,
Basel I and Basel II are not directly comparable. For further discussion about Basel II, refer to the Capital management section.(5) For further discussion, refer to the Key performance and non-GAAP measures section.(6) Retail and wholesale loans do not include allowance for loan losses.(7) Represents the total AUA of the joint venture, of which we have a 50% ownership interest, reported on a one-month lag.(8) Defined as dividends per common share divided by the average of the high and low share price in the relevant period.(9) Average amounts are calculated using month-end spot rates for the period.n.m. not meaningful
6 Royal Bank of Canada: Annual Report 2009 Management’s Discussion and Analysis

About Royal Bank of Canada
Royal Bank of Canada (RY on TSX and NYSE) and its subsidiariesoperate under the master brand name RBC. We are Canada’s largestbank as measured by assets and market capitalization, and amongthe largest banks in the world, based on market capitalization. We areone of North America’s leading diversified financial servicescompanies, and provide personal and commercial banking, wealthmanagement services, insurance, corporate and investment banking
and transaction processing services on a global basis. We employapproximately 80,000 full- and part-time employees who serve morethan 18 million personal, business, public sector and institutionalclients through offices in Canada, the U.S. and 53 other countries.Our five business segments, listed below, are supported by CorporateSupport.
ROYAL BANK OF CANADA
Canadian Banking Wealth Management Insurance International Banking Capital Markets
• Personal FinancialServices
• Business FinancialServices
• Cards andPayment Solutions
• Canadian WealthManagement
• U.S. & InternationalWealthManagement
• Global AssetManagement
• Canadian Insurance
• U.S. Insurance
• International &Other Insurance
• Banking
• RBC Dexia IS
• Capital MarketsSales and Trading
• Corporate andInvestment Banking
Corporate Support
• Operations • Technology • Functions
Vision and strategic goals
Our business strategies and actions are guided by our vision of“Always earning the right to be our clients’ first choice.”
Our clear commitment to our vision and long-term strategyreflects our diversified business model, our strong balance sheet, acomprehensive approach to risk management, and an approach thatputs the client at the centre of all our business activities. As we
continually strive to be a top performing bank that delivers sustain-able, profitable growth and top quartile results for our shareholders,we are focused on our three strategic goals outlined below. Wecontinued to make progress on these goals, as highlighted in thefollowing table, despite the challenging economic and marketconditions that persisted in 2009.
Strategic goals Progress made during 2009
In Canada, our goal is to bethe undisputed leader infinancial services.
• Announced the WestJet RBC MasterCard, a new travel rewards card offering rewards to clients whotravel in North America and the Caribbean on WestJet. This will make us the first large Canadianfinancial institution to offer both MasterCard and Visa.
• Launched RBC International Remittance, a new remittance service that gives Canadian clients aneconomical and secure means to transfer money in various currencies to family and friends abroad.
• Introduced ‘Practice Accounts’ through RBC Direct Investing, allowing clients to experiment withinvestment strategies without putting their own money at risk. This is the first integrated offering of itskind by a Canadian self-directed brokerage.
• Continued to be the largest mutual fund company in Canada with 16% market share, $2.1 billion inlong-term net sales (31% of industry), and were named by Lipper as best overall in Fixed Income in2009.
• Continued to be ranked #1 overall among Canadian bank-owned brokerage firms in InvestmentExecutive’s annual Brokerage Report Card. RBC Dominion Securities ranked first in 22 of the31 categories, including overall satisfaction, products and support for high net worth clients, freedomto make objective product choices, as well as the firm’s stability, strategic focus, corporate cultureand ethics.
• Introduced a new universal life product in our insurance business, to be sold through ourindependent insurance advisors in order to further strengthen our competitive positioning in thebrokerage market.
• Expanded our retail insurance network to 49 branches with 14 locations opening in 2009, providingour clients with more convenient access to insurance services.
In the U.S., our goal is to be aleading provider of capitalmarkets, wealth managementand banking services bybuilding on and leveragingour considerable capabilities.
• Built a significant U.S. dollar fixed income and currencies presence, expanded our equity sales andtrading businesses, and were designated a U.S. primary dealer by the Federal Reserve Bank ofNew York.
• Announced an agreement to acquire J.P. Morgan’s Third Party Registered Investment Advisory (RIA)Servicing Business to expand the breadth and depth of our custody and clearing services (1).Recruited a record number of experienced financial consultants from the competition.
• Began restructuring our U.S. banking business to improve effectiveness and efficiency, with a focuson providing our clients with superior service and choice of products.
Management’s Discussion and Analysis Royal Bank of Canada: Annual Report 2009 7

Strategic goals Progress made during 2009
Outside North America, ourgoal is to be a premierprovider of select capitalmarkets, wealth managementand banking services inmarkets of choice.
• Named Best Overall Credit House in Europe, Best Bank for Sterling Bonds, Best Bank for Non-CoreCurrency Bonds and Best Bank for Electronic Trading in Credit magazine’s 2009 European CreditAwards. We also ranked in the top 10 in six other categories.
• Completed our acquisition of Mourant Private Wealth, an institutional private client trust businesswith operations in Jersey, Dubai and Cayman. This aligns with our strategy of providing integratedglobal wealth management services to international clients.
• Continued to make progress with the integration of our RBTT Financial Group (RBTT) acquisition andopened our new Caribbean headquarters in Trinidad.
• Our joint venture, RBC Dexia Investor Services (RBC Dexia IS), announced an agreement with Unionedi Banche Italiane Scpa (UBI) to acquire UBI Banca’s depositary bank business, which will make RBCDexia IS the largest third party fund administrator and the fourth largest depositary bank in Italy (1).
(1) These acquisitions are subject to regulatory approvals and other customary closing conditions.
Overview and outlook
2009 Economic and market review – data as at December 3, 2009The Canadian economy contracted by an annualized 4.8% on averageover the first two calendar quarters of 2009, mainly reflectingdecreased consumer and business spending, rising levels ofunemployment which exerted additional pressure on household andbusiness credit quality throughout the year and weakness in housingand auto production. Exports have fallen as a result of lower U.S.demand, in part as a result of the restructuring of the North Americanauto sector.
In response, the Bank of Canada reduced the overnight rate tothe historically low rate of .25% and the federal governmentintroduced a fiscal stimulus package in the form of acceleratedspending on infrastructure and tax cuts. Signs of recovery emerged inthe third calendar quarter evidenced by gross domestic product (GDP)annualized growth of .4%, supported by improvements in consumerspending, particularly in durable goods, reflecting a surge in autosales, and renewed consumer confidence. Financial markets stabi-lized and the housing market retraced losses recorded in late 2008and the early part of 2009. The Canadian dollar has appreciatedagainst most major currencies since early 2009 driven largely byhigher commodity prices and investor movement away from U.S.dollar assets.
The U.S. economy remained in recession in 2009 by contracting3.6% on average over the first calendar half of 2009, reflecting weakconsumer and business spending, high levels of unemployment,deterioration in housing and financial markets and tightened creditconditions. In response, the Federal Reserve lowered the funds rate by75 basis points (bps) in December 2008, and has held it at a histor-ically low range of 0% to .25% throughout 2009. The U.S. governmentalso approved additional fiscal stimulus. Signs of recovery emerged inthe third calendar quarter of 2009 with GDP rising at an annualizedrate of 2.8% from the previous quarter reflecting improvements inconsumer spending, and in the housing market. However, commercialreal estate remained weak throughout 2009.
Most global economies continued to deteriorate in early 2009 asdomestic demand and global trade declined. Early recovery emergedin the second calendar quarter for most of the Eurozone, as Franceand Germany posted positive growth. Although the pace of declineslowed in the U.K., the economy was still under pressure during thethird calendar quarter. Emerging economies, particularly in China andAsia, recovered strongly in 2009.
Global capital markets remained under pressure and exhibitedsignificant volatility during early 2009. However, in the latter part of2009, global capital markets improved and volatility moderated ascompared to the prior year, reflecting the expectation of a sustainedglobal economic recovery. Credit spreads for us and many issuershave narrowed, reflecting the general improvement in fundingmarkets as a result of government initiatives and improved investorconfidence. Senior debt markets and other funding sources haveimproved in terms of pricing and capacity while government funding
programs were reduced. For further information, refer to the Liquidityand funding management section.
Medium-term objectivesWe established medium-term (3 to 5 years) objectives last year toalign with our three strategic goals and reflect our longer-term view offinancial performance taking into account the constantly changingeconomic and market environment. By focusing on the execution ofour medium-term objectives in our decision-making we believe wewill be well positioned to provide sustainable earnings growth andreturns to shareholders.
2009 Progress on medium-term objectivesOur objectives over the medium term are summarized in the tablebelow and these objectives continue to reflect our commitment tostrong earnings growth, prudent cost management and return oninvestment in our businesses, as well as sound and effective risk, andcapital management. Our progress towards these objectives isdiscussed below.
2009 Progress on medium-term objectives Table 2
Medium-termobjectives
2009Progress
Diluted EPS growth 7% + (24)%Defined operating leverage (1) > 3% 3.5%ROE 18% + 11.9%Tier 1 capital ratio 8.5% + 13.0%Dividend payout ratio 40% - 50% 78%
(1) Our defined operating leverage is a non-GAAP measure and refers to the differencebetween our revenue growth rate (as adjusted) and non-interest expense growth rate (asadjusted). For further information, refer to the Key performance and non-GAAP measuressection.
We compared unfavourably to our medium-term objectives for dilutedEPS growth, ROE and dividend payout ratio. Diluted EPS growth and ROEobjectives were largely impacted by a high level of credit lossesreflecting weak economic and market conditions, a goodwill impairmentcharge, as well as the dilutive effect of the common and preferred shareissuances. These factors were partially offset by solid earnings driven bystronger trading revenue in certain of our capital markets businessesand volume growth in our banking-related businesses.
These factors also impacted our dividend payout ratio as ourlevel of dividends remained unchanged in 2009 although earningsdecreased.
Our defined operating leverage of 3.5% compared favourably in2009 to our medium-term objective, mainly reflecting strong tradingrevenue and our ongoing commitment to prudent cost management.If we exclude the reduction of the Enron Corp.-related litigationprovision of $542 million in 2008 from non-interest expense, as this
8 Royal Bank of Canada: Annual Report 2009 Management’s Discussion and Analysis

is not reflective of our normal course operating expenses, our definedoperating leverage is 8.2%. Our capital position remained strong asour Tier 1 capital ratio was comfortably above our objective, largelydue to the issuance of $4.8 billion of capital during the year.
In 2009, we continued to measure our Total Shareholder Return(TSR) and other financial metrics against our North American peergroup (1) and maintained our focus on maximizing shareholder value.TSR is a concept used to compare the performance of our commonshares over a period of time, reflecting share price appreciation anddividends paid to common shareholders. The absolute size of the TSRwill vary depending on market conditions, but the relative positionreflects the market’s perception of a company’s overall performancerelative to its peers over a period of time. Our three- and five-yearaverage annual TSR of 8% (2) and 16% (2), respectively, ranked us inthe first quartile within our peer group for both periods. The three-and five-year average annual TSR for our peer group was (13)% and(4)%, respectively (2).
As a result of changes in the financial services industry over thepast several years, including mergers and acquisitions, andconsidering our performance and evolving global strategy, we recentlycompleted a re-evaluation of our peer group with the goal of ensuringthat we include only those institutions in the financial services
industry globally, that we consider most relevant to us ascompetitors. Our new peer group will be effective in 2010 (3).
(1) Our North American peer group for 2009 consists of 19 financial institutions(18 excluding us: seven large Canadian financial institutions (Bank of Montreal,Canadian Imperial Bank of Commerce, Manulife Financial Corporation, National Bank ofCanada, The Bank of Nova Scotia, Sun Life Financial Inc., and the Toronto DominionBank), and eleven U.S. financial institutions (BB&T Corporation, Bank of AmericaCorporation, The Bank of New York Mellon Corporation, Fifth Third Bancorp, J.P. MorganChase & Co., KeyCorp, Northern Trust Corporation, The PNC Financial Services Group,Sun Trust Banks Inc., U.S. Bancorp and Wells Fargo & Company),
(2) The three-year average annual TSR is calculated based on our common share priceappreciation plus reinvested dividend income for the period October 31, 2006 toOctober 31, 2009. The five-year average annual TSR is calculated based on the periodOctober 31, 2004 to October 31, 2009 and is based on information as disclosed byBloomberg L.P.
(3) Our new global peer group will consist of 20 financial institutions (19 excluding us –seven large Canadian financial institutions (Bank of Montreal, Canadian Imperial Bankof Commerce, Manulife Financial Corporation, National Bank of Canada, Power FinancialCorporation, The Bank of Nova Scotia and The Toronto-Dominion Bank), five U.S.financial institutions (Bank of America Corporation, JPMorgan Chase & Co., The Bank ofNew York Mellon Corporation, U.S. Bancorp and Wells Fargo & Company), five Europeanfinancial institutions (Banco Bilbao Vizcaya Argentaria Group (BBVA), Barclays PLC, BNPParibas, Credit Suisse Group AG and Deutsche Bank Group) and two Australian financialinstitutions (National Australia Bank and Westpac Banking Corporation).
Total shareholder return Table 3
Five-yearFor the year ended October 31 2009 2008 2007 2006 2005 CAGR (1)
Common share price (RY on TSX) - close, end of period $ 54.80 $ 46.84 $ 56.04 $ 49.80 $ 41.67 11.6%Dividends paid per share 2.00 2.00 1.72 1.32 1.13 15.3%Increase (decrease) in share price 17.0% (16.4)% 12.5% 19.5% 31.4%Total shareholder return (2) 22.7% (12.8)% 16.2% 23.2% 35.4%
(1) Compound annual growth rate (CAGR).(2) Total shareholder return assumes reinvestment of dividends and therefore does not equal the sum of dividends paid per share and share price increase (decrease) in the table.
Impact of foreign exchange rates on our resultsOur U.S. dollar-denominated results are impacted by fluctuations inthe Canadian/U.S. dollar exchange rate as shown in the table below.Revenue, provision for credit losses (PCL), expenses and incomedenominated in U.S. dollars are translated at the average rate ofexchange for the year.
While the Canadian dollar strengthened in the latter half of theyear, it depreciated 11% on average relative to the U.S. dollar from ayear ago, which had an unfavourable impact on our consolidated netincome in 2009. Our U.S. dollar-denominated revenue, which wasfavourably impacted by the depreciation of the Canadian dollar, wasmore than offset by the unfavourable impact on our U.S. dollar-denominated PCL, Insurance policyholder benefits, claims andacquisition expense (PBCAE) and non-interest expense.
Impact of the U.S. dollar on our consolidated results Table 4
(C$ millions, except per share amounts)
2009 vs.2008
2008 vs.2007
Canadian/U.S. dollar exchange rate (average)2009 $ .8582008 .969 $ .9692007 .915Percentage change in average US$ equivalent of
C$1.00 (1) (11)% 6 %Increased (decreased) total revenue $ 636 $ (340)Increased (decreased) PCL 94 –Increased (decreased) non-interest expense 498 (210)Increased (decreased) net income (84) (90)Increased (decreased) basic EPS $ (.06) $ (.07)Increased (decreased) diluted EPS $ (.06) $ (.07)
(1) Average amounts are calculated using month-end spot rates for the period.
Certain of our business segment results are impacted by fluctuationsin the U.S. dollar, Euro and British pound exchange rates relative tothe Canadian dollar. Wealth Management, International Banking andCapital Markets each have significant U.S. dollar-denominatedoperations, while International Banking and Capital Markets alsohave significant Euro- and British pound-denominated results,
respectively. The Canadian dollar depreciated 4% on average relativeto the Euro and appreciated 10% on average relative to the Britishpound compared to a year ago. For further details on the impact to oursegments, refer to the Business segment results section.
2010 Economic and market outlook – data as at December 3, 2009The Canadian economy is expected to grow at 2.6% in 2010, reflectingincreased consumer spending, improvements in the U.S. economy,continued low borrowing costs and fiscal stimulus. Recovery inconsumer spending is expected to improve as households’ asset valuesare projected to increase reflecting continued stabilization in financialand housing markets. We anticipate credit quality to remain underpressure with some improvement, as we anticipate the unemploymentrate to peak early in 2010. We expect business spending will lag theinitial recovery as excess capacity remains but will rebound in the latterhalf 2010. We expect inflation pressures will be subdued during 2010 asthe recovery is expected to be gradual. A strong Canadian dollar relativeto the U.S. dollar is projected reflecting higher expected commodityprices and continued investor movement away from U.S. dollar assets.The Bank of Canada has made a conditional commitment to keepinterest rates at .25% until the end of the second calendar quarter of2010. We expect 50-basis-point increases by the Bank of Canada in boththe third and fourth calendar quarters of 2010 as the expected recoverybecomes further entrenched.
The U.S. economy is projected to grow by 2.5% in 2010 reflectinga modest increase in consumer spending and further stabilization inthe housing market. We anticipate the pace of consumer spending tobe slow as households repair balance sheets and will likely face toughlabour conditions throughout 2010. Credit quality is expected tocontinue to be weak in the U.S. but should begin to stabilize through2010 reflecting modest improvements in consumer and businessspending and continued improvement in financial markets. Thecombination of government spending and improvements in businessinvestment are expected to stabilize labour markets. We anticipatethat the Federal Reserve will hold the federal funds rate at the currentrange until late 2010 and that the U.S. dollar will continue to weakenin 2010 against most major currencies, as a result of the expectedslow recovery and weak fiscal position.
Management’s Discussion and Analysis Royal Bank of Canada: Annual Report 2009 9

We expect a gradual recovery in global economies in 2010 withsignificant divergence between the pace of growth in advanced andemerging economies. A slower recovery is anticipated in the U.K. andEurozone reflecting modest export growth resulting from therebalancing of global demand, high unemployment and tightenedcredit conditions as banks continue to deleverage their balancesheets. We anticipate solid growth in China reflecting continued fiscalstimulus, increased domestic demand, and modest export growth,which will lead growth in emerging economies.
We project global capital markets will continue to stabilize andcredit spreads will tighten further as the global economic recoverycontinues and access to credit improves.
As a result of the previous market disruption and related stresson the global financial system, it is expected that global financialinstitutions will be confronted by increased regulation, higher capitalrequirements and new leverage requirements.
These predictions and forecasts are based on information andassumptions from sources we consider reliable. If this information orthese assumptions are not accurate, actual economic outlooks maydiffer materially from the outlook presented in this section.
Financial performance
Overview
2009 vs. 2008We reported net income of $3,858 million for the year endedOctober 31, 2009, compared to $4,555 million a year ago, a decreaseof 15%, mainly reflecting a goodwill impairment charge of $1 billion(US$838 million) on both a pre-tax and after-tax basis. This was anon-cash item and did not affect our ongoing operations or ourcapital ratios. Diluted earnings per share (EPS) were $2.57 down 24%from a year ago. Return on common equity (ROE) was 11.9%,compared to 18.1% a year ago.
Excluding the goodwill impairment charge, adjusted net incomewas $4,858 million. Adjusted diluted EPS were $3.28, down $.10, or3%, and adjusted ROE was 14.9%, reflecting the dilutive effect ofcommon and preferred share issuances, mainly in the early part of theyear. The increase of $303 million, or 7%, in adjusted net income wasdriven by stronger trading revenue, which included lower marketenvironment-related losses on held-for-trading (HFT) instruments,partially offset by higher related variable compensation in certain ofour capital markets businesses. Higher net securitization gains, solidgrowth in our banking-related businesses, partly reflecting our prioryear acquisitions, volume growth in our insurance businesses andlower market environment-related losses on available-for-sale (AFS)instruments also contributed to the increase. These factors werepartially offset by losses on fair value adjustments on certain RBC debtdesignated as HFT and losses on credit default swaps used toeconomically hedge the corporate lending portfolio as compared togains in the prior year, higher provision for credit losses, increasedcosts in support of business growth, including from our acquisitions,and a higher effective tax rate.
Last year, our results included the favourable impact of$542 million ($252 million after-tax and related compensationadjustments) related to the reduction of the Enron Corp-relatedlitigation provision. Our Tier 1 capital ratio of 13.0% was up 400 bpsfrom 9.0% a year ago. Adjusted measures are non-GAAP measures.For a detailed discussion on adjusted measures, refer to the Keyperformance and non-GAAP measures section.
Summary of 2008 and 2007In 2008, net income was $4,555 million, down 17% from 2007. Thisprimarily reflected higher total market environment-related netlosses. Higher PCL, weaker equity origination activity and higher costsin support of business growth also contributed to the decrease in netincome. Our results in 2007 also included a $326 million ($269million after-tax) gain related to the Visa Inc. restructuring. Thesefactors were partly offset by the reduction of the Enron-relatedlitigation provision and solid volume growth in our banking-relatedand wealth management businesses, partly reflecting our acquis-itions, the impact of which was partially offset by spreadcompression. Higher trading revenue also partly offset the decrease.
In 2007, net income was $5,492 million, up 16% from 2006. Ourstrong results were largely attributable to volume growth in ourbanking and wealth management businesses, strong insuranceresults, increased equity and foreign exchange and commoditiestrading results and strong equity origination activity, as well as thegain related to the Visa Inc. restructuring. These factors were partlyoffset by market environment-related losses in 2007 and higher PCL.
10 Royal Bank of Canada: Annual Report 2009 Management’s Discussion and Analysis

Results of operations Table 5
(C$ millions) 2009 2008 (1) 2007
Interest income $ 20,543 $ 25,032 $ 26,547Interest expense 9,037 15,984 18,845
Net interest income 11,506 9,048 7,702
Investments (2) 4,270 4,697 4,405Insurance (3) 5,718 2,609 3,152Trading 2,671 (96) 1,999Banking (4) 3,456 3,076 2,620Underwriting and other advisory 1,050 875 1,217Other (5) 435 1,373 1,367
Non-interest income 17,600 12,534 14,760
Total revenue 29,106 21,582 22,462
PCL 3,413 1,595 791Insurance PBCAE (3) 4,609 1,631 2,173Non-interest expense 14,558 12,351 12,473Goodwill impairment charge 1,000 – –
Income before income taxes 5,526 6,005 7,025Income taxes 1,568 1,369 1,392Non-controlling interest in net income of subsidiaries 100 81 141
Net income $ 3,858 $ 4,555 $ 5,492
Additional informationTotal trading revenue (6)
Net interest income – related to trading activities $ 2,294 $ 686 $ (220)Non-interest income – trading revenue 2,671 (96) 1,999
Total $ 4,965 $ 590 $ 1,779
Total trading revenue by product (6)
Interest rate and credit $ 3,304 $ (259) $ 640Equities 1,008 265 784Foreign exchange and commodities 653 584 355
Total $ 4,965 $ 590 $ 1,779
Average assets $ 695,300 $ 650,300 $ 581,000Net interest margin (NIM) 1.65% 1.39% 1.33%Effective tax rate (7) 28.4% 22.8% 19.8%
(1) Certain trading revenue reported in Capital Markets was reclassified from Non-interest income – Trading revenue to Net interest income to better reflect its nature. There was no impact toTotal revenue as a result of this reclassification.
(2) Includes securities brokerage commissions, investment management and custodial fees, and mutual funds.(3) Includes premiums, investment and fee income. Investment income includes the change in fair value of investments backing policyholder liabilities and is largely offset in PBCAE.(4) Includes service charges, foreign exchange revenue other than trading, card service revenue and credit fees.(5) Includes other non-interest income, net gain (loss) on available-for-sale (AFS) securities (other-than-temporary impairment and realized gain/loss), fair value adjustments on certain RBC debt
designated as HFT, the change in fair value of certain derivatives related to economic hedges and securitization revenue.(6) Total trading revenue comprises trading-related revenue recorded in Net interest income and Non-interest income.(7) Income taxes as a percentage of net income before income taxes.
Total revenue2009 vs. 2008Total revenue increased $7,524 million, or 35%, from a year ago.
Net interest income increased $2,458 million, or 27%, largelydue to lower funding costs on certain trading positions. Loan anddeposit growth, largely due to solid volume growth in our Canadianbanking businesses, and a full year of revenue from our RBTTacquisition, and to a lesser extent, our Alabama NationalBanCorporation (ANB) acquisition, also contributed to the increase.These factors were partially offset by spread compression in ourbanking-related and wealth management businesses reflectinghistorically lower interest rates and higher impaired loan balances,largely in U.S. banking. Net interest margin of 1.65% was up 26 bps.
Investments-related revenue decreased $427 million, or 9%,mainly due to lower fee-based client assets and lower mutual funddistribution fees, partially offset by higher transaction volumes.
Insurance-related revenue increased $3,109 million, largely dueto the change in fair value of investments backing our life and healthpolicyholder liabilities and increased annuity volumes, both of whichwere largely offset by higher related PBCAE. Volume growth across allbusinesses also contributed to the increase. For further details, referto the Insurance segment section.
Trading revenue in Non-interest income increased $2,767million. Total trading revenue, which comprises trading-relatedrevenue recorded in Net interest income and Non-interest income,was $4,965 million, up $4,375 million. Stronger trading revenue,which included lower market-environment related losses on HFTinstruments, benefitted from favourable market opportunities,including a historically low interest rate environment and increasedclient activity. Gains on credit valuation adjustments on certainderivative contracts as compared to losses in the prior year alsocontributed to the increase. For further details, refer to the Marketenvironment impacts section.
Banking revenue was up $380 million, or 12%, mainly due toimproved results in our client-based securitization activity andlending businesses in Capital Markets, higher service fee revenueacross banking-related businesses, and a favourable adjustmentrelated to our credit card customer loyalty reward program liability.
Underwriting and other advisory revenue increased $175 million,or 20%, mainly due to higher equity and debt origination activities,partially offset by lower mergers and acquisitions (M&A) activity.
Other revenue was down $938 million, primarily due to losses onthe fair value adjustments on certain RBC debt designated as HFT ascompared to gains in the prior year in Capital Markets and CorporateSupport, reflecting the tightening of our credit spreads. Losses oncredit default swaps recorded at fair value used to economically
Management’s Discussion and Analysis Royal Bank of Canada: Annual Report 2009 11

hedge certain corporate loan portfolios as compared to gains in theprior year in Capital Markets also contributed to the decrease. Netlosses on AFS securities increased $8 million from the prior year,which included a loss of $144 million on certain Canadian bankcommon shares in the latter part of 2009 which more than offset thedecrease in market environment-related losses. These factors werepartially offset by higher securitization revenue of $708 millionpredominantly attributable to Corporate Support reflecting a higherthan historical level of securitization activity from our participation ingovernment-sponsored funding programs. A gain, as compared to aloss in the prior year, on our stock based compensation plan in ourU.S. brokerage business also contributed to the increase. For furtherdetails about our loss on certain Canadian bank common shares,refer to Note 3 to our Consolidated Financial Statements.
Our revenue for the year was favourably impacted by the weakerCanadian dollar relative to the U.S. dollar. For further details, refer tothe Impact of foreign exchange rates on our results section.
2008 vs. 2007Total revenue decreased $880 million, or 4%, from 2007.
Net interest income increased $1,346 million, or 17%, largelydriven by lower funding costs on certain trading positions, and solidloan and deposit growth in Canadian Banking, partially offset byspread compression.
Investments-related revenue increased $292 million, or 7%,primarily due to increased fee-based and transaction revenue as aresult of our acquisitions, and solid growth in fee-based client assets.
Insurance-related revenue decreased $543 million, or 17%,mainly reflecting the change in fair value of investments backing ourlife and health policyholder liabilities, largely offset in PBCAE.Investment losses and lower annuity volumes also contributed to thedecrease. These factors were partially offset by solid growth in ourreinsurance and Canadian businesses.
Trading revenue in Non-interest income decreased by $2,095million. Total trading revenue was $590 million, down $1,189 million,or 67%, largely due to market environment-related losses on HFTsecurities.
Banking revenue was up $456 million, or 17%, mainly due to acredit card customer loyalty reward program liability charge in 2007,improved results in our syndicated finance business, and higherforeign exchange revenue.
Underwriting and other advisory revenue decreased$342 million, or 28%, mainly due to weak equity origination andlower M&A activities.
Other revenue was flat compared to 2007. The gain on fair valueadjustments on RBC debt designated as HFT, as well as higher gainson credit default swaps recorded at fair value used to economicallyhedge our corporate lending portfolio favourably impacted revenue.These factors were offset by market environment-related losses onAFS securities, and the Visa Inc. restructuring gain recorded in 2007.
Our revenue was also unfavourably impacted by the strongerCanadian dollar relative to the U.S. dollar.
Change in net interest income (1) Table 6
2009 vs. 2008 2008 vs. 2007Increase (decrease)due to changes in
Increase (decrease)due to changes in
(C$ millions)Average
volume (2)Averagerate (2) Net change
Averagevolume (2)
Averagerate (2) Net change
Assets
Deposits with other banksCanada $ 16 $ (24) $ (8) $ 7 $ (5) $ 2U.S. 15 (141) (126) 60 (99) (39)Other international (127) (75) (202) 114 (117) (3)
SecuritiesTrading (378) (443) (821) (525) (1,234) (1,759)Available-for-sale 448 (343) 105 309 447 756
Asset purchased under reverse repurchase agreementsand securities borrowed (801) (1,157) (1,958) (165) (566) (731)
LoansCanada
Retail 681 504 1,185 998 (2,934) (1,936)Wholesale (204) (1,060) (1,264) 275 1,121 1,396
U.S. 385 (769) (384) 684 (763) (79)Other international 329 (1,345) (1,016) 375 503 878
Total interest income $ 364 $ (4,853) $ (4,489) $ 2,132 $ (3,647) $ (1,515)
Liabilities
DepositsCanada $ 221 $ (1,698) $ (1,477) $ 244 $ (1,490) $ (1,246)U.S. 161 (1,141) (980) 115 (920) (805)Other international (540) (2,399) (2,939) 1,654 (1,215) 439
Obligations related to securities sold short (265) 26 (239) (54) (418) (472)Obligations related to assets sold under repurchase
agreements and securities loaned 4 (1,208) (1,204) (303) (448) (751)Subordinated debentures 9 (13) (4) 24 (8) 16Other interest-bearing liabilities (1) (103) (104) 37 (79) (42)Total interest expense $ (411) $ (6,536) $ (6,947) $ 1,717 $ (4,578) $ (2,861)Net interest income $ 775 $ 1,683 $ 2,458 $ 415 $ 931 $ 1,346
(1) Geographic classification for selected assets and liabilities is based on the domicile of the booking point of the subject assets and liabilities.(2) Volume/rate variance is allocated on the percentage relationship of changes in balances and changes in rates to the total net change in net interest income.
12 Royal Bank of Canada: Annual Report 2009 Management’s Discussion and Analysis
Net interest margin2009 vs. 2008Net interest margin was 1.65%, up 26 bps, largely reflecting lowerfunding costs on certain trading positions in Capital Markets, partiallyoffset by spread compression in our banking-related and wealthmanagement businesses. This reflected the historically low interestrate environment and the impact of changes in the Canadian retailproduct mix, resulting from higher volume growth in lower marginproducts. For further details, refer to Table 66 in the Supplementalinformation section.
2008 vs. 2007Net interest margin increased 6 bps, largely reflecting lower fundingcosts on certain trading positions in Capital Markets, largely offset byspread compression.
Provision for credit lossesCredit quality has deteriorated from the prior year consistent with theglobal economic cycle. For further details on our PCL, refer to the Risk,capital and liquidity management section.
2009 vs. 2008Total PCL of $3.4 billion increased $1.8 billion from a year ago,primarily attributable to increased specific provisions of $1.4 billion,mainly in our corporate loan portfolio, and in our U.S. banking andour Canadian unsecured retail and business lending portfolios. Anincrease in the general provision of $424 million, predominantlyrelated to U.S. banking and to a lesser extent, our U.S. corporatelending and Canadian retail and business lending portfolios, alsocontributed to the increase.
2008 vs. 2007Total PCL of $1.6 billion increased $804 million from 2007 reflectingincreased specific PCL of $648 million, largely attributable to higherimpaired loans in U.S. banking, mainly in our residential builder finance,and commercial loan portfolios, reflecting deteriorated economicconditions. An increase in the general provision of $156 million,reflecting volume growth and weaker credit quality in our Canadian retailand U.S. banking portfolios also contributed to the increase.
Insurance policyholder benefits, claims and acquisition expense2009 vs. 2008PBCAE increased $2,978 million from a year ago, largely reflecting thechange in fair value of investments backing our life and healthpolicyholder liabilities and higher costs commensurate withincreased annuity volumes, largely offset in revenue. For furtherdetails, refer to the Insurance segment section.
2008 vs. 2007PBCAE decreased $542 million, or 25%, from 2007, primarilyreflecting the change in fair value of investments backing our life andhealth policyholder liabilities, largely offset in revenue.
Non-interest expense2009 vs. 2008Non-interest expense increased $2,207 million, or 18% from a yearago, largely due to increased variable compensation driven by highertrading results. Approximately 60% of our variable compensation wasearnings-based with the remainder sales commission-based.Increased costs in support of business growth, which includedacquisition-related staff and occupancy costs, reflecting a full year ofexpenses from our acquisitions of RBTT, Ferris, Baker Watts Inc.(FBW), ANB and Philips, Hager & North Investment Management Ltd.(PH&N), and the impact of the weaker Canadian dollar relative to theU.S. dollar also contributed to the increase. These factors werepartially offset by our ongoing focus on cost management. Last year,our non-interest expense included the favourable impact of $542million related to the reduction of the Enron-related litigationprovision.
2008 vs. 2007Non-interest expense decreased $122 million, or 1%, compared to2007, largely reflecting the reduction of the Enron-related litigationprovision. Lower variable compensation reflecting higher marketenvironment-related losses on HFT instruments, the impact ofstronger Canadian dollar relative to the U.S. dollar and lower stock-based compensation expense in our U.S. brokerage business, werepartially offset by increased costs in support of business growth,including acquisition-related staff and occupancy costs.
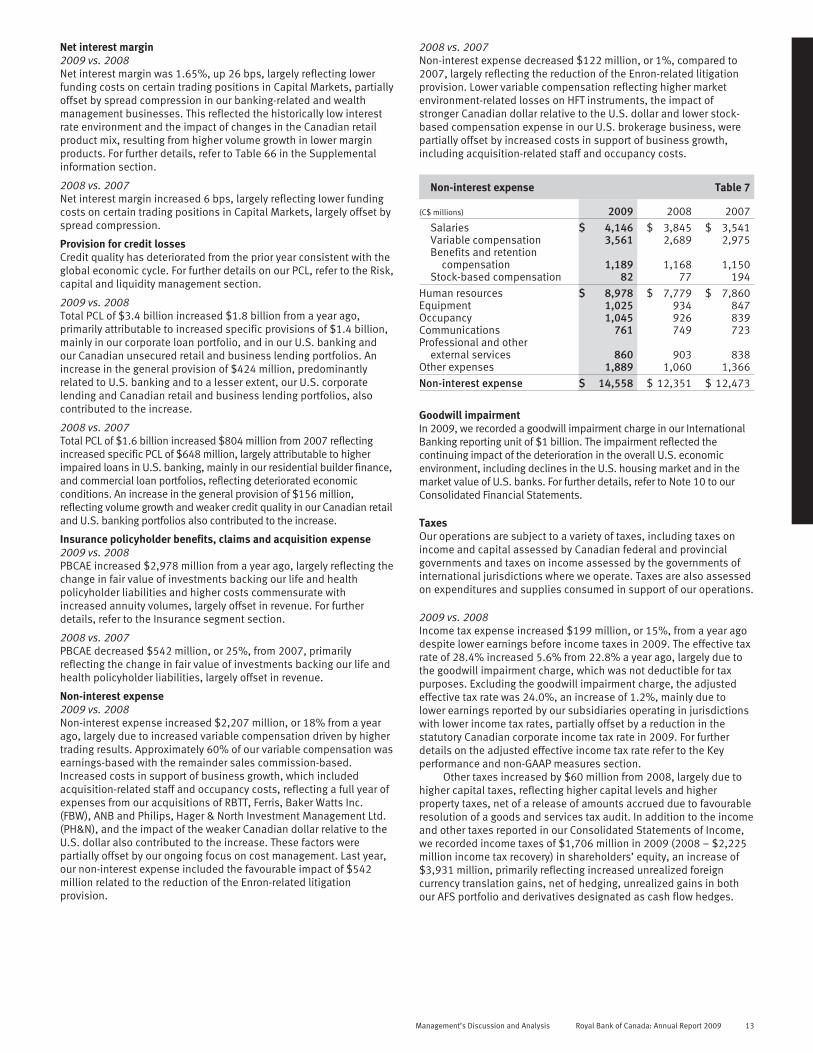
Non-interest expense Table 7
(C$ millions) 2009 2008 2007
Salaries $ 4,146 $ 3,845 $ 3,541Variable compensation 3,561 2,689 2,975Benefits and retention
compensation 1,189 1,168 1,150Stock-based compensation 82 77 194
Human resources $ 8,978 $ 7,779 $ 7,860Equipment 1,025 934 847Occupancy 1,045 926 839Communications 761 749 723Professional and other
external services 860 903 838Other expenses 1,889 1,060 1,366
Non-interest expense $ 14,558 $ 12,351 $ 12,473
Goodwill impairmentIn 2009, we recorded a goodwill impairment charge in our InternationalBanking reporting unit of $1 billion. The impairment reflected thecontinuing impact of the deterioration in the overall U.S. economicenvironment, including declines in the U.S. housing market and in themarket value of U.S. banks. For further details, refer to Note 10 to ourConsolidated Financial Statements.
TaxesOur operations are subject to a variety of taxes, including taxes onincome and capital assessed by Canadian federal and provincialgovernments and taxes on income assessed by the governments ofinternational jurisdictions where we operate. Taxes are also assessedon expenditures and supplies consumed in support of our operations.
2009 vs. 2008Income tax expense increased $199 million, or 15%, from a year agodespite lower earnings before income taxes in 2009. The effective taxrate of 28.4% increased 5.6% from 22.8% a year ago, largely due tothe goodwill impairment charge, which was not deductible for taxpurposes. Excluding the goodwill impairment charge, the adjustedeffective tax rate was 24.0%, an increase of 1.2%, mainly due tolower earnings reported by our subsidiaries operating in jurisdictionswith lower income tax rates, partially offset by a reduction in thestatutory Canadian corporate income tax rate in 2009. For furtherdetails on the adjusted effective income tax rate refer to the Keyperformance and non-GAAP measures section.
Other taxes increased by $60 million from 2008, largely due tohigher capital taxes, reflecting higher capital levels and higherproperty taxes, net of a release of amounts accrued due to favourableresolution of a goods and services tax audit. In addition to the incomeand other taxes reported in our Consolidated Statements of Income,we recorded income taxes of $1,706 million in 2009 (2008 – $2,225million income tax recovery) in shareholders’ equity, an increase of$3,931 million, primarily reflecting increased unrealized foreigncurrency translation gains, net of hedging, unrealized gains in bothour AFS portfolio and derivatives designated as cash flow hedges.
Management’s Discussion and Analysis Royal Bank of Canada: Annual Report 2009 13

2008 vs. 2007Income tax expense decreased $23 million, or 2%, from 2007 due tolower earnings before income taxes in 2008. The effective tax rate of22.8% as compared to 19.8% was largely due to lower earningsreported by our subsidiaries operating in jurisdictions with lowerincome tax rates and a higher tax rate on the reduction of the Enron-related litigation provision. These factors were partially offset by alower statutory Canadian corporate income tax rate in 2008 and ahigher level of income from tax-advantaged sources (Canadiantaxable corporate dividends) in 2008.
Other taxes increased by $13 million. Higher payroll, businessand property taxes were partially offset by lower capital taxes due to alower Canadian capital tax base and a reduction in the goods andservices taxes rate.
Taxes Table 8
(C$ millions, except percentage amounts) 2009 2008 2007Income taxes $ 1,568 $ 1,369 $ 1,392Other taxes
Goods and services and salestaxes $ 180 $ 204 $ 208
Payroll taxes 249 242 227Capital taxes 161 104 117Property taxes (1) 115 103 97Insurance premium taxes 46 42 41Business taxes 20 16 8
$ 771 $ 711 $ 698Total income and other taxes $ 2,339 $ 2,080 $ 2,090Net income before income taxes $ 5,526 $ 6,005 $ 7,025Effective income tax rate 28.4% 22.8% 19.8%Effective total tax rate (2) 37.1% 31.0% 27.1%(1) Includes amounts netted against non-interest income regarding investment properties.(2) Total income and other taxes as a percentage of net income before income and other
taxes.
Quarterly financial information
Fourth quarter 2009 performance
Fourth quarter net income of $1,237 million was up $117 million, or10%, from a year ago mainly due to higher trading revenue, includinglower market environment-related losses on HFT instruments, whichwas partially offset by higher related variable compensation. Lowernet losses on AFS securities, improved equity origination activity andvolume growth in Canadian Banking and Insurance also contributedto the increase. These factors were partially offset by higher PCL. Ourprior year results were favourably impacted by the reduction of theEnron-related litigation provision.
Total revenue increased $2,390 million, due to higher insurancerelated revenue, mainly resulting from the change in fair value ofinvestments and higher annuity volumes, largely offset in PBCAE andhigher trading revenue, including lower market environment-relatedlosses. Lower net losses on our AFS securities, improved equityorigination activity in Capital Markets, volume growth in CanadianBanking and growth in transactional volumes in Wealth Managementalso contributed to the increase. These factors were partially offset bycumulative accounting adjustments related to prior periods andlosses on the change in fair value of certain derivatives used toeconomically hedge our funding activities compared to gains lastyear. A $52 million ($39 million after-tax) provision related to therestructuring of certain Caribbean banking mutual funds alsounfavourably impacted revenue.
Total PCL was up $264 million or 43% from a year ago, mainlyreflecting higher specific provisions related to a number of specific
clients in our corporate lending portfolio. Increased loss rates in ourCanadian credit card and unsecured personal portfolios, and theimpact of $28 million related to our adoption of the amendments toCanadian Institute of Chartered Accountants (CICA) section 3855,Financial Instruments – Recognition and Measurement as certainimpaired AFS securities were reclassified to loans, mainly in U.S.banking also contributed to the increase. These factors were partiallyoffset by lower specific PCL in U.S. banking reflecting stabilizing assetquality, largely in our residential builder finance portfolio. The generalprovision of $156 million increased $11 million from last year’sgeneral provision of $145 million, mainly reflecting credit deterio-ration related to U.S. banking. For further information on thereclassification, refer to the CICA section 3855 – reclassification ofsecurities to loans section.
PBCAE increased $1,408 million, largely due to the change in fairvalue of investments and an increase in annuity volumes, both ofwhich were largely offset in revenue. Unfavourable actuarialadjustments resulting from management actions and assumptionchanges also contributed to the increase.
Non-interest expense increased $617 million, or 21%, largelydue to increased variable compensation driven by higher tradingresults, partially offset by our ongoing commitment to costmanagement. Last year non-interest expense was favourablyimpacted by the reduction of the Enron-related litigation provision.
Results and trend analysis
Our quarterly earnings, revenue and expenses are impacted by anumber of trends and recurring factors, which include seasonality,general economic and market conditions, and fluctuations in foreign
exchange rates. The following table summarizes our results for thelast eight quarters.
14 Royal Bank of Canada: Annual Report 2009 Management’s Discussion and Analysis

Quarterly results Table 9
2009 2008
(C$ millions, except per share amounts) Q4 Q3 Q2 Q1 Q4 Q3 Q2 Q1
Net interest income $ 2,876 $ 2,900 $ 2,898 $ 2,832 $ 2,629 $ 2,221 $ 2,131 $ 2,067Non-interest income 4,583 4,923 3,863 4,231 2,440 3,691 2,823 3,580
Total revenue $ 7,459 $ 7,823 $ 6,761 $ 7,063 $ 5,069 $ 5,912 $ 4,954 $ 5,647PCL 883 770 974 786 619 334 349 293Insurance PBCAE 1,322 1,253 958 1,076 (86) 553 548 616Non-interest expense 3,606 3,755 3,575 3,622 2,989 3,272 2,970 3,120Goodwill impairment charge – – 1,000 – – – – –
Net income before income taxes andnon-controlling interest in subsidiaries $ 1,648 $ 2,045 $ 254 $ 1,579 $ 1,547 $ 1,753 $ 1,087 $ 1,618Income taxes 389 449 266 464 428 442 156 343Non-controlling interest in net income of
subsidiaries 22 35 38 5 (1) 49 3 30
Net income (loss) $ 1,237 $ 1,561 $ (50) $ 1,110 $ 1,120 $ 1,262 $ 928 $ 1,245
EPS – basic $ .83 $ 1.06 $ (.07) $ .78 $ .82 $ .93 $ .70 $ .96– diluted $ .82 $ 1.05 $ (.07) $ .78 $ .81 $ .92 $ .70 $ .95
Segment net income (loss)Canadian Banking $ 717 $ 669 $ 581 $ 696 $ 676 $ 709 $ 604 $ 673Wealth Management 161 168 126 128 116 186 182 181Insurance 104 167 113 112 59 137 104 89International Banking (125) (95) (1,126) (100) (206) (16) 38 31Capital Markets 561 562 420 225 584 269 13 304Corporate Support (181) 90 (164) 49 (109) (23) (13) (33)
Net income (loss) $ 1,237 $ 1,561 $ (50) $ 1,110 $ 1,120 $ 1,262 $ 928 $ 1,245
Effective tax rate 23.6% 22.0% 104.7% 29.4% 27.7% 25.2% 14.4% 21.2%Period average US$ equivalent of C$1.00 $ .924 $ .900 $ .805 $ .815 $ .901 $ .988 $ .994 $ 1.002
SeasonalitySeasonal factors impact our results in most quarters. The secondquarter has fewer days than the other quarters, generally resulting ina decrease in net interest income and certain expense items. Thethird and fourth quarters include the summer months during whichmarket activity generally tends to slow, negatively impacting theresults of our capital markets, brokerage and investmentmanagement businesses.
Overview of consolidated resultsAs economic and market conditions deteriorated over most of theperiod, our net income has been unfavourably impacted by PCL andtotal market environment-related net losses. PCL has generallyincreased, particularly over the last five quarters, while marketenvironment-related losses have moderated since the first quarter of2009. A number of other items, noted below, have also affected ourresults.• In the second quarter of 2009, we recorded a goodwill
impairment charge of $1 billion, resulting in a net loss of $50million for the quarter and an effective tax rate of 104.7%.Excluding this charge, adjusted net income for the quarter was$950 million and the adjusted effective tax rate was 21.2%, asthe goodwill impairment charge was not deductible for taxpurposes.
• In the fourth quarter of 2008, we recorded a reduction of theEnron-related litigation provision of $542 million.
• The Canadian dollar depreciated significantly, on average,relative to the U.S. dollar from the first quarter of 2008 to thesecond quarter of 2009, and has strengthened considerablysince the third quarter of 2009. These fluctuations in theCanadian/U.S. dollar exchange rate have had an impact on ourconsolidated net income over the period.
Trend analysisOur quarterly results have generally increased over the correspondingperiod in the prior year. However, for the first two quarters of 2009 ourresults decreased from the comparative quarters in 2008. For the lasttwo quarters of 2009, our results have increased over thecomparative quarters in 2008 due to solid performances across mostof our businesses as a result of improved market conditions.
Revenue has generally fluctuated over the period. Increases inrevenue have mainly resulted from solid trading revenue in certain ofour capital markets businesses and changes in the fair value of ourinvestment portfolios backing our life and health policyholderliabilities in Insurance due to market volatility, largely offset in PBCAE.As well, higher banking-related revenue due to solid volume growth,partly reflecting our acquisitions, and revenue growth in our wealthmanagement businesses, primarily driven by our acquisitions, alsocontributed to revenue. Revenue has been unfavourably impacted bytotal market environment-related losses, mainly in the latter part of2008 and the early half of 2009, reduced fee-based client assets dueto capital depreciation, lower transaction volumes, and spreadcompression in our banking-related and wealth managementbusinesses.
PCL has generally trended significantly higher over the perioddue to weakness in the economic environment. We have also madeadditions to our general provision, which were particularly elevated inthe last five quarters, largely reflecting credit deterioration mainlyrelated to the economic environment. For further details, refer to theCredit quality performance section.
PBCAE has fluctuated considerably over the period. Althoughunderlying business growth has generally increased PBCAE, there canbe significant quarterly volatility resulting from the change in fairvalue of investments backing our life and health policyholderliabilities, claims experience and actuarial liability adjustments.
Non-interest expense has generally increased over the last eightquarters, mainly due to higher variable compensation resulting fromhigher trading revenue, increased costs in support of business growth,including the impact of our acquisitions, and the impact of thegenerally weaker Canadian dollar relative to the U.S. dollar. Thesefactors were partially offset by our ongoing focus on cost management.
Our effective tax rate has generally fluctuated over the last eightquarters, reflecting a varying portion of income being reported by oursubsidiaries operating in jurisdictions with differing income tax ratesand a fluctuating level of income from tax-advantaged sources(Canadian taxable corporate dividends). Market environment-relatedlosses and the reduction of the Enron-related litigation provision,which were recorded at higher income tax rates, the goodwillimpairment charge, and a reduction in statutory Canadian corporateincome tax rates also impacted our effective tax rate over the period.
Management’s Discussion and Analysis Royal Bank of Canada: Annual Report 2009 15

Business segment results
Results by business segment Table 10
2009 2008 2007(C$ millions, except for percentageamounts)
CanadianBanking
WealthManagement Insurance
InternationalBanking
CapitalMarkets (1)
CorporateSupport (1) Total Total Total
Net interest income $ 6,947 $ 397 $ – $ 1,687 $ 3,399 $ (924) $ 11,506 $ 9,048 $ 7,702Non-interest income 2,943 3,683 5,715 903 3,524 832 17,600 12,534 14,760
Total revenue $ 9,890 $ 4,080 $ 5,715 $ 2,590 $ 6,923 $ (92) $ 29,106 $ 21,582 $ 22,462PCL 1,275 – – 980 702 456 3,413 1,595 791Insurance PBCAE – – 4,609 – – – 4,609 1,631 2,173Goodwill impairment charge – – – 1,000 – – 1,000 – –Non-interest expense 4,729 3,262 559 2,346 3,628 34 14,558 12,351 12,473
Net income before incometaxes and non-controllinginterest in net income ofsubsidiaries $ 3,886 $ 818 $ 547 $ (1,736) $ 2,593 $ (582) $ 5,526 $ 6,005 $ 7,025
Net income $ 2,663 $ 583 $ 496 $ (1,446) $ 1,768 $ (206) $ 3,858 $ 4,555 $ 5,492
Return on equity (ROE) 35.9% 14.2% 37.0% (19.4)% 21.0% (10.4)% 11.9% 18.1% 24.7%Return on risk capital (RORC) 48.4% 49.2% 42.9% (49.1)% 24.3% (26.0)% 19.5% 29.6% 37.4%Average assets $ 258,900 $ 20,500 $ 13,100 $ 63,700 $ 347,900 $ (8,800) $ 695,300 $ 650,300 $ 581,000
(1) Net interest income, total revenue and net income before income taxes are presented in Capital Markets on a taxable equivalent basis. The taxable equivalent basis adjustment is eliminatedin the Corporate Support segment. For a further discussion, refer to the How we measure and report our business segments section.
How we measure and report our business segments
Our management reporting framework is intended to measure theperformance of each business segment as if it were a stand-alonebusiness and reflect the way that business segment is managed. Thisapproach is intended to ensure that our business segments’ resultsinclude all applicable revenue and expenses associated with theconduct of their business and depicts how management views thoseresults.
The following highlights the key aspects of how our businesssegments are managed and reported:• Canadian Banking reported results include securitized Canadian
residential mortgage and credit card loans and related amountsfor income and specific provision for credit losses.
• Wealth Management, Insurance and International Banking reportedresults include disclosure in U.S. dollars as we review and managethe results of certain business lines largely in U.S. dollars.
• Insurance reported results include the change in fair value ofinvestments backing our life and health policyholder liabilitiesrecorded as revenue, which is largely offset in PBCAE.
• Capital Markets results are reported on a taxable equivalentbasis (teb), which grosses up net interest income from certaintax-advantaged sources (Canadian taxable corporate dividends)to their effective taxable equivalent value with a correspondingoffset recorded in the provision for income taxes. We record theelimination of the teb adjustments in Corporate Support. Webelieve these adjustments are useful and reflect how CapitalMarkets manages its business, since it enhances thecomparability of revenue and related ratios across taxablerevenue and our principal tax-advantaged source of revenue. Theuse of teb adjustments and measures may not be comparable tosimilar GAAP measures or similarly adjusted amounts disclosedby other financial institutions.
• Corporate Support results include all enterprise-level activitiesthat are undertaken for the benefit of the organization that arenot allocated to our five business segments, such as volatilityrelated to treasury activities, securitizations and net chargesassociated with unattributed capital.
• Specific allowances are recorded to recognize estimated losseson our lending portfolio on loans that have become impaired. Thespecific provisions for credit losses are included in the results ofeach business segment to fully reflect the appropriate expensesrelated to the conduct of each business segment. A generalallowance is established to cover estimated credit losses incurredin the lending portfolio that have not been specifically identified
as impaired. Changes in the general allowance are included inCorporate Support, as Group Risk Management effectivelycontrols this through its monitoring and oversight of variousportfolios of loans throughout the enterprise.
Key methodologiesThe following outlines the key methodologies and assumptions usedin our management reporting framework. These are periodicallyreviewed by management to ensure they remain valid.
Expense allocationTo ensure that our business segments’ results include expensesassociated with the conduct of their business, we allocate costsincurred or services provided by Operations, Technology andFunctions, which were directly undertaken or provided on thebusiness segments’ behalf. For other costs not directly attributable toour business segments, including overhead costs and other indirectexpenses, we use our management reporting framework for allocatingthese costs to each business segment in a manner that reflects theunderlying benefits.
Capital attributionOur framework also determines the attribution of capital to ourbusiness segments in a manner that is intended to consistentlymeasure and align economic costs with the underlying benefits andrisks associated with the activities of each business segment. Theamount of capital assigned to each business segment is referred to asattributed capital. Unattributed capital and associated net chargesare reported in Corporate Support. For further information, refer to theCapital management and Key performance and non-GAAP measuressections.
Funds transfer pricingA funds transfer pricing methodology is used to allocate interestincome and expense by product to each business segment. Thisallocation considers the interest rate risk, liquidity and funding riskand regulatory requirements of each of our business segments. Webase transfer pricing on external market costs and each businesssegment fully absorbs the costs of running its business. Our businesssegments may retain certain interest rate exposures subject tomanagement approval that would be expected in the normal courseof operations.
16 Royal Bank of Canada: Annual Report 2009 Management’s Discussion and Analysis

Changes made in 2009The following highlights the key changes we made to our businesssegments during the year to reflect how each business is appropri-ately managed. Unless specifically stated, comparative amounts havebeen revised and did not have an impact on our consolidated results.• We realigned Capital Markets into two main businesses, Capital
Markets Sales and Trading, and Corporate and InvestmentBanking.
• We realigned Insurance into three main businesses, CanadianInsurance, U.S. Insurance, and International & Other Insurance.
For further details, refer to the Capital Markets and Insurance segmentsections.
Canadian Banking
Canadian Banking comprises our domestic personal and businessbanking operations and certain retail investment businesses and isoperated through three business lines: Personal Financial Services,Business Financial Services, and Cards and Payment Solutions.Canadian Banking provides a broad suite of financial products andservices to over 10 million individual and business clients throughour extensive branch, automated teller machines (ATMs), online andtelephone banking networks, as well as through a large number ofproprietary sales professionals. The competitive landscape of ourBanking-related operations in the Canadian financial servicesindustry consists of 22 Schedule I banks, 47 independent trustcompanies, 26 foreign banks and a number of credit unions andcaisses populaires. In this competitive environment, we have toprankings in market share for most retail financial product categories,the largest branch network, the most ATMs and the largest mobilesales network across Canada.
Year in review• Cost management was a focus throughout this year and we
launched several significant transformational initiatives that arefocused on enhancing sales and service productivity andimproving processes through streamlining and automation.
• We announced the new WestJet RBC Mastercard, a new travelrewards card offering rewards to clients who travel in North Americaand the Caribbean on WestJet. This will make us the first largeCanadian financial institution to offer both MasterCard and Visa.
• We expanded our highly successful RBC Reward credit cardpoints program to additional banking products and services,rewarding our clients for their loyalty.
Economic and market reviewOur results were impacted by the slowdown in the economy resultingin higher credit losses across our loan portfolios. Historically lowinterest rates contributed to strong growth in our home equitybusiness; however it also resulted in significant spread compression.A reduction in businesses spending resulted in strong growth inbusiness deposits and investments and moderate growth in ourbusiness lending portfolio. Clients shifted to lower risk investmentproducts such as our guaranteed investment certificates (GIC) anddeposit products and short term money market funds due to volatilityin the equity markets. Our market position increased, most notably inthe auto financing and leasing business, as foreign and nichecompetitors withdrew or reduced their presence in the Canadianmarketplace. For further details on our general economic review, referto the 2009 Economic and market review section.
Canadian Banking financial highlights Table 11
(C$ millions, except number of and percentage amounts) 2009 2008 2007
Net interest income $ 6,947 $ 6,718 $ 6,353Non-interest income 2,943 2,868 2,976
Total revenue $ 9,890 $ 9,586 $ 9,329PCL 1,275 867 788Non-interest expense 4,729 4,758 4,748
Net income before income taxes and non-controlling interest in subsidiaries $ 3,886 $ 3,961 $ 3,793Net income $ 2,663 $ 2,662 $ 2,545
Key ratiosROE 35.9% 38.1% 34.9%RORC 48.4% 52.2% 48.1%NIM (1) 2.76% 2.98% 3.17%Operating leverage 3.8% 2.6% 6.5%
Selected average balance sheet informationTotal assets (2) $ 258,900 $ 232,300 $ 207,500Total earning assets (2) 251,600 225,600 200,400Loans and acceptances (2) 249,600 225,000 199,200Deposits 172,600 155,000 147,100Attributed capital 7,250 6,900 7,200Risk capital 5,400 5,050 5,250
Other informationAUA $ 133,800 $ 109,500 $ 120,200Number of employees (full-time equivalent) 23,280 24,222 23,930
Credit informationGross impaired loans as a percentage of average net loans and acceptances .50% .36% .35%Specific PCL as a percentage of average net loans and acceptances .51% .39% .39%
(1) NIM is calculated as Net interest income divided by Average total earning assets.(2) Average total assets, Average total earning assets, and Average loans and acceptances include average securitized residential mortgage and credit card loans for the year of $37 billion and
$4 billion, respectively (2008 – $22 billion and $4 billion; 2007 – $19 billion and $4 billion).
Management’s Discussion and Analysis Royal Bank of Canada: Annual Report 2009 17

Revenue by business line (C$ millions)
2007 2008 20090
2,000
4,000
6,000
8,000
10,000
Business Financial Services
Personal Financial Services
Cards and Payment Solutions
Financial performance2009 vs. 2008Net income was flat as strong volume growth in personal andbusiness products and effective cost management were fully offset bysignificantly higher PCL and spread compression.
Total revenue increased $304 million, or 3%, from the previousyear largely reflecting strong volume growth in home equity loans andpersonal and business deposits and a favourable adjustment to ourcredit card customer loyalty reward program in the current year. Thesefactors were partly offset by lower spreads due to the historically lowinterest rate environment and a decline in mutual fund distributionfees reflecting capital depreciation.
Net interest margin decreased 22 bps from a year ago reflectingsharply lower interest rates, higher term funding costs and the impactof changes in product mix, reflecting higher volume growth in lowermargin products including personal deposits and home equity loans.
PCL increased $408 million, or 47%, mainly reflecting higherloss rates in credit cards and unsecured personal portfolios andhigher impaired loans in our business lending portfolio primarily as aresult of recessionary conditions. For further details, refer to theCredit quality performance section.
Non-interest expense decreased $29 million, or 1%, mainly dueto our ongoing focus on cost management, including lower staff levelsreflecting productivity initiatives and lower pension and benefit costs,partly offset by higher operational costs in support of businessvolume growth and branch network expansion.
Average assets increased $27 billion, or 11% largely due tocontinued strong growth in home equity and personal lendingproducts. Average deposits were up $18 billion, or 11%, reflectingstrong growth in both personal and business deposits.
2008 vs. 2007Net Income increased $117 million, or 5%, from 2007, reflecting solidvolume growth and effective cost management, which were partiallyoffset by spread compression and higher PCL.
Total revenue increased $257 million, or 3%, reflecting solidvolume growth across all businesses, higher foreign exchangerevenue, service fees and mutual fund distribution fees, partiallyoffset by spread compression. Our results for 2007 included a gainrelated to the Visa IPO shares upon the reorganization of Visa Inc.,which was partially offset by an unfavorable adjustment related to ourcredit card customer loyalty reward program liability.
Net Interest margin decreased 19 bps, largely reflecting theimpact of changes in our retail product mix, the lower interest rateenvironment and competitive pressure.
PCL increased $79 million, or 10%, reflecting portfolio growthand higher loss rates in our credit cards and personal loan portfolios.
Non-interest expense of $4,758 million was essentially flat, ashigher sales and service expenses in our banking branch network insupport of business growth and project spending were largely offsetby lower operational support and infrastructure costs.
Outlook and prioritiesThe expected return to economic growth in 2010, increased consumerspending and a continued low interest rate environment shouldgenerate solid consumer lending growth, particularly in home equitylending. Further improvements in the equity markets are expected torenew consumer confidence and lead to stronger growth in ourmutual funds products. We expect business lending growth to lag theeconomic recovery given the higher levels of liquidity and excesscapacity. With unemployment rates expected to peak in early 2010,credit losses will likely remain elevated. For further details on ourgeneral economic outlook, refer to the 2010 Economic and marketoutlook section.
Key strategic priorities for 2010• Continue to deliver a superior client experience.• Continue to simplify the way we do business by eliminating
complexity and automating key processes.• Enable collaboration and convergence of people and channels to
increase employee engagement and productivity and strengthenour distribution capabilities.
Business line review
Personal Financial Services
Personal Financial Services focuses on meeting the needs of ourindividual clients at every stage of their lives through a wide range offinancing and investment products and services, including homeequity financing, personal lending, deposit accounts, mutual fundsand self-directed brokerage accounts, GICs and Canadian privatebanking. We rank first or second in market share for most personalbanking products and our retail banking network is the largest inCanada with 1,197 branches and 4,214 ATMs.
Financial performanceTotal revenue was relatively flat compared to the prior year as theimpact of lower interest rates on deposit spreads and lower mutualfund distribution fees, due to capital depreciation, offset strongvolume growth in home equity loans and deposits accounts, andhigher lending spreads.
Average residential mortgages were up 9% over last year,supported by historically low interest rates and a solid housingmarket. Average personal deposits grew by 19% from last year, drivenby the continued success of our key savings products and customerpreference for reduced risk.
18 Royal Bank of Canada: Annual Report 2009 Management’s Discussion and Analysis

Selected highlights Table 12
(C$ millions) 2009 2008 2007
Total revenue $ 5,305 $ 5,315 $ 5,082Other information (average)
Residential mortgages 141,800 129,800 113,200Personal loans 53,000 43,700 38,700Personal deposits 49,000 41,200 35,500Personal GICs 58,000 55,600 57,900Branch mutual fund balances (1) 63,300 58,000 66,900AUA – Self-directed brokerage (1) 35,500 26,500 28,300New deposit accounts
opened (thousands) 990 1,129 1,066Number of:
Branches 1,197 1,174 1,146Automated teller machines (ATMs) 4,214 4,149 3,946
(1) Represents year-end spot balances.
Average residential mortgages, personal loans and deposits (C$ millions)
Personal loans
Residential mortgages
Personal deposits
0
30,000
60,000
90,000
150,000
120,000
0
12,000
24,000
36,000
60,000
48,000
2007 2008 2009 2007 2008 2009
Business Financial Services
Business Financial Services offers a wide range of lending, leasing,deposit, investment, foreign exchange, cash management and tradeproducts and services to small and medium-sized businesses andcommercial, agriculture and agribusiness clients across Canada. Ourextensive business banking network includes over 100 businessbanking centres and over 2,000 business account managers. Ourstrong commitment to our clients has resulted in leading marketshare in business loans and deposits.
Financial performanceTotal revenue was relatively flat compared to the prior year as strongvolume growth in deposits and improved lending spreads, offsetlower spreads on deposits, due to the historically low interest rateenvironment.
Over the course of the year, businesses have increased theirliquidity levels, leading to strong growth of 13% in business deposits;however this reduced demand for credit, limiting our business loangrowth to 6%.
Selected highlights Table 13
(C$ millions) 2009 2008 2007
Total revenue $ 2,457 $ 2,441 $ 2,301Other information (average)
Business loans (1) 42,400 39,900 36,900Business deposits (2) 65,400 58,000 53,700
(1) Includes small business loans treated as retail and wholesale loans.(2) Includes GIC balances.
Average business loans and deposits (C$ millions)
Business deposits
Business loans
0
9,000
18,000
27,000
36,000
45,000
0
14,000
28,000
42,000
56,000
70,000
2007 20092008 2007 20092008
Cards and Payment Solutions
Cards and Payment Solutions provides a wide array of convenient andcustomized credit cards and related payment products and solutions.We have over 6 million credit card accounts and have an approx-imately 20% market share of Canada’s credit card purchase volume.
In addition, this business line includes our 50% interest inMoneris Solutions, Inc., our merchant card processing joint venturewith the Bank of Montreal.
Financial performanceTotal revenue increased $298 million or 16%, compared to the pastyear, primarily reflecting higher spreads from lower funding costs andhigher transactional volumes. The increase also reflected afavourable adjustment of $52 million related to our credit cardcustomer loyalty rewards program liability reflecting favorableassumption changes on the cost of the program. A gain of $18 millionon the sale of a portion of our remaining Visa IPO shares this year ascompared to a loss of $29 million on the redemption of our Visa IPOshares in the prior year also increased revenue.
Balances remained relatively flat compared to last year reflectinglower overall market growth as well as strategies implemented inearly 2009 to limit credit losses during the economic downturn, whichincluded a reduction in our marketing and direct mail programs.
Selected highlights Table 14
(C$ millions) 2009 2008 2007
Total revenue $ 2,128 $ 1,830 $ 1,946Other information
Average credit card balances 12,500 12,400 11,200Net purchase volumes 53,200 52,600 47,200
Average credit card balances and net purchase volumes (C$ millions)
Net purchasevolumes
Average creditcard balances
0
3,000
6,000
9,000
12,000
15,000
0
12,000
24,000
36,000
48,000
60,000
2007 20092008 2007 20092008
Management’s Discussion and Analysis Royal Bank of Canada: Annual Report 2009 19

Wealth Management
Wealth Management comprises Canadian Wealth Management,U.S. & International Wealth Management and Global AssetManagement. We serve affluent and high net worth clients in Canada,the United States, Latin America, Europe and Asia with a full suite ofinvestment, trust and other wealth management solutions. We alsoprovide asset management products and services directly, throughother RBC distribution channels and through third-party distributorsto institutional and individual clients. Our competitive environment isdiscussed below in each business.
Year in review• We successfully leveraged the strength and stability of RBC to
attract client-facing professionals through proactive hiringcampaigns in each of our businesses. We added more than 158financial consultants and client-facing professionals across ourCanadian, U.S. and international businesses.
• We completed the acquisition of Mourant Private Wealth andsuccessfully integrated our FBW and J.B. Hanauer & Co. (JBH)acquisitions in U.S. & International Wealth Management. Wealso announced an agreement to acquire J.P. Morgan’s ThirdParty Registered Investment Advisory (RIA) Servicing Business toexpand the breadth and depth of our custody and clearingservices. (1)
• We made solid progress in integrating our Phillips, Hager & North(PH&N) acquisition and realigning our Canadian and U.S. assetmanagement businesses focusing on the following three areas
of opportunities: (i) Canadian retail asset management where wecontinued to demonstrate strong sales and performance with$2.1 billion of net long-term fund sales in 2009; (ii) Canadianinstitutional asset management where we are the third largest inCanada by AUM; and (iii) in U.S. asset management where werepositioned our Voyageur Asset Management business forgrowth.
• We won the 2009 “Outstanding Private Bank – North America”award by Private Banker International, recognizing our strength,stability and leadership.
Economic and market reviewFee-based client asset values and transaction volumes were impactedby continued weak market conditions in early 2009. However,improvements during the latter half of the year partially offset thisimpact through capital appreciation and higher investor confidencedriving higher transaction volumes and higher net sales. Also, as afew competitors retrenched their operations as a result of marketdisruption, we continued to grow our market share and attracted arecord number of experienced client-facing professionals, largely inU.S. Wealth Management. For further details on our general economicreview, refer to the 2009 Economic and market review section.
(1) The acquisition is subject to regulatory approvals and other customary closingconditions and is expected to close in the second quarter of 2010.
Wealth Management financial highlights Table 15
(C$ millions, except number of and percentage amounts) 2009 2008 2007
Net interest income $ 397 $ 468 $ 427Non-interest income
Fee-based revenue 2,154 2,276 2,109Transactional and other revenue 1,529 1,243 1,456
Total revenue $ 4,080 $ 3,987 $ 3,992Non-interest expense 3,262 3,038 2,902
Net income before income taxes and non-controlling interest in subsidiaries $ 818 $ 948 $ 1,089Net income $ 583 $ 665 $ 762
Key ratiosROE 14.2% 23.3% 32.4%RORC 49.2% 64.9% 65.1%Pre-tax margin (1) 20.0% 23.8% 27.3%
Selected average balance sheet informationTotal assets $ 20,500 $ 16,900 $ 16,600Loans and acceptances 5,800 5,200 4,600Deposits 31,500 26,900 24,900Attributed capital 3,900 2,800 2,300Risk capital 1,100 1,000 1,150
Other informationRevenue per advisor (000s) (2) $ 670 $ 731 $ 787AUA 502,300 495,100 488,500AUM 245,700 222,600 161,200Number of employees (full-time equivalent) 10,818 10,954 9,621Number of advisors (3) 4,504 4,346 3,811
Impact of US$ translation on selected items 2009 vs. 2008
Increased (decreased) total revenue $ 197Increased (decreased) non-interest expense 163Increased (decreased) net income 33
Percentage change in average US$ equivalent of C$1.00 (11)%
(1) Pre-tax margin is defined as net income before income taxes and non-controlling interest in subsidiaries dividend by total revenue.(2) Includes investment advisors and financial consultants of our Canadian and U.S. full-service brokerage businesses.(3) Includes client-facing advisors across all our wealth management businesses.
20 Royal Bank of Canada: Annual Report 2009 Management’s Discussion and Analysis
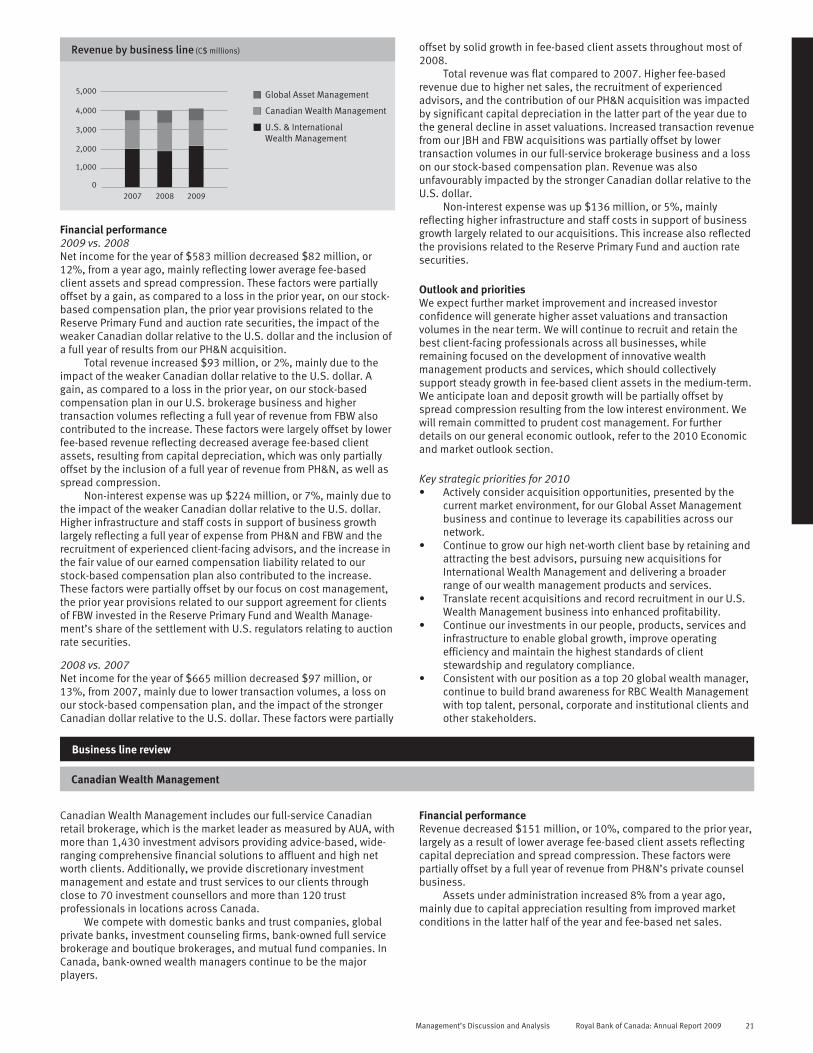
Revenue by business line (C$ millions)
2007 2008 20090
1,000
2,000
3,000
4,000
5,000
Canadian Wealth Management
U.S. & InternationalWealth Management
Global Asset Management
Financial performance2009 vs. 2008Net income for the year of $583 million decreased $82 million, or12%, from a year ago, mainly reflecting lower average fee-basedclient assets and spread compression. These factors were partiallyoffset by a gain, as compared to a loss in the prior year, on our stock-based compensation plan, the prior year provisions related to theReserve Primary Fund and auction rate securities, the impact of theweaker Canadian dollar relative to the U.S. dollar and the inclusion ofa full year of results from our PH&N acquisition.
Total revenue increased $93 million, or 2%, mainly due to theimpact of the weaker Canadian dollar relative to the U.S. dollar. Again, as compared to a loss in the prior year, on our stock-basedcompensation plan in our U.S. brokerage business and highertransaction volumes reflecting a full year of revenue from FBW alsocontributed to the increase. These factors were largely offset by lowerfee-based revenue reflecting decreased average fee-based clientassets, resulting from capital depreciation, which was only partiallyoffset by the inclusion of a full year of revenue from PH&N, as well asspread compression.
Non-interest expense was up $224 million, or 7%, mainly due tothe impact of the weaker Canadian dollar relative to the U.S. dollar.Higher infrastructure and staff costs in support of business growthlargely reflecting a full year of expense from PH&N and FBW and therecruitment of experienced client-facing advisors, and the increase inthe fair value of our earned compensation liability related to ourstock-based compensation plan also contributed to the increase.These factors were partially offset by our focus on cost management,the prior year provisions related to our support agreement for clientsof FBW invested in the Reserve Primary Fund and Wealth Manage-ment’s share of the settlement with U.S. regulators relating to auctionrate securities.
2008 vs. 2007Net income for the year of $665 million decreased $97 million, or13%, from 2007, mainly due to lower transaction volumes, a loss onour stock-based compensation plan, and the impact of the strongerCanadian dollar relative to the U.S. dollar. These factors were partially
offset by solid growth in fee-based client assets throughout most of2008.
Total revenue was flat compared to 2007. Higher fee-basedrevenue due to higher net sales, the recruitment of experiencedadvisors, and the contribution of our PH&N acquisition was impactedby significant capital depreciation in the latter part of the year due tothe general decline in asset valuations. Increased transaction revenuefrom our JBH and FBW acquisitions was partially offset by lowertransaction volumes in our full-service brokerage business and a losson our stock-based compensation plan. Revenue was alsounfavourably impacted by the stronger Canadian dollar relative to theU.S. dollar.
Non-interest expense was up $136 million, or 5%, mainlyreflecting higher infrastructure and staff costs in support of businessgrowth largely related to our acquisitions. This increase also reflectedthe provisions related to the Reserve Primary Fund and auction ratesecurities.
Outlook and prioritiesWe expect further market improvement and increased investorconfidence will generate higher asset valuations and transactionvolumes in the near term. We will continue to recruit and retain thebest client-facing professionals across all businesses, whileremaining focused on the development of innovative wealthmanagement products and services, which should collectivelysupport steady growth in fee-based client assets in the medium-term.We anticipate loan and deposit growth will be partially offset byspread compression resulting from the low interest environment. Wewill remain committed to prudent cost management. For furtherdetails on our general economic outlook, refer to the 2010 Economicand market outlook section.
Key strategic priorities for 2010• Actively consider acquisition opportunities, presented by the
current market environment, for our Global Asset Managementbusiness and continue to leverage its capabilities across ournetwork.
• Continue to grow our high net-worth client base by retaining andattracting the best advisors, pursuing new acquisitions forInternational Wealth Management and delivering a broaderrange of our wealth management products and services.
• Translate recent acquisitions and record recruitment in our U.S.Wealth Management business into enhanced profitability.
• Continue our investments in our people, products, services andinfrastructure to enable global growth, improve operatingefficiency and maintain the highest standards of clientstewardship and regulatory compliance.
• Consistent with our position as a top 20 global wealth manager,continue to build brand awareness for RBC Wealth Managementwith top talent, personal, corporate and institutional clients andother stakeholders.
Business line review
Canadian Wealth Management
Canadian Wealth Management includes our full-service Canadianretail brokerage, which is the market leader as measured by AUA, withmore than 1,430 investment advisors providing advice-based, wide-ranging comprehensive financial solutions to affluent and high networth clients. Additionally, we provide discretionary investmentmanagement and estate and trust services to our clients throughclose to 70 investment counsellors and more than 120 trustprofessionals in locations across Canada.
We compete with domestic banks and trust companies, globalprivate banks, investment counseling firms, bank-owned full servicebrokerage and boutique brokerages, and mutual fund companies. InCanada, bank-owned wealth managers continue to be the majorplayers.
Financial performanceRevenue decreased $151 million, or 10%, compared to the prior year,largely as a result of lower average fee-based client assets reflectingcapital depreciation and spread compression. These factors werepartially offset by a full year of revenue from PH&N’s private counselbusiness.
Assets under administration increased 8% from a year ago,mainly due to capital appreciation resulting from improved marketconditions in the latter half of the year and fee-based net sales.
Management’s Discussion and Analysis Royal Bank of Canada: Annual Report 2009 21
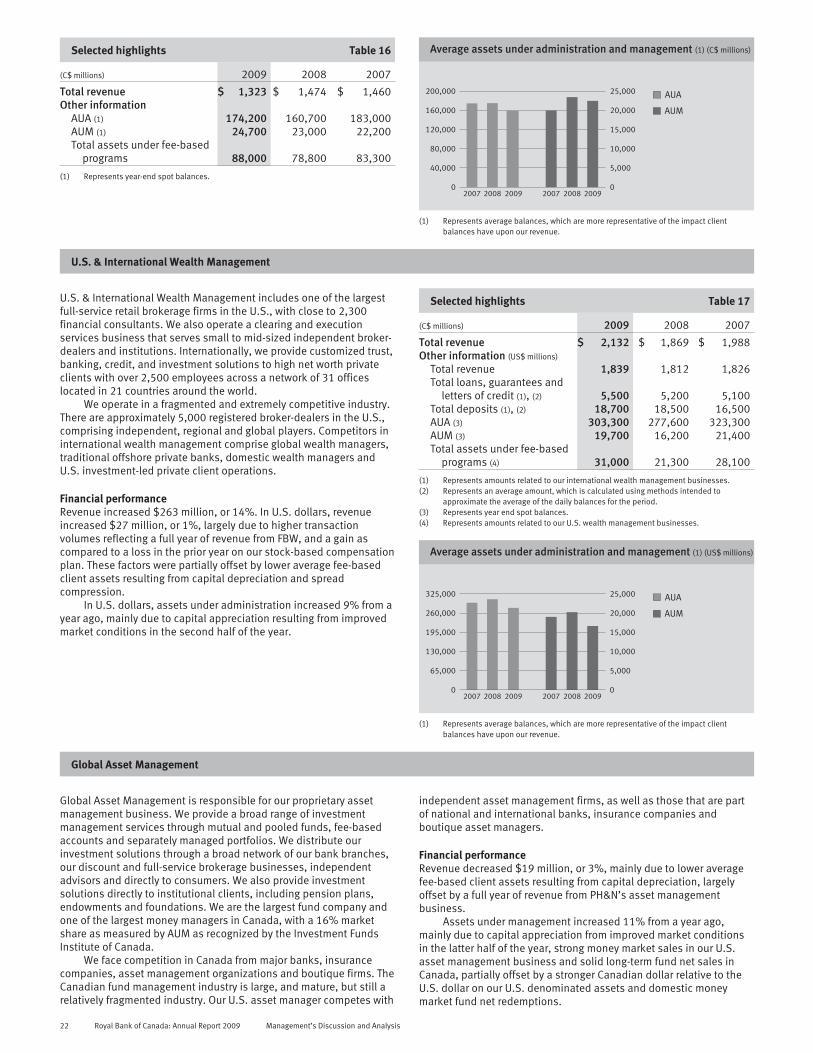
Selected highlights Table 16
(C$ millions) 2009 2008 2007
Total revenue $ 1,323 $ 1,474 $ 1,460Other information
AUA (1) 174,200 160,700 183,000AUM (1) 24,700 23,000 22,200Total assets under fee-based
programs 88,000 78,800 83,300
(1) Represents year-end spot balances.
Average assets under administration and management (1) (C$ millions)
AUM
AUA
2007 2008 2009 2007 2008 20090
40,000
80,000
120,000
160,000
200,000
0
5,000
10,000
15,000
20,000
25,000
(1) Represents average balances, which are more representative of the impact clientbalances have upon our revenue.
U.S. & International Wealth Management
U.S. & International Wealth Management includes one of the largestfull-service retail brokerage firms in the U.S., with close to 2,300financial consultants. We also operate a clearing and executionservices business that serves small to mid-sized independent broker-dealers and institutions. Internationally, we provide customized trust,banking, credit, and investment solutions to high net worth privateclients with over 2,500 employees across a network of 31 officeslocated in 21 countries around the world.
We operate in a fragmented and extremely competitive industry.There are approximately 5,000 registered broker-dealers in the U.S.,comprising independent, regional and global players. Competitors ininternational wealth management comprise global wealth managers,traditional offshore private banks, domestic wealth managers andU.S. investment-led private client operations.
Financial performanceRevenue increased $263 million, or 14%. In U.S. dollars, revenueincreased $27 million, or 1%, largely due to higher transactionvolumes reflecting a full year of revenue from FBW, and a gain ascompared to a loss in the prior year on our stock-based compensationplan. These factors were partially offset by lower average fee-basedclient assets resulting from capital depreciation and spreadcompression.
In U.S. dollars, assets under administration increased 9% from ayear ago, mainly due to capital appreciation resulting from improvedmarket conditions in the second half of the year.
Selected highlights Table 17
(C$ millions) 2009 2008 2007
Total revenue $ 2,132 $ 1,869 $ 1,988Other information (US$ millions)
Total revenue 1,839 1,812 1,826Total loans, guarantees and
letters of credit (1), (2) 5,500 5,200 5,100Total deposits (1), (2) 18,700 18,500 16,500AUA (3) 303,300 277,600 323,300AUM (3) 19,700 16,200 21,400Total assets under fee-based
programs (4) 31,000 21,300 28,100
(1) Represents amounts related to our international wealth management businesses.(2) Represents an average amount, which is calculated using methods intended to
approximate the average of the daily balances for the period.(3) Represents year end spot balances.(4) Represents amounts related to our U.S. wealth management businesses.
Average assets under administration and management (1) (US$ millions)
AUM
AUA
2007 2008 2009 2007 2008 20090
65,000
130,000
195,000
260,000
325,000
0
5,000
10,000
15,000
20,000
25,000
(1) Represents average balances, which are more representative of the impact clientbalances have upon our revenue.
Global Asset Management
Global Asset Management is responsible for our proprietary assetmanagement business. We provide a broad range of investmentmanagement services through mutual and pooled funds, fee-basedaccounts and separately managed portfolios. We distribute ourinvestment solutions through a broad network of our bank branches,our discount and full-service brokerage businesses, independentadvisors and directly to consumers. We also provide investmentsolutions directly to institutional clients, including pension plans,endowments and foundations. We are the largest fund company andone of the largest money managers in Canada, with a 16% marketshare as measured by AUM as recognized by the Investment FundsInstitute of Canada.
We face competition in Canada from major banks, insurancecompanies, asset management organizations and boutique firms. TheCanadian fund management industry is large, and mature, but still arelatively fragmented industry. Our U.S. asset manager competes with
independent asset management firms, as well as those that are partof national and international banks, insurance companies andboutique asset managers.
Financial performanceRevenue decreased $19 million, or 3%, mainly due to lower averagefee-based client assets resulting from capital depreciation, largelyoffset by a full year of revenue from PH&N’s asset managementbusiness.
Assets under management increased 11% from a year ago,mainly due to capital appreciation from improved market conditionsin the latter half of the year, strong money market sales in our U.S.asset management business and solid long-term fund net sales inCanada, partially offset by a stronger Canadian dollar relative to theU.S. dollar on our U.S. denominated assets and domestic moneymarket fund net redemptions.
22 Royal Bank of Canada: Annual Report 2009 Management’s Discussion and Analysis
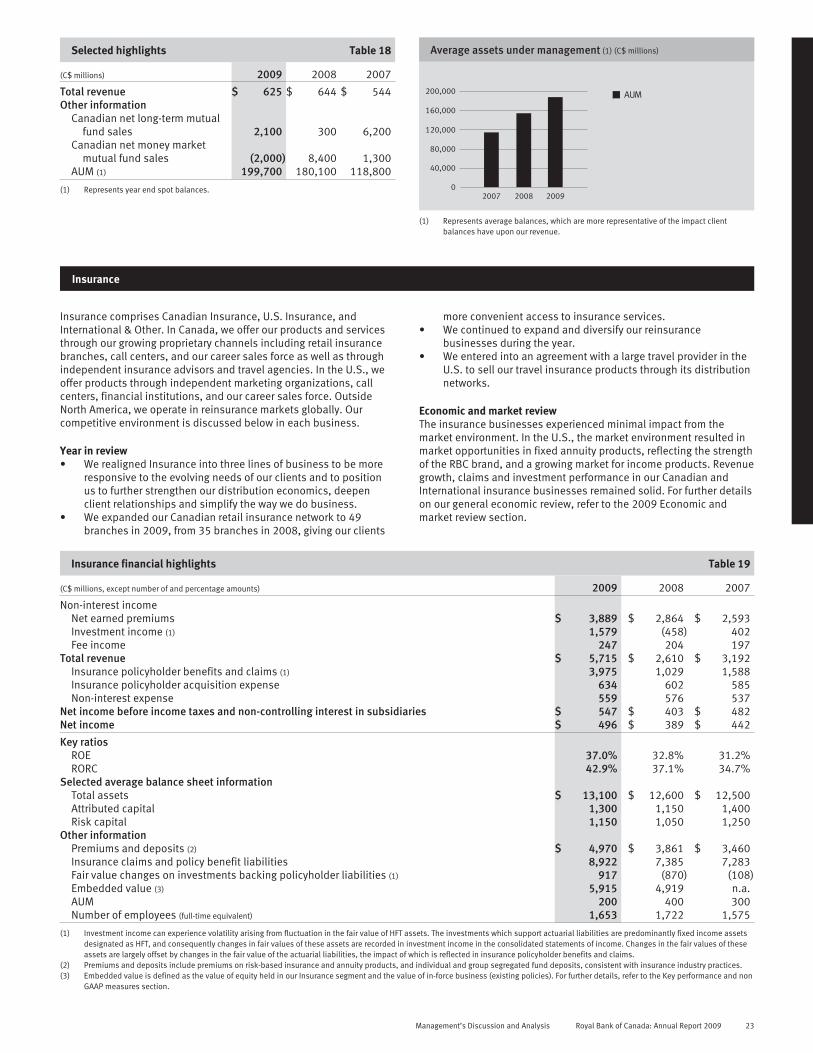
Selected highlights Table 18
(C$ millions) 2009 2008 2007
Total revenue $ 625 $ 644 $ 544Other information
Canadian net long-term mutualfund sales 2,100 300 6,200
Canadian net money marketmutual fund sales (2,000) 8,400 1,300
AUM (1) 199,700 180,100 118,800
(1) Represents year end spot balances.
(1) (C$ millions)Average assets under management
2007 2008 20090
40,000
80,000
120,000
160,000
200,000 AUM
(1) Represents average balances, which are more representative of the impact clientbalances have upon our revenue.
Insurance
Insurance comprises Canadian Insurance, U.S. Insurance, andInternational & Other. In Canada, we offer our products and servicesthrough our growing proprietary channels including retail insurancebranches, call centers, and our career sales force as well as throughindependent insurance advisors and travel agencies. In the U.S., weoffer products through independent marketing organizations, callcenters, financial institutions, and our career sales force. OutsideNorth America, we operate in reinsurance markets globally. Ourcompetitive environment is discussed below in each business.
Year in review• We realigned Insurance into three lines of business to be more
responsive to the evolving needs of our clients and to positionus to further strengthen our distribution economics, deepenclient relationships and simplify the way we do business.
• We expanded our Canadian retail insurance network to 49branches in 2009, from 35 branches in 2008, giving our clients
more convenient access to insurance services.• We continued to expand and diversify our reinsurance
businesses during the year.• We entered into an agreement with a large travel provider in the
U.S. to sell our travel insurance products through its distributionnetworks.
Economic and market reviewThe insurance businesses experienced minimal impact from themarket environment. In the U.S., the market environment resulted inmarket opportunities in fixed annuity products, reflecting the strengthof the RBC brand, and a growing market for income products. Revenuegrowth, claims and investment performance in our Canadian andInternational insurance businesses remained solid. For further detailson our general economic review, refer to the 2009 Economic andmarket review section.
Insurance financial highlights Table 19
(C$ millions, except number of and percentage amounts) 2009 2008 2007
Non-interest incomeNet earned premiums $ 3,889 $ 2,864 $ 2,593Investment income (1) 1,579 (458) 402Fee income 247 204 197
Total revenue $ 5,715 $ 2,610 $ 3,192Insurance policyholder benefits and claims (1) 3,975 1,029 1,588Insurance policyholder acquisition expense 634 602 585Non-interest expense 559 576 537
Net income before income taxes and non-controlling interest in subsidiaries $ 547 $ 403 $ 482Net income $ 496 $ 389 $ 442
Key ratiosROE 37.0% 32.8% 31.2%RORC 42.9% 37.1% 34.7%
Selected average balance sheet informationTotal assets $ 13,100 $ 12,600 $ 12,500Attributed capital 1,300 1,150 1,400Risk capital 1,150 1,050 1,250
Other informationPremiums and deposits (2) $ 4,970 $ 3,861 $ 3,460Insurance claims and policy benefit liabilities 8,922 7,385 7,283Fair value changes on investments backing policyholder liabilities (1) 917 (870) (108)Embedded value (3) 5,915 4,919 n.a.AUM 200 400 300Number of employees (full-time equivalent) 1,653 1,722 1,575
(1) Investment income can experience volatility arising from fluctuation in the fair value of HFT assets. The investments which support actuarial liabilities are predominantly fixed income assetsdesignated as HFT, and consequently changes in fair values of these assets are recorded in investment income in the consolidated statements of income. Changes in the fair values of theseassets are largely offset by changes in the fair value of the actuarial liabilities, the impact of which is reflected in insurance policyholder benefits and claims.
(2) Premiums and deposits include premiums on risk-based insurance and annuity products, and individual and group segregated fund deposits, consistent with insurance industry practices.(3) Embedded value is defined as the value of equity held in our Insurance segment and the value of in-force business (existing policies). For further details, refer to the Key performance and non
GAAP measures section.
Management’s Discussion and Analysis Royal Bank of Canada: Annual Report 2009 23
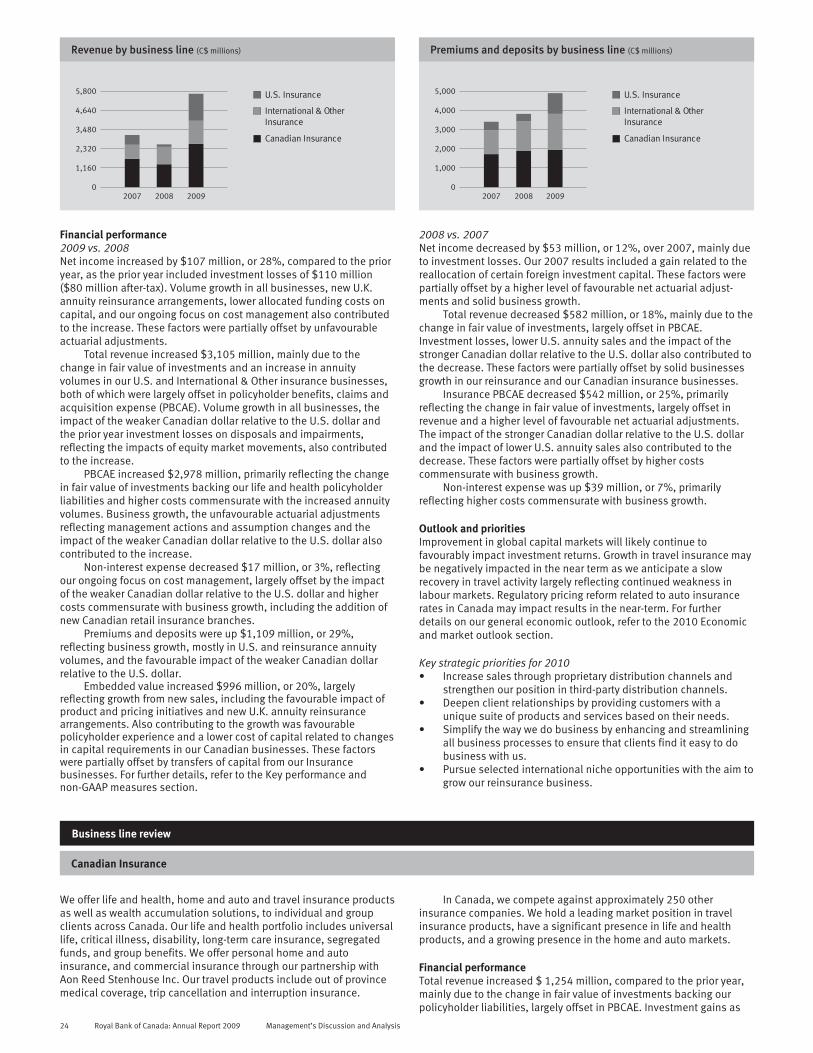
Revenue by business line (C$ millions)
2007 2008 20090
1,160
2,320
3,480
4,640
5,800
International & OtherInsurance
Canadian Insurance
U.S. Insurance
Premiums and deposits by business line (C$ millions)
2007 2008 20090
1,000
2,000
3,000
4,000
5,000
International & OtherInsurance
Canadian Insurance
U.S. Insurance
Financial performance2009 vs. 2008Net income increased by $107 million, or 28%, compared to the prioryear, as the prior year included investment losses of $110 million($80 million after-tax). Volume growth in all businesses, new U.K.annuity reinsurance arrangements, lower allocated funding costs oncapital, and our ongoing focus on cost management also contributedto the increase. These factors were partially offset by unfavourableactuarial adjustments.
Total revenue increased $3,105 million, mainly due to thechange in fair value of investments and an increase in annuityvolumes in our U.S. and International & Other insurance businesses,both of which were largely offset in policyholder benefits, claims andacquisition expense (PBCAE). Volume growth in all businesses, theimpact of the weaker Canadian dollar relative to the U.S. dollar andthe prior year investment losses on disposals and impairments,reflecting the impacts of equity market movements, also contributedto the increase.
PBCAE increased $2,978 million, primarily reflecting the changein fair value of investments backing our life and health policyholderliabilities and higher costs commensurate with the increased annuityvolumes. Business growth, the unfavourable actuarial adjustmentsreflecting management actions and assumption changes and theimpact of the weaker Canadian dollar relative to the U.S. dollar alsocontributed to the increase.
Non-interest expense decreased $17 million, or 3%, reflectingour ongoing focus on cost management, largely offset by the impactof the weaker Canadian dollar relative to the U.S. dollar and highercosts commensurate with business growth, including the addition ofnew Canadian retail insurance branches.
Premiums and deposits were up $1,109 million, or 29%,reflecting business growth, mostly in U.S. and reinsurance annuityvolumes, and the favourable impact of the weaker Canadian dollarrelative to the U.S. dollar.
Embedded value increased $996 million, or 20%, largelyreflecting growth from new sales, including the favourable impact ofproduct and pricing initiatives and new U.K. annuity reinsurancearrangements. Also contributing to the growth was favourablepolicyholder experience and a lower cost of capital related to changesin capital requirements in our Canadian businesses. These factorswere partially offset by transfers of capital from our Insurancebusinesses. For further details, refer to the Key performance andnon-GAAP measures section.
2008 vs. 2007Net income decreased by $53 million, or 12%, over 2007, mainly dueto investment losses. Our 2007 results included a gain related to thereallocation of certain foreign investment capital. These factors werepartially offset by a higher level of favourable net actuarial adjust-ments and solid business growth.
Total revenue decreased $582 million, or 18%, mainly due to thechange in fair value of investments, largely offset in PBCAE.Investment losses, lower U.S. annuity sales and the impact of thestronger Canadian dollar relative to the U.S. dollar also contributed tothe decrease. These factors were partially offset by solid businessesgrowth in our reinsurance and our Canadian insurance businesses.
Insurance PBCAE decreased $542 million, or 25%, primarilyreflecting the change in fair value of investments, largely offset inrevenue and a higher level of favourable net actuarial adjustments.The impact of the stronger Canadian dollar relative to the U.S. dollarand the impact of lower U.S. annuity sales also contributed to thedecrease. These factors were partially offset by higher costscommensurate with business growth.
Non-interest expense was up $39 million, or 7%, primarilyreflecting higher costs commensurate with business growth.
Outlook and prioritiesImprovement in global capital markets will likely continue tofavourably impact investment returns. Growth in travel insurance maybe negatively impacted in the near term as we anticipate a slowrecovery in travel activity largely reflecting continued weakness inlabour markets. Regulatory pricing reform related to auto insurancerates in Canada may impact results in the near-term. For furtherdetails on our general economic outlook, refer to the 2010 Economicand market outlook section.
Key strategic priorities for 2010• Increase sales through proprietary distribution channels and
strengthen our position in third-party distribution channels.• Deepen client relationships by providing customers with a
unique suite of products and services based on their needs.• Simplify the way we do business by enhancing and streamlining
all business processes to ensure that clients find it easy to dobusiness with us.
• Pursue selected international niche opportunities with the aim togrow our reinsurance business.
Business line review
Canadian Insurance
We offer life and health, home and auto and travel insurance productsas well as wealth accumulation solutions, to individual and groupclients across Canada. Our life and health portfolio includes universallife, critical illness, disability, long-term care insurance, segregatedfunds, and group benefits. We offer personal home and autoinsurance, and commercial insurance through our partnership withAon Reed Stenhouse Inc. Our travel products include out of provincemedical coverage, trip cancellation and interruption insurance.
In Canada, we compete against approximately 250 otherinsurance companies. We hold a leading market position in travelinsurance products, have a significant presence in life and healthproducts, and a growing presence in the home and auto markets.
Financial performanceTotal revenue increased $ 1,254 million, compared to the prior year,mainly due to the change in fair value of investments backing ourpolicyholder liabilities, largely offset in PBCAE. Investment gains as
24 Royal Bank of Canada: Annual Report 2009 Management’s Discussion and Analysis

compared to losses in the prior year, solid business growth in life andhome and auto products and lower allocated funding costs on capitalalso contributed to the increase.
Premiums and deposits increased $49 million, or 3%, reflectingsales growth in life, and home and auto products. In addition, wecontinued to experience strong client and policy retention in thesebusinesses.
Selected highlights Table 20
(C$ millions) 2009 2008 2007
Total revenue $ 2,654 $ 1,400 $ 1,733Other information
Premiums and depositsLife and health 1,210 1,188 1,141Property and casualty 708 643 600Annuity and segregated
fund deposits 46 84 5Fair value changes on
investments backingpolicyholder liabilities 452 (524) (93)
Premiums and deposits (C$ millions)
2007 2008 20090
500
1,000
1,500
2,000 Premiums and deposits
U.S. Insurance
We offer life insurance, annuities and travel insurance to clientsacross the United States. Life and health products include term,indexed universal life, whole life, accidental death and critical illnessprotection. We also offer traditional fixed and fixed-indexed annuities.Travel insurance products include trip cancellation, interruptioninsurance and emergency medical coverage.
There are approximately 2,000 active life and health insurancecompanies operating in the United States. We rank in the top 100 intotal life insurance policies in force and are a top 15 provider of fixedindexed annuities.
Selected highlights Table 21
(C$ millions) 2009 2008 2007
Total revenue $ 1,662 $ 146 $ 601Fair Value changes on investments
backing policyholder liabilities 458 (346) (18)Other information (US$ millions)
Total revenue 1,448 166 553Premiums and deposits
Life and health 247 263 260Property and casualty 11 4 3Annuity 704 115 159
Fair value changes on investmentsbacking policyholder liabilities 400 (313) (13)
Financial performanceTotal revenue increased $1,516 million, compared to the prior year,largely due to the change in fair value of investments backing ourpolicyholder liabilities and increased annuity volumes, both largelyoffset in PBCAE. The impact of the weaker Canadian dollar relative tothe U.S. dollar also contributed to the increase. These factors werepartially offset by higher investment losses.
Premiums and deposits increased $708 million, reflecting strongfixed annuity deposit growth and the impact of the weaker Canadiandollar relative to the U.S. dollar.
Premiums and deposits (US$ millions)
2007 2008 20090
240
480
1,200
960
720
Premiums and deposits
International & Other Insurance
International & Other Insurance is primarily comprised of ourReinsurance businesses which insure risks of other insurance andreinsurance companies. We offer life & health, accident, and creditand financial reinsurance products. We continued to expand into thelife annuity reinsurance market.
The global reinsurance market is dominated by a few largeplayers, with significant presence in the U.S., U.K. and Eurozone. Thereinsurance industry is competitive and barriers to entry remain high.
Financial performanceTotal revenue increased $335 million, or 31%, over the prior year,primarily due to growth in our European life and other life retrocessionbusinesses and the continued expansion of our U.K. annuityreinsurance business.
Premiums and deposits increased $352 million, or 23%,primarily for the reasons noted above.
Management’s Discussion and Analysis Royal Bank of Canada: Annual Report 2009 25

Selected highlights Table 22
(C$ millions) 2009 2008 2007Total revenue $ 1,399 $ 1,064 $ 858Other information
Premiums and depositsLife and health 1,643 1,374 1,199Property and casualty 41 52 52Annuity 219 125 –
Premiums and deposits (C$ millions)
2007 2008 20090
800
400
1,200
1,600
2,000 Premiums and deposits
International Banking
International Banking comprises Banking and our joint venture, RBCDexia Investor Services (RBC Dexia IS). Banking includes our bankingbusinesses in the U.S. and Caribbean, which offer a broad range offinancial products and services to individuals, business clients andpublic institutions in their respective markets. RBC Dexia IS offers anintegrated suite of products to institutional investors worldwide. Ourcompetitive environment is discussed below in each business.
Year in review• In light of our performance during the extremely challenging
economic and market conditions in the U.S. since mid-2008, webegan restructuring our U.S. banking business, which involvesrealigning our distribution capabilities, governance structure andrisk management, reducing management layers, streamliningend-to-end processes, and strengthening our senior managementteam to improve effectiveness and efficiency in order to enhanceour competitive position in the southeastern U.S.
• In the Caribbean, we continue to integrate RBTT as we move toestablish a common platform for growth and expansion in theregion. We also opened our new Caribbean headquarters inTrinidad, which will serve as the centre of our Caribbean bankingnetwork.
• RBC Dexia IS announced an agreement to acquire UBI Banca’sdepositary bank business (1). The acquisition will enhance ourpresence in key markets in Europe, broaden the scope of ourcapabilities and strengthen our client base.
Economic and market reviewRecessionary conditions and the challenging market environmentresulted in higher PCL and losses on our AFS portfolios in U.S.banking. Our results were also impacted by continued spreadcompression in both the U.S. and Caribbean due to historically lowinterest rates and competitive pressures. In the Eurozone, the impactof economic and market conditions on RBC Dexia IS resulted in lowertransaction volumes and reduced fee-based client assets. For furtherdetails on our general economic review, refer to the 2009 Economicand market review section.
In 2009, we recorded a goodwill impairment charge whichreflected the continuing impact of the deterioration in the overall U.S.economic environment, including declines in the U.S. housing marketand in the market value of U.S. banks. For further details, refer to Note10 to our Consolidated Financial Statements.
(1) The acquisition is subject to regulatory and other customary closing conditions and isexpected to close in the first half of 2010.
International Banking financial highlights Table 23
(C$ millions, except number of and percentage amounts) 2009 2008 2007Net interest income $ 1,687 $ 1,330 $ 1,031Non-interest income 903 771 884
Total revenue $ 2,590 $ 2,101 $ 1,915PCL 980 497 109Non-interest expense 2,346 1,876 1,481Goodwill impairment charge 1,000 – –
Net (loss) income before income taxes and non-controlling interest in subsidiaries $ (1,736) $ (272) $ 325Net (loss) income $ (1,446) $ (153) $ 242Key ratios
ROE (19.4)% (3.4)% 6.9%RORC (49.1)% (8.1)% 11.7%
Selected average balance sheet informationTotal assets $ 63,700 $ 51,300 $ 39,700Loans and acceptances 35,800 27,000 22,300Deposits 51,600 42,500 34,200Attributed capital 7,750 5,200 3,350Risk capital 3,050 2,150 1,950
Other informationAUA - RBC (1) $ 7,700 $ 11,200 $ –
- RBC Dexia IS (2) 2,484,400 2,585,000 2,713,100AUM - RBC (1) 3,800 3,900 –Number of employees (full-time equivalent) 11,462 12,335 6,001
Credit informationGross impaired loans as a percentage of average net loans and acceptances 8.80% 5.97% 1.81%Specific PCL as a percentage of average net loans and acceptances 2.74% 1.84% .49%
Impact of US$ and Euro translation on selected items 2009 vs. 2008Increased (decreased) total revenue $ 134Increased (decreased) PCL 94Increased (decreased) non-interest expense 142Increased (decreased) net income (70)Percentage change in average US$ equivalent of C$1.00 (11)%Percentage change in average Euro equivalent of C$1.00 (4)%
(1) These represent the AUA and AUM of RBTT, reported on a one-month lag.(2) Represents the total AUA of the joint venture, of which we have a 50% ownership interest, reported on a one-month lag.
26 Royal Bank of Canada: Annual Report 2009 Management’s Discussion and Analysis
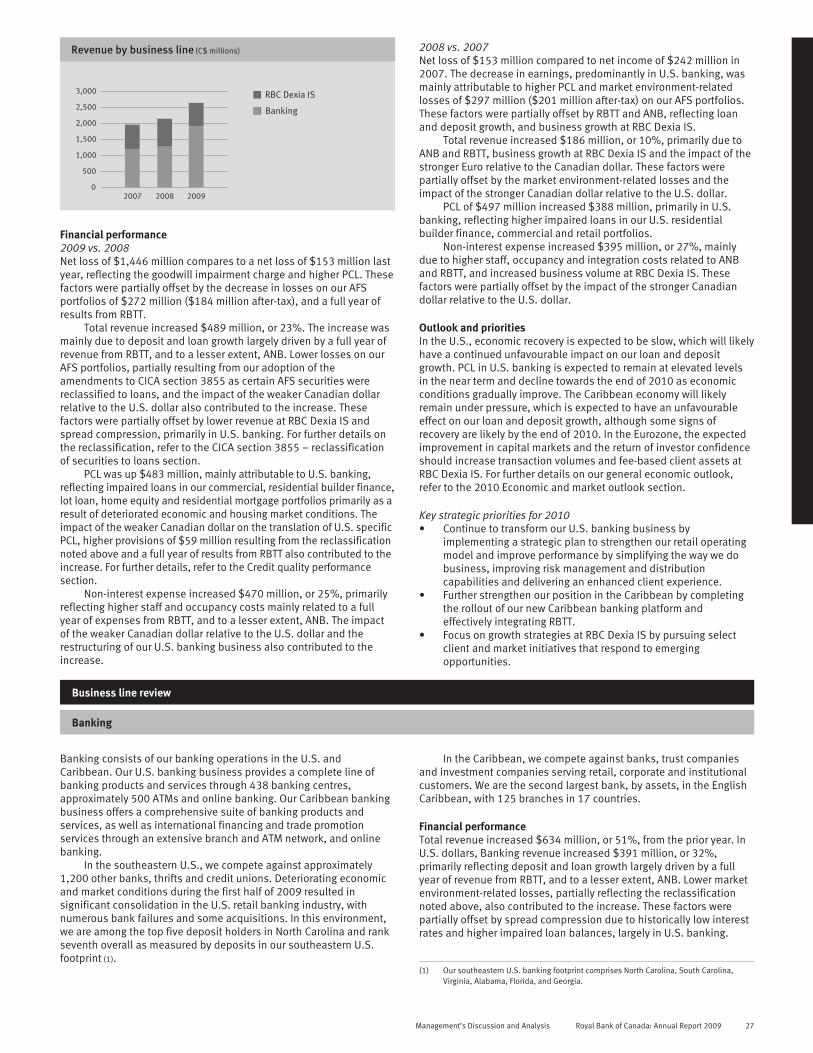
Revenue by business line (C$ millions)
2007 2008 20090
500
1,000
1,500
2,000
3,000
2,500 Banking
RBC Dexia IS
Financial performance2009 vs. 2008Net loss of $1,446 million compares to a net loss of $153 million lastyear, reflecting the goodwill impairment charge and higher PCL. Thesefactors were partially offset by the decrease in losses on our AFSportfolios of $272 million ($184 million after-tax), and a full year ofresults from RBTT.
Total revenue increased $489 million, or 23%. The increase wasmainly due to deposit and loan growth largely driven by a full year ofrevenue from RBTT, and to a lesser extent, ANB. Lower losses on ourAFS portfolios, partially resulting from our adoption of theamendments to CICA section 3855 as certain AFS securities werereclassified to loans, and the impact of the weaker Canadian dollarrelative to the U.S. dollar also contributed to the increase. Thesefactors were partially offset by lower revenue at RBC Dexia IS andspread compression, primarily in U.S. banking. For further details onthe reclassification, refer to the CICA section 3855 – reclassificationof securities to loans section.
PCL was up $483 million, mainly attributable to U.S. banking,reflecting impaired loans in our commercial, residential builder finance,lot loan, home equity and residential mortgage portfolios primarily as aresult of deteriorated economic and housing market conditions. Theimpact of the weaker Canadian dollar on the translation of U.S. specificPCL, higher provisions of $59 million resulting from the reclassificationnoted above and a full year of results from RBTT also contributed to theincrease. For further details, refer to the Credit quality performancesection.
Non-interest expense increased $470 million, or 25%, primarilyreflecting higher staff and occupancy costs mainly related to a fullyear of expenses from RBTT, and to a lesser extent, ANB. The impactof the weaker Canadian dollar relative to the U.S. dollar and therestructuring of our U.S. banking business also contributed to theincrease.
2008 vs. 2007Net loss of $153 million compared to net income of $242 million in2007. The decrease in earnings, predominantly in U.S. banking, wasmainly attributable to higher PCL and market environment-relatedlosses of $297 million ($201 million after-tax) on our AFS portfolios.These factors were partially offset by RBTT and ANB, reflecting loanand deposit growth, and business growth at RBC Dexia IS.
Total revenue increased $186 million, or 10%, primarily due toANB and RBTT, business growth at RBC Dexia IS and the impact of thestronger Euro relative to the Canadian dollar. These factors werepartially offset by the market environment-related losses and theimpact of the stronger Canadian dollar relative to the U.S. dollar.
PCL of $497 million increased $388 million, primarily in U.S.banking, reflecting higher impaired loans in our U.S. residentialbuilder finance, commercial and retail portfolios.
Non-interest expense increased $395 million, or 27%, mainlydue to higher staff, occupancy and integration costs related to ANBand RBTT, and increased business volume at RBC Dexia IS. Thesefactors were partially offset by the impact of the stronger Canadiandollar relative to the U.S. dollar.
Outlook and prioritiesIn the U.S., economic recovery is expected to be slow, which will likelyhave a continued unfavourable impact on our loan and depositgrowth. PCL in U.S. banking is expected to remain at elevated levelsin the near term and decline towards the end of 2010 as economicconditions gradually improve. The Caribbean economy will likelyremain under pressure, which is expected to have an unfavourableeffect on our loan and deposit growth, although some signs ofrecovery are likely by the end of 2010. In the Eurozone, the expectedimprovement in capital markets and the return of investor confidenceshould increase transaction volumes and fee-based client assets atRBC Dexia IS. For further details on our general economic outlook,refer to the 2010 Economic and market outlook section.
Key strategic priorities for 2010• Continue to transform our U.S. banking business by
implementing a strategic plan to strengthen our retail operatingmodel and improve performance by simplifying the way we dobusiness, improving risk management and distributioncapabilities and delivering an enhanced client experience.
• Further strengthen our position in the Caribbean by completingthe rollout of our new Caribbean banking platform andeffectively integrating RBTT.
• Focus on growth strategies at RBC Dexia IS by pursuing selectclient and market initiatives that respond to emergingopportunities.
Business line review
Banking
Banking consists of our banking operations in the U.S. andCaribbean. Our U.S. banking business provides a complete line ofbanking products and services through 438 banking centres,approximately 500 ATMs and online banking. Our Caribbean bankingbusiness offers a comprehensive suite of banking products andservices, as well as international financing and trade promotionservices through an extensive branch and ATM network, and onlinebanking.
In the southeastern U.S., we compete against approximately1,200 other banks, thrifts and credit unions. Deteriorating economicand market conditions during the first half of 2009 resulted insignificant consolidation in the U.S. retail banking industry, withnumerous bank failures and some acquisitions. In this environment,we are among the top five deposit holders in North Carolina and rankseventh overall as measured by deposits in our southeastern U.S.footprint (1).
In the Caribbean, we compete against banks, trust companiesand investment companies serving retail, corporate and institutionalcustomers. We are the second largest bank, by assets, in the EnglishCaribbean, with 125 branches in 17 countries.
Financial performanceTotal revenue increased $634 million, or 51%, from the prior year. InU.S. dollars, Banking revenue increased $391 million, or 32%,primarily reflecting deposit and loan growth largely driven by a fullyear of revenue from RBTT, and to a lesser extent, ANB. Lower marketenvironment-related losses, partially reflecting the reclassificationnoted above, also contributed to the increase. These factors werepartially offset by spread compression due to historically low interestrates and higher impaired loan balances, largely in U.S. banking.
(1) Our southeastern U.S. banking footprint comprises North Carolina, South Carolina,Virginia, Alabama, Florida, and Georgia.
Management’s Discussion and Analysis Royal Bank of Canada: Annual Report 2009 27

In U.S. dollars, average deposits and average loans andacceptances both increased $6 billion, or 26% and 24%, respectively.The increase was mainly due to growth in loans and acceptances of89%, and deposits of 72% in Caribbean banking, largely reflectingRBTT. In U.S. banking, loans and acceptances, and deposits grew12% and 10%, respectively, primarily attributable to ANB.
Selected highlights Table 24
(C$ millions, except percentage amounts) 2009 (1) 2008 (1) 2007
Total revenue $ 1,880 $ 1,246 $ 1,156Other information (US$ millions)
Total revenue 1,612 1,221 1,059Net interest margin 3.57% 3.62% 3.56%Average loans and acceptances $ 30,000 $ 24,100 $ 17,800Average deposits 30,300 24,100 17,700AUA 7,100 9,300 –AUM 3,500 3,300 –
Number of:Branches 563 566 394ATMs 816 815 473
(1) RBTT reports on a one-month lag. For 2008, our results included RBTT results fromJune 16 to September 30.
Average loans and deposits (US$ millions)
Deposits
Loans and acceptances
0
35,000
2007 20092008 2007 20092008
7,000
14,000
21,000
28,000
RBC Dexia IS
RBC Dexia IS, of which we have a 50% ownership interest, offersglobal custody, fund and pension administration, securities lending,shareholder services, analytics and other related services to institu-tional investors.
RBC Dexia IS, with offices in 16 countries on four continents,competes against the world’s largest global custodians and, incertain markets, against select local financial institutions providinginvestor services. Although competition continues to be intense, RBCDexia IS ranks among the top 10 global custodians and consistentlyachieves top quartile standing in leading industry surveys.
Financial performanceTotal revenue decreased $145 million, or 17%, compared to last year,mainly due to lower transaction volumes and reduced fee-based
client assets, reflecting capital depreciation. These factors werepartially offset by the impact of the weaker Canadian dollar relative tothe Euro.
Assets under administration decreased 4%, largely reflectingcapital depreciation.
Selected highlights Table 25
(C$ millions) 2009 2008 2007Total revenue $ 710 $ 855 $ 759Other information
AUA (1) 2,484,400 2,585,000 2,713,100(1) Represents the total AUA of the joint venture, of which we have a 50% ownership
interest, reported on a one-month lag.
Capital Markets
Capital Markets comprises our global wholesale banking businessesproviding corporate, public sector and institutional clients with a widerange of products and services. In North America we offer a full suiteof products and service capabilities and have long-standing and deeprelationships with our clients. Internationally, we have a select butdiversified set of capabilities, which includes fixed income, equity,foreign exchange, structured products, and investment banking. Thissegment comprises Capital Markets Sales and Trading and Corporateand Investment Banking. Our competitive environment is discussedbelow in each business.
Year in review• We acted as global coordinator in a US$4.0 billion equity
offering which was the largest bought deal ever globally, thelargest equity offering for a gold producer and the largest equityoffering ever completed by a Canadian company.
• We continued to take advantage of market opportunities byattracting top talent and building teams in our U.S. andEuropean operations, further expanding key businesses andestablishing new client relationships. As a result of investmentsin infrastructure and talent we have increased our market shareacross several businesses in the U.S., including building asignificant U.S. dollar fixed income and currencies presence.
• We are the only Canadian bank currently designated as a primarydealer in the U.S. which gives us increased access to clients,
greater information and market insight anddemonstrates our ongoing commitment to our U.S. fixed incometrading business.
• We continue to be Canada’s leading global investment bank,and were again named Dealmaker of the Year in Canada(Financial Post); Best Investment Bank in Canada winning allthree categories – debt, equity, and M&A (Euromoney); and aleader in Canadian equity underwriting and corporate debtfinancing (Bloomberg/Thomson Reuters). We were alsorecognized as the Best Overall Credit House in Europe (CreditMagazine’s 2009 European Credit Awards), recognizing thesuccess of our credit trading businesses.
Economic and market reviewImprovements in global capital markets and easing of credit marketsduring the latter half of 2009 resulted in lower total marketenvironment-related net losses for 2009 in Capital Markets. Many ofour trading businesses benefitted from favourable marketopportunities, wider bid/ask spreads, the lower interest rateenvironment, increased client activity and narrowing credit spreads.However, trading results moderated as market conditions stabilized inthe latter part of 2009. Traditional investment banking activitiesincreased in 2009 from the prior year mainly in the latter half of theyear and largely in Canada. For further details on our general economicreview, refer to the 2009 Economic and market review section.
28 Royal Bank of Canada: Annual Report 2009 Management’s Discussion and Analysis
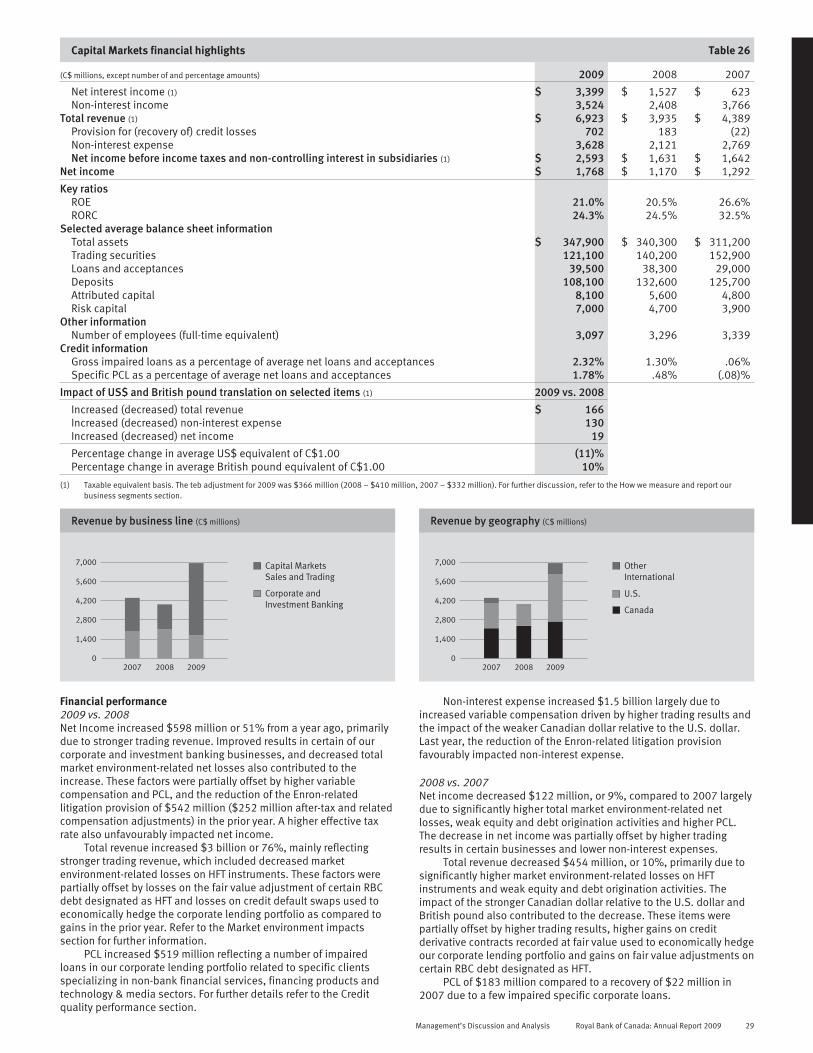
Capital Markets financial highlights Table 26
(C$ millions, except number of and percentage amounts) 2009 2008 2007
Net interest income (1) $ 3,399 $ 1,527 $ 623Non-interest income 3,524 2,408 3,766
Total revenue (1) $ 6,923 $ 3,935 $ 4,389Provision for (recovery of) credit losses 702 183 (22)Non-interest expense 3,628 2,121 2,769Net income before income taxes and non-controlling interest in subsidiaries (1) $ 2,593 $ 1,631 $ 1,642
Net income $ 1,768 $ 1,170 $ 1,292
Key ratiosROE 21.0% 20.5% 26.6%RORC 24.3% 24.5% 32.5%
Selected average balance sheet informationTotal assets $ 347,900 $ 340,300 $ 311,200Trading securities 121,100 140,200 152,900Loans and acceptances 39,500 38,300 29,000Deposits 108,100 132,600 125,700Attributed capital 8,100 5,600 4,800Risk capital 7,000 4,700 3,900
Other informationNumber of employees (full-time equivalent) 3,097 3,296 3,339
Credit informationGross impaired loans as a percentage of average net loans and acceptances 2.32% 1.30% .06%Specific PCL as a percentage of average net loans and acceptances 1.78% .48% (.08)%
Impact of US$ and British pound translation on selected items (1) 2009 vs. 2008
Increased (decreased) total revenue $ 166Increased (decreased) non-interest expense 130Increased (decreased) net income 19
Percentage change in average US$ equivalent of C$1.00 (11)%Percentage change in average British pound equivalent of C$1.00 10%
(1) Taxable equivalent basis. The teb adjustment for 2009 was $366 million (2008 – $410 million, 2007 – $332 million). For further discussion, refer to the How we measure and report ourbusiness segments section.
Revenue by business line (C$ millions)
2007 2008 20090
1,400
2,800
4,200
5,600
7,000
Corporate andInvestment Banking
Capital MarketsSales and Trading
Revenue by geography (C$ millions)
2007 2008 20090
1,400
2,800
4,200
5,600
7,000
U.S.
Canada
OtherInternational
Financial performance2009 vs. 2008Net Income increased $598 million or 51% from a year ago, primarilydue to stronger trading revenue. Improved results in certain of ourcorporate and investment banking businesses, and decreased totalmarket environment-related net losses also contributed to theincrease. These factors were partially offset by higher variablecompensation and PCL, and the reduction of the Enron-relatedlitigation provision of $542 million ($252 million after-tax and relatedcompensation adjustments) in the prior year. A higher effective taxrate also unfavourably impacted net income.
Total revenue increased $3 billion or 76%, mainly reflectingstronger trading revenue, which included decreased marketenvironment-related losses on HFT instruments. These factors werepartially offset by losses on the fair value adjustment of certain RBCdebt designated as HFT and losses on credit default swaps used toeconomically hedge the corporate lending portfolio as compared togains in the prior year. Refer to the Market environment impactssection for further information.
PCL increased $519 million reflecting a number of impairedloans in our corporate lending portfolio related to specific clientsspecializing in non-bank financial services, financing products andtechnology & media sectors. For further details refer to the Creditquality performance section.
Non-interest expense increased $1.5 billion largely due toincreased variable compensation driven by higher trading results andthe impact of the weaker Canadian dollar relative to the U.S. dollar.Last year, the reduction of the Enron-related litigation provisionfavourably impacted non-interest expense.
2008 vs. 2007Net income decreased $122 million, or 9%, compared to 2007 largelydue to significantly higher total market environment-related netlosses, weak equity and debt origination activities and higher PCL.The decrease in net income was partially offset by higher tradingresults in certain businesses and lower non-interest expenses.
Total revenue decreased $454 million, or 10%, primarily due tosignificantly higher market environment-related losses on HFTinstruments and weak equity and debt origination activities. Theimpact of the stronger Canadian dollar relative to the U.S. dollar andBritish pound also contributed to the decrease. These items werepartially offset by higher trading results, higher gains on creditderivative contracts recorded at fair value used to economically hedgeour corporate lending portfolio and gains on fair value adjustments oncertain RBC debt designated as HFT.
PCL of $183 million compared to a recovery of $22 million in2007 due to a few impaired specific corporate loans.
Management’s Discussion and Analysis Royal Bank of Canada: Annual Report 2009 29

Non-interest expense decreased $648 million, or 23%, mainlydue to the reduction of the Enron-related litigation provision andlower variable compensation mostly attributable to marketenvironment-related losses on HFT instruments and the impact of astronger Canadian dollar relative to the U.S. dollar and British pound.These factors were partially offset by higher infrastructure invest-ments in certain businesses and sundry losses.
Outlook and prioritiesIncreases in equity and debt origination and M&A fees in the near-term are likely as market and economic conditions are expected toimprove. We anticipate that most of our trading businesses willperform at a more moderate level in 2010 due to expected lowermarket volatility, narrower bid/ask and credit spreads, the potentialeasing of government liquidity programs, increased competition andrising interest rates. Our lending businesses will likely be impacted bynarrower credit spreads affecting revenue, while lower PCL is antici-pated resulting from projected improved economic conditions in thenear-term. Our trading revenue may be impacted by changes to theregulatory environment in which we operate due to higher capitalrequirements and new leverage requirements. We expect significantlylower total market environment-related net losses as markets areexpected to continue to stabilize in the near-term. For further details
on our general economic outlook, refer to the 2010 Economic andmarket outlook section.
Key strategic priorities for 2010• To remain the undisputed leader in Canada.• We intend to be a top-tier provider of both client and trading
focused products and services in the U.S., which includesincreases in origination activities and expansion of our clientbase in our investment banking businesses and furtherexpansion of our fixed income trading businesses by leveragingour designation as a primary dealer.
• Continue to grow our businesses in Europe and Asia byleveraging our strength in fixed income and other tradingproducts. Our investment banking businesses will remainfocused on expanding our share of energy and mining clients.
• Further invest in our commodities businesses to establish aleading energy trading and marketing platform in North Americaand Europe by leveraging our existing expertise in this sector.
• We will continue to manage our balance sheet to position assetsfor the highest return, maintain a diverse portfolio of businessesand manage market and credit risk within established enterpriseconstraints. We remain committed to prudent cost managementwhile making investments in our risk and control infrastructure.
Business line review
Capital Markets Sales and Trading
Capital Markets Sales and Trading comprises our trading anddistribution operations largely related to fixed income, foreignexchange, equities and derivative products for institutional andcorporate clients and our proprietary trading operations.
Our Capital Markets Sales and Trading businesses compete withglobal and regional investment banks. We have taken advantage ofmarket opportunities resulting from the market disruption as anumber of competitors have exited or have significantly reduced theirinvestments related to these areas.
Financial performanceCapital Markets Sales and Trading revenue increased $3.4 billionfrom a year ago largely reflecting stronger trading revenue, whichincluded a decrease in market environment-related losses on HFTinstruments and gains on credit valuation adjustments on certainderivative contracts as compared to losses in the prior year. Strongperformances in our U.S.-based equity and global fixed income andmoney markets businesses contributed to the increase in tradingrevenue. These factors were partially offset by losses on fair valueadjustments on certain RBC debt designated as HFT, resulting fromthe narrowing of our credit spreads as compared to gains in the prioryear.
Selected highlights Table 27
(C$ millions) 2009 2008 2007
Total revenue $ 5,247 $ 1,824 $ 2,453Other information
Average assets 315,700 309,700 282,900FTE 1,493 1,595 1,655
Total revenue (C$ millions)
2007 2008 20090
5,500
1,100
2,200
3,300
4,400
Total revenue
Corporate and Investment Banking
Corporate and Investment Banking comprises our investmentbanking, debt and equity origination, advisory services, corporatelending, private equity, and client securitization businesses. It alsoincludes our global credit business, which oversees the managementof our lending portfolios and global financial institutions business.Our Research group offers economic and securities research toinstitutional and retail clients globally.
Our Corporate and Investment Banking businesses primarilycompete with global investment banks, commercial banks andboutique firms. We have an established reputation as a premierCanadian investment bank with top-tier market share in virtually alllines of wholesale business in Canada.
Financial performanceCorporate and Investment Banking revenue decreased $435 millionas compared to the prior year.
Gross underwriting and advisory fees revenue increased $139million primarily due to improved equity origination activity largely inCanada and higher debt origination activities mainly in the U.S.resulting from improved global equity markets and easing of creditmarkets, during the latter half of 2009. These increases were partiallyoffset by lower M&A fees, largely reflecting a strong fourth quarterperformance in the prior year. However, M&A fees increasedthroughout 2009, largely resulting from improved market conditions.
Other revenue decreased by $574 million largely reflecting losseson credit default swaps recorded at fair value used to economicallyhedge the corporate loan portfolio, compared to gains recognized inthe prior year. These factors were partially offset by higher revenuefrom our client securitization and core lending businesses.
30 Royal Bank of Canada: Annual Report 2009 Management’s Discussion and Analysis

Selected highlights Table 28
(C$ millions) 2009 2008 2007
Total revenue $ 1,676 $ 2,111 $ 1,936Other information
Gross underwriting andadvisory fees 789 650 949
Other revenue (1) 887 1,461 987Average assets 32,200 30,600 28,300FTE 1,604 1,701 1,684
(1) Other includes revenue associated with our core lending portfolio and syndicatedfinance, private equity distributions and gains/losses on private equity investments.
Gross underwriting and advisory fees and Other revenue (C$ millions)
2007 200920080
2,200
Gross underwritingand advisory fees
Other
440
880
1,320
1,760
Corporate Support
Corporate Support comprises Operations, Technology and Functions.Our Operations and Technology teams provide the operational andtechnological foundation required to effectively deliver products andservices to our clients, while Functions includes our corporatetreasury, finance, human resources, risk management, internal auditand other functional groups. The associated costs are largelyallocated to the business segments, although certain activitiesrelated to monitoring and oversight of the enterprise reside withinthis segment.
Reported results for Corporate Support mainly reflect activitiesthat are undertaken for the enterprise, and which are not allocated tothe business segments. For further details, refer to the How wemeasure and report our business segments section.
Due to the nature of activities and consolidated adjustmentsreported in this segment, we believe that a year-over-year analysis isnot relevant. The following identifies the material items affecting thereported results in each year.
Corporate Support financial highlights Table 29
(C$ millions) 2009 2008 2007
Net interest income (1) $ (924) $ (995) $ (732)Non-interest income 832 358 377
Total revenue (1) $ (92) $ (637) $ (355)Provision for (recovery of) credit losses (2) 456 47 (85)Non-interest expense 34 (18) 36
Net loss before income taxes and non-controlling interest in subsidiaries (1) $ (582) $ (666) $ (306)Net (loss) income $ (206) $ (178) $ 209
SecuritizationTotal securitizations sold and outstanding (3) $ 32,685 $ 19,316 $ 17,889New securitization activity in the year (4) 18,689 6,482 4,264
Other informationNumber of employees (full-time equivalent) 20,876 20,794 20,349
(1) Taxable equivalent basis. For further discussion, refer to the How we measure and report our business segments section. These amounts included the elimination of the adjustments relatedto the gross-up of income from Canadian taxable corporate dividends recorded in Capital Markets of $366 million in 2009 (2008 – $410 million, 2007 – $332 million).
(2) PCL in Corporate Support comprises the general provision and an adjustment related to PCL on securitized credit card loans managed by Canadian Banking. For further information, refer tothe How we measure and report our business segments section.
(3) Total securitizations sold and outstanding comprises credit card loans and residential mortgages.(4) New securitization activity comprises Canadian residential mortgages and credit card loans securitized and sold in the year. For further details, refer to Note 5 to our Consolidated Financial
Statements. This amount does not include Canadian residential mortgage and commercial mortgage securitization activity of Capital Markets.
2009Net loss of $206 million included a general provision for credit lossesof $589 million ($391 million after-tax), losses on certain AFSsecurities of $419 million ($390 million of market environment-related losses), including a loss of $144 million ($99 million after-tax)in the latter part of the year on certain Canadian bank commonshares. Losses on fair value adjustments of $217 million ($151million after-tax) on certain RBC debt designated as HFT, reflecting thetightening of our credit spreads also contributed to the loss. Thesefactors were partially offset by securitization gains inclusive of newand re-investment related activity, net of economic hedging activities,totaling $918 million ($630 million after-tax), mainly due to a higherthan historical level of securitization activity from our participation ingovernment-sponsored funding programs. For further details on thegeneral provision, refer to the Credit quality performance section.
2008Net loss of $178 million included market environment-related lossesof $268 million ($210 million after-tax) on certain AFS securities and$129 million ($87 million after-tax) on certain HFT securities. The netloss also reflected an increase in the general allowance of $145million ($98 million after-tax) and a foreign currency translationadjustment related to our U.S. dollar-denominated deposits used tofund certain U.S. dollar-denominated AFS securities. These factorswere partially offset by income tax amounts largely related toenterprise funding activities that were not allocated to the segments,the gain on fair value adjustments on certain RBC debt designated asHFT of $190 million ($129 million after-tax), reflecting the widening ofour credit spreads, gains related to the change in fair value of certainderivatives used to economically hedge our funding activities andgains related to securitization activity.
Management’s Discussion and Analysis Royal Bank of Canada: Annual Report 2009 31
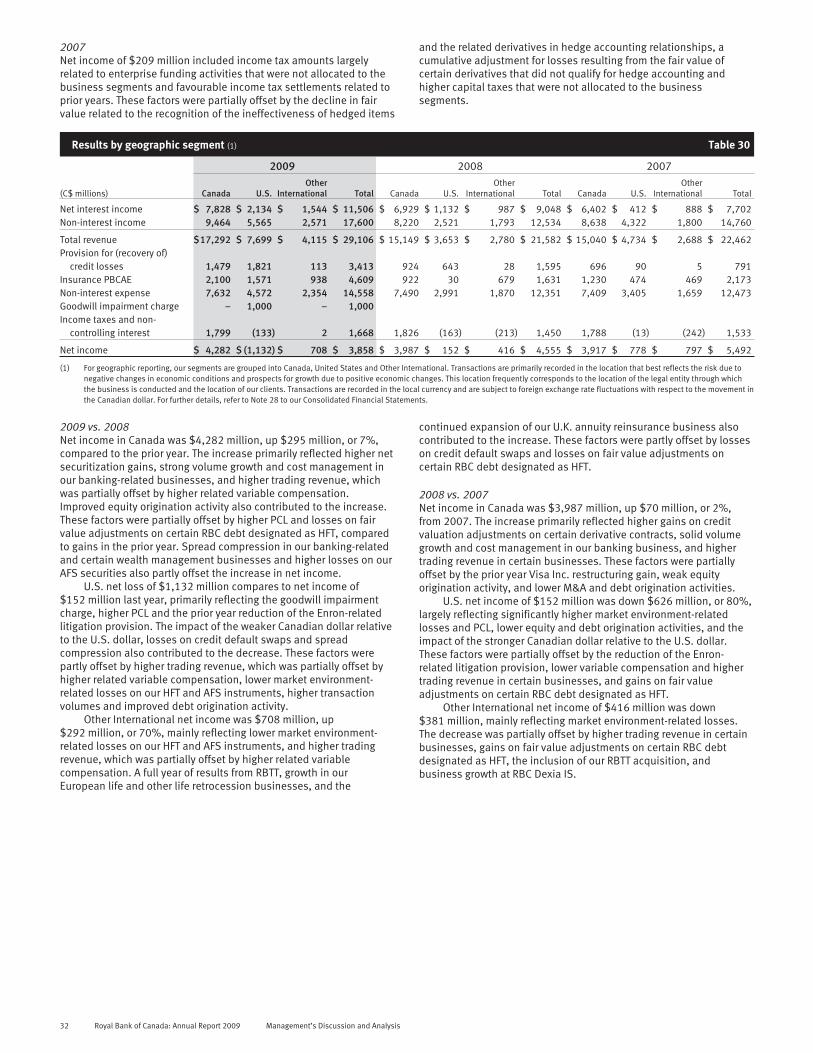
2007Net income of $209 million included income tax amounts largelyrelated to enterprise funding activities that were not allocated to thebusiness segments and favourable income tax settlements related toprior years. These factors were partially offset by the decline in fairvalue related to the recognition of the ineffectiveness of hedged items
and the related derivatives in hedge accounting relationships, acumulative adjustment for losses resulting from the fair value ofcertain derivatives that did not qualify for hedge accounting andhigher capital taxes that were not allocated to the businesssegments.
Results by geographic segment (1) Table 30
2009 2008 2007
(C$ millions) Canada U.S.Other
International Total Canada U.S.Other
International Total Canada U.S.Other
International Total
Net interest income $ 7,828 $ 2,134 $ 1,544 $ 11,506 $ 6,929 $ 1,132 $ 987 $ 9,048 $ 6,402 $ 412 $ 888 $ 7,702Non-interest income 9,464 5,565 2,571 17,600 8,220 2,521 1,793 12,534 8,638 4,322 1,800 14,760
Total revenue $17,292 $ 7,699 $ 4,115 $ 29,106 $ 15,149 $ 3,653 $ 2,780 $ 21,582 $ 15,040 $ 4,734 $ 2,688 $ 22,462Provision for (recovery of)
credit losses 1,479 1,821 113 3,413 924 643 28 1,595 696 90 5 791Insurance PBCAE 2,100 1,571 938 4,609 922 30 679 1,631 1,230 474 469 2,173Non-interest expense 7,632 4,572 2,354 14,558 7,490 2,991 1,870 12,351 7,409 3,405 1,659 12,473Goodwill impairment charge – 1,000 – 1,000Income taxes and non-
controlling interest 1,799 (133) 2 1,668 1,826 (163) (213) 1,450 1,788 (13) (242) 1,533
Net income $ 4,282 $ (1,132) $ 708 $ 3,858 $ 3,987 $ 152 $ 416 $ 4,555 $ 3,917 $ 778 $ 797 $ 5,492
(1) For geographic reporting, our segments are grouped into Canada, United States and Other International. Transactions are primarily recorded in the location that best reflects the risk due tonegative changes in economic conditions and prospects for growth due to positive economic changes. This location frequently corresponds to the location of the legal entity through whichthe business is conducted and the location of our clients. Transactions are recorded in the local currency and are subject to foreign exchange rate fluctuations with respect to the movement inthe Canadian dollar. For further details, refer to Note 28 to our Consolidated Financial Statements.
2009 vs. 2008Net income in Canada was $4,282 million, up $295 million, or 7%,compared to the prior year. The increase primarily reflected higher netsecuritization gains, strong volume growth and cost management inour banking-related businesses, and higher trading revenue, whichwas partially offset by higher related variable compensation.Improved equity origination activity also contributed to the increase.These factors were partially offset by higher PCL and losses on fairvalue adjustments on certain RBC debt designated as HFT, comparedto gains in the prior year. Spread compression in our banking-relatedand certain wealth management businesses and higher losses on ourAFS securities also partly offset the increase in net income.
U.S. net loss of $1,132 million compares to net income of$152 million last year, primarily reflecting the goodwill impairmentcharge, higher PCL and the prior year reduction of the Enron-relatedlitigation provision. The impact of the weaker Canadian dollar relativeto the U.S. dollar, losses on credit default swaps and spreadcompression also contributed to the decrease. These factors werepartly offset by higher trading revenue, which was partially offset byhigher related variable compensation, lower market environment-related losses on our HFT and AFS instruments, higher transactionvolumes and improved debt origination activity.
Other International net income was $708 million, up$292 million, or 70%, mainly reflecting lower market environment-related losses on our HFT and AFS instruments, and higher tradingrevenue, which was partially offset by higher related variablecompensation. A full year of results from RBTT, growth in ourEuropean life and other life retrocession businesses, and the
continued expansion of our U.K. annuity reinsurance business alsocontributed to the increase. These factors were partly offset by losseson credit default swaps and losses on fair value adjustments oncertain RBC debt designated as HFT.
2008 vs. 2007Net income in Canada was $3,987 million, up $70 million, or 2%,from 2007. The increase primarily reflected higher gains on creditvaluation adjustments on certain derivative contracts, solid volumegrowth and cost management in our banking business, and highertrading revenue in certain businesses. These factors were partiallyoffset by the prior year Visa Inc. restructuring gain, weak equityorigination activity, and lower M&A and debt origination activities.
U.S. net income of $152 million was down $626 million, or 80%,largely reflecting significantly higher market environment-relatedlosses and PCL, lower equity and debt origination activities, and theimpact of the stronger Canadian dollar relative to the U.S. dollar.These factors were partially offset by the reduction of the Enron-related litigation provision, lower variable compensation and highertrading revenue in certain businesses, and gains on fair valueadjustments on certain RBC debt designated as HFT.
Other International net income of $416 million was down$381 million, mainly reflecting market environment-related losses.The decrease was partially offset by higher trading revenue in certainbusinesses, gains on fair value adjustments on certain RBC debtdesignated as HFT, the inclusion of our RBTT acquisition, andbusiness growth at RBC Dexia IS.
32 Royal Bank of Canada: Annual Report 2009 Management’s Discussion and Analysis
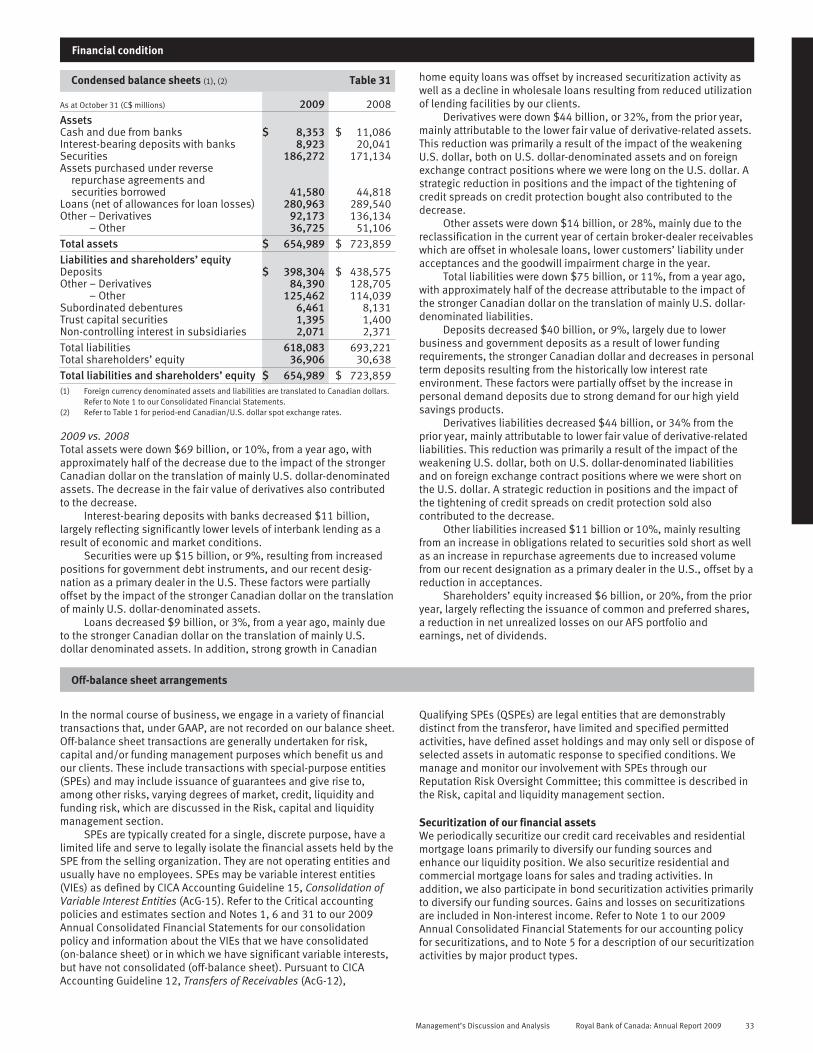
Financial condition
Condensed balance sheets (1), (2) Table 31
As at October 31 (C$ millions) 2009 2008AssetsCash and due from banks $ 8,353 $ 11,086Interest-bearing deposits with banks 8,923 20,041Securities 186,272 171,134Assets purchased under reverse
repurchase agreements andsecurities borrowed 41,580 44,818
Loans (net of allowances for loan losses) 280,963 289,540Other – Derivatives 92,173 136,134
– Other 36,725 51,106Total assets $ 654,989 $ 723,859Liabilities and shareholders’ equityDeposits $ 398,304 $ 438,575Other – Derivatives 84,390 128,705
– Other 125,462 114,039Subordinated debentures 6,461 8,131Trust capital securities 1,395 1,400Non-controlling interest in subsidiaries 2,071 2,371Total liabilities 618,083 693,221Total shareholders’ equity 36,906 30,638Total liabilities and shareholders’ equity $ 654,989 $ 723,859(1) Foreign currency denominated assets and liabilities are translated to Canadian dollars.
Refer to Note 1 to our Consolidated Financial Statements.(2) Refer to Table 1 for period-end Canadian/U.S. dollar spot exchange rates.
2009 vs. 2008Total assets were down $69 billion, or 10%, from a year ago, withapproximately half of the decrease due to the impact of the strongerCanadian dollar on the translation of mainly U.S. dollar-denominatedassets. The decrease in the fair value of derivatives also contributedto the decrease.
Interest-bearing deposits with banks decreased $11 billion,largely reflecting significantly lower levels of interbank lending as aresult of economic and market conditions.
Securities were up $15 billion, or 9%, resulting from increasedpositions for government debt instruments, and our recent desig-nation as a primary dealer in the U.S. These factors were partiallyoffset by the impact of the stronger Canadian dollar on the translationof mainly U.S. dollar-denominated assets.
Loans decreased $9 billion, or 3%, from a year ago, mainly dueto the stronger Canadian dollar on the translation of mainly U.S.dollar denominated assets. In addition, strong growth in Canadian
home equity loans was offset by increased securitization activity aswell as a decline in wholesale loans resulting from reduced utilizationof lending facilities by our clients.
Derivatives were down $44 billion, or 32%, from the prior year,mainly attributable to the lower fair value of derivative-related assets.This reduction was primarily a result of the impact of the weakeningU.S. dollar, both on U.S. dollar-denominated assets and on foreignexchange contract positions where we were long on the U.S. dollar. Astrategic reduction in positions and the impact of the tightening ofcredit spreads on credit protection bought also contributed to thedecrease.
Other assets were down $14 billion, or 28%, mainly due to thereclassification in the current year of certain broker-dealer receivableswhich are offset in wholesale loans, lower customers’ liability underacceptances and the goodwill impairment charge in the year.
Total liabilities were down $75 billion, or 11%, from a year ago,with approximately half of the decrease attributable to the impact ofthe stronger Canadian dollar on the translation of mainly U.S. dollar-denominated liabilities.
Deposits decreased $40 billion, or 9%, largely due to lowerbusiness and government deposits as a result of lower fundingrequirements, the stronger Canadian dollar and decreases in personalterm deposits resulting from the historically low interest rateenvironment. These factors were partially offset by the increase inpersonal demand deposits due to strong demand for our high yieldsavings products.
Derivatives liabilities decreased $44 billion, or 34% from theprior year, mainly attributable to lower fair value of derivative-relatedliabilities. This reduction was primarily a result of the impact of theweakening U.S. dollar, both on U.S. dollar-denominated liabilitiesand on foreign exchange contract positions where we were short onthe U.S. dollar. A strategic reduction in positions and the impact ofthe tightening of credit spreads on credit protection sold alsocontributed to the decrease.
Other liabilities increased $11 billion or 10%, mainly resultingfrom an increase in obligations related to securities sold short as wellas an increase in repurchase agreements due to increased volumefrom our recent designation as a primary dealer in the U.S., offset by areduction in acceptances.
Shareholders’ equity increased $6 billion, or 20%, from the prioryear, largely reflecting the issuance of common and preferred shares,a reduction in net unrealized losses on our AFS portfolio andearnings, net of dividends.
Off-balance sheet arrangements
In the normal course of business, we engage in a variety of financialtransactions that, under GAAP, are not recorded on our balance sheet.Off-balance sheet transactions are generally undertaken for risk,capital and/or funding management purposes which benefit us andour clients. These include transactions with special-purpose entities(SPEs) and may include issuance of guarantees and give rise to,among other risks, varying degrees of market, credit, liquidity andfunding risk, which are discussed in the Risk, capital and liquiditymanagement section.
SPEs are typically created for a single, discrete purpose, have alimited life and serve to legally isolate the financial assets held by theSPE from the selling organization. They are not operating entities andusually have no employees. SPEs may be variable interest entities(VIEs) as defined by CICA Accounting Guideline 15, Consolidation ofVariable Interest Entities (AcG-15). Refer to the Critical accountingpolicies and estimates section and Notes 1, 6 and 31 to our 2009Annual Consolidated Financial Statements for our consolidationpolicy and information about the VIEs that we have consolidated(on-balance sheet) or in which we have significant variable interests,but have not consolidated (off-balance sheet). Pursuant to CICAAccounting Guideline 12, Transfers of Receivables (AcG-12),
Qualifying SPEs (QSPEs) are legal entities that are demonstrablydistinct from the transferor, have limited and specified permittedactivities, have defined asset holdings and may only sell or dispose ofselected assets in automatic response to specified conditions. Wemanage and monitor our involvement with SPEs through ourReputation Risk Oversight Committee; this committee is described inthe Risk, capital and liquidity management section.
Securitization of our financial assetsWe periodically securitize our credit card receivables and residentialmortgage loans primarily to diversify our funding sources andenhance our liquidity position. We also securitize residential andcommercial mortgage loans for sales and trading activities. Inaddition, we also participate in bond securitization activities primarilyto diversify our funding sources. Gains and losses on securitizationsare included in Non-interest income. Refer to Note 1 to our 2009Annual Consolidated Financial Statements for our accounting policyfor securitizations, and to Note 5 for a description of our securitizationactivities by major product types.
Management’s Discussion and Analysis Royal Bank of Canada: Annual Report 2009 33
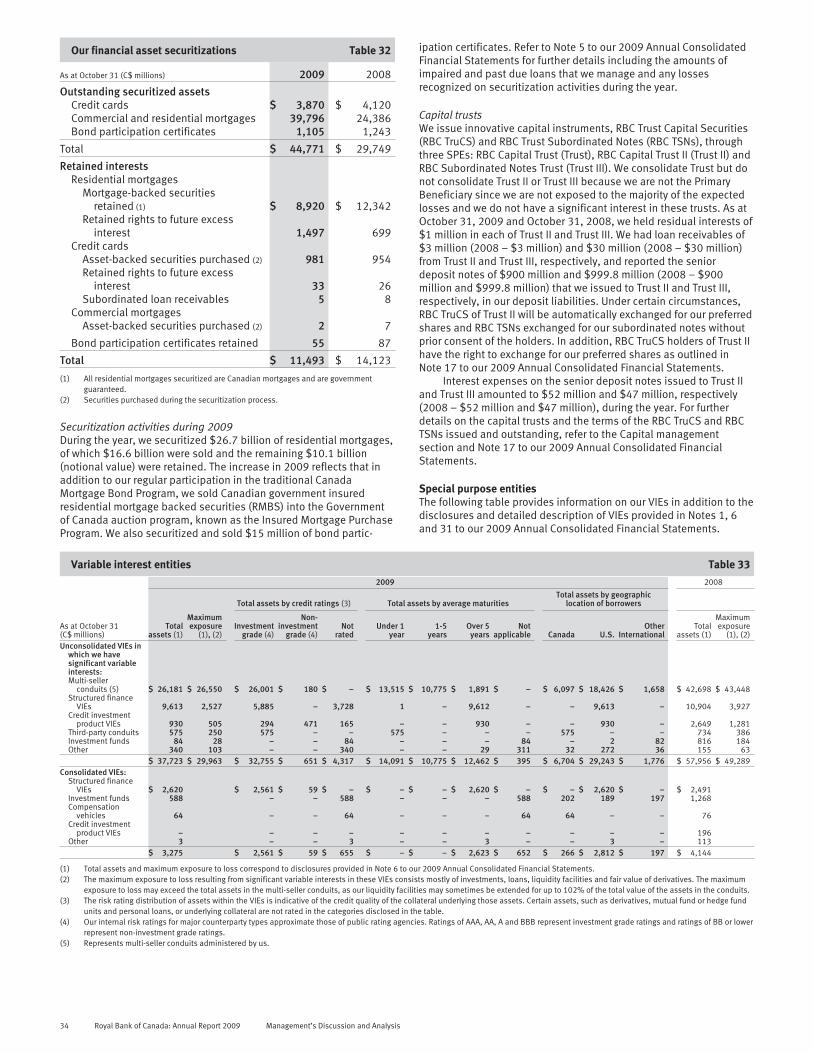
Our financial asset securitizations Table 32
As at October 31 (C$ millions) 2009 2008
Outstanding securitized assetsCredit cards $ 3,870 $ 4,120Commercial and residential mortgages 39,796 24,386Bond participation certificates 1,105 1,243
Total $ 44,771 $ 29,749
Retained interestsResidential mortgages
Mortgage-backed securitiesretained (1) $ 8,920 $ 12,342
Retained rights to future excessinterest 1,497 699
Credit cardsAsset-backed securities purchased (2) 981 954Retained rights to future excess
interest 33 26Subordinated loan receivables 5 8
Commercial mortgagesAsset-backed securities purchased (2) 2 7
Bond participation certificates retained 55 87
Total $ 11,493 $ 14,123
(1) All residential mortgages securitized are Canadian mortgages and are governmentguaranteed.
(2) Securities purchased during the securitization process.
Securitization activities during 2009During the year, we securitized $26.7 billion of residential mortgages,of which $16.6 billion were sold and the remaining $10.1 billion(notional value) were retained. The increase in 2009 reflects that inaddition to our regular participation in the traditional CanadaMortgage Bond Program, we sold Canadian government insuredresidential mortgage backed securities (RMBS) into the Governmentof Canada auction program, known as the Insured Mortgage PurchaseProgram. We also securitized and sold $15 million of bond partic-
ipation certificates. Refer to Note 5 to our 2009 Annual ConsolidatedFinancial Statements for further details including the amounts ofimpaired and past due loans that we manage and any lossesrecognized on securitization activities during the year.
Capital trustsWe issue innovative capital instruments, RBC Trust Capital Securities(RBC TruCS) and RBC Trust Subordinated Notes (RBC TSNs), throughthree SPEs: RBC Capital Trust (Trust), RBC Capital Trust II (Trust II) andRBC Subordinated Notes Trust (Trust III). We consolidate Trust but donot consolidate Trust II or Trust III because we are not the PrimaryBeneficiary since we are not exposed to the majority of the expectedlosses and we do not have a significant interest in these trusts. As atOctober 31, 2009 and October 31, 2008, we held residual interests of$1 million in each of Trust II and Trust III. We had loan receivables of$3 million (2008 – $3 million) and $30 million (2008 – $30 million)from Trust II and Trust III, respectively, and reported the seniordeposit notes of $900 million and $999.8 million (2008 – $900million and $999.8 million) that we issued to Trust II and Trust III,respectively, in our deposit liabilities. Under certain circumstances,RBC TruCS of Trust II will be automatically exchanged for our preferredshares and RBC TSNs exchanged for our subordinated notes withoutprior consent of the holders. In addition, RBC TruCS holders of Trust IIhave the right to exchange for our preferred shares as outlined inNote 17 to our 2009 Annual Consolidated Financial Statements.
Interest expenses on the senior deposit notes issued to Trust IIand Trust III amounted to $52 million and $47 million, respectively(2008 – $52 million and $47 million), during the year. For furtherdetails on the capital trusts and the terms of the RBC TruCS and RBCTSNs issued and outstanding, refer to the Capital managementsection and Note 17 to our 2009 Annual Consolidated FinancialStatements.
Special purpose entitiesThe following table provides information on our VIEs in addition to thedisclosures and detailed description of VIEs provided in Notes 1, 6and 31 to our 2009 Annual Consolidated Financial Statements.
Variable interest entities Table 33
2009 2008
Total assets by credit ratings (3) Total assets by average maturitiesTotal assets by geographic
location of borrowers
As at October 31(C$ millions)
Totalassets (1)
Maximumexposure
(1), (2)Investment
grade (4)
Non-investment
grade (4)Not
ratedUnder 1
year1-5
yearsOver 5
yearsNot
applicable Canada U.S.Other
InternationalTotal
assets (1)
Maximumexposure
(1), (2)Unconsolidated VIEs in
which we havesignificant variableinterests:Multi-seller
conduits (5) $ 26,181 $ 26,550 $ 26,001 $ 180 $ – $ 13,515 $ 10,775 $ 1,891 $ – $ 6,097 $ 18,426 $ 1,658 $ 42,698 $ 43,448Structured finance
VIEs 9,613 2,527 5,885 – 3,728 1 – 9,612 – – 9,613 – 10,904 3,927Credit investment
product VIEs 930 505 294 471 165 – – 930 – – 930 – 2,649 1,281Third-party conduits 575 250 575 – – 575 – – – 575 – – 734 386Investment funds 84 28 – – 84 – – – 84 – 2 82 816 184Other 340 103 – – 340 – – 29 311 32 272 36 155 63
$ 37,723 $ 29,963 $ 32,755 $ 651 $ 4,317 $ 14,091 $ 10,775 $ 12,462 $ 395 $ 6,704 $ 29,243 $ 1,776 $ 57,956 $ 49,289Consolidated VIEs:
Structured financeVIEs $ 2,620 $ 2,561 $ 59 $ – $ – $ – $ 2,620 $ – $ – $ 2,620 $ – $ 2,491
Investment funds 588 – – 588 – – – 588 202 189 197 1,268Compensation
vehicles 64 – – 64 – – – 64 64 – – 76Credit investment
product VIEs – – – – – – – – – – – 196Other 3 – – 3 – – 3 – – 3 – 113
$ 3,275 $ 2,561 $ 59 $ 655 $ – $ – $ 2,623 $ 652 $ 266 $ 2,812 $ 197 $ 4,144
(1) Total assets and maximum exposure to loss correspond to disclosures provided in Note 6 to our 2009 Annual Consolidated Financial Statements.(2) The maximum exposure to loss resulting from significant variable interests in these VIEs consists mostly of investments, loans, liquidity facilities and fair value of derivatives. The maximum
exposure to loss may exceed the total assets in the multi-seller conduits, as our liquidity facilities may sometimes be extended for up to 102% of the total value of the assets in the conduits.(3) The risk rating distribution of assets within the VIEs is indicative of the credit quality of the collateral underlying those assets. Certain assets, such as derivatives, mutual fund or hedge fund
units and personal loans, or underlying collateral are not rated in the categories disclosed in the table.(4) Our internal risk ratings for major counterparty types approximate those of public rating agencies. Ratings of AAA, AA, A and BBB represent investment grade ratings and ratings of BB or lower
represent non-investment grade ratings.(5) Represents multi-seller conduits administered by us.
34 Royal Bank of Canada: Annual Report 2009 Management’s Discussion and Analysis
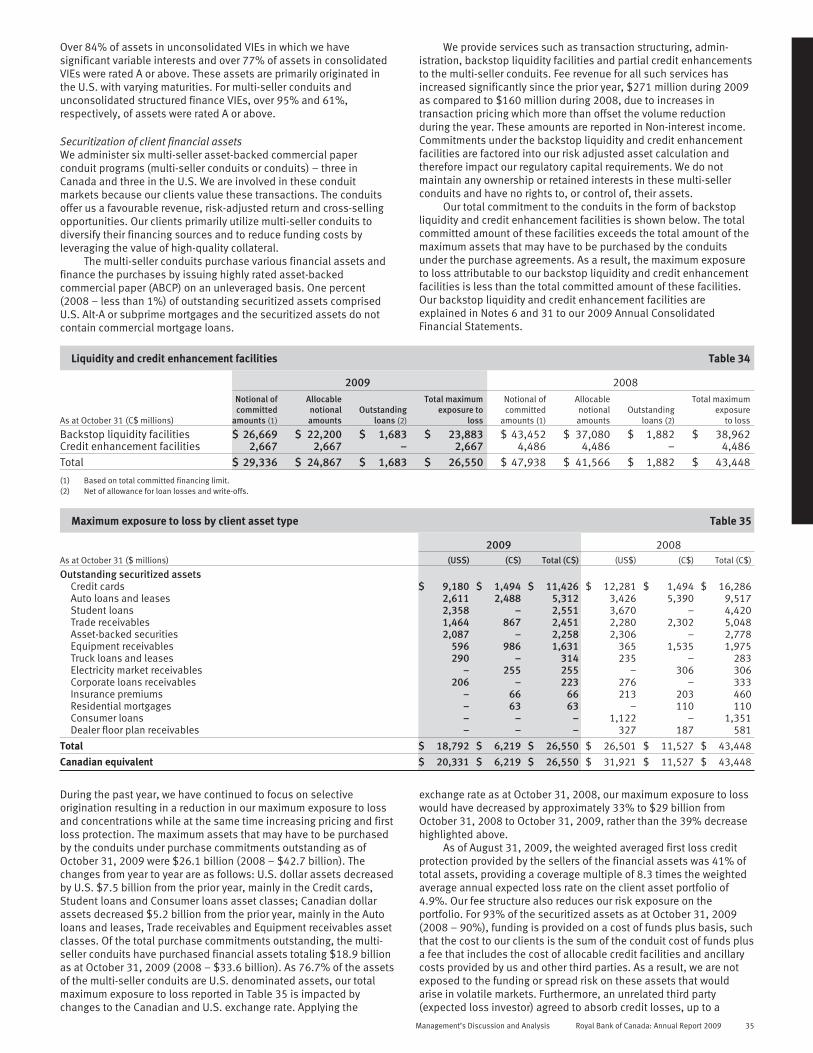
Over 84% of assets in unconsolidated VIEs in which we havesignificant variable interests and over 77% of assets in consolidatedVIEs were rated A or above. These assets are primarily originated inthe U.S. with varying maturities. For multi-seller conduits andunconsolidated structured finance VIEs, over 95% and 61%,respectively, of assets were rated A or above.
Securitization of client financial assetsWe administer six multi-seller asset-backed commercial paperconduit programs (multi-seller conduits or conduits) – three inCanada and three in the U.S. We are involved in these conduitmarkets because our clients value these transactions. The conduitsoffer us a favourable revenue, risk-adjusted return and cross-sellingopportunities. Our clients primarily utilize multi-seller conduits todiversify their financing sources and to reduce funding costs byleveraging the value of high-quality collateral.
The multi-seller conduits purchase various financial assets andfinance the purchases by issuing highly rated asset-backedcommercial paper (ABCP) on an unleveraged basis. One percent(2008 – less than 1%) of outstanding securitized assets comprisedU.S. Alt-A or subprime mortgages and the securitized assets do notcontain commercial mortgage loans.
We provide services such as transaction structuring, admin-istration, backstop liquidity facilities and partial credit enhancementsto the multi-seller conduits. Fee revenue for all such services hasincreased significantly since the prior year, $271 million during 2009as compared to $160 million during 2008, due to increases intransaction pricing which more than offset the volume reductionduring the year. These amounts are reported in Non-interest income.Commitments under the backstop liquidity and credit enhancementfacilities are factored into our risk adjusted asset calculation andtherefore impact our regulatory capital requirements. We do notmaintain any ownership or retained interests in these multi-sellerconduits and have no rights to, or control of, their assets.
Our total commitment to the conduits in the form of backstopliquidity and credit enhancement facilities is shown below. The totalcommitted amount of these facilities exceeds the total amount of themaximum assets that may have to be purchased by the conduitsunder the purchase agreements. As a result, the maximum exposureto loss attributable to our backstop liquidity and credit enhancementfacilities is less than the total committed amount of these facilities.Our backstop liquidity and credit enhancement facilities areexplained in Notes 6 and 31 to our 2009 Annual ConsolidatedFinancial Statements.
Liquidity and credit enhancement facilities Table 34
2009 2008
As at October 31 (C$ millions)
Notional ofcommitted
amounts (1)
Allocablenotionalamounts
Outstandingloans (2)
Total maximumexposure to
loss
Notional ofcommitted
amounts (1)
Allocablenotionalamounts
Outstandingloans (2)
Total maximumexposure
to loss
Backstop liquidity facilities $ 26,669 $ 22,200 $ 1,683 $ 23,883 $ 43,452 $ 37,080 $ 1,882 $ 38,962Credit enhancement facilities 2,667 2,667 – 2,667 4,486 4,486 – 4,486Total $ 29,336 $ 24,867 $ 1,683 $ 26,550 $ 47,938 $ 41,566 $ 1,882 $ 43,448
(1) Based on total committed financing limit.(2) Net of allowance for loan losses and write-offs.
Maximum exposure to loss by client asset type Table 35
As at October 31 ($ millions)
2009 2008(US$) (C$) Total (C$) (US$) (C$) Total (C$)
Outstanding securitized assetsCredit cards $ 9,180 $ 1,494 $ 11,426 $ 12,281 $ 1,494 $ 16,286Auto loans and leases 2,611 2,488 5,312 3,426 5,390 9,517Student loans 2,358 – 2,551 3,670 – 4,420Trade receivables 1,464 867 2,451 2,280 2,302 5,048Asset-backed securities 2,087 – 2,258 2,306 – 2,778Equipment receivables 596 986 1,631 365 1,535 1,975Truck loans and leases 290 – 314 235 – 283Electricity market receivables – 255 255 – 306 306Corporate loans receivables 206 – 223 276 – 333Insurance premiums – 66 66 213 203 460Residential mortgages – 63 63 – 110 110Consumer loans – – – 1,122 – 1,351Dealer floor plan receivables – – – 327 187 581
Total $ 18,792 $ 6,219 $ 26,550 $ 26,501 $ 11,527 $ 43,448
Canadian equivalent $ 20,331 $ 6,219 $ 26,550 $ 31,921 $ 11,527 $ 43,448
During the past year, we have continued to focus on selectiveorigination resulting in a reduction in our maximum exposure to lossand concentrations while at the same time increasing pricing and firstloss protection. The maximum assets that may have to be purchasedby the conduits under purchase commitments outstanding as ofOctober 31, 2009 were $26.1 billion (2008 – $42.7 billion). Thechanges from year to year are as follows: U.S. dollar assets decreasedby U.S. $7.5 billion from the prior year, mainly in the Credit cards,Student loans and Consumer loans asset classes; Canadian dollarassets decreased $5.2 billion from the prior year, mainly in the Autoloans and leases, Trade receivables and Equipment receivables assetclasses. Of the total purchase commitments outstanding, the multi-seller conduits have purchased financial assets totaling $18.9 billionas at October 31, 2009 (2008 – $33.6 billion). As 76.7% of the assetsof the multi-seller conduits are U.S. denominated assets, our totalmaximum exposure to loss reported in Table 35 is impacted bychanges to the Canadian and U.S. exchange rate. Applying the
exchange rate as at October 31, 2008, our maximum exposure to losswould have decreased by approximately 33% to $29 billion fromOctober 31, 2008 to October 31, 2009, rather than the 39% decreasehighlighted above.
As of August 31, 2009, the weighted averaged first loss creditprotection provided by the sellers of the financial assets was 41% oftotal assets, providing a coverage multiple of 8.3 times the weightedaverage annual expected loss rate on the client asset portfolio of4.9%. Our fee structure also reduces our risk exposure on theportfolio. For 93% of the securitized assets as at October 31, 2009(2008 – 90%), funding is provided on a cost of funds plus basis, suchthat the cost to our clients is the sum of the conduit cost of funds plusa fee that includes the cost of allocable credit facilities and ancillarycosts provided by us and other third parties. As a result, we are notexposed to the funding or spread risk on these assets that wouldarise in volatile markets. Furthermore, an unrelated third party(expected loss investor) agreed to absorb credit losses, up to a
Management’s Discussion and Analysis Royal Bank of Canada: Annual Report 2009 35
maximum contractual amount, that may occur in the future on theassets in the multi-seller conduits before us and the multi-sellerconduit’s debt holders.
Multiple independent debt rating agencies review all of thetransactions in the multi-seller conduits. Transactions financed in ourU.S. multi-seller conduits are reviewed by three rating agenciesMoody’s Investors Service (Moody’s), Standard & Poor’s (S&P) andFitch Ratings (Fitch). Transactions in our Canadian multi-sellerconduits are also reviewed by Dominion Bond Rating Services (DBRS).Each applicable rating agency also reviews ongoing transactionperformance on a monthly basis and may publish reports detailingportfolio and program information related to the conduits.
Of total ABCP issued by the multi-seller conduits of $18.9 billion(2008 – $33.6 billion), 70% (2008 – 74%) is generally rated withinthe top ratings category of those rating agencies that rate the ABCP;the remaining amount is rated in the second highest ratings categoryof those agencies. The weighted average maturities (U.S. conduits45.3 and 37.9 days and Canadian conduits 31.3 and 29.4 days as atOctober 31, 2009 and October 31, 2008, respectively) remain longerthan historical averages, providing well balanced maturity profilesand assisting in mitigating funding risks associated with marketdisruptions. We sometimes purchase the ABCP issued by the multi-seller conduits in our capacity as a placement agent in order tofacilitate overall program liquidity. As at October 31, 2009, the fairvalue of our inventory was $3.7 million (2008 – $598 million),classified as Securities – Trading. Inventory continues to remainbelow historical levels.
The U.S. multi-seller conduits include $2.4 billion of asset-backed securities. There are no asset-backed securities in theCanadian multi-seller conduits. In 2008 and 2009, certain U.S. multi-seller conduits drew down some of our backstop liquidity facilities tofund a portion of the asset-backed securities. These loans, net ofwrite-offs and allowances, amounted to $1.7 billion (2008 – $1.9billion), and are included in Loans – Wholesale. Of the $1.7 billion,$65 million (2008 – $203 million) and a related $2 million ofallowance for loan losses (2008 – $65 million), pertain to a singleasset-backed collateralized debt obligation which is classified asimpaired. In 2009, we wrote off $126 million (2008 – $nil) against theallowance for loan losses. All other asset-backed securities remainperforming.
Creation of credit investment productsWe use SPEs to generally transform credit derivatives into cashinstruments, to distribute credit risk and to create customized creditproducts to meet the needs of investors with specific requirements.These SPEs issue funded and unfunded notes. In some instances, weinvest in these notes. The funded notes may be rated by externalrating agencies, as well as listed on a stock exchange. While themajority of the funded notes are expected to be sold on a “buy andhold” basis, we may occasionally act as market maker. Forinformation on unfunded notes, refer to Notes 6 and 31 to our 2009Annual Consolidated Financial Statements.
As with all our derivatives, the derivatives with these SPEs arecarried at fair value in derivative-related assets and liabilities. Ourexposure to these SPEs has decreased from the prior year due tocertain entities winding down. The assets in these SPEs amounted to$2.9 billion as at October 31, 2009 (2008 – $5.3 billion), of which$nil were consolidated as at October 31, 2009 (2008 – $.2 billion). Asat October 31, 2009, our investments in the funded notes, thederivative-related receivables, and the notional amounts of theunfunded notes related to the unconsolidated SPEs were $18 million(2008 – $34 million), $317 million (2008 – $599 million) and $170million (2008 – $648 million), respectively.
Structured financeIn 2008, we purchased U.S. auction rate securities (ARS) from entitieswhich funded their long-term investments in student loans by issuing
short-term senior and subordinated notes. As at October 31, 2009,the total assets of the unconsolidated ARS VIEs in which we havesignificant investments and the fair value of these significantinvestments were $4.7 billion (2008 – $4.9 billion) and $1.3 billion(2008 – $2.0 billion), respectively. As at October 31, 2009,approximately 89% of these investments were AAA rated. Interestincome from the ARS investments, which is reported in Net-interestincome, amounted to $77.5 million during the year (2008 – $93million, 2007 – $2 million).
We also sell ARS into Tender Option Bond (ARS TOB) programs.We are the remarketing agent for the floating-rate certificates issuedby the ARS TOB programs and we provide liquidity facilities andletters of credit to each of the ARS TOB programs. The liquidityfacilities and letters of credit are included in our disclosure onguarantees in Note 25 to our 2009 Annual Consolidated FinancialStatements. As at October 31, 2009, the total assets ofunconsolidated ARS TOB programs were $791 million (2008 – $1.4billion). We did not hold any floating-rate certificates as market makerfor the ARS TOB programs as at October 31, 2009 or October 31,2008. Fee revenue for the remarketing services and the provision forthe letters of credit and liquidity facilities, which is reported inNon-interest income, amounted to $3 million during the year (2008 –$3 million, 2007 – $nil).
In 2008, we also sold ARS to an unaffiliated and unconsolidatedentity at fair market value. The purchase of the ARS by this entity wasfinanced by a loan from us, and the loan is secured by various assetsof the entity. As at October 31, 2009, total assets of this entity andour maximum exposure to loss were $4.2 billion (2008 – $4.7 billion)and $449 million (2008 – $500 million), respectively. Fee revenuefrom this entity, resulting from the credit facility, administrativeservices and guarantees that we provide to the entity, as well as ourrole as remarketing agent for the ARS held by the entity, amounted to$3.7 million during the year (2008 – $4.0 million, 2007 – $.3 million).This amount is reported in Non-interest income. The interest incomefrom the loan and the credit facility, which is reported in Net interestincome, totalled $7.2 million for the year (2008 – $6.7 million,2007 – $1.1 million).
Investment fundsWe enter into fee-based equity derivative transactions withinvestment funds. These transactions provide their investors with thedesired exposure. We hedge our exposure from these derivatives byinvesting in other funds. Due to higher redemptions during the year,the total assets held in the unconsolidated funds where we havesignificant exposure decreased by $732 million to $84 million as atOctober 31, 2009. We have also chosen to reduce our interest tocertain funds during the year. As a result, our total exposure, which isprimarily related to the investments in the funds, decreased by $156million to $28 million as at October 31, 2009.
Trusts, mutual and pooled fundsOur joint venture, RBC Dexia IS, offers global custody, fund andpension administration, shareholder services, foreign exchange,securities lending, analytics and other related services to institutionalinvestors. Where RBC Dexia IS acts as trustee, it has a fiduciaryresponsibility to act in the best interests of the beneficiaries of thetrusts. 50% of the fees earned by RBC Dexia IS are included in ourrevenue, representing our share of interest in the joint venture. Referto Note 9 to our 2009 Annual Consolidated Financial Statements formore details.
We manage assets in mutual and pooled funds and earn fees atmarket rates from these funds, but do not guarantee either principalor returns to investors in any of these funds.
36 Royal Bank of Canada: Annual Report 2009 Management’s Discussion and Analysis
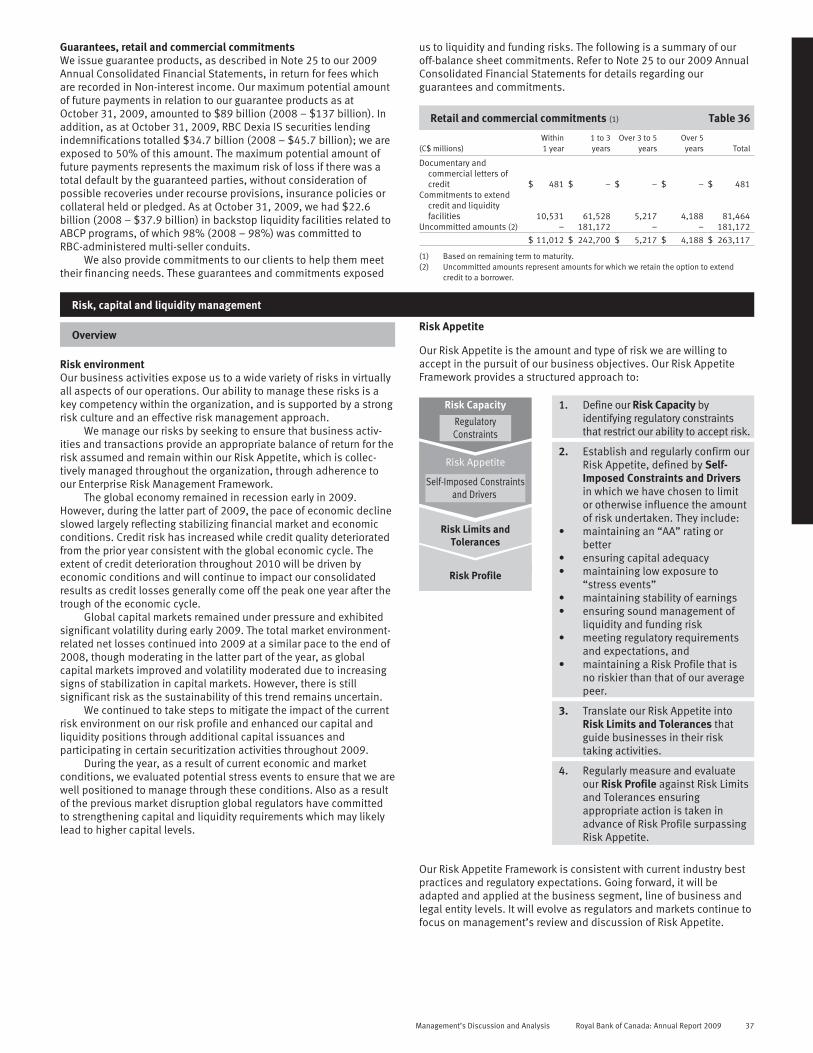
Guarantees, retail and commercial commitmentsWe issue guarantee products, as described in Note 25 to our 2009Annual Consolidated Financial Statements, in return for fees whichare recorded in Non-interest income. Our maximum potential amountof future payments in relation to our guarantee products as atOctober 31, 2009, amounted to $89 billion (2008 – $137 billion). Inaddition, as at October 31, 2009, RBC Dexia IS securities lendingindemnifications totalled $34.7 billion (2008 – $45.7 billion); we areexposed to 50% of this amount. The maximum potential amount offuture payments represents the maximum risk of loss if there was atotal default by the guaranteed parties, without consideration ofpossible recoveries under recourse provisions, insurance policies orcollateral held or pledged. As at October 31, 2009, we had $22.6billion (2008 – $37.9 billion) in backstop liquidity facilities related toABCP programs, of which 98% (2008 – 98%) was committed toRBC-administered multi-seller conduits.
We also provide commitments to our clients to help them meettheir financing needs. These guarantees and commitments exposed
us to liquidity and funding risks. The following is a summary of ouroff-balance sheet commitments. Refer to Note 25 to our 2009 AnnualConsolidated Financial Statements for details regarding ourguarantees and commitments.
Retail and commercial commitments (1) Table 36
(C$ millions)Within1 year
1 to 3years
Over 3 to 5years
Over 5years Total
Documentary andcommercial letters ofcredit $ 481 $ – $ – $ – $ 481
Commitments to extendcredit and liquidityfacilities 10,531 61,528 5,217 4,188 81,464
Uncommitted amounts (2) – 181,172 – – 181,172
$ 11,012 $ 242,700 $ 5,217 $ 4,188 $ 263,117
(1) Based on remaining term to maturity.(2) Uncommitted amounts represent amounts for which we retain the option to extend
credit to a borrower.
Risk, capital and liquidity management
Overview
Risk environmentOur business activities expose us to a wide variety of risks in virtuallyall aspects of our operations. Our ability to manage these risks is akey competency within the organization, and is supported by a strongrisk culture and an effective risk management approach.
We manage our risks by seeking to ensure that business activ-ities and transactions provide an appropriate balance of return for therisk assumed and remain within our Risk Appetite, which is collec-tively managed throughout the organization, through adherence toour Enterprise Risk Management Framework.
The global economy remained in recession early in 2009.However, during the latter part of 2009, the pace of economic declineslowed largely reflecting stabilizing financial market and economicconditions. Credit risk has increased while credit quality deterioratedfrom the prior year consistent with the global economic cycle. Theextent of credit deterioration throughout 2010 will be driven byeconomic conditions and will continue to impact our consolidatedresults as credit losses generally come off the peak one year after thetrough of the economic cycle.
Global capital markets remained under pressure and exhibitedsignificant volatility during early 2009. The total market environment-related net losses continued into 2009 at a similar pace to the end of2008, though moderating in the latter part of the year, as globalcapital markets improved and volatility moderated due to increasingsigns of stabilization in capital markets. However, there is stillsignificant risk as the sustainability of this trend remains uncertain.
We continued to take steps to mitigate the impact of the currentrisk environment on our risk profile and enhanced our capital andliquidity positions through additional capital issuances andparticipating in certain securitization activities throughout 2009.
During the year, as a result of current economic and marketconditions, we evaluated potential stress events to ensure that we arewell positioned to manage through these conditions. Also as a resultof the previous market disruption global regulators have committedto strengthening capital and liquidity requirements which may likelylead to higher capital levels.
Risk Appetite
Our Risk Appetite is the amount and type of risk we are willing toaccept in the pursuit of our business objectives. Our Risk AppetiteFramework provides a structured approach to:
Risk Capacity
Risk Appetite
Self-Imposed Constraintsand Drivers
Risk Limits andTolerances
Risk Profile
RegulatoryConstraints
1. Define our Risk Capacity byidentifying regulatory constraintsthat restrict our ability to accept risk.
2. Establish and regularly confirm ourRisk Appetite, defined by Self-Imposed Constraints and Driversin which we have chosen to limitor otherwise influence the amountof risk undertaken. They include:
• maintaining an “AA” rating orbetter
• ensuring capital adequacy• maintaining low exposure to
“stress events”• maintaining stability of earnings• ensuring sound management of
liquidity and funding risk• meeting regulatory requirements
and expectations, and• maintaining a Risk Profile that is
no riskier than that of our averagepeer.
3. Translate our Risk Appetite intoRisk Limits and Tolerances thatguide businesses in their risktaking activities.
4. Regularly measure and evaluateour Risk Profile against Risk Limitsand Tolerances ensuringappropriate action is taken inadvance of Risk Profile surpassingRisk Appetite.
Our Risk Appetite Framework is consistent with current industry bestpractices and regulatory expectations. Going forward, it will beadapted and applied at the business segment, line of business andlegal entity levels. It will evolve as regulators and markets continue tofocus on management’s review and discussion of Risk Appetite.
Management’s Discussion and Analysis Royal Bank of Canada: Annual Report 2009 37
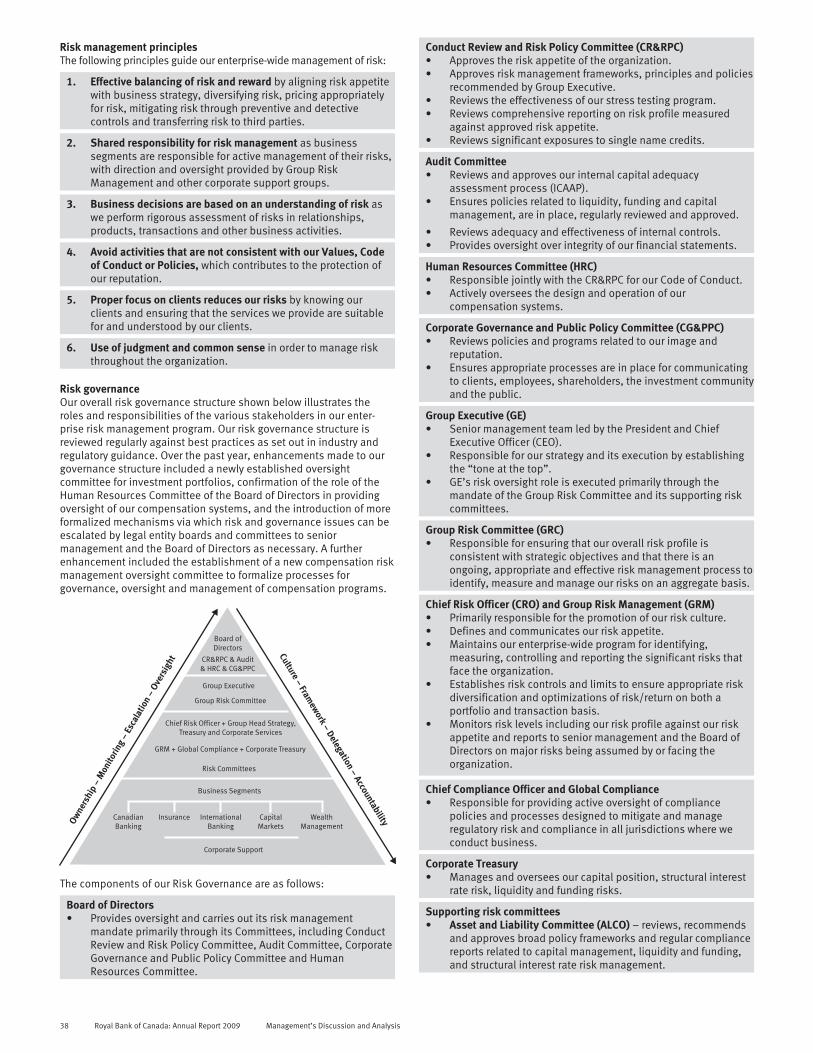
Risk management principlesThe following principles guide our enterprise-wide management of risk:
1. Effective balancing of risk and reward by aligning risk appetitewith business strategy, diversifying risk, pricing appropriatelyfor risk, mitigating risk through preventive and detectivecontrols and transferring risk to third parties.
2. Shared responsibility for risk management as businesssegments are responsible for active management of their risks,with direction and oversight provided by Group RiskManagement and other corporate support groups.
3. Business decisions are based on an understanding of risk aswe perform rigorous assessment of risks in relationships,products, transactions and other business activities.
4. Avoid activities that are not consistent with our Values, Codeof Conduct or Policies, which contributes to the protection ofour reputation.
5. Proper focus on clients reduces our risks by knowing ourclients and ensuring that the services we provide are suitablefor and understood by our clients.
6. Use of judgment and common sense in order to manage riskthroughout the organization.
Risk governanceOur overall risk governance structure shown below illustrates theroles and responsibilities of the various stakeholders in our enter-prise risk management program. Our risk governance structure isreviewed regularly against best practices as set out in industry andregulatory guidance. Over the past year, enhancements made to ourgovernance structure included a newly established oversightcommittee for investment portfolios, confirmation of the role of theHuman Resources Committee of the Board of Directors in providingoversight of our compensation systems, and the introduction of moreformalized mechanisms via which risk and governance issues can beescalated by legal entity boards and committees to seniormanagement and the Board of Directors as necessary. A furtherenhancement included the establishment of a new compensation riskmanagement oversight committee to formalize processes forgovernance, oversight and management of compensation programs.
Board ofDirectors
CR&RPC & Audit& HRC & CG&PPC
Group Executive
Group Risk Committee
Chief Risk Officer + Group Head Strategy,Treasury and Corporate Services
GRM + Global Compliance + Corporate Treasury
Risk Committees
Business Segments
Corporate Support
CanadianBanking
Insurance InternationalBanking
CapitalMarkets
WealthManagementOw
ners
hip
– M
onito
ring
– Es
cala
tion
– Ove
rsig
ht
Culture – Framew
ork – Delegation – Accountability
The components of our Risk Governance are as follows:
Board of Directors• Provides oversight and carries out its risk management
mandate primarily through its Committees, including ConductReview and Risk Policy Committee, Audit Committee, CorporateGovernance and Public Policy Committee and HumanResources Committee.
Conduct Review and Risk Policy Committee (CR&RPC)• Approves the risk appetite of the organization.• Approves risk management frameworks, principles and policies
recommended by Group Executive.• Reviews the effectiveness of our stress testing program.• Reviews comprehensive reporting on risk profile measured
against approved risk appetite.• Reviews significant exposures to single name credits.
Audit Committee• Reviews and approves our internal capital adequacy
assessment process (ICAAP).• Ensures policies related to liquidity, funding and capital
management, are in place, regularly reviewed and approved.
• Reviews adequacy and effectiveness of internal controls.• Provides oversight over integrity of our financial statements.
Human Resources Committee (HRC)• Responsible jointly with the CR&RPC for our Code of Conduct.• Actively oversees the design and operation of our
compensation systems.
Corporate Governance and Public Policy Committee (CG&PPC)• Reviews policies and programs related to our image and
reputation.• Ensures appropriate processes are in place for communicating
to clients, employees, shareholders, the investment communityand the public.
Group Executive (GE)• Senior management team led by the President and Chief
Executive Officer (CEO).• Responsible for our strategy and its execution by establishing
the “tone at the top”.• GE’s risk oversight role is executed primarily through the
mandate of the Group Risk Committee and its supporting riskcommittees.
Group Risk Committee (GRC)• Responsible for ensuring that our overall risk profile is
consistent with strategic objectives and that there is anongoing, appropriate and effective risk management process toidentify, measure and manage our risks on an aggregate basis.
Chief Risk Officer (CRO) and Group Risk Management (GRM)• Primarily responsible for the promotion of our risk culture.• Defines and communicates our risk appetite.• Maintains our enterprise-wide program for identifying,
measuring, controlling and reporting the significant risks thatface the organization.
• Establishes risk controls and limits to ensure appropriate riskdiversification and optimizations of risk/return on both aportfolio and transaction basis.
• Monitors risk levels including our risk profile against our riskappetite and reports to senior management and the Board ofDirectors on major risks being assumed by or facing theorganization.
Chief Compliance Officer and Global Compliance• Responsible for providing active oversight of compliance
policies and processes designed to mitigate and manageregulatory risk and compliance in all jurisdictions where weconduct business.
Corporate Treasury• Manages and oversees our capital position, structural interest
rate risk, liquidity and funding risks.
Supporting risk committees• Asset and Liability Committee (ALCO) – reviews, recommends
and approves broad policy frameworks and regular compliancereports related to capital management, liquidity and funding,and structural interest rate risk management.
38 Royal Bank of Canada: Annual Report 2009 Management’s Discussion and Analysis

• Capital Markets Risk Committee – oversees the managementof risks across Capital Markets and is the primary risk approvalauthority for Capital Markets products and initiatives, policies,and limits.
• Investment Portfolio Committee – provides oversight of ourinvestment portfolios outside of Capital Markets, approvesinvestment policies and framework.
• Policy Review Committee (PRC) – the senior risk approvalauthority for policies, products and services.
• Reputation Risk Oversight Committee – provides oversightthrough the review of structured transactions, complex credits,products, business activities or client relationships withpotentially significant reputational, legal, regulatory,accounting or tax risks.
• Compensation Risk Management Oversight Committee –reviews and monitors compensation program design andpayouts of major incentive programs to ensure alignment withthe principles for sound compensation practices issued by theFinancial Stability Board. This committee is comprised of theCRO, Chief Human Resources Officer, and the Chief Admin-istrative Officer and Chief Financial Officer.
• Ethics and Compliance Committee – directly supports ourmanagement of regulatory, compliance and reputation risks.
• Local/Legal Entity Governance and Oversight – ensurescontrols are in place at legal entity boards to escalate risk andgovernance issues to senior management. For example, U.S.Corporate Governance Committee escalates risk andgovernance issues affecting our U.S. operations to seniormanagement.
Business segments• Responsible for specific risks, alignment of business strategy
with risk appetite, and identification, control and managementof their risks.
Risk measurementOur ability to measure risks is a key component of our enterprise-widerisk management process. Certain measurement methodologies arecommon to a number of risk types, while others only apply to a singlerisk type. While quantitative risk measurement is important, we alsoplace reliance on qualitative factors. Our measurement models andtechniques are continually subject to independent assessment forappropriateness and reliability. For those risk types that are difficultto quantify, we place greater emphasis on qualitative risk factors andassessment of activities to gauge the overall level of risk to ensurethat they are within our risk appetite.
Expected lossExpected loss represents losses that are statistically expected tooccur in the normal course of business in a given period of time.
Unexpected loss and Economic CapitalUnexpected loss is a statistical estimate of the amount by whichactual losses can exceed expected loss over a specified time horizon,measured at a specified level of confidence. On an enterprise-widebasis, we use Economic Capital to estimate the unexpected lossassociated with our business activities. For further information, referto the Capital management section.
Sensitivity analysis and stress testingSensitivity analysis and stress testing are risk measurementtechniques that help us ensure that risks we take remain within ourrisk appetite and our level of capital remains adequate.
Sensitivity analysis involves varying a single factor (e.g., a modelinput or specific assumption) to assess the impact on various riskmeasures.
Stress testing generally involves consideration of the simulta-neous movements in a number of risk factors. It is used to measurethe level of potential unexpected losses for Credit, Market (bothtrading and non-trading), Operational and Liquidity and Funding risksunder potential adverse conditions. Stress testing plays an important
role in supporting overall capital management and adequacyassessment processes. Our enterprise-wide stress testing programutilizes stress scenarios featuring a range of severities based onunlikely but possible adverse market and economic events. Thesecommon stress scenarios are evaluated across the organization, andresults are integrated to develop an enterprise-wide view of theimpacts on our financial results and capital requirements. Thisprogram uses macroeconomic projections that are then transformedinto stress impacts on various types of risk across the organization.Macroeconomic scenarios evaluated this year include prolongedrecession, real estate weakness, persistent deflation and a crisis inemerging markets. The current economic environment is favourable tothese projected scenarios.
Model validationWe use models to measure and manage different types of risk. Weemploy a holistic process whereby a model, its inputs and outputs arereviewed. This includes the data used, the logic and theoreticalunderpinnings of the model, the processing component, the inter-pretation of the output and the strategic use of the model results. Ourmodel validation process is designed to ensure that all underlyingmodel risk factors are identified and successfully mitigated. To ensurerobustness of our measurement techniques, model validation iscarried out by our risk professionals independent of those respon-sible for the development and use of the models and assumptions. Incases where independent validation is not internally possible (e.g.,exceptionally specialized models) outside experts are hired tovalidate the model.
Risk controlOur enterprise-wide risk management approach is supported by acomprehensive set of risk controls. The controls are anchored by ourEnterprise Risk Management, Risk Specific, Capital, Liquidity andCompliance Management Frameworks. These frameworks lay thefoundation for the development and communication of policies,establishment of formal risk review and approval processes, and theestablishment of delegated authorities and limits. Theimplementation of robust risk controls enables the optimization ofrisk and return on both a portfolio and a transactional basis.
Our enterprise risk management framework provides an overviewof our enterprise-wide program for identifying, measuring, controllingand reporting on the significant risks we face.
Our risk management frameworks and policies are organizedinto the following five levels:
Level 1: Enterprise Risk Management Framework is the foundationfor all matters related to risk management within the organization.
Level 2: Risk-Specific Frameworks elaborate on each specific risktype and the mechanisms for identifying, measuring, monitoring andreporting of risks, key policies and responsibilities.
Level 3: Enterprise Risk Policies articulate minimum requirementswithin which businesses and employees must operate.
Level 4: “Multi-risk” Enterprise Risk Policies govern activities suchas product risk review and approval, stress testing, risk approvalauthorities and model risk management.
Level 5: Business Segments Specific Policies & Procedures areestablished to manage the risks that are unique to their operations.
Risk review and approval processesRisk review and approval processes are established by GRM based onthe nature, size, and complexity of risk involved. In general, the riskreview and approval process involves a formal review and approval byan individual, group or committee that is independent from theoriginator. The approval responsibilities are governed by delegatedauthorities based on the following categories: transactions, struc-tured credit, projects and initiatives, and new products and services.
Management’s Discussion and Analysis Royal Bank of Canada: Annual Report 2009 39

Authorities and limitsThe CR&RPC delegates Credit, Market, and Insurance risk authoritiesto the President and CEO and CRO. These delegated authorities allowthese officers to approve single name, geographic (country andregion) and industry sector exposures within defined parameters,establish underwriting and inventory limits for trading and investmentbanking activities and set market risk restrictions.
ReportingEnterprise level risk monitoring and reporting are critical componentsof our enterprise risk management program and support the ability ofsenior management and the Board of Directors to effectively performtheir risk management and oversight responsibilities. On a quarterlybasis, the Enterprise Risk Report which includes a range of risksfacing the organization along with analysis of related issues andtrends is provided to senior management and the Board of Directors.Annually, the CRO provides the Board of Directors with a review of therisks facing the organization including a comprehensive review of ourcurrent and projected risk profile relative to our risk appetite and theidentification of emerging risks. In addition to regular risk monitoring,ad-hoc risk reporting is provided to senior management and theBoard of Directors as warranted for new or emerging risk issues orsignificant changes in our level of risk.
Unique monitoring and reporting requirements are specified ineach risk-specific framework and include risk-specific limit usagedeveloped to align with governance best practices and relevant lawsand regulations.
The shaded text along with the tables specifically marked with anasterisk(*) in the following sections of the MD&A represent ourdisclosures on credit, market and liquidity and funding risks inaccordance with CICA Handbook Section 3862, Financial Instru-ments – Disclosures, and includes discussion on how we measureour risk and the objectives, policies and methodologies formanaging these risks. Therefore, these shaded text and tablesrepresent an integral part of our audited 2009 Annual ConsolidatedFinancial Statements for the years ended October 31, 2009 andOctober 31, 2008.
Credit risk
Credit risk is the risk of loss associated with a counterparty’sinability or unwillingness to fulfill its payment obligations and alsoincludes counterparty credit risk in our trading operations. Credit riskmay be direct (e.g. issuer, debtor, borrower or policyholder), orindirect to a secondary obligor (e.g. guarantor, reinsurance),off-balance sheet or contingent on the default of the primary party.
The majority of our businesses offer credit products and servicesand these offerings are a significant driver of overall businessperformance.
The failure to effectively manage credit risk across theorganization and all products, services and activities can have adirect, immediate and material impact on our earnings and reputa-tion. All business activities that are not consistent with our Values,Code of Conduct or policies are avoided.
We balance our risk and return by:• Ensuring that credit quality is not compromised for growth• Diversifying credit risks in transactions, relationships and
portfolios• Using our credit risk rating and scoring systems, policies and
tools• Pricing appropriately for the credit risk taken• Applying consistent credit risk exposure measurements• Mitigating credit risk through preventive and detective controls• Transferring credit risk to third parties where appropriate
through approved credit risk mitigation techniques, includinghedging activities and insurance coverage.
Risk measurementWe quantify credit risk, at both the individual obligor and portfoliolevels to estimate expected credit losses and minimize unexpectedlosses in order to limit earnings volatility.
We employ different risk measurement processes for ourwholesale and retail credit portfolios. The wholesale portfoliocomprises business, sovereign and bank exposures, which includemid-size to large corporations and certain small businesses that aremanaged on an individual client basis. The Retail portfolio iscomprised of residential mortgages and personal, credit card andsmall business loans, which are managed on a pooled basis. Creditrisk rating systems are designed to assess and quantify the riskinherent in credit activities in an accurate and consistent manner.
In measuring credit risk under Basel II, two principalapproaches are available: Advanced Internal Ratings Based (AIRB)and Standardized. Most of our credit risk exposure is measuredunder the AIRB Approach.
Under the AIRB approach, the key parameters used to measureour expected loss are the probability of default (PD), loss given default(LGD) and exposure at default (EAD), which are defined as follows:• PD: An estimated percentage that represents the probability
those obligors within a specific rating grade or for a particularpool of exposures will default within a one-year period.
• LGD: An estimated percentage of EAD that is expected to be lostin the event of default of an obligor.
• EAD: An estimated dollar value of the expected gross exposureof a facility upon default of the obligor before specificprovisions or partial write-offs.These parameters are determined based on historical
experience from internal credit risk rating systems in accordancewith supervisory standards, supplemented by benchmarking andupdated on a regular basis.
Under the Standardized Approach, used primarily for RBCDexia IS, RBC Bank (USA) and our Caribbean banking operations,risk weights prescribed by OSFI are used to calculate risk-weightedassets for credit risk exposure. To determine the appropriate riskweight, credit assessments by OSFI-recognized external credit ratingagencies of S&P, Moody’s, Fitch and DBRS are used. For ratedexposure primarily in sovereign and bank, we assign thecorresponding risk weight according to OSFI’s standard mapping.For unrated exposure mainly in business and retail, we generallyapply OSFI prescribed risk weights in accordance with OSFI’sstandards and guidelines taking into consideration certainexposure specific factors including counterparty type, exposure typeand credit risk mitigation technique employed.
Wholesale credit portfolioThe wholesale credit risk rating system is designed to measure andidentify the risk inherent in our lending credit activities along twodimensions.
In the first dimension, each obligor is assigned a borrower riskrating (BRR), reflecting an assessment of the credit quality of theobligor. Each BRR has a PD assigned to it which is an estimate of theprobability that an obligor with a certain BRR will default within aone-year time horizon. The BRR differentiates the riskiness ofobligors and represents our evaluation of the obligor’s ability andwillingness to meet its contractual obligations despite adverse orstressed business conditions, troughs in the business cycle,economic downturns or unexpected events that may occur. Theassignment of BRRs is based on the evaluation of obligors’ businessrisk and financial risk based on fundamental credit analysissupplemented by quantitative models.
Our rating system is largely consistent with that of external ratingagencies. The table below maps our 22-grade internal risk ratingscompared to ratings by external rating agencies.
Internal ratings map Table 37
RatingsStandard &
Poor’s (S&P)Moody’s InvestorService (Moody’s) Description
1 to 4 AAA to AA- Aaa to Aa3Investment Grade5 to 7 A+ to A- A1 to A3
8 to 10 BBB+ to BBB- Baa1 to Baa311 to 13 BB+ to BB- Ba1 to Ba3
Non-investment Grade14 to 16 B+ to B- B1 to B317 to 20 CCC+ to CC Caa1 to Ca21 to 22 C to D C to Bankruptcy Impaired/Default
40 Royal Bank of Canada: Annual Report 2009 Management’s Discussion and Analysis

LGD rates are largely driven by factors such as seniority of debt,collateral security, product type, and the industry in which theobligor operates. EAD represents an estimate of the expected grossexposure of a credit facility at the time of default of the obligor. Atdefault the obligor may have drawn the facility fully or have repaidsome of the principal. We estimate EAD based on the outstandingportion and an estimated amount of the undrawn portion that isexpected to be drawn at the time of default.
While PD is used at the obligor level, LGD and EAD are estimatedfor the various credit facilities under that obligor. These ratings and riskmeasurements are used in the determination of our expected lossesand unexpected losses as well as economic and regulatory capital,setting of risk limits, portfolio management and product pricing.
Retail credit portfolioCredit scoring is the primary risk rating system for assessing obligorand transaction risk for retail exposures. Credit scoring is employedin the acquisition of new clients (acquisition scoring) andmanagement of existing clients (behavioural scoring).
Acquisition scoring models, which are used for underwritingpurposes, utilize established statistical methods of analyzing newapplicant characteristics and past performance to estimate futurecredit performance. In model development, sources of data are usedand include information obtained from the client such asemployment status, data from our internal systems such as loaninformation and information from external sources such as creditbureaus.
Behavioural scoring is used in the ongoing management of retailclients with whom we have an established relationship. It utilizesstatistical techniques that capture past performance to predict futurebehaviour and incorporate information, such as cash flow andborrowing trends, as well as the extent of our relationship with theclient. The behavioural risk score is dynamic and is generally updatedon a monthly basis to continually re-evaluate the risk. Characteristicsused in behavioural scoring models are based on information fromexisting accounts and lending products for each client, and frominformation obtained from external sources, such as credit bureaus.
For overall portfolio management, retail exposures are assessedon a pooled basis, with each pool consisting of exposures withsimilar homogeneous characteristics. We believe pooling allows formore precise, accurate and consistent estimates of default and losscharacteristics at the pool level.
Criteria used to pool exposures for risk quantification includebehavioural score, product type (mortgage, credit cards, lines ofcredit and instalment loans), collateral type (chattel, liquid assetsand real estate), the length of time that the account has been on ourbooks, and the delinquency status (performing, delinquent anddefault) of the exposure. Regular monitoring and periodic adjust-ments and alignments are conducted to ensure that this processprovides for a meaningful differentiation of risk. Migration betweenthe pools is considered when assessing credit quality.
The pools are also assessed based on PD, EAD and LGD whichconsiders borrower and transaction characteristics, includingbehavioural credit score, product type and delinquency status. TheLGD is estimated based on transaction specific factors, includingproduct, loan to value and collateral types. Our risk ratings arereviewed and updated on a regular basis.
The following table maps PD bands to various risk levels:
Internal ratings map Table 38
PD bands Description
0.0% - 1.0% Low Risk
1.1% - 6.4% Medium Risk
6.5% - 99.99% High Risk
100.00% Impaired/Default
ValidationWe ensure that our credit risk rating systems and methodologies aresubject to independent validation on a regular basis. This provides
support for assuring that our systems properly identify factors thathelp differentiate risk, appropriately quantify risk, produce measuresof risk that respond to changes in the macroeconomic and creditenvironments, and are consistent with regulatory requirements andour ratings philosophy. Validation activities are performedindependently from the groups whose methodologies and processesare subject to validation. Validation activities, results andconclusions are also reviewed by Internal Audit Services on a regularbasis.
Risk controlThe Board of Directors and the following committees are involved inthe management of credit risks: CR&RPC, GRC, PRC and ReputationRisk Oversight Committee. Working in combination, thesecommittees approve credit risk limits and ensure that managementhas in place frameworks, policies, processes and procedures tomanage credit risk. Reports are distributed to the Board of Directors,GRC, and senior executives to keep them informed of our risk profile,including trending information and significant credit risk issues andshifts in exposures to ensure appropriate actions can be takenwhere necessary. Our enterprise-wide credit risk policies, which aredeveloped, communicated and maintained by GRM, set out theminimum requirements for the management of credit risk in a varietyof borrower, transactional and portfolio management contexts. Ourpolicies form an integral component of our Credit Risk ManagementFramework.
These policies set out the minimum requirements for themanagement of credit risk as follows:
Credit Risk Assessment• Mandatory use of credit risk rating and scoring systems.• Consistent credit risk assessment criteria.• Standard content requirements in credit application documents.
Credit Risk MitigationStructuring of transactions• Includes the use of guarantees, security, seniority and
covenants. Product-specific guidelines set out appropriateproduct structuring as well as client and guarantor criteria. Thethird- party guarantors that we deal with are primarily sovereign-sponsored agencies.
Collateral• We generally require obligors to pledge collateral as security
when we advance credit. Real estate, liquid assets, cash, bondsand government securities are examples of the collateralsecurities we accept. The extent of risk mitigation provided bycollateral depends on the amount, type and quality of thecollateral taken. Specific requirements related to collateralvaluation and management are documented in our credit riskmanagement policies.
Credit derivatives• Used as a tool to mitigate industry sector concentration and
single-name exposure. The counterparties that we transact withare typically investment-grade banks and broker/dealers. Aswith other derivatives, we use collateral and master nettingagreements for managing counterparty credit risk and thesecontracts are subject to the same credit approval, limit andmonitoring standards used for managing credit risk. For a moredetailed description of the types of credit derivatives we enterinto and how we manage related credit risk, refer to Note 7 toour Consolidated Financial Statements.
Credit Risk Approval• Proposals for new and amended credit products and services
are comprehensively reviewed and approved under a riskassessment framework and for those with significant riskimplications. Approval by the PRC is required.
Credit Portfolio Management• Limits are used to ensure: our portfolio is well diversified,
reduce concentration risk and remains within our risk appetite.Our credit limits are established at the following levels: single-name limits (notional and economic capital), underwriting risk
Management’s Discussion and Analysis Royal Bank of Canada: Annual Report 2009 41
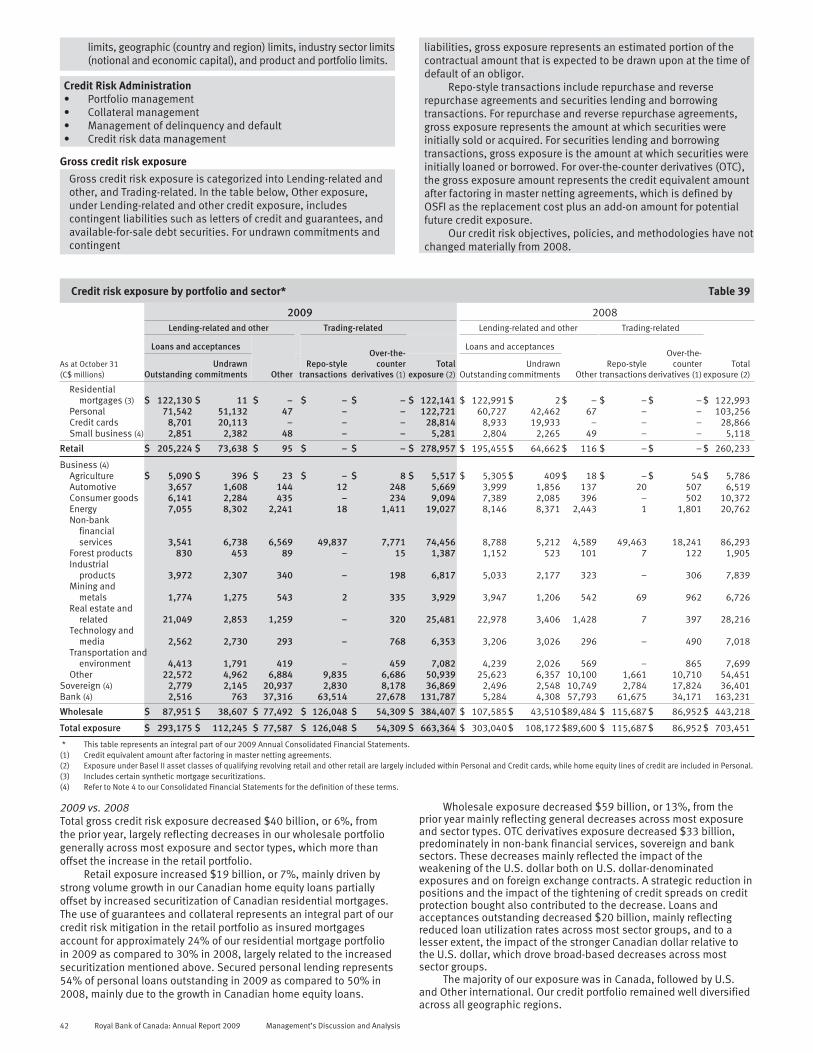
limits, geographic (country and region) limits, industry sector limits(notional and economic capital), and product and portfolio limits.
Credit Risk Administration• Portfolio management• Collateral management• Management of delinquency and default• Credit risk data management
Gross credit risk exposure
Gross credit risk exposure is categorized into Lending-related andother, and Trading-related. In the table below, Other exposure,under Lending-related and other credit exposure, includescontingent liabilities such as letters of credit and guarantees, andavailable-for-sale debt securities. For undrawn commitments andcontingent
liabilities, gross exposure represents an estimated portion of thecontractual amount that is expected to be drawn upon at the time ofdefault of an obligor.
Repo-style transactions include repurchase and reverserepurchase agreements and securities lending and borrowingtransactions. For repurchase and reverse repurchase agreements,gross exposure represents the amount at which securities wereinitially sold or acquired. For securities lending and borrowingtransactions, gross exposure is the amount at which securities wereinitially loaned or borrowed. For over-the-counter derivatives (OTC),the gross exposure amount represents the credit equivalent amountafter factoring in master netting agreements, which is defined byOSFI as the replacement cost plus an add-on amount for potentialfuture credit exposure.
Our credit risk objectives, policies, and methodologies have notchanged materially from 2008.
Credit risk exposure by portfolio and sector* Table 39
2009 2008Lending-related and other Trading-related Lending-related and other Trading-related
Loans and acceptances
OtherRepo-style
transactions
Over-the-counter
derivatives (1)
Loans and acceptancesOver-the-
counterderivatives (1)
Totalexposure (2)
As at October 31(C$ millions) Outstanding
Undrawncommitments
Totalexposure (2) Outstanding
Undrawncommitments Other
Repo-styletransactions
Residentialmortgages (3) $ 122,130 $ 11 $ – $ – $ – $ 122,141 $ 122,991 $ 2 $ – $ – $ – $ 122,993
Personal 71,542 51,132 47 – – 122,721 60,727 42,462 67 – – 103,256Credit cards 8,701 20,113 – – – 28,814 8,933 19,933 – – – 28,866Small business (4) 2,851 2,382 48 – – 5,281 2,804 2,265 49 – – 5,118
Retail $ 205,224 $ 73,638 $ 95 $ – $ – $ 278,957 $ 195,455 $ 64,662 $ 116 $ – $ – $ 260,233
Business (4)Agriculture $ 5,090 $ 396 $ 23 $ – $ 8 $ 5,517 $ 5,305 $ 409 $ 18 $ – $ 54 $ 5,786Automotive 3,657 1,608 144 12 248 5,669 3,999 1,856 137 20 507 6,519Consumer goods 6,141 2,284 435 – 234 9,094 7,389 2,085 396 – 502 10,372Energy 7,055 8,302 2,241 18 1,411 19,027 8,146 8,371 2,443 1 1,801 20,762Non-bank
financialservices 3,541 6,738 6,569 49,837 7,771 74,456 8,788 5,212 4,589 49,463 18,241 86,293
Forest products 830 453 89 – 15 1,387 1,152 523 101 7 122 1,905Industrial
products 3,972 2,307 340 – 198 6,817 5,033 2,177 323 – 306 7,839Mining and
metals 1,774 1,275 543 2 335 3,929 3,947 1,206 542 69 962 6,726Real estate and
related 21,049 2,853 1,259 – 320 25,481 22,978 3,406 1,428 7 397 28,216Technology and
media 2,562 2,730 293 – 768 6,353 3,206 3,026 296 – 490 7,018Transportation and
environment 4,413 1,791 419 – 459 7,082 4,239 2,026 569 – 865 7,699Other 22,572 4,962 6,884 9,835 6,686 50,939 25,623 6,357 10,100 1,661 10,710 54,451
Sovereign (4) 2,779 2,145 20,937 2,830 8,178 36,869 2,496 2,548 10,749 2,784 17,824 36,401Bank (4) 2,516 763 37,316 63,514 27,678 131,787 5,284 4,308 57,793 61,675 34,171 163,231
Wholesale $ 87,951 $ 38,607 $ 77,492 $ 126,048 $ 54,309 $ 384,407 $ 107,585 $ 43,510 $89,484 $ 115,687 $ 86,952 $ 443,218
Total exposure $ 293,175 $ 112,245 $ 77,587 $ 126,048 $ 54,309 $ 663,364 $ 303,040 $ 108,172 $89,600 $ 115,687 $ 86,952 $ 703,451
* This table represents an integral part of our 2009 Annual Consolidated Financial Statements.(1) Credit equivalent amount after factoring in master netting agreements.(2) Exposure under Basel II asset classes of qualifying revolving retail and other retail are largely included within Personal and Credit cards, while home equity lines of credit are included in Personal.(3) Includes certain synthetic mortgage securitizations.(4) Refer to Note 4 to our Consolidated Financial Statements for the definition of these terms.
2009 vs. 2008Total gross credit risk exposure decreased $40 billion, or 6%, fromthe prior year, largely reflecting decreases in our wholesale portfoliogenerally across most exposure and sector types, which more thanoffset the increase in the retail portfolio.
Retail exposure increased $19 billion, or 7%, mainly driven bystrong volume growth in our Canadian home equity loans partiallyoffset by increased securitization of Canadian residential mortgages.The use of guarantees and collateral represents an integral part of ourcredit risk mitigation in the retail portfolio as insured mortgagesaccount for approximately 24% of our residential mortgage portfolioin 2009 as compared to 30% in 2008, largely related to the increasedsecuritization mentioned above. Secured personal lending represents54% of personal loans outstanding in 2009 as compared to 50% in2008, mainly due to the growth in Canadian home equity loans.
Wholesale exposure decreased $59 billion, or 13%, from theprior year mainly reflecting general decreases across most exposureand sector types. OTC derivatives exposure decreased $33 billion,predominately in non-bank financial services, sovereign and banksectors. These decreases mainly reflected the impact of theweakening of the U.S. dollar both on U.S. dollar-denominatedexposures and on foreign exchange contracts. A strategic reduction inpositions and the impact of the tightening of credit spreads on creditprotection bought also contributed to the decrease. Loans andacceptances outstanding decreased $20 billion, mainly reflectingreduced loan utilization rates across most sector groups, and to alesser extent, the impact of the stronger Canadian dollar relative tothe U.S. dollar, which drove broad-based decreases across mostsector groups.
The majority of our exposure was in Canada, followed by U.S.and Other international. Our credit portfolio remained well diversifiedacross all geographic regions.
42 Royal Bank of Canada: Annual Report 2009 Management’s Discussion and Analysis
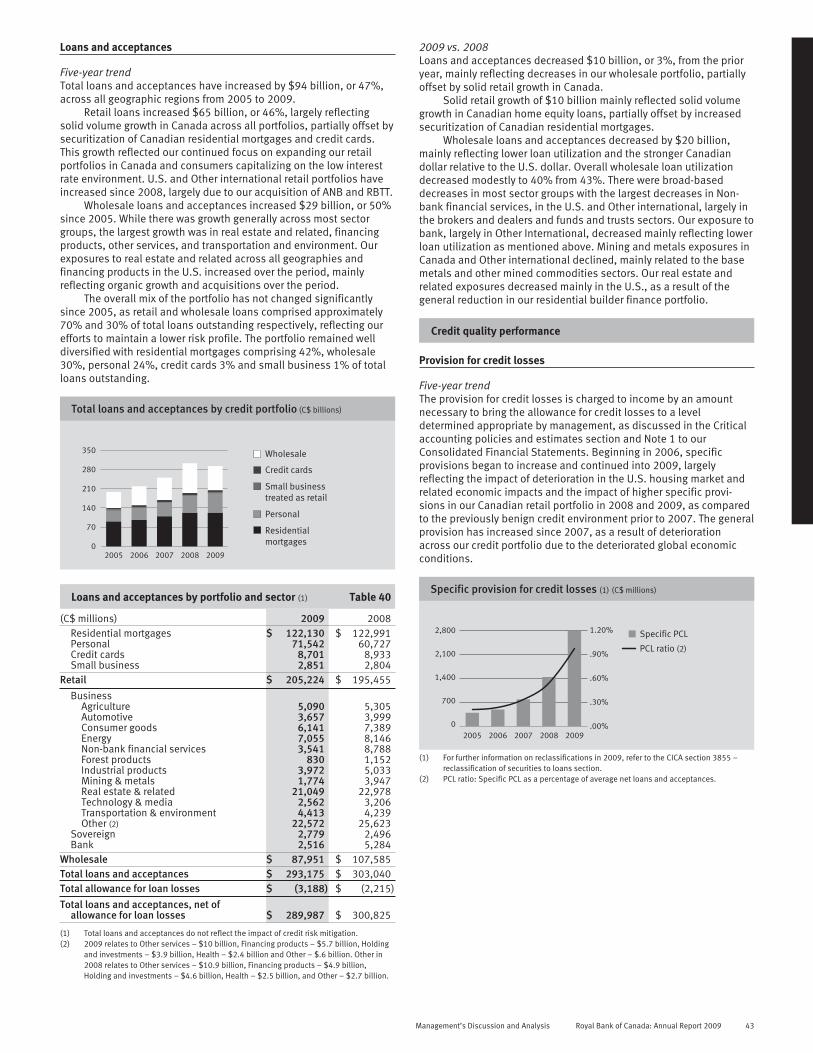
Loans and acceptances
Five-year trendTotal loans and acceptances have increased by $94 billion, or 47%,across all geographic regions from 2005 to 2009.
Retail loans increased $65 billion, or 46%, largely reflectingsolid volume growth in Canada across all portfolios, partially offset bysecuritization of Canadian residential mortgages and credit cards.This growth reflected our continued focus on expanding our retailportfolios in Canada and consumers capitalizing on the low interestrate environment. U.S. and Other international retail portfolios haveincreased since 2008, largely due to our acquisition of ANB and RBTT.
Wholesale loans and acceptances increased $29 billion, or 50%since 2005. While there was growth generally across most sectorgroups, the largest growth was in real estate and related, financingproducts, other services, and transportation and environment. Ourexposures to real estate and related across all geographies andfinancing products in the U.S. increased over the period, mainlyreflecting organic growth and acquisitions over the period.
The overall mix of the portfolio has not changed significantlysince 2005, as retail and wholesale loans comprised approximately70% and 30% of total loans outstanding respectively, reflecting ourefforts to maintain a lower risk profile. The portfolio remained welldiversified with residential mortgages comprising 42%, wholesale30%, personal 24%, credit cards 3% and small business 1% of totalloans outstanding.
Total loans and acceptances by credit portfolio (C$ billions)
2005 2006 20070
70
140
210
280
350
Credit cards
Wholesale
Small businesstreated as retail
Personal
Residentialmortgages
20092008
Loans and acceptances by portfolio and sector (1) Table 40
(C$ millions) 2009 2008Residential mortgages $ 122,130 $ 122,991Personal 71,542 60,727Credit cards 8,701 8,933Small business 2,851 2,804
Retail $ 205,224 $ 195,455
BusinessAgriculture 5,090 5,305Automotive 3,657 3,999Consumer goods 6,141 7,389Energy 7,055 8,146Non-bank financial services 3,541 8,788Forest products 830 1,152Industrial products 3,972 5,033Mining & metals 1,774 3,947Real estate & related 21,049 22,978Technology & media 2,562 3,206Transportation & environment 4,413 4,239Other (2) 22,572 25,623
Sovereign 2,779 2,496Bank 2,516 5,284
Wholesale $ 87,951 $ 107,585Total loans and acceptances $ 293,175 $ 303,040Total allowance for loan losses $ (3,188) $ (2,215)
Total loans and acceptances, net ofallowance for loan losses $ 289,987 $ 300,825
(1) Total loans and acceptances do not reflect the impact of credit risk mitigation.(2) 2009 relates to Other services – $10 billion, Financing products – $5.7 billion, Holding
and investments – $3.9 billion, Health – $2.4 billion and Other – $.6 billion. Other in2008 relates to Other services – $10.9 billion, Financing products – $4.9 billion,Holding and investments – $4.6 billion, Health – $2.5 billion, and Other – $2.7 billion.
2009 vs. 2008Loans and acceptances decreased $10 billion, or 3%, from the prioryear, mainly reflecting decreases in our wholesale portfolio, partiallyoffset by solid retail growth in Canada.
Solid retail growth of $10 billion mainly reflected solid volumegrowth in Canadian home equity loans, partially offset by increasedsecuritization of Canadian residential mortgages.
Wholesale loans and acceptances decreased by $20 billion,mainly reflecting lower loan utilization and the stronger Canadiandollar relative to the U.S. dollar. Overall wholesale loan utilizationdecreased modestly to 40% from 43%. There were broad-baseddecreases in most sector groups with the largest decreases in Non-bank financial services, in the U.S. and Other international, largely inthe brokers and dealers and funds and trusts sectors. Our exposure tobank, largely in Other International, decreased mainly reflecting lowerloan utilization as mentioned above. Mining and metals exposures inCanada and Other international declined, mainly related to the basemetals and other mined commodities sectors. Our real estate andrelated exposures decreased mainly in the U.S., as a result of thegeneral reduction in our residential builder finance portfolio.
Credit quality performance
Provision for credit losses
Five-year trendThe provision for credit losses is charged to income by an amountnecessary to bring the allowance for credit losses to a leveldetermined appropriate by management, as discussed in the Criticalaccounting policies and estimates section and Note 1 to ourConsolidated Financial Statements. Beginning in 2006, specificprovisions began to increase and continued into 2009, largelyreflecting the impact of deterioration in the U.S. housing market andrelated economic impacts and the impact of higher specific provi-sions in our Canadian retail portfolio in 2008 and 2009, as comparedto the previously benign credit environment prior to 2007. The generalprovision has increased since 2007, as a result of deteriorationacross our credit portfolio due to the deteriorated global economicconditions.
Specific provision for credit losses (1) (C$ millions)
2005 2006 2007 2008 20090
2,800 Specific PCL1.20%
PCL ratio (2)
700
1,400
2,100
.00%
.30%
.60%
.90%
(1) For further information on reclassifications in 2009, refer to the CICA section 3855 –reclassification of securities to loans section.
(2) PCL ratio: Specific PCL as a percentage of average net loans and acceptances.
Management’s Discussion and Analysis Royal Bank of Canada: Annual Report 2009 43

Provision for (recovery of) credit losses Table 41
(C$ millions, except percentage amounts ) 2009 2008
Canadian Banking (1) $ 1,275 $ 867International Banking (1) 980 497Capital Markets (1) 702 183Corporate Support (1), (2) 456 47
Canada (3)
Residential mortgages $ 18 $ 8Personal 467 352Credit cards 393 266Small business 55 46
Retail 933 672Wholesale 436 152
Specific PCL 1,369 824
United States (3)
Retail 267 84Wholesale 1,096 494
Specific PCL 1,363 578
Other International (3)
Retail 31 21Wholesale 61 7
Specific PCL 92 28
Total specific PCL 2,824 1,430
General provision (2) 589 165
Total PCL (3) $ 3,413 $ 1,595
(1) Segments with significant total PCL have been presented in the table above. Effectivethe fourth quarter of 2008, changes in Allowance for credit losses – general allowancewere included in Corporate Support results prospectively. For the nine months endedJuly 31, 2008, the general provision was largely comprised of International Banking($20 million).
(2) PCL in Corporate Support is comprised of the general provision, an adjustment relatedto PCL on securitized credit card loans managed by Canadian Banking and an amountrelated to the reclassification of certain AFS securities to loans.
(3) Geographic information is based on residence of borrower.
2009 vs. 2008Total PCL of $3.4 billion increased $1.8 billion from a year ago, mainlydriven by increased specific PCL of $1.4 billion, as well as a highergeneral provision.
Specific PCL in Canadian Banking increased $408 million or 47%,mainly reflecting higher loss rates in credit cards and unsecuredpersonal portfolios and higher impaired loans in our business lendingportfolio primarily as a result of recessionary conditions.
Specific PCL in International Banking increased $503 million,mainly attributable to U.S. banking reflecting impaired loans in ourcommercial, residential builder finance, lot loan, home equity andresidential mortgage portfolios primarily as a result of deterioratedeconomic and housing market conditions. In the latter half of the year,asset quality started stabilizing, largely in our residential builderfinance portfolio, resulting from early signs of the U.S. economicrecovery and lower new impaired loans reflecting the general reductionin this portfolio as compared to the first half of the year and the prioryear. The impact of the weaker Canadian dollar on the translation ofU.S. specific PCL, higher provisions of $59 million resulting from ouradoption of the amendments to CICA section 3855 as certain impairedAFS securities were reclassified to loans, and the full year of resultsfrom RBTT also contributed to the increase. For further details on thereclassification, refer to the CICA section 3855 – reclassification ofsecurities to loans section.
Specific PCL in Capital Markets increased $519 million, due to anumber of impaired loans in our corporate lending portfolio related tospecific clients specializing in non-bank financial services, financingproducts and technology & media sectors.
The general provision was up $424 million from the prior yearlargely related to U.S. banking driven by deterioration in ourcommercial portfolio and higher loss rates in our retail portfolio. To alesser extent, higher provisions related to our U.S. corporate lendingand Canadian unsecured retail and business lending portfolios, alsocontributed to the increase. Refer to Table 70 for further details.
Gross impaired loans
Five-year trendSince 2005, gross impaired loans have increased and continuedthroughout 2009, largely reflecting the impact of deterioration in theU.S. housing market and related global economic impact ascompared to the previously benign credit environment prior to 2007.The increases in 2009 and 2008, as compared to prior years, mainlyreflects higher impaired loans in U.S. banking, and in our corporatelending portfolio also contributed to the increase.
Gross impaired loans and allowance for credit losses (1) (C$ millions)
2005 2006 2007 2008 20090
5,500 ACL
Gross impaired loans
1,100
2,200
3,300
4,400
.00%
.40%
.80%
1.20%
1.60%
2.00%
GIL ratio (2)
(1) For further information on reclassifications in 2009, refer to the CICA section 3855 –reclassification of securities to loans section.
(2) GIL ratio: GIL as a percentage of loans and acceptances.
Gross impaired loans Table 42
(C$ millions, except percentage amounts) 2009 2008Canadian Banking (1) $ 1,253 $ 811International Banking (1) 3,149 1,612Capital Markets (1) 915 499Corporate Support (1) 140 –Canada
Retail $ 673 $ 428Wholesale 839 529
United StatesRetail 227 133Wholesale 3,194 1,526
Other InternationalRetail 209 167Wholesale 315 140
Total GIL $ 5,457 $ 2,923
(1) Segments with significant GIL have been presented in the table above.
2009 vs. 2008Total gross impaired loans (GIL) increased $2.5 billion from a year ago.
GIL in Canadian Banking increased $442 million or 55%, due tohigher impaired loans in our residential, business lending andunsecured personal portfolios.
GIL in International Banking increased $1.5 billion, mainlyattributable to U.S. banking reflecting increased impaired loans of$998 million resulting from our adoption of the amendments to CICAsection 3855, and our residential builder finance and commercialportfolios. Higher GIL in our residential mortgage, home equity and lotloan portfolios and Caribbean legacy and RBTT portfolios, alsocontributed to the increase. These factors were partially offset bywrite-offs and repayments in U.S. banking largely related to ourresidential builder finance, retail and commercial portfolios.
GIL in Capital Markets increased $416 million, reflecting a numberof impaired loans in our corporate portfolio related to clients specializingin non-bank financial services, real estate and related, other servicesand bank sectors. These factors were partially offset by lower GIL infinancing products.
GIL in Corporate Support increased $140 million, reflecting ouradoption of the amendments to CICA section 3855.
Refer to Table 69 for further details.
44 Royal Bank of Canada: Annual Report 2009 Management’s Discussion and Analysis
Allowance for credit losses
Five-year trendSpecific and General allowances have increased since 2006 as aresult of the same conditions previously discussed.
Allowance for credit losses Table 43
(C$ millions, except percentage amounts) 2009 2008
Canadian Banking $ 295 $ 207International Banking 577 375Capital Markets 340 186Corporate Support 2,090 1,531
Specific ACLCanada $ 417 $ 257United States 667 396Other International 195 114
Total specific ACL 1,279 767
General allowanceRetail 1,095 798Wholesale 928 734
Total general allowance 2,023 1,532
Total ACL $ 3,302 $ 2,299
2009 vs. 2008Total allowance for credit losses (ACL) increased $1 billion, or 44%,from a year ago, reflecting a $512 million increase in the specificallowance reflecting the same factors as previously discussed, and$491 million increase in the general allowance, mainly due to ourU.S. banking and, to a lesser extent, our U.S. corporate lending andCanadian retail and business lending portfolios. Refer to Table 71 forfurther details.
Market risk
Market risk is the risk of loss that may arise from changes in marketfactors such as interest rates, foreign exchange rates, equity orcommodity prices, and credit spreads. We are exposed to marketrisk in our trading activity and our asset/liability managementactivities. The level to which we are exposed varies depending onmarket conditions, expectations of future price and yield movementsand the composition of our trading portfolio.
Market risk increased as global capital markets volatilityincreased from the prior year, particularly during the first half of2009. However, this volatility dissipated throughout the remainderof 2009. The higher volatility levels from the first half of 2009 werefully incorporated into the historical data set used for the globalvalue-at-risk (VaR) scenario model during the year which resulted inincreased VaR levels from the previous year.
Trading market riskTrading market risks associated with securities and relatedderivatives trading activities are a result of market-making, propri-etary, and sales and arbitrage activities in the interest rate, foreignexchange, equity, commodities, and credit markets. GRM providesindependent oversight of trading market risk. Trading market riskreflects the potential adverse impact on our earnings and economicvalue and is comprised of the following components:• Interest rate risk arises from the changes in interest rates and is
composed of directional risk, yield curve risk, basis risk andoption risk. Interest rate risk also captures credit spread riskarising from the changes in issuer spreads.
• Foreign exchange rate risk arises from the change in currencyrates and precious metals price movements and volatilities. Inour proprietary positions, we are exposed to the spot, forwardand derivative markets.
• Equity risk arises from the movements in individual equityprices or movements in the level of stock market indices.
• Commodities risk arises from commodities price movementsand volatilities.
• Credit specific risk arises from the change in thecreditworthiness and default of issuers of our holdings in fixedincome products.
• Market illiquidity risk arises from the inability to liquidate ourpositions or acquire hedges to neutralize our trading positions.
We conduct trading activities over-the-counter and on exchanges inthe spot, forward, futures and options markets, and we offerstructured derivative transactions. Our trading operations primarilyact as a market maker, executing transactions that meet thefinancial requirements of our clients and transferring the marketrisks to the broad financial market. We also act as principal and takeproprietary market risk positions within the authorized limitsdetermined by the Board of Directors. The trading book, as definedby OSFI, consists of cash and derivative positions that are held forshort-term resale, taken on with the intent of benefiting in the shortterm from actual or expected differences between their buying andselling prices or to lock in arbitrage profits. The breadth of ourtrading activities is designed to diversify market risk to any particularstrategy, and to reduce trading revenue volatility.
Risk measurementGRM employs risk measurement tools such as Value-at-Risk (VaR),sensitivity analysis and stress testing to assess global risk-returntrends and to alert senior management to adverse trends orpositions.
The majority of trading positions in foreign exchange, interestrate, equity, commodity and credit trading have capital requirementscalculated under an Internal Models Approach (VaR based), whilesome structured credit derivatives, structured rate products,mortgage-backed securities, and equity derivatives have capitalrequirements calculated under the Standardized Approach prescribedby OSFI. Also calculated under the Standardized Approach for creditspecific risk are a limited set of interest rate products. These productsand risks are not included in our VaR, as discussed below.
Value-at-RiskVaR is a statistical technique that measures the worst-case lossexpected over a one-day period within a 99% confidence level.Larger losses are possible, but with low probability. For example,based on a 99% confidence interval, a portfolio with a VaR of $20million held over one day would have a one in one hundred chanceof suffering a loss greater than $20 million in that day.
We measure VaR by major risk category on a discrete basis. Wealso measure and monitor the effects of correlation in themovements of interest rates, credit specific risk, exchange rates,equity and commodity prices and highlight the benefit ofdiversification within our trading portfolio. This is then quantified inthe diversification effect shown in our VaR table.
As with any modeled risk measure, there are certain limitationsthat arise from the assumptions used in VaR . Historical VaR assumesthat the future will behave like the past. The historical scenarios usedto calculate VaR may not capture extreme market volatility. As aresult, historical scenarios may not reflect the next market cycle.Furthermore, the use of a one-day horizon VaR for risk measurementimplies that positions could be unwound or hedged within a day butthis may not be a realistic assumption if the market becomes largelyor completely illiquid.
ValidationTo ensure VaR effectively captures our market risk, we continuouslymonitor and enhance our methodology. Daily back-testing serves tocompare hypothetical profit or loss against the VaR to monitor thestatistical validity of 99% confidence level of the daily VaR measure.Back-testing is calculated by holding position levels constant andisolating the effect of the movement of actual market rates over thenext day and over the next 10 days on the market value of theportfolios. Intra-day position changes account for most of thedifference between theoretical back-testing and actual profit andloss. VaR models and market risk factors are independently reviewedperiodically to further ensure accuracy and reliability. In 2009, therewas 1 occurrence of a back-test loss exceeding total risk VaR. This
Management’s Discussion and Analysis Royal Bank of Canada: Annual Report 2009 45

occurred during the period when markets were particularly volatile.When the historical window used in the VaR calculation is lessvolatile than current markets this can lead to back-testing breaches.When these types of back-testing breaches occur, we frequentlyupdate our scenarios to keep pace with market events.
Sensitivity analysis and stress testingSensitivity analysis is used to measure the impact of small changes inindividual risk factors such as interest rates and foreign exchangerates and is designed to isolate and quantify exposure to theunderlying risk.
In order to address more extreme market events, stress testing isused to measure and alert senior management to our exposure topotential political, economic or other disruptive events. We run severaltypes of stress tests, including historical stress events such as the1987 stock market crash, and the unprecedented market volatility in2008 and early 2009, as well as hypothetical “what-if” stress eventsthat represent potential future events that are plausible but have a verylow probability of occurring. In light of the current market environment,we supplemented existing market risk measures by frequent updates tothe historical scenario window used in VaR and risk factors wererefined to accurately reflect the current market conditions in thecalculations. Our stress scenarios are reviewed and updated asrequired to reflect relevant events and hypothetical situations. Whilewe endeavour to be conservative in our stress testing, there can be noassurance that our stress testing assumptions will cover every marketscenario that may unfold.
Risk controlA comprehensive market risk framework governs trading-related risksand activities and provides guidance to management, middle officecompliance functions and operations. We employ an extensive set ofprinciples, rules, controls and limits, which conform to industry bestpractice. Our market risk management framework is designed toensure that our risks are appropriately diversified on a global basis.Our market risk management framework is designed to ensure thatour risks are appropriately diversified on a global basis. Market risklimit approval authorities are established by the Board of Directors,upon recommendation of the CR&RPC, and delegated to seniormanagement. GRM – Market and Trading Credit Risk providesindependent oversight of trading market risk management activitiesthrough establishing market risk policies and limits and developing,vetting and maintaining our various quantitative techniques andsystems. Enterprise-wide reports are provided to the Chief Risk Officer(CRO) and senior management to monitor compliance against VaRand stress limits approved by the Board of Directors. Limits onmeasures such as notional size, term and overall risk are monitoredat the trading desk and at the portfolio and business levels.
The following table shows our VaR for total trading activitiesunder our models based approach for capital by major risk categoryand also shows the diversification effect, which is calculated as thedifference between the VaR and the sum of the separate risk factorVaRs.
VaR by major risk category* Table 44
2009 2008For the year ended
October 31For the year ended
October 31
(C$ millions)As at
Oct. 31 Average High LowAs at
Oct. 31 Average High Low
Equity $ 9 $ 10 $ 21 $ 6 $ 8 $ 13 $ 28 $ 6Foreign exchange 4 4 13 2 8 3 9 1Commodities 2 1 4 – 1 2 6 –Interest rate 48 49 69 20 34 26 44 17Credit specific 16 11 17 7 8 7 11 4Diversification (26) (22) (33) (7) (19) (23) (38) (13)
VaR $ 53 $ 53 $ 70 $ 26 $ 40 $ 28 $ 50 $ 18
* This table represents an integral part of our 2009 Annual Consolidated FinancialStatements.
VaR by major risk categoryYear ended October 31, 2009(C$ millions)
-70
-60
-50
-40
-30
-20
-10
0
Nov-08
Feb-0
9
May-09
Aug-09
Oct-09
Daily interest rate VaR Daily equity VaRDaily commodities VaR Daily credit specific risk VaRDaily foreign exchange VaR
Trading revenue and VaR (1), (2) (C$ millions)
-100
-60
-20
20
60
200
Daily Trading Revenue
Daily net trading revenue TEB, excluding VIEs and Accrual books
Trading VaR
Nov-2008
Dec-2008
Jan-2009
Feb-2
009
Mar-2009
Apr-2009
May-2009
Jun-2
009
Jul-2
009
Aug-2009
Sep-2009
Oct-2009
300
-300
-500
-700
296
13384
-730
-359
-115
91
-121
(1) Trading revenue on a taxable equivalent basis excluding revenue related toconsolidated VIEs.
(2) Market losses below $2 million were not reflected on the above graph.
Trading revenue for the year ended October 31, 2009 (teb)
Daily net trading revenue (C$ millions), excluding VIEs
0
5
10
15
20
25
30
35
40
< -1
00
-90
-80
-70
-60
-50
-40
-30
-20
-10 0
10
20
30
40
50
60
70
80
90
> 10
0
Freq
uenc
y in
Num
ber o
f Day
s
VaR2009 vs. 2008Average VaR for the year of $53 million was up compared to $28million a year ago. This increase largely reflected the higher marketvolatility in the interest rate and credit markets during 2009.
Trading revenue2009 vs. 2008During the year, we experienced 13 days of net trading lossescompared to 44 days in 2008. For the five net trading loss days inearly 2009, which exceeded VaR estimated for those respective days,three of the largest net trading loss days were primarily due to marketenvironment-related losses. The remaining two net trading loss dayswere largely attributable to the significant volatility in the equity andcredit markets.
Non-trading market risk (Asset/liability management)
Traditional non-trading banking activities, such as deposit taking andlending, expose us to market risk, of which interest rate risk is thelargest component.
Our goal is to manage the interest rate risk of the non-tradingbalance sheet to a target level. We modify the risk profile of thebalance sheet through proactive hedging to achieve our target level.The key sources of interest rate risk include exposures on the maturityand re-pricing structures of certain bank loans, investments,liabilities, derivatives, off-balance sheet items, products with
46 Royal Bank of Canada: Annual Report 2009 Management’s Discussion and Analysis
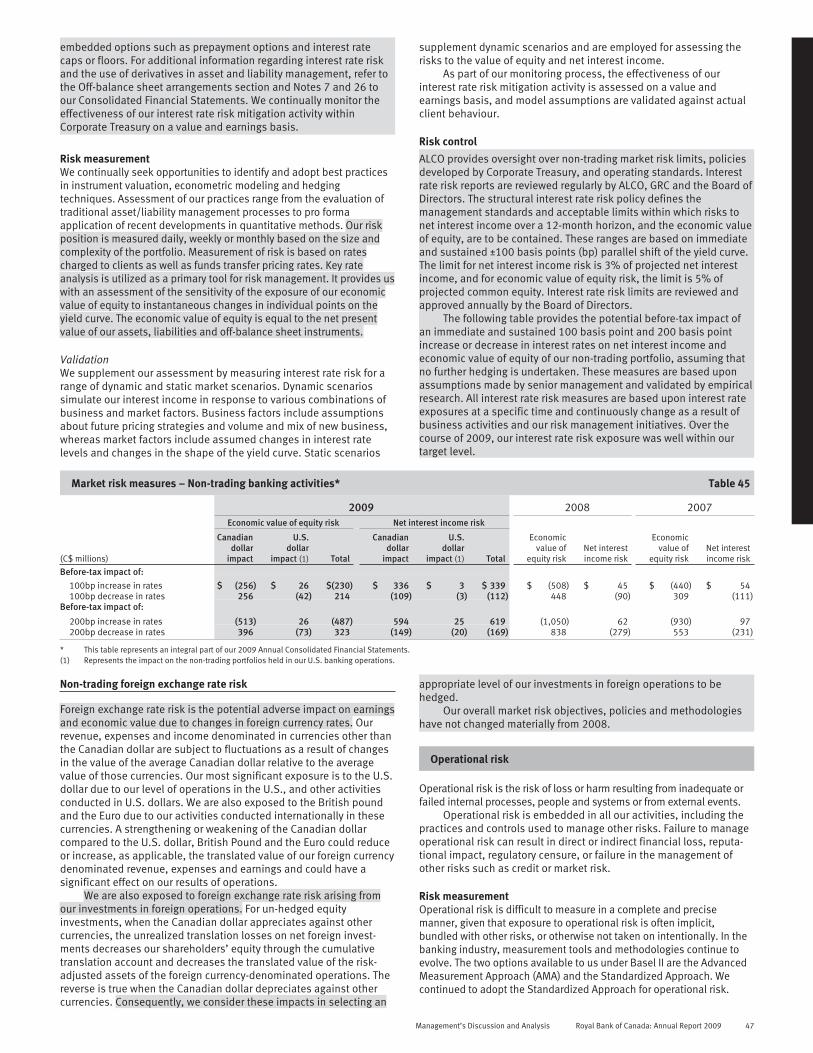
embedded options such as prepayment options and interest ratecaps or floors. For additional information regarding interest rate riskand the use of derivatives in asset and liability management, refer tothe Off-balance sheet arrangements section and Notes 7 and 26 toour Consolidated Financial Statements. We continually monitor theeffectiveness of our interest rate risk mitigation activity withinCorporate Treasury on a value and earnings basis.
Risk measurementWe continually seek opportunities to identify and adopt best practicesin instrument valuation, econometric modeling and hedgingtechniques. Assessment of our practices range from the evaluation oftraditional asset/liability management processes to pro formaapplication of recent developments in quantitative methods. Our riskposition is measured daily, weekly or monthly based on the size andcomplexity of the portfolio. Measurement of risk is based on ratescharged to clients as well as funds transfer pricing rates. Key rateanalysis is utilized as a primary tool for risk management. It provides uswith an assessment of the sensitivity of the exposure of our economicvalue of equity to instantaneous changes in individual points on theyield curve. The economic value of equity is equal to the net presentvalue of our assets, liabilities and off-balance sheet instruments.
ValidationWe supplement our assessment by measuring interest rate risk for arange of dynamic and static market scenarios. Dynamic scenariossimulate our interest income in response to various combinations ofbusiness and market factors. Business factors include assumptionsabout future pricing strategies and volume and mix of new business,whereas market factors include assumed changes in interest ratelevels and changes in the shape of the yield curve. Static scenarios
supplement dynamic scenarios and are employed for assessing therisks to the value of equity and net interest income.
As part of our monitoring process, the effectiveness of ourinterest rate risk mitigation activity is assessed on a value andearnings basis, and model assumptions are validated against actualclient behaviour.
Risk control
ALCO provides oversight over non-trading market risk limits, policiesdeveloped by Corporate Treasury, and operating standards. Interestrate risk reports are reviewed regularly by ALCO, GRC and the Board ofDirectors. The structural interest rate risk policy defines themanagement standards and acceptable limits within which risks tonet interest income over a 12-month horizon, and the economic valueof equity, are to be contained. These ranges are based on immediateand sustained ±100 basis points (bp) parallel shift of the yield curve.The limit for net interest income risk is 3% of projected net interestincome, and for economic value of equity risk, the limit is 5% ofprojected common equity. Interest rate risk limits are reviewed andapproved annually by the Board of Directors.
The following table provides the potential before-tax impact ofan immediate and sustained 100 basis point and 200 basis pointincrease or decrease in interest rates on net interest income andeconomic value of equity of our non-trading portfolio, assuming thatno further hedging is undertaken. These measures are based uponassumptions made by senior management and validated by empiricalresearch. All interest rate risk measures are based upon interest rateexposures at a specific time and continuously change as a result ofbusiness activities and our risk management initiatives. Over thecourse of 2009, our interest rate risk exposure was well within ourtarget level.
Market risk measures – Non-trading banking activities* Table 45
2009 2008 2007Economic value of equity risk Net interest income risk
(C$ millions)
Canadiandollar
impact
U.S.dollar
impact (1) Total
Canadiandollar
impact
U.S.dollar
impact (1) Total
Economicvalue of
equity riskNet interestincome risk
Economicvalue of
equity riskNet interestincome risk
Before-tax impact of:100bp increase in rates $ (256) $ 26 $(230) $ 336 $ 3 $ 339 $ (508) $ 45 $ (440) $ 54100bp decrease in rates 256 (42) 214 (109) (3) (112) 448 (90) 309 (111)
Before-tax impact of:
200bp increase in rates (513) 26 (487) 594 25 619 (1,050) 62 (930) 97200bp decrease in rates 396 (73) 323 (149) (20) (169) 838 (279) 553 (231)
* This table represents an integral part of our 2009 Annual Consolidated Financial Statements.(1) Represents the impact on the non-trading portfolios held in our U.S. banking operations.
Non-trading foreign exchange rate risk
Foreign exchange rate risk is the potential adverse impact on earningsand economic value due to changes in foreign currency rates. Ourrevenue, expenses and income denominated in currencies other thanthe Canadian dollar are subject to fluctuations as a result of changesin the value of the average Canadian dollar relative to the averagevalue of those currencies. Our most significant exposure is to the U.S.dollar due to our level of operations in the U.S., and other activitiesconducted in U.S. dollars. We are also exposed to the British poundand the Euro due to our activities conducted internationally in thesecurrencies. A strengthening or weakening of the Canadian dollarcompared to the U.S. dollar, British Pound and the Euro could reduceor increase, as applicable, the translated value of our foreign currencydenominated revenue, expenses and earnings and could have asignificant effect on our results of operations.
We are also exposed to foreign exchange rate risk arising fromour investments in foreign operations. For un-hedged equityinvestments, when the Canadian dollar appreciates against othercurrencies, the unrealized translation losses on net foreign invest-ments decreases our shareholders’ equity through the cumulativetranslation account and decreases the translated value of the risk-adjusted assets of the foreign currency-denominated operations. Thereverse is true when the Canadian dollar depreciates against othercurrencies. Consequently, we consider these impacts in selecting an
appropriate level of our investments in foreign operations to behedged.
Our overall market risk objectives, policies and methodologieshave not changed materially from 2008.
Operational risk
Operational risk is the risk of loss or harm resulting from inadequate orfailed internal processes, people and systems or from external events.
Operational risk is embedded in all our activities, including thepractices and controls used to manage other risks. Failure to manageoperational risk can result in direct or indirect financial loss, reputa-tional impact, regulatory censure, or failure in the management ofother risks such as credit or market risk.
Risk measurementOperational risk is difficult to measure in a complete and precisemanner, given that exposure to operational risk is often implicit,bundled with other risks, or otherwise not taken on intentionally. In thebanking industry, measurement tools and methodologies continue toevolve. The two options available to us under Basel II are the AdvancedMeasurement Approach (AMA) and the Standardized Approach. Wecontinued to adopt the Standardized Approach for operational risk.
Management’s Discussion and Analysis Royal Bank of Canada: Annual Report 2009 47

Our corporate insurance program enables us to transfer some ofour operational risk exposure by purchasing insurance coverage. Thenature and amounts of this insurance are determined on a central,enterprise-wide basis.
Risk controlOperational risk is managed through our infrastructure, controls,systems and people, complemented by central groups focusing onenterprise-wide management of specific operational risks such asfraud, privacy, outsourcing, and business disruption, as well aspeople and systems risks.
Specific programs, policies, standards and methodologies havebeen developed to support the management of Operational risk.These programs are:
Risk and control assessmentOperational risks are identified and their potential impact assessedthrough our integrated operational risk and control assessment andmonitoring program. Our operational risk framework is used to ensureconsistent identification and assessment of operational risks and thecontrols used to manage them.
Operational event data collection and analysisOperational risk events are reported in a central database.Comprehensive information about these events is collected, andincludes information regarding amount, occurrence, discovery date,business area and product involved, root causes and risk drivers.Events gathered and analyzed include losses, incidents withnon-monetary impacts and near-miss events. Analysis of operationalrisk event data helps us to understand where and how our risks aremanifesting themselves, provides a historical perspective of ouroperational risk experience and establishes a basis for measuring ouroperational risk exposure.
Industry loss analysisWe review and analyze information on operational losses that haveoccurred at other financial institutions, using published information andinformation we acquire through our membership in the OperationalRiskdata eXchange Association, a private data-sharing consortium. Bothsources provide insights into the size and nature of potential exposures,which enables us to benchmark our loss experience against those of ourpeers to determine whether our experience puts us in an outlier position.It also allows us to monitor emerging developments and trends thataffect the financial industry as a whole.
Key risk indicatorsBusiness segments use a broad range of risk indicators to managetheir day-to-day activities. GRM uses indicators to monitor operationalrisk at the enterprise level. These indicators provide insight into thelevel and composition of, as well as potential changes in, ouroperational risk exposure.
Capital management
Strong capital and liquidity positions facilitate opportunistic businessexpansion and help maintain safety and soundness, particularly intimes of stress.
Risks, including credit, market and operational, influence overallcapital management, and liquidity and funding management. Thelinkages between these risks and our stress absorption capability toensure safety and soundness of the organization are illustratedbelow:
Capital managementLiquidity and funding management
Credit risk
Safety and soundness
Market risk•Trading market risk
•Non-trading market riskOperational risk
Market perception
Other risks
Capital management frameworkWe actively manage our capital to maintain strong capital ratios andhigh ratings while providing high returns to our shareholders. Weconsider the requirements of regulators, rating agencies, depositorsand shareholders, our business plans, peer comparisons and ourinternal capital ratio targets. Our goal is to optimize our capital usageand structure, and provide support for our business segments andclients and better returns for our shareholders, while protectingdepositors and senior creditors.
Our capital management framework provides the policies andprocesses for defining, measuring, raising and investing all types ofcapital in a co-ordinated and consistent manner. We manage andmonitor capital from several perspectives, including:• Regulatory capital: capital required for regulatory compliance
defined in accordance with OSFI criteria.• Economic capital: an internal assessment of the amount of
capital required to underpin our risks.• Subsidiary capital: the amount of capital invested in
subsidiaries.
Within our capital management framework, we have an internalcapital adequacy assessment process (ICAAP) that sets internalcapital targets and defines strategies for achieving those targetsconsistent with our risk appetite, business plans and operatingenvironment.
As part of this process, we have implemented a program ofenterprise-wide stress testing to evaluate the income and capital(economic and regulatory) impacts of several potential stress events.This exercise involves various teams, including GRM, Corporate Treasury,Finance and Economics. Results are a key input into our capital planningprocess and are used in setting appropriate internal capital targets.
Basel IIWith OSFI’s adoption of capital guidelines based on “InternationalConvergence of Capital Measurement and Capital Standards: ARevised Framework – Comprehensive Version (June 2006),” known asBasel II, effective November 1, 2007, major Canadian banks arerequired to calculate and report their regulatory capital ratios inaccordance with prescribed measurement standards.
The top corporate entity to which Basel II applies at theconsolidated level is Royal Bank of Canada.
Under Basel II, banks select from among alternative approachesto calculate their minimum regulatory capital required to underpincredit, market and operational risks.
Effective November 1, 2007, we adopted the Basel II AdvancedInternal Ratings Based (AIRB) approach to calculate credit risk capitalfor consolidated regulatory reporting purposes.
While the majority of our exposures are reported under the AIRBApproach, certain portfolios considered non-material from aconsolidated perspective continue to use the Basel II StandardizedApproach for credit risk (for example, our Caribbean Bankingoperations). In addition, the Standardized Approach will continue tobe used for specific portfolios until fiscal 2012 for RBC Bank (USA),and RBC Dexia IS, of which we have a 50% ownership interest.
48 Royal Bank of Canada: Annual Report 2009 Management’s Discussion and Analysis
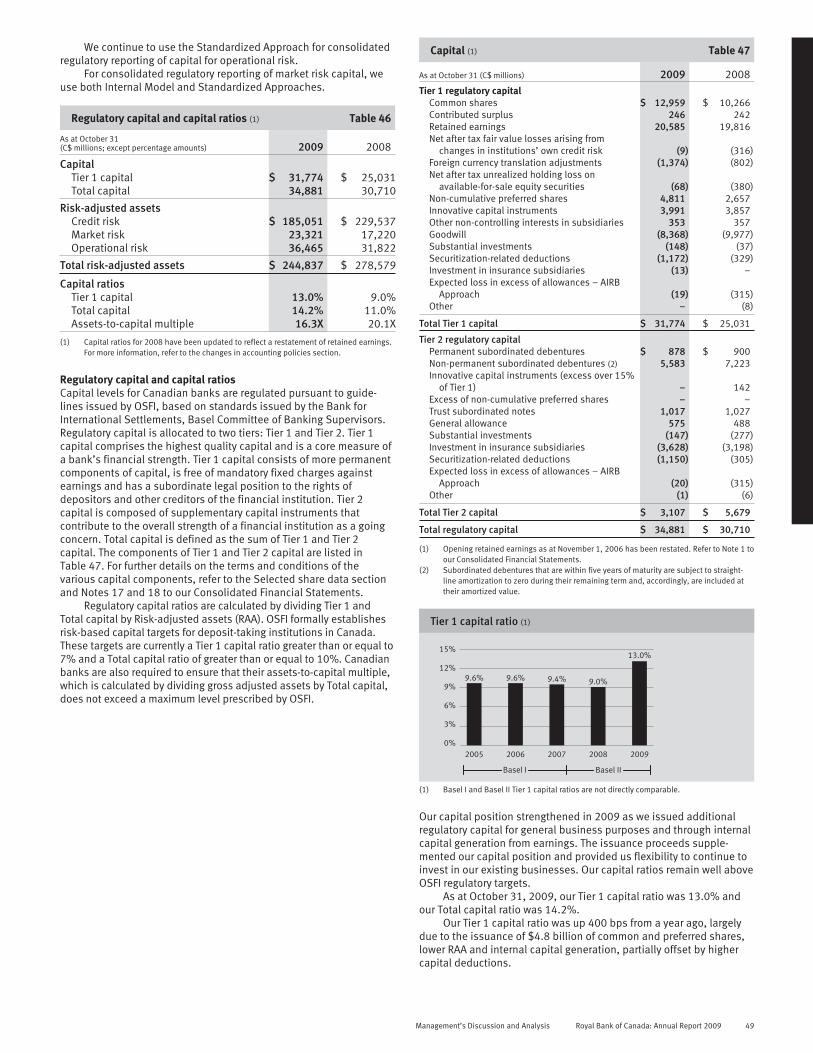
We continue to use the Standardized Approach for consolidatedregulatory reporting of capital for operational risk.
For consolidated regulatory reporting of market risk capital, weuse both Internal Model and Standardized Approaches.
Regulatory capital and capital ratios (1) Table 46
As at October 31(C$ millions; except percentage amounts) 2009 2008
CapitalTier 1 capital $ 31,774 $ 25,031Total capital 34,881 30,710
Risk-adjusted assetsCredit risk $ 185,051 $ 229,537Market risk 23,321 17,220Operational risk 36,465 31,822
Total risk-adjusted assets $ 244,837 $ 278,579
Capital ratiosTier 1 capital 13.0% 9.0%Total capital 14.2% 11.0%Assets-to-capital multiple 16.3X 20.1X
(1) Capital ratios for 2008 have been updated to reflect a restatement of retained earnings.For more information, refer to the changes in accounting policies section.
Regulatory capital and capital ratiosCapital levels for Canadian banks are regulated pursuant to guide-lines issued by OSFI, based on standards issued by the Bank forInternational Settlements, Basel Committee of Banking Supervisors.Regulatory capital is allocated to two tiers: Tier 1 and Tier 2. Tier 1capital comprises the highest quality capital and is a core measure ofa bank’s financial strength. Tier 1 capital consists of more permanentcomponents of capital, is free of mandatory fixed charges againstearnings and has a subordinate legal position to the rights ofdepositors and other creditors of the financial institution. Tier 2capital is composed of supplementary capital instruments thatcontribute to the overall strength of a financial institution as a goingconcern. Total capital is defined as the sum of Tier 1 and Tier 2capital. The components of Tier 1 and Tier 2 capital are listed inTable 47. For further details on the terms and conditions of thevarious capital components, refer to the Selected share data sectionand Notes 17 and 18 to our Consolidated Financial Statements.
Regulatory capital ratios are calculated by dividing Tier 1 andTotal capital by Risk-adjusted assets (RAA). OSFI formally establishesrisk-based capital targets for deposit-taking institutions in Canada.These targets are currently a Tier 1 capital ratio greater than or equal to7% and a Total capital ratio of greater than or equal to 10%. Canadianbanks are also required to ensure that their assets-to-capital multiple,which is calculated by dividing gross adjusted assets by Total capital,does not exceed a maximum level prescribed by OSFI.
Capital (1) Table 47
As at October 31 (C$ millions) 2009 2008Tier 1 regulatory capital
Common shares $ 12,959 $ 10,266Contributed surplus 246 242Retained earnings 20,585 19,816Net after tax fair value losses arising from
changes in institutions’ own credit risk (9) (316)Foreign currency translation adjustments (1,374) (802)Net after tax unrealized holding loss on
available-for-sale equity securities (68) (380)Non-cumulative preferred shares 4,811 2,657Innovative capital instruments 3,991 3,857Other non-controlling interests in subsidiaries 353 357Goodwill (8,368) (9,977)Substantial investments (148) (37)Securitization-related deductions (1,172) (329)Investment in insurance subsidiaries (13) –Expected loss in excess of allowances – AIRB
Approach (19) (315)Other – (8)
Total Tier 1 capital $ 31,774 $ 25,031
Tier 2 regulatory capitalPermanent subordinated debentures $ 878 $ 900Non-permanent subordinated debentures (2) 5,583 7,223Innovative capital instruments (excess over 15%
of Tier 1) – 142Excess of non-cumulative preferred shares – –Trust subordinated notes 1,017 1,027General allowance 575 488Substantial investments (147) (277)Investment in insurance subsidiaries (3,628) (3,198)Securitization-related deductions (1,150) (305)Expected loss in excess of allowances – AIRB
Approach (20) (315)Other (1) (6)
Total Tier 2 capital $ 3,107 $ 5,679
Total regulatory capital $ 34,881 $ 30,710
(1) Opening retained earnings as at November 1, 2006 has been restated. Refer to Note 1 toour Consolidated Financial Statements.
(2) Subordinated debentures that are within five years of maturity are subject to straight-line amortization to zero during their remaining term and, accordingly, are included attheir amortized value.
Tier 1 capital ratio (1)
2005 2006 2007 200920080%
15%
12%
9%
6%
3%
Basel I Basel II
9.6% 9.6% 9.4% 9.0%
13.0%
(1) Basel I and Basel II Tier 1 capital ratios are not directly comparable.
Our capital position strengthened in 2009 as we issued additionalregulatory capital for general business purposes and through internalcapital generation from earnings. The issuance proceeds supple-mented our capital position and provided us flexibility to continue toinvest in our existing businesses. Our capital ratios remain well aboveOSFI regulatory targets.
As at October 31, 2009, our Tier 1 capital ratio was 13.0% andour Total capital ratio was 14.2%.
Our Tier 1 capital ratio was up 400 bps from a year ago, largelydue to the issuance of $4.8 billion of common and preferred shares,lower RAA and internal capital generation, partially offset by highercapital deductions.
Management’s Discussion and Analysis Royal Bank of Canada: Annual Report 2009 49

Our Total capital ratio was up 320 bps, primarily due to the samefactors noted above, partially offset by the redemption and maturityof certain subordinated debentures.
As at October 31, 2009, our assets-to-capital multiple was 16.3times compared to 20.1 times a year ago. Our assets-to-capitalmultiple remains below the maximum prescribed by OSFI.
Risk-adjusted assets (RAA)Under Basel II, OSFI requires banks to meet minimum risk-basedcapital requirements for exposures to credit risk, operational risk,
and, where they have significant trading activity, market risk. RAA iscalculated for each of these risk types and added together todetermine total RAA.
During the year, RAA decreased by $33.7 billion, primarily due toa decrease in wholesale credit exposures, refinements in our assetrisk classifications and the favourable impact of a stronger Canadiandollar on the translation of our foreign currency denominated assets,partially offset by corporate credit deterioration and higher capitalrequirements for market and operational risks.
Risk-adjusted assets – Basel II Table 48
2009 2008
Exposure (1)
Averageof risk
weights(2)
Risk-adjusted assets
TotalAs at October 31 (C$ millions)Standardized
approachAdvancedapproach Other Total
Credit riskLending-related and other
Residential mortgages $ 106,625 6% $ 1,396 $ 4,954 $ 6,350 $ 7,442Other retail 162,692 20% 7,461 25,360 32,821 31,928Business 140,422 60% 32,517 51,567 84,084 97,326Sovereign 25,861 9% 315 1,957 2,272 1,826Bank 40,595 6% 1,584 791 2,375 9,000
Total lending-related and other $ 476,195 27% $ 43,273 $ 84,629 $ – $127,902 $ 147,522
Trading-relatedRepo-style transactions $ 126,048 1% $ 289 $ 824 $ 1,113 $ 3,115Over-the-counter derivatives 54,309 32% 1,941 15,232 17,173 25,896
Total trading-related $ 180,357 10% $ 2,230 $ 16,056 $ – $ 18,286 $ 29,011
Total lending-related and other and trading-related $ 656,552 22% $ 45,503 $100,685 $146,188 $ 176,533Bank book equities 2,125 89% – 1,896 1,896 2,826Securitization exposures 52,211 17% 895 7,733 8,628 7,294Regulatory scaling factor n.a. n.a. n.a. 6,619 6,619 7,491Other assets 35,686 61% n.a. n.a. $21,720 21,720 35,393
Total credit risk $ 746,574 25% $ 46,398 $116,933 $21,720 $185,051 $ 229,537
Market riskInterest rate $ 4,194 $ 3,942 $ 8,136 $ 4,829Equity 381 1,037 1,418 2,573Foreign exchange 449 21 470 348Commodities 427 3 430 347Specific risk 6,813 6,054 12,867 9,123
Total market risk $ 12,264 $ 11,057 $ 23,321 $ 17,220
Operational risk $ 36,465 n.a. n.a. $ 36,465 $ 31,822
Total risk-adjusted assets $ 746,574 $ 95,127 $127,990 $21,720 $244,837 $ 278,579
(1) Total exposure represents exposure at default which is the expected gross exposure upon the default of an obligor. This amount is before any specific allowances or partial write-offs anddoes not reflect the impact of credit risk mitigation and collateral held.
(2) Represents the average of counterparty risk weights within a particular category.
Selected capital management activity Table 49
2009
(C$ millions)
Issuance orredemption
dateNumber of shares
(000s) Amount
Tier 1Common shares issued
General purpose 65,263 $ 2,301Dividend reinvestment plan (DRIP) (1) 5,279 232Stock option exercised (2) 5,808 158
Preferred shares issuedNon-cumulative Series AX April 29, 2009 13,000 325Non-cumulative Series AV April 1, 2009 16,000 400Non-cumulative Series AT March 9, 2009 11,000 275Non-cumulative Series AR January 29, 2009 14,000 350Non-cumulative Series AP January 14, 2009 11,000 275Non-cumulative Series AN December 8, 2009 9,000 225Non-cumulative Series AL November 3, 2009 12,000 300
Redemption of Innovative capital instrumentsRBC Bank (USA)
Series A Capital Securities (US$94 million) October 13, 2009 98Triangle Capital Securities (US$20 million) October 13, 2009 21
Tier 2Redemption of subordinated debentures (3)
June 1, 2009 1,000March 15, 2009 (US$125 million) 159January 27, 2009 500
(1) Effective May 1, 2009, with the first dividend payable on May 22, 2009, common shares were issued under the DRIP at a 3% discount from the average closing price of the five trading dayspreceding the dividend payment date.
(2) Amount included cash received for stock options exercised during the year, the fair value adjustment to stock options and the exercise of stock options from tandem stock appreciation rights(SAR) awards and from renounced tandem SARS.
(3) For further details, refer to Note 16 to our 2009 Annual Consolidated Financial Statements.
50 Royal Bank of Canada: Annual Report 2009 Management’s Discussion and Analysis

During 2009, we did not repurchase any common shares under ournormal course issuer bid (NCIB), which expired on October 31, 2009.Effective November 1, 2009, we renewed our NCIB to re-purchase upto $20 million common shares and it will expire on October 31, 2010.
During 2009, we did not issue any shares from treasury underour Umbrella Savings and Securities Plan, which includes ouremployee savings and share ownership plans.
DividendsOur common share dividend policy reflects our earnings outlook,payout ratio objective and the need to maintain adequate levels of
capital to fund business opportunities. Our medium-term objective forour common share dividend payout ratio is 40% to 50%. In 2009, thedividend payout ratio was 78%, up from 59% in 2008 reflecting lowerearnings which were impacted by the goodwill impairment charge anda higher level of credit losses and the Board of Directors declaring aconsistent level of dividends throughout the year. Common sharedividends paid during the year were $2.8 billion, up 7% from a yearago.
Selected share data (1) Table 50
2009 2008 2007
(C$ millions, except number of shares and per share amounts)
Numberof shares
(000s) Amount
Dividendsdeclared
per share
Numberof shares
(000s) Amount
Dividendsdeclared
per share
Numberof shares
(000s) Amount
Dividendsdeclared
per share
Common shares outstanding 1,417,610 $13,075 $ 2.00 1,341,260 $ 10,384 $ 2.00 1,276,260 $ 7,300 $ 1.82First preferred shares outstanding
Non-cumulative Series N – $ – $ – – $ – $ .88 12,000 $ 300 $ 1.18Non-cumulative Series W (2) 12,000 300 1.23 12,000 300 1.23 12,000 300 1.23Non-cumulative Series AA 12,000 300 1.11 12,000 300 1.11 12,000 300 1.11Non-cumulative Series AB 12,000 300 1.18 12,000 300 1.18 12,000 300 1.18Non-cumulative Series AC 8,000 200 1.15 8,000 200 1.15 8,000 200 1.22Non-cumulative Series AD 10,000 250 1.13 10,000 250 1.13 10,000 250 1.06Non-cumulative Series AE 10,000 250 1.13 10,000 250 1.13 10,000 250 .95Non-cumulative Series AF 8,000 200 1.11 8,000 200 1.11 8,000 200 .77Non-cumulative Series AG 10,000 250 1.13 10,000 250 1.13 10,000 250 .65Non-cumulative Series AH 8,500 213 1.41 8,500 213 .81 – – –Non-cumulative Series AJ (3) 16,000 400 1.49 16,000 400 – – – –Non-cumulative Series AL (3) 12,000 300 1.48Non-cumulative Series AN (3) 9,000 225 1.50Non-cumulative Series AP (3) 11,000 275 1.34Non-cumulative Series AR (3) 14,000 350 1.27Non-cumulative Series AT (3) 11,000 275 1.11Non-cumulative Series AV (3) 16,000 400 1.01Non-cumulative Series AX (3) 13,000 325 .87
Treasury shares – preferred (65) (2) (260) (5) (249) (6)Treasury shares – common (2,127) (95) (2,258) (104) (2,444) (101)Exchangeable shares of RBC PH&N Holdings Inc. 6,413 324 6,750 324Stock options
Outstanding 17,877 21,773 26,623Exercisable 12,806 17,247 21,924
DividendsCommon 2,819 2,624 2,321Preferred 233 101 88
(1) For further details about our capital management activity, refer to Note 18 to our Consolidated Financial Statements.(2) The First Preferred Shares Series W has a conversion option which, as at October 31, 2009, was not yet convertible.(3) Dividend rate will reset every five years.
As at November 30, 2009, the number of outstanding common sharesand stock options were 1,420,680,000 and 17,611,000, respectively.As at November 30, 2009, the number of Treasury shares – preferredand Treasury shares – common were 13,000 and 2,697,000,respectively. For further information about our share capital, refer toNotes 18 and 21 to our Consolidated Financial Statements.
Economic CapitalEconomic Capital is our internal quantification of risks associatedwith business activities which is the capital required to remainsolvent under extreme market conditions, reflecting our objective tomaintain a debt rating of at least AA. Economic Capital is attributed toeach business segment in proportion to management’s assessmentof the risks. It allows for comparable performance measurementsamong our business segments through ROE and RORC as described inthe Key performance and non-GAAP measures section and also aidssenior management in determining resource allocation in conjunctionwith other factors.
Economic Capital is also used to assess the adequacy of ourcapital base. Our policy is to maintain a level of available capital,defined as common equity and other capital instruments with equity-like permanence and loss absorption features such as preferredshares and Innovative Tier 1 instruments, that exceeds EconomicCapital with a comfortable cushion.
Economic Capital is calculated and attributed on a wider array ofrisks than is Basel II Pillar I regulatory capital, which is calibratedpredominantly to target credit, market (trading) and operational riskmeasures. Economic Capital is calculated based on credit, market(trading and non-trading), operational, business and fixed asset, andinsurance risks and includes capital attribution for goodwill and otherintangibles.• Business risk is the risk of loss or harm due to variances in
volumes, prices and costs caused by competitive forces,regulatory changes, reputation and strategic risks.
• Fixed asset risk is defined as the risk that the value of fixedassets will be less than their book value at a future date.
For further discussion on credit, market, operational and insurancerisks, refer to the relevant Risk, capital and liquidity managementsections.
The calculation and attribution of Economic Capital involves a numberof assumptions and judgments by management which are monitoredto ensure that the Economic Capital framework remains compre-hensive and consistent. The models are benchmarked to leadingindustry practices via participation in surveys, reviews of method-ologies and ongoing interaction with external risk managementindustry professionals.
Management’s Discussion and Analysis Royal Bank of Canada: Annual Report 2009 51
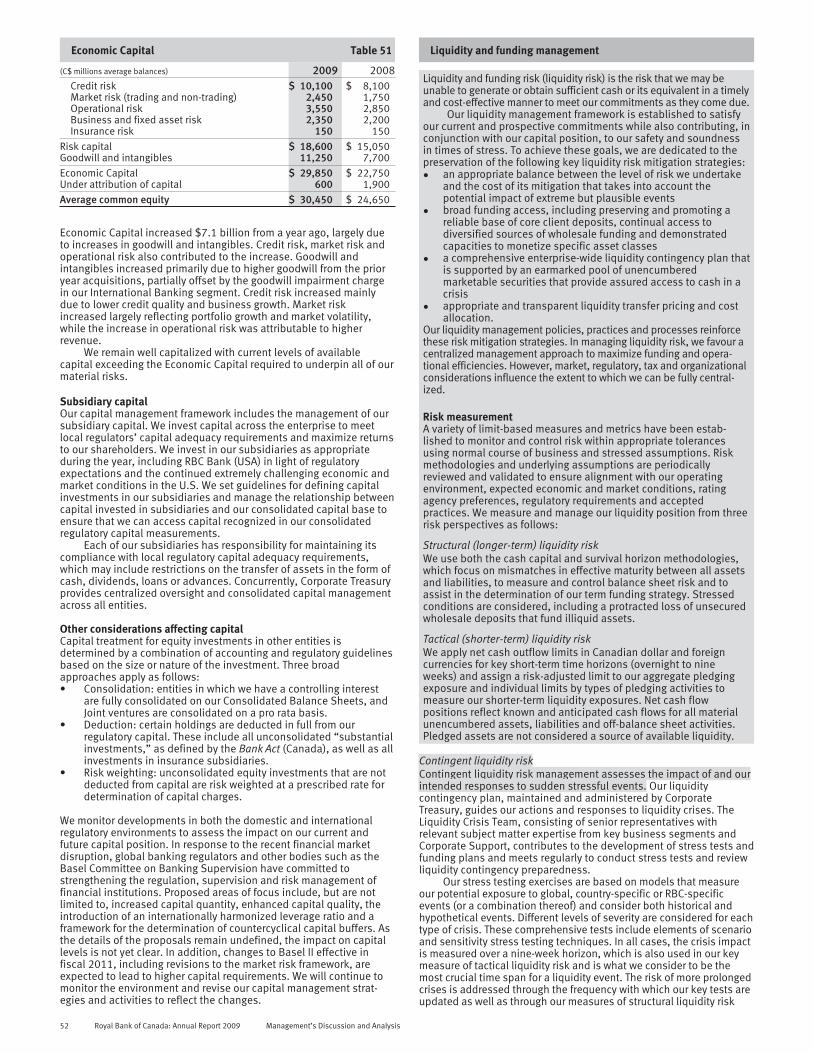
Economic Capital Table 51
(C$ millions average balances) 2009 2008Credit risk $ 10,100 $ 8,100Market risk (trading and non-trading) 2,450 1,750Operational risk 3,550 2,850Business and fixed asset risk 2,350 2,200Insurance risk 150 150
Risk capital $ 18,600 $ 15,050Goodwill and intangibles 11,250 7,700
Economic Capital $ 29,850 $ 22,750Under attribution of capital 600 1,900
Average common equity $ 30,450 $ 24,650
Economic Capital increased $7.1 billion from a year ago, largely dueto increases in goodwill and intangibles. Credit risk, market risk andoperational risk also contributed to the increase. Goodwill andintangibles increased primarily due to higher goodwill from the prioryear acquisitions, partially offset by the goodwill impairment chargein our International Banking segment. Credit risk increased mainlydue to lower credit quality and business growth. Market riskincreased largely reflecting portfolio growth and market volatility,while the increase in operational risk was attributable to higherrevenue.
We remain well capitalized with current levels of availablecapital exceeding the Economic Capital required to underpin all of ourmaterial risks.
Subsidiary capitalOur capital management framework includes the management of oursubsidiary capital. We invest capital across the enterprise to meetlocal regulators’ capital adequacy requirements and maximize returnsto our shareholders. We invest in our subsidiaries as appropriateduring the year, including RBC Bank (USA) in light of regulatoryexpectations and the continued extremely challenging economic andmarket conditions in the U.S. We set guidelines for defining capitalinvestments in our subsidiaries and manage the relationship betweencapital invested in subsidiaries and our consolidated capital base toensure that we can access capital recognized in our consolidatedregulatory capital measurements.
Each of our subsidiaries has responsibility for maintaining itscompliance with local regulatory capital adequacy requirements,which may include restrictions on the transfer of assets in the form ofcash, dividends, loans or advances. Concurrently, Corporate Treasuryprovides centralized oversight and consolidated capital managementacross all entities.
Other considerations affecting capitalCapital treatment for equity investments in other entities isdetermined by a combination of accounting and regulatory guidelinesbased on the size or nature of the investment. Three broadapproaches apply as follows:• Consolidation: entities in which we have a controlling interest
are fully consolidated on our Consolidated Balance Sheets, andJoint ventures are consolidated on a pro rata basis.
• Deduction: certain holdings are deducted in full from ourregulatory capital. These include all unconsolidated “substantialinvestments,” as defined by the Bank Act (Canada), as well as allinvestments in insurance subsidiaries.
• Risk weighting: unconsolidated equity investments that are notdeducted from capital are risk weighted at a prescribed rate fordetermination of capital charges.
We monitor developments in both the domestic and internationalregulatory environments to assess the impact on our current andfuture capital position. In response to the recent financial marketdisruption, global banking regulators and other bodies such as theBasel Committee on Banking Supervision have committed tostrengthening the regulation, supervision and risk management offinancial institutions. Proposed areas of focus include, but are notlimited to, increased capital quantity, enhanced capital quality, theintroduction of an internationally harmonized leverage ratio and aframework for the determination of countercyclical capital buffers. Asthe details of the proposals remain undefined, the impact on capitallevels is not yet clear. In addition, changes to Basel II effective infiscal 2011, including revisions to the market risk framework, areexpected to lead to higher capital requirements. We will continue tomonitor the environment and revise our capital management strat-egies and activities to reflect the changes.
Liquidity and funding management
Liquidity and funding risk (liquidity risk) is the risk that we may beunable to generate or obtain sufficient cash or its equivalent in a timelyand cost-effective manner to meet our commitments as they come due.
Our liquidity management framework is established to satisfyour current and prospective commitments while also contributing, inconjunction with our capital position, to our safety and soundnessin times of stress. To achieve these goals, we are dedicated to thepreservation of the following key liquidity risk mitigation strategies:• an appropriate balance between the level of risk we undertake
and the cost of its mitigation that takes into account thepotential impact of extreme but plausible events
• broad funding access, including preserving and promoting areliable base of core client deposits, continual access todiversified sources of wholesale funding and demonstratedcapacities to monetize specific asset classes
• a comprehensive enterprise-wide liquidity contingency plan thatis supported by an earmarked pool of unencumberedmarketable securities that provide assured access to cash in acrisis
• appropriate and transparent liquidity transfer pricing and costallocation.
Our liquidity management policies, practices and processes reinforcethese risk mitigation strategies. In managing liquidity risk, we favour acentralized management approach to maximize funding and opera-tional efficiencies. However, market, regulatory, tax and organizationalconsiderations influence the extent to which we can be fully central-ized.
Risk measurementA variety of limit-based measures and metrics have been estab-lished to monitor and control risk within appropriate tolerancesusing normal course of business and stressed assumptions. Riskmethodologies and underlying assumptions are periodicallyreviewed and validated to ensure alignment with our operatingenvironment, expected economic and market conditions, ratingagency preferences, regulatory requirements and acceptedpractices. We measure and manage our liquidity position from threerisk perspectives as follows:
Structural (longer-term) liquidity riskWe use both the cash capital and survival horizon methodologies,which focus on mismatches in effective maturity between all assetsand liabilities, to measure and control balance sheet risk and toassist in the determination of our term funding strategy. Stressedconditions are considered, including a protracted loss of unsecuredwholesale deposits that fund illiquid assets.
Tactical (shorter-term) liquidity riskWe apply net cash outflow limits in Canadian dollar and foreigncurrencies for key short-term time horizons (overnight to nineweeks) and assign a risk-adjusted limit to our aggregate pledgingexposure and individual limits by types of pledging activities tomeasure our shorter-term liquidity exposures. Net cash flowpositions reflect known and anticipated cash flows for all materialunencumbered assets, liabilities and off-balance sheet activities.Pledged assets are not considered a source of available liquidity.
Contingent liquidity riskContingent liquidity risk management assesses the impact of and ourintended responses to sudden stressful events. Our liquiditycontingency plan, maintained and administered by CorporateTreasury, guides our actions and responses to liquidity crises. TheLiquidity Crisis Team, consisting of senior representatives withrelevant subject matter expertise from key business segments andCorporate Support, contributes to the development of stress tests andfunding plans and meets regularly to conduct stress tests and reviewliquidity contingency preparedness.
Our stress testing exercises are based on models that measureour potential exposure to global, country-specific or RBC-specificevents (or a combination thereof) and consider both historical andhypothetical events. Different levels of severity are considered for eachtype of crisis. These comprehensive tests include elements of scenarioand sensitivity stress testing techniques. In all cases, the crisis impactis measured over a nine-week horizon, which is also used in our keymeasure of tactical liquidity risk and is what we consider to be themost crucial time span for a liquidity event. The risk of more prolongedcrises is addressed through the frequency with which our key tests areupdated as well as through our measures of structural liquidity risk
52 Royal Bank of Canada: Annual Report 2009 Management’s Discussion and Analysis

that assume a stressed environment. Key tests are run monthly, whileothers are only run quarterly. Frequency is determined by considering acombination of likelihood and impact. After reviewing test results, theliquidity contingency plan and other liquidity and funding riskmanagement practices and limits may be modified.
Our liquid assets are primarily a diversified pool of highly ratedand liquid marketable securities and include segregated portfolios (inboth Canadian and U.S. dollars) of contingency liquidity assets toaddress potential on- and off-balance sheet liquidity exposures (suchas deposit erosion, loan drawdowns and higher collateral demands),that have been estimated through models we have developed or bythe scenario analyses and stress tests that we conduct periodically.These portfolios are subject to minimum asset levels and stricteligibility guidelines to ensure ready access to cash in emergencies,including their eligibility for central bank advances.
Risk controlThe Board of Directors is responsible for oversight of our liquidity andfunding management framework, which is developed andimplemented by senior management. We monitor and manage ourliquidity position on a consolidated basis and for key units andconsider legal, regulatory, tax, operational and any other applicablerestrictions. This includes analyzing our ability to lend or borrow fundsbetween branches, branches and subsidiaries, and subsidiaries, andconverting funds between currencies. GRC and ALCO sharemanagement oversight responsibility for liquidity and funding policiesand receive regular reports detailing compliance with key limits andguidelines. The Board of Directors is informed on a periodic basisabout our current and prospective liquidity condition.
PoliciesOur principal liquidity and funding policies define risk toleranceparameters. They authorize senior management committees orCorporate Treasury to approve more detailed policies and limitsrelated to specific businesses and products that govern management,measurement and reporting requirements.
Authorities and limitsLimits for our structural liquidity risk positions are approved at leastannually and measured and monitored weekly, monthly or quarterly.Net cash flow limits are approved at least annually. Depending on themateriality of each reporting entity, net cash flow limits are monitoreddaily or weekly by major currency, branches, subsidiaries andgeographic locations. Any potential exceptions to established limitsare reported immediately to Corporate Treasury, which provides orarranges for approval after reviewing a remedial action plan.
The prescribed treatments for cash flow assets and liabilitiesunder varying conditions are reviewed periodically by CorporateTreasury in concert with GRM and the business segments todetermine if they remain valid or changes to assumptions and limitsare required. Through this process, we ensure that a close link ismaintained between the management of liquidity and funding risk,market liquidity risk and credit risk, including GRM approval of creditlines between entities. In response to our experience during thevolatile markets of the past two years, we have modified the liquiditytreatment of certain asset classes to reflect our expectations thatmarket liquidity for these products will remain impaired for sometime. Where required, limits have been reduced in consideration ofthe results of updated stress tests.
FundingFunding strategyCore funding, comprising capital, longer-term liabilities and adiversified pool of personal and, to a lesser extent, commercial andinstitutional deposits, is the foundation of our structural liquidityposition. Our wholesale funding activities are well diversified bygeographic origin, investor segment, instrument, currency, structureand maturity. We maintain an ongoing presence in different fundingmarkets, which allows us to constantly monitor market developmentsand trends, identify opportunities and risks and take appropriate andtimely actions. We operate longer-term debt issuance programs inCanada, the U.S., Europe, Australia and Japan. Expansion into newmarkets and untapped investor segments is constantly evaluatedagainst relative issuance costs since diversification expands ourwholesale funding flexibility and minimizes funding concentrationand dependency, and generally reduces financing costs. Maintainingcompetitive credit ratings is also critical to cost-effective funding.
Credit ratingsOur ability to access unsecured funding markets and to engage incertain collateralized business activities on a cost-effective basis isprimarily dependent upon maintaining competitive credit ratings. Ourcredit ratings are largely determined by the quality of our earnings,the adequacy of our capital and the effectiveness of our riskmanagement programs. There can be no assurance that our creditratings and rating outlooks will not be lowered or that ratingsagencies will not issue adverse commentaries about us, potentiallyresulting in adverse consequences for our funding capacity or accessto capital markets. A lowering of our credit ratings may also affect ourability, and the cost, to enter into normal course derivative or hedgingtransactions and may require us to post additional collateral undercertain contracts. However, we estimate, based on periodic reviews ofratings triggers embedded in our existing businesses and of ourfunding capacity sensitivity, that a minor downgrade would notmaterially influence our liability composition, funding access,collateral usage and associated costs.
The following table presents our major credit ratings as atDecember 3, 2009. Our collective ratings continue to be the highestcategories assigned by the respective agencies to a Canadian bank,and these strong credit ratings support our ability to competitivelyaccess unsecured funding markets.
Credit ratings* Table 52
As at December 3, 2009 (1)Short-
term debtSenior long-
term debt Outlook
Moody’s Investors Service (Moody’s) P-1 Aaa negativeStandard & Poor’s (S&P) A-1+ AA- stableFitch Ratings (Fitch) F1+ AA stableDBRS R-1(high) AA stable
* This table represents an integral part of our 2009 Annual Consolidated FinancialStatements.
(1) Credit ratings are not recommendations to purchase, sell or hold a financial obligationinasmuch as they do not comment on market price or suitability for a particular investor.Ratings are subject to revision or withdrawal at any time by the rating organization.
Deposit profileOur personal deposit franchise constitutes the principal source ofreliable funding while certain commercial and institutional clientgroups also maintain relational balances with low volatility profiles.Taken together, these clients represent a highly stable supply of coredeposits in most conceivable environments as they typically are lessresponsive to market developments than transactional lenders andinvestors due to the impact of deposit insurance and extensive and,at times, exclusive relationships with us. Core deposits, consisting ofour own statistically derived estimates of the highly stable portions ofall of our relational personal, commercial and institutional balances(demand, notice and fixed-term) together with wholesale fundsmaturing beyond one year, increased during the year by about 6% to63% of our total deposits.
Term funding sources* Table 53
(C$ millions) 2009 2008 2007
Long-term funding outstanding $ 58,831 $ 70,906 $ 51,540Total mortgage-backed securities
sold 28,815 15,196 14,239Commercial mortgage-backed
securities sold 1,916 2,159 2,405Credit card receivables financed
through notes issued by asecuritization special purposeentity 2,913 3,163 2,759
* This table represents an integral part of our 2009 Annual Consolidated FinancialStatements.
During 2009, we continued to expand our long-term funding base byselectively issuing, either directly or through our subsidiaries,$5.5 billion of senior deposit notes in various currencies and markets.However, total long-term funding outstanding decreased $12.1 billionas we relied more heavily on securitizations. Outstanding senior debtcontaining ratings triggers, which would accelerate repayment,constitutes a very small proportion of our overall outstanding debt.
Management’s Discussion and Analysis Royal Bank of Canada: Annual Report 2009 53

Other liquidity and funding sourcesWe use residential mortgage, commercial mortgage and credit cardreceivable-backed securitization programs as alternative sources offunding and for liquidity and asset/liability management purposes.We hold retained interests in our residential mortgage and credit cardsecuritization programs. Our total outstanding MBS sold increasedyear over year by $13,619 million. Our credit card receivables, whichare financed through notes issued by a securitization specialpurposes entity, decreased year over year by $250 million. For furtherdetails, refer to the Off-balance sheet arrangements section and Note5 to our Consolidated Financial Statements.
Impact of global market developments on liquidity managementDespite challenging financial market conditions during much of the pasttwo years, we believe our liquidity and funding position remainssufficient to execute our strategy. Public sector initiatives introducedover this period have contributed to gradually improving global marketcircumstances and a less vulnerable financial system. Although wecontinued to experience comparatively favourable wholesale fundingaccess and pricing during the year, we selectively participated in someof the government and central bank lending programs to supplementour established financing resources. The MBS auctions introduced bythe Government of Canada in October 2008 helped us strengthen ourliquidity position in 2009 by providing an additional channel forsecuritized residential mortgages during a period when the term fundingmarkets registered a material reduction in liquidity. We further bolsteredour liquidity position during the year by more aggressively gatheringcore deposits, reducing collateral requirements and issuing capital.More recently, the non-government guaranteed bank term fundingmarket has witnessed a broad-based revival with credit spreadscompressing meaningfully across the credit quality spectrum. Our newissue spreads for senior term debt in Canada are now at their lowestlevels since late 2007 and provide us with renewed opportunities forfurther strengthening our liquidity position going forward as circum-stances warrant. We do not foresee any material impact from thereduction or cancellation of public sector funding or liquidity programs.
We maintained a liquidity and funding position that we continueto believe is appropriate to execute our strategy, and levels ofliquidity and funding risk remain well within our risk appetite. Exceptfor concerns about the sustainability of the economic recovery andrelated implications for financial market resiliency, there are no otherknown trends, demands, commitments or events that are presentlyexpected to materially change this position.
Our liquidity and funding risk objectives, policies andmethodologies have not changed materially from 2008. However,certain limits and strategies have been revised as a result of themarket conditions.
Contractual obligationsIn the normal course of business, we enter into contracts that giverise to commitments of future minimum payments that affect ourliquidity. Depending on the nature of these commitments, theobligation may be recorded on- or off-balance sheet. The table belowprovides a summary of our future contractual funding commitments.
Contractual obligations* Table 54
2009 2008 2007
As at October 31(C$ millions) (1)
Within 1year
1 to 3years
3 to 5years
Over 5years Total Total Total
Unsecured long-termfunding $ 33,684 $ 24,057 $ 9,595 $ 2,436 $ 69,772 $ 58,615 $ 49,131
Covered bonds 204 – 3,407 2,129 5,740 5,248 –Subordinated
debentures 103 – – 6,461 6,564 8,258 6,343Obligations under
leases (2) 566 926 668 1,202 3,362 3,196 3,161$ 34,557 $ 24,983 $ 13,670 $12,228 $ 85,438 $ 75,317 $ 58,635
* This table represents an integral part of our 2009 Annual Consolidated FinancialStatements.
(1) The amounts presented above exclude accrued interest except for the category “Within1 year.”
(2) Substantially all of our lease commitments are operating.
Overview of other risks
Reputation risk
Reputation risk is the risk that an activity undertaken by anorganization or its representatives will impair its image in thecommunity or lower public confidence in it, resulting in the loss ofbusiness, legal action or increased regulatory oversight.
Reputation risk can arise from a number of events and primarilyoccurs in connection with regulatory, legal and operational risks.Operational failures and non-compliance with laws and regulationscan have a significant reputational impact on us.The following principles also apply to our overall management ofreputation risk:• We must operate with integrity at all times in order to sustain a
strong and positive reputation.• Protecting our reputation is the responsibility of all our
employees, including senior management and extends to allmembers of the Board of Directors.
Code of ConductOur corporate values and Code of Conduct underpin the managementof risk to our reputation and drive our ethical culture. Our Code ofConduct is the foundation of employee and director awareness of thekinds of conduct that protect our reputation, and those that put ourreputation at risk.
Risk controlPolicies and procedures support the management of reputation riskacross the organization. A comprehensive set of policy requirementsapplies to the identification and assessment of reputation risk,including Know Your Client due diligence controls and procedures,anti-money laundering and anti-terrorist financing policy requirements,auditor independence requirements, research standards, whistleblowing, and the requirements for managing conflicts of interest.
While our Code of Conduct and policies support the preventionof reputation risk, we recognize that issues that could affect ourreputation may still occur. To mitigate potential risk to our reputationstemming from such events, we have detailed and disciplinedescalation, reporting and resolution protocols.
Regulatory and legal risk
Regulatory and legal risk is the risk of negative impact to businessactivities, earnings or capital, regulatory relationships or reputationas a result of failure to comply with or a failure to adapt to current andchanging regulations, law, industry codes or rules, regulatoryexpectations, or ethical standards.
Global Compliance has developed a comprehensive enterprisecompliance management (ECM) framework that is consistent withregulatory guidance from OSFI and other regulators. The framework isdesigned to promote the proactive, risk-based management ofcompliance and regulatory risk. It applies to all of our businesses andoperations, legal entities and employees globally, and confirms theshared accountability of all our employees for ensuring we maintainrobust and effective regulatory risk and compliance controls. Withinthe ECM framework there are five elements that drive themanagement of regulatory risk. The first element sets the cycle inmotion by defining the nature of our business activities andoperations. The second element ensures compliance programs aredesigned in a manner to most effectively meet regulatory require-ments. The third and fourth elements relate to the design andimplementation of specific controls and the associated monitoringand oversight of the effectiveness of those controls. This approachallows us to take an enterprise-wide and holistic view of allcompliance programs. The fifth element ensures the timely escalationand resolution of issues, and clear and transparent reporting. This is acritical step in enabling senior management and the Board ofDirectors to effectively perform their management and oversightresponsibilities.
Risk measurementThe identification and assessment of regulatory risk includes formalrisk assessment activities carried out across the organization, both atthe individual business and operational level, and at the enterpriselevel. Risk is measured through the assessment of the impact ofregulatory and organizational changes, the introduction of newproducts and services, and the acquisition or development of new linesof business. It is also measured through the testing of the effectivenessof the controls established to ensure compliance with regulatory
54 Royal Bank of Canada: Annual Report 2009 Management’s Discussion and Analysis

requirements and expectations. Although the use of metrics to measurecompliance-related matters is relatively new and there are few provenmethods for detecting leading indicators, we are refining anddeveloping new qualitative and quantitative measures. Meanwhile, weuse what measures are available to identify issues and trends.
Risk controlWe have a strong ethical and compliance culture grounded in our Codeof Conduct. The Code of Conduct is regularly reviewed and updated toensure that it continues to meet the expectations of regulators and otherstakeholders. All our employees must reconfirm their understanding ofand commitment to comply with the Code of Conduct at least every twoyears, and employees in certain key roles, such as Group Executive andothers in financial oversight roles, must do so annually.
We provide online and face-to-face training for all our employeeson the Code of Conduct and in the area of anti-money laundering andanti-terrorist financing, and training in other compliance andregulatory risk related matters for relevant employees through otheronline tools and job aids (as part of employees’ regular job training),in new employee orientation materials, and periodically throughtargeted online, face-to-face or webcast training.
Insurance risk
Insurance risk is the exposure to potential financial loss arising frompayments that are different than anticipated (e.g., number, amount,and timing) under an insurance policy or reinsurance treaty. Insurancerisk is primarily associated with adverse experience with respect tomortality, morbidity, longevity, claim frequency, claim severity,policyholder behaviour and expense. Insurance risk arises from allour Insurance businesses, which include life and health, creditor,home and auto, travel insurance, and reinsurance. Insurance risk isfurther categorized into the following sub-risks:• Claims risk: The risk that the actual severity, frequency or timing
of claims differs from the levels assumed in pricing calculationsor reserves. Claims risk may be realized in two ways: 1)mis-estimation of expected claims activities to actual activitiesor, 2) the criteria for underwriting the risk are not aligned withthe estimate for the amount, frequency, and/or timing of claims.Types of claims risk include mortality risk, longevity risk,morbidity risk, home and auto risk, and travel risk.
• Policyholder behaviour risk: The risk that the actual behaviour ofpolicyholders relating to premium payments, policy withdrawalsor loans, policy lapses, surrenders, and the exercise of otherpolicy options differ from the behaviour assumed in pricingcalculations or reserves.
• Expense risk: The risk that the expense of acquiring or adminis-tering policies, or of processing claims, exceeds the costsassumed in pricing calculations.
Risk measurementInsurance risk is measured at regular intervals to ensure that our riskprofile is appropriately monitored, reported, and aligned withbusiness assumptions. These risk measurements are used forEconomic Capital quantification, valuation of actuarial liabilities, andto meet statutory reporting requirements. This process is managed byGRM-Insurance through the use of models.
Models used for risk measurement are subject to a robust andsystematic process of review and reporting in accordance with ourModel Risk Policy. Key elements of the policy include maintainingappropriate model documentation, an approval process to ensureappropriate segregation of duties, independent and periodic modelreviews, and clear accountability and oversight.
Risk controlPolicies and procedures support the management of insurance risk byarticulating our strategies to identify, prioritize, and manageinsurance risk. Insurance risk policies establish the expectations andparameters within which the insurance businesses may operate,communicate our risk tolerance, and ensure accountability throughclear roles and responsibilities.
Authorities and limitsRisk approval authorities and limits are established by the Board ofDirectors and delegated to management within the business units inorder to guide insurance business activities. These delegatedauthorities and limits ensure our insurance portfolio is well diversifiedand within the risk appetite as approved by the Board of Directors.
Risk oversight and approvalGRM-Insurance provides independent oversight over our insurancebusiness activities including: product development, product pricing,underwriting, and claims management. GRM-Insurance is also theapproval authority for activities that exceed business unit authoritiesand limits, as well as certain business activities which are deemed tobe of significant risk.
Risk mitigationKey elements for identifying, assessing and managing insurance riskinclude a risk review and approval process for product development andpricing, effective guidelines and practices for underwriting and claimsmanagement, and reinsurance, which involves transactions that transferinsurance risk to independent insurance companies, is also used todiversify our portfolio of insurance risks, limit loss exposure to largerisks, and provide additional capacity for future growth.
Actuarial provisionsActuarial liabilities include explicit provisions for adverse deviationsto ensure their adequacy and are independently validated.
Environmental risk
Environmental risk is the risk of loss to financial, operational orreputation value resulting from the impact of environmental issues.Environmental risk arises from our business activities and ouroperations. For example, the environmental issues associated withour clients’ purchase and sale of contaminated property ordevelopment of large-scale projects may give rise to credit andreputation risk. Operational and legal risks may arise from environ-mental issues at our branches, offices or data processing centres.
Corporate Environmental Affairs (CEA) sets enterprise-widepolicy requirements for the identification, assessment, control,monitoring and reporting of environmental risk. Oversight is providedby GE and by the CG&PPC. Business segments and Corporate Supportgroups are responsible for incorporating environmental riskmanagement requirements and controls within their operations. TheCEA Group also provides advisory services and support to businesssegments on the management of specific environmental risks inbusiness transactions.
Risk measurementThe magnitude of environmental risk associated with businessactivities is a function of several factors including: the industry sector,the type and size of the transaction, the ability of the borrower tomanage environmental matters, and whether real property is taken ascollateral. Some environmental risks, such as the potential cost ofcleaning up environmental contamination of properties used assecurity for loans, can be easily quantified while others, includingexposure of a particular industry to the physical effects of climatechange or water scarcity, are assessed on a qualitative basis.
Risk controlWe manage environmental risk by maintaining an environmentalmanagement system, including policy requirements, managementand mitigation strategies, and reporting.
Our Corporate Environmental Policy articulates our overarchingenvironmental commitments. We maintain a suite of environmentalcredit risk management policies including sector-specific andbusiness-segment-specific policies and guidelines. We have aseparate Policy on Social and Environmental Review in ProjectFinance to reflect our commitment to the Equator Principles (EPs).
The key components of environmental risk management andmitigation include:• Monitor relevant environmental laws and regulations, as well as
other requirements to which the bank adheres.• Track loan losses resulting from environment issues.• Train employees to identify and manage environmental risks.• Measure our performance and compare it to our objectives,
enabling us to identify enhancement opportunities.• Periodically verify that our environmental risk management
policies and processes are operating as intended.
Management’s Discussion and Analysis Royal Bank of Canada: Annual Report 2009 55

On an annual basis, and more frequently as required, environmentalrisk management activities, issues, and trends are reported to GE andto the Corporate Governance and Public Policy Committee of theBoard of Directors.
CEA maintains ongoing communication on environmental riskmanagement issues with stakeholders, both internal and external tothe organization. We report on the full extent of environmentalmanagement annually in the Corporate Responsibility Report andPublic Accountability Statement.
Additional risk factors that may affect future results
In addition to the risks described in the Risk, capital and liquiditymanagement, and Overview of other risks sections, there are numerousother risk factors that could cause our results to differ significantly fromour plans, objectives and estimates. Forward-looking statements in thisdocument include, but are not limited to, statements relating to ourmedium-term objectives, our vision and strategic goals, the 2010economic and market outlook for the Canadian, U.S. and globaleconomies, the outlook and priorities for each of our business segmentsand in our Liquidity and funding management section, and are presentedfor the purpose of assisting the holders of our securities and financialanalysts in understanding our financial position and results ofoperations as at and for the periods ended on the dates presented andour vision and strategic goals and objectives, and may not be appro-priate for other purposes. We caution readers not to place unduereliance on these statements as a number of risk factors could causeactual results to differ materially from the expectations expressed insuch forward-looking statements. These factors- many of which arebeyond our control and the effects of which can be difficult to predict-include: credit, market, operational and liquidity and funding risks, andother risks discussed earlier and those discussed below.
General business and economic conditions in Canada, the UnitedStates and other countries in which we conduct businessThe impact from the market environment, the lack of liquidity incertain markets, the level of activity and volatility in capital marketsand the stability of various financial markets could materially impactour financial condition and results of operations. Interest rates,foreign exchange rates, and consumer saving and spending habits aswell as consumer borrowing and repayment patterns, businessinvestment, government spending, and inflation also impact thebusiness and economic environments in which we operate and,ultimately, the level of business activity we conduct and earnings wegenerate in a specific geographic region. For example, many countriesare currently experiencing a recession, resulting in highunemployment and lower family incomes, corporate earnings,business investment and consumer spending, any or all of whichcould adversely affect the demand for our loan and other productsand services. These recessionary factors have resulted in significantincreases in provision for credit losses due to higher credit losses, theamount of which could be significant, resulting in lower earnings.Similarly, a further downturn in a particular equity or debt marketcould cause additional reductions in new issue and investor tradingactivity or assets under management and assets under admin-istration, resulting in lower fee, commission and other revenue.
Changes in accounting standards and accounting policiesand estimatesFrom time to time, the Accounting Standards Board (AcSB) changesthe financial accounting and reporting standards that govern thepreparation of our financial statements. These changes can be difficultto anticipate and can materially impact how we record and report ourfinancial condition and results of operations. In some instances, wemay be required to retroactively apply a new or revised standard thatresults in our restating prior period financial statements.
The accounting policies and methods we utilize determine howwe report our financial condition and results of operations, and theyrequire management to make estimates, including estimates ofprovisions, allowances and valuations, or rely on assumptions aboutmatters that are inherently uncertain. Such estimates and assump-tions may require revisions, and changes to them may materiallyadversely affect our results of operations and financial condition.Significant accounting policies are described in Note 1 to ourConsolidated Financial Statements.
As detailed in the Critical accounting policies and estimatessection, we have identified eight accounting policies as being“critical” to the presentation of our financial condition and results ofoperations as: (i) they require management to make particularlysubjective and/or complex judgments about matters that areinherently uncertain; and (ii) it is likely that materially differentamounts could be reported using different assumptions andestimates.
We are required to adopt IFRS commencing November 1, 2011.The adoption of IFRS could impact: (i) our current accounting policies;and (ii) our capital and capital ratios due to significant recognitionand measurement differences between IFRS and current CanadianGAAP which could in turn materially impact our financial conditionand results of operations.
Government fiscal, monetary and other policiesOur businesses and earnings are affected by the fiscal, monetary orother policies that are adopted by the Bank of Canada and variousother Canadian regulatory authorities, the Board of Governors of theFederal Reserve System in the United States and other U.S.government authorities, as well as those adopted by internationalregulatory authorities and agencies, in jurisdictions in which weoperate. As well, such policies can adversely affect our clients andcounterparties in Canada, the United States and internationally, whichmay increase the risk of default by such clients and counterparties.
Level of competitionThe competition for clients among financial services companies in theconsumer and business markets in which we operate is intense.Client loyalty and retention can be influenced by a number of factors,including relative service levels, the prices and attributes of ourproducts or services, our reputation and actions taken by ourcompetitors. Benefits received by our U.S. and internationalcompetitors under laws and regulations enacted by their governmentsin response to the credit environment may continue to impact ourability to compete. Other financial services companies, such asinsurance companies and non-financial companies, are increasinglyoffering services traditionally provided by banks. Such competitioncould also reduce net interest income, fee revenue and adverselyaffect our earnings.
Changes in laws and regulationsLaws and regulations are in place to protect the financial and otherinterests of our clients, investors and the public interest. Changes tolaws, including tax laws, regulations or regulatory policies, as well asthe changes in how they are interpreted, implemented or enforced,could adversely affect us, for example by lowering barriers to entry inthe businesses in which we operate or increasing our costs ofcompliance. In addition, our failure to comply with applicable laws,regulations or regulatory policies could result in sanctions andfinancial penalties by regulatory agencies that could adversely impactour reputation and earnings.
Judicial or regulatory judgments and legal proceedingsAlthough we take what we believe to be reasonable measuresdesigned to ensure compliance with laws, regulations and regulatorypolicies in the jurisdictions in which we conduct business, there is noassurance that we always will be, or will be deemed to be, incompliance. Accordingly, it is possible that we could receive a judicialor regulatory judgment or decision that results in fines, damages, andother costs or injunctions or loss of licences or registrations thatwould damage our reputation and negatively impact on our earnings.
We are also subject to litigation arising in the ordinary course ofour business. We operate in an increasingly regulated and litigiousenvironment, potentially exposing us to liability and other costs, theamounts of which may be difficult to estimate. The adverse resolutionof any litigation could have a material adverse effect on our results orcould give rise to significant reputational damage, which couldimpact our future business prospects.
Accuracy and completeness of information on clientsand counterpartiesWhen deciding to extend credit or enter into other transactions withclients and counterparties, we may rely on information provided by or
56 Royal Bank of Canada: Annual Report 2009 Management’s Discussion and Analysis

on behalf of clients and counterparties, including audited financialstatements and other financial information. We also may rely onrepresentations of clients and counterparties as to the completenessand accuracy of that information. Our financial results could beadversely impacted if the financial statements and other financialinformation relating to clients and counterparties on which we rely donot comply with GAAP or are materially misleading.
Execution of our strategyOur ability to execute on our objectives and strategic goals willinfluence our financial performance. If we are unable to successfullyimplement selected strategies or related plans and decisions, if wemake inappropriate strategic choices or if we make a change to ourstrategic goals, our financial results could be adversely affected.
Acquisitions and joint venturesAlthough we regularly explore opportunities for strategic acquisitionsof, or joint ventures with, companies in our lines of business, there isno assurance that we will receive required regulatory or shareholderapprovals or be able to complete acquisitions or joint ventures onterms and conditions that satisfy our investment criteria. There is alsono assurance we will achieve our financial or strategic objectives oranticipated cost savings following acquisitions or forming jointventures. Our performance is contingent on successful integration ofacquisitions and joint ventures, and on retaining the clients and keyemployees of acquired companies and joint ventures, and there is noassurance that we will always succeed in doing so.
Development and integration of our distribution networksAlthough we regularly explore opportunities to expand ourdistribution networks, either through acquisitions or organically by
adding, for example, new bank branches, insurance offices, onlinesavings accounts and ATMs in high-growth, receptive markets inCanada, the United States and internationally, if we are not able todevelop or integrate these distribution networks effectively, our resultsof operations and financial condition may be negatively affected.
Other factorsOther factors that may affect actual results include changes ingovernment trade policy, the timely and successful development ofnew products and services, our ability to cross-sell more products tocustomers, technological changes and our reliance on third parties toprovide components of our business infrastructure, the failure of thirdparties to comply with their obligations to us and our affiliates assuch obligations relate to the handling of personal information, fraudby internal or external parties, the possible impact on our businessfrom disease or illness that affects local, national or globaleconomies, disruptions to public infrastructure, including trans-portation, communication, power and water, international conflictsand other political developments including those relating to the waron terrorism, and our success in anticipating and managing theassociated risks.
We caution that the foregoing discussion of risk factors is notexhaustive and other factors could also adversely affect our results. Whenrelying on our forward-looking statements to make decisions with respectto us, investors and others should carefully consider the foregoing factors,other uncertainties and potential events, and other industry- and bank-specific factors that may adversely affect our future results and the marketvaluation placed on our common shares. Unless required by law, we donot undertake to update any forward-looking statement, whether writtenor oral, that may be made from time to time by us or on our behalf.
Additional financial information
Total RBC available-for-sale portfolio
As at October 31, 2009, all AFS securities that had unrealized losseswere assessed for other-than-temporary impairment. For those debtinstruments that, based on management’s judgment, it was notprobable that all principal and interest would be recovered, thesecurities were deemed to be other-than-temporarily impaired andwritten down to their fair value. For equity securities, wheremanagement believes that the fair value will not recover prior to theirdisposition or where there has been unrealized losses for a protracted
period of time, these securities were deemed to be other-than-temporarily impaired and were written down to their fair value.Management has determined that the unrealized losses on theremaining securities were temporary in nature and will continue tohold them until their value recovers, which may be at maturity. Forfurther details regarding the assessment of other-than-temporaryimpairment, refer to Note 3 to our Consolidated Financial Statements.
Total RBC available-for-sale portfolio Table 55
2009 2008
(C$ millions)Amortized
costFair
value
Netunrealized
gains(losses)
Net gains(losses)
recognizedin income
Amortizedcost Fair value
Netunrealized
gains(losses)
Net gains(losses)
recognizedin income
Government and agency $ 22,166 $ 22,622 $ 456 $ (17) $ 24,297 $ 24,386 $ 89 $ 7Mortgage-backed securities 2,057 1,852 (205) (173) 4,280 3,550 (730) (363)Asset-backed securities 4,516 4,427 (89) (45) 5,193 4,796 (397) (25)Corporate debt and other debt 14,718 14,711 (7) (198) 13,301 12,984 (317) (162)Equities 2,437 2,412 (25) (207) 3,057 2,683 (374) (88)Loan substitute 256 186 (70) – 256 227 (29) (1)
Total (1) $ 46,150 $ 46,210 $ 60 $ (640) $ 50,384 $ 48,626 $ (1,758) $ (632)(1) Includes held-to-maturity of $156 million (2008 – $205 million) that is grouped with AFS on the balance sheet.
The total amortized cost of the AFS portfolio was $46.1 billion as atOctober 31, 2009, down $4.2 billion from the prior year. Thereduction largely reflected the impact of the stronger Canadian dollarrelative to the U.S. dollar, as well as the sale of certain U.S. agencyand Government of Canada securities, Canadian bank commonshares and Non agency U.S. mortgage-backed securities (MBS). Thereduction also reflected the reclassification of certain Non-agencyU.S. MBS securities to loans during the year in accordance with theamendments to CICA section 3855. The decrease was partially offsetby the purchase of certificate of deposits issued by Global financialinstitutions (FIs) and U.S. Treasury bills. For further details on the
reclassification, refer to the CICA section 3855 – reclassification ofsecurities to loans section.
We recognized $640 million of net losses in income this year, ofwhich $485 million ($320 million after-tax and compensationadjustments) were market environment-related, see Table 59. Theselosses were largely attributable to Canadian bank common shares,Non-agency U.S. MBS and corporate debt and other debt. Net lossesof $207 million on equities primarily reflected the prolonged declinein value of Canadian bank shares held to economically hedge stock-based compensation programs. The net losses of $198 million oncorporate and other debt largely reflected losses on securities that
Management’s Discussion and Analysis Royal Bank of Canada: Annual Report 2009 57

were deemed to be impaired and that we intend to sell in order toeffectively manage our exposures to certain names and reposition ourportfolios. The $173 million in losses on Non-agency U.S. MBSrelated to losses on securities that we have sold or expect to sell inorder to reduce our exposure to certain vintages and asset classes.The prior year losses of $632 million was largely attributable to $565million of losses due to market environment related factors includingwrite downs on Non-agency U.S. MBS and losses on the sale of U.S.Agency preferred shares of Federal National Mortgage Association(Fannie Mae) and Federal Home Loan Mortgage Corporation (FreddieMac).
As at October 31, 2009, the portfolio had net unrealized gains of$60 million compared to net unrealized losses of $1,758 million ayear ago. This largely reflected an improvement in the values of mostNon-agency and agency U.S. MBS, U.S. auction rate securities (ARS)
and debt related to Global FIs due to the tightening of credit spreadsand lower interest rates.
The net unrealized gains of $456 million on government andagency securities were largely attributable to gains on Canadianinstruments which were partially offset by unrealized losses related toU.S. ARS and U.S. Agency MBS. Net unrealized losses on MBS of $205million were significantly lower than last year, reflecting priceimprovements driven by improved U.S. housing and financialmarkets. The MBS portfolio mainly consists of high quality super-senior tranches of U.S. Alt-A and U.S. prime securities. The remainingnet unrealized losses were largely on asset-backed securities (ABS)and loan substitute securities. The ABS securities are highly ratedwith significant credit support and have experienced significant priceimprovements during the year. The Loan substitute securities arepredominantly perpetual preferred shares of highly rated Canadianentities.
CICA section 3855 – reclassification of securities to loans
During 2009, we reclassified certain AFS and HFT debt securities toloans in accordance with the amendments to CICA section 3855,which permit reclassification of debt securities that are not quoted inactive markets and which management does not intend to sell in theforeseeable future. AFS debt securities held at October 31, 2009 thatare not quoted in active markets have an estimated fair value of $11billion and include certain Auction rate securities, U.S. Non-AgencyMBS, and Government and Corporate Debt. The fair value of securitiesselected for reclassification to loans, primarily U.S. Non-Agency MBS,was $871 million as at October 31, 2009. These securities wereselected for reclassification as they are not quoted in active marketsand had previously incurred significant non credit related losses. Thenet income impact after tax was $64 million net of the provision forcredit losses of $67 million for the year 2009 as per the table belowand Table 59. The remainder of the debt securities that are notquoted in active markets remain in AFS debt securities, and fair valueexceeds book value or we intend to hold until their fair values recoverto book value.
Reclassification of securities to loans –Net income impact
Table 56
2009Increased (decreased)
(C$ millions)International
BankingCorporate
Support Total
Net interest income $ (54) $ (2) $ (56)Non-interest income 180 27 207
Total revenue $ 126 $ 25 $151PCL 59 8 67
Net income before income taxes $ 67 $ 17 $ 84Income taxes 19 1 20
Net income $ 48 $ 16 $ 64
The amendment to CICA section 3855 also requires loans andreceivables that are intended to be sold immediately or in the nearterm be classified as held-for-trading debt. We also reclassified $179million fair value of mortgages held-for-sale from loans to HFT debtsecurities as we intend to sell these mortgages in the near term. Thereclassification had minimal impact on net income.
Refer to Note 1 to our Consolidated Financial Statements forfurther details on the reclassification and transition adjustment madeon November 1, 2008.
Reclassification of securities to loans –Balance sheet impact
Table 57
(C$ millions)
2009Increased
(decreased)
AssetsSecurities $(871)Loans, net of allowance for loan losses 1,132Other assets (79)
$ 182
Liabilities and Shareholders’ equityRetained earnings $ 130Accumulated other comprehensive income 52
$ 182
Reclassification of securities to loans –Credit quality impact
Table 58
2009Increased (decreased)
(C$ millions)
InternationalBanking Consolidated
Credit quality informationGIL $ 998 $ 1,138ACL 121 189
2009
Impact of reclassification
Pre-reclassification
Post-reclassification
Increase(decrease)
GIL (C$ millions) $ 4,319 $ 5,457 $ 1,138ACL 3,113 3,302 189GIL as a % of loans
and acceptances 148 bps 186 bps 38 bpsTotal coverage ratio (1) 72% 61% (11)%Specific PCL as a % of
average net loansand acceptances 95 bps 97 bps 2 bps
(1) Total ACL as a percentage of GIL.
58 Royal Bank of Canada: Annual Report 2009 Management’s Discussion and Analysis

Market environment impacts
The market environment-related losses continued into 2009, at asimilar pace to the end of 2008, though moderating primarily in thelatter half of the year as market conditions improved. Total marketenvironment-related net losses increased $99 million from the prioryear, largely reflecting losses on fair value adjustments on certainRBC debt designated as HFT and losses on credit default swapseconomically hedging the corporate loan portfolio. These factors werepartially offset by lower market environment-related losses on HFTand AFS portfolios and gains on credit valuation adjustments oncertain derivative contracts. These losses reduced revenue in 2009 by$2.1 billion, largely during the first half of the year and werecomprised of losses of $1.4 billion of market environment-relatedlosses on HFT and AFS, and $.7 billion related to changes in creditspreads as noted in Table 59. Net income was reduced in 2009 bylosses of $1.1 billion.
Capital Markets, Corporate Support and International Bankingrevenue was negatively impacted by market environment- relatedlosses of $1,489 million, $607 million and $18 million, respectively,in 2009. PCL increased $67 million as a result of our adoption of theamendments of CICA section 3855. This increase was comprised of$59 million in International Banking and $8 million in CorporateSupport. Capital Markets, Corporate Support and InternationalBanking segment net income was reduced by market environment-related losses of $648 million, $431 million and $61 million in thecurrent year.
Summary of market environment impacts –gains (losses)
Table 59
(C$ millions) 2009 2008 2007
Gains (losses) on impacted portfoliosHeld-for-trading (HFT) (1) $ (889) $ (2,220) $ (393)Available-for-sale (AFS)(2) (485) (565) –
Revenue impacts $ (1,374) $ (2,785) $ (393)Compensation adjustments 317 613 131Income tax recoveries 343 754 89
Total after-tax and related compensationadjustments $ (714) $ (1,418) $ (173)
Gains (losses) related to credit spreadsCredit valuation adjustments on certain
derivatives other than monolines $ 46 $ (118) $ –Fair value adjustments on RBC debt
designated as HFT (586) 533 88Credit default swaps (CDS) (200) 393 –
Revenue impacts $ (740) $ 808 $ 88Compensation adjustments 174 (204) (20)Income tax recoveries 190 (227) (25)
Total after-tax and related compensationadjustments $ (376) $ 377 $ 43
Credit losses related to AFS securitiesreclassified to loansPCL (2) (67) – –Income tax recoveries 17 – –
Total after-tax $ (50) $ – $ –
Total market environment net incomeimpact $ (1,140) $ (1,041) $ (130)
(1) U.S. subprime – CDOs of ABS, RMBS, and other gains of $23 million incurred for theperiod of February 1, 2009 to October 31, 2009 were not included in the table above.Losses of $358 million were incurred during the first quarter of 2009 and are included inthe table above. U.S. commercial mortgage-backed securities (CMBS) and U.S.Municipal guaranteed investment contracts (GIC) and other U.S. MBS have not beenincluded in the above table. If included gains of $23 million would have been reportedfor all of these portfolios for 2009. The gains are not included in the table above asthese gains are no longer considered a result of the market environment, since ourcurrent exposure is not significant.
(2) In accordance with the amendments to CICA section 3855 we reclassified certainimpaired AFS securities not quoted in an active market to loans. As a result theimpairment losses recognized in net income during 2008 on these securities of $229million were reversed as a transitional adjustment on November 1, 2008 and anallowance for credit losses of $139 million was established. For further information referto the CICA section 3855 – reclassification of securities to loans and Total RBCavailable-for-sale portfolio sections.
Held-for-trading losses
We recognized losses of $889 million on HFT instruments during thecurrent year.
We recognized a loss of $420 million during the current yearresulting from an increase in the credit valuation adjustment resultingfrom increases in fair value of credit default swaps (CDS) withmonoline insurer MBIA Inc. that represent credit protection purchasedto hedge our credit risk exposure to super-senior tranches of struc-tured credit transactions, the fair value of the underlying assets andother parameter inputs. The credit protection with MBIA covers bothsubprime- and non-subprime-related assets.
We also incurred losses of $358 million primarily related to atrading portfolio in Capital Markets containing CDOs of corporateCDS. The business was discontinued and a series of risk reductiontrades and assignment of trades to a third party AA-rated financialinstitution was executed.
Our U.S. Insurance and Pension solutions business in CapitalMarkets provides stable value contracts on bank-owned life insurance(BOLI) policies purchased by banks on groups of eligible employees.We no longer originate BOLI policies. As of October 31, 2009, weincurred losses of $111 million for the year, almost all of which wererelated to one contract that is invested in both leveraged andunleveraged strategies. This contract, with a Notional value of $2,024million ($987 million of fair value) at October 31, 2009, wasrestructured to remove the economic consequences of an earlysurrender of the BOLI policy by establishing a fixed maturity date andNotional value. The restructured contract also allows for a reductionof investments in leveraged strategies. The fair value of our estimatedpayment under the restructured contract at maturity is $250 million,which has been recognized as a loss in 2008 and 2009. Theremainder of the BOLI contracts, with $6,276 million Notional value($5,855 million of fair value) are invested in unleveraged strategiesthat are mainly comprised of U.S. Agency MBS and governmentsecurities. Notional value represents the total amount of investmentvalue protected under stable value contracts and is reported understable value products in Note 25 to our Consolidated FinancialStatements. Fair value represents the current estimate of theinvestments referenced under the stable value contracts.
Capital Markets recognized a gain of $46 million in creditvaluation adjustments on certain derivative contracts other thanmonolines, reflecting the change in the fair value of all derivatives thatare attributable to the credit quality of our derivative counterparts.These credit valuation adjustments are calculated using internalmodels, and our methodology considers the impact of both thecounterparty’s and our credit spreads on the present and potentialfuture asset and liability position of the derivative counterparty.Counterparty credit spreads tightened and our net derivative-relatedcredit exposure to our counterparties decreased during the year.
Exposures to selected financial instruments
Exposure to U.S. subprime and Alt-A RMBS, CDOs and mortgagesCertain activities and transactions we enter into expose us to the riskof default of U.S. subprime and Alt-A residential mortgages. Our netexposures to U.S. subprime and Alt-A represent .4% of our totalassets as at October 31, 2009, compared to .5% the prior year.
Of our total holdings of RMBS, holdings with a fair value of $86million, net of MBIA hedging of $249 million, may be exposed to U.S.subprime risk. U.S. subprime RMBS exposures decreased $176million from last year, primarily reflecting our adoption of theamendments to CICA section 3855 as certain U.S. subprime securities
Management’s Discussion and Analysis Royal Bank of Canada: Annual Report 2009 59

were reclassified to loans and the stronger Canadian dollar relative tothe U.S. dollar. Of this potential exposure, over 66% of our relatedholdings are rated A and above, compared to 96% in the prior year.As at October 31, 2009, U.S. subprime RMBS holdings rated AAA, ona net basis comprised 37% of total U.S. subprime RMBS holdings,compared to 48% in 2008. Exposure to U.S. subprime loans was$489 million as at October 31, 2009, representing .07% of totalassets, $196 million higher than last year largely resulting from thereclassification noted above and the stronger Canadian dollar relativeto the U.S. dollar.
Of our total holdings of RMBS, holdings with a fair value of $988million, net of hedging, may be exposed to U.S. Alt-A risk. U.S. Alt-Aexposures decreased $761 million from the prior year mainlyreflecting the reclassification of certain U.S. Alt-A securities to loansand the stronger Canadian dollar relative to the U.S. dollar. Less than50% of these RMBS were issued within 2006 and 2007. Our exposureto U.S. Alt-A loans was $1,287 million as at October 31, 2009,representing .20% of total assets and increased $335 million fromthe prior year, primarily reflecting the reclassification discussedabove and the stronger Canadian dollar relative to the U.S. dollar.
Of our total holdings of CDOs, holdings of $22 million, net ofMBIA hedging of $4 million may be exposed to U.S. subprime or Alt-Arisk, decreased $71 million from 2008. This represents less than 8%of our total net unhedged positions in CDOs in which we had directholdings, which totalled $300 million in 2009. The fair value of ourCorporate CDOs, net of hedging of $278 million as at October 31,2009 and decreased $215 million from 2008 primarily reflecting thesale and losses on certain positions and the stronger Canadian dollarrelative to the U.S. dollar.
Net exposure to U.S. subprime and Alt-A throughRMBS, CDOs and mortgages
Table 60
2009
As at October 31 (C$ millions)Subprime
RMBSAlt-A
RMBS
CDOs thatmay containsubprime or
Alt-A Total
Fair value of securities beforehedging $ 335 $ 988 $ 26 $ 1,349
Fair value of securities net ofhedging by ratingAAA $ 32 $ 116 $ –AA 24 86 –A 1 44 –BBB – 55 –Below BBB- (1) 29 687 22
Total $ 86 $ 988 $ 22 $ 1,096
Fair value of securities net ofhedging by vintage
2003 (or before) $ 19 $ 49 $ –2004 8 97 –2005 54 351 172006 2 323 52007 3 168 –
Total $ 86 $ 988 $ 22 $ 1,096
Amortized cost of subprime/Alt-Amortgages (whole loans) $ 228 $ 837 $ – $ 1,065
Amortized cost of subprime/Alt-ARMBS securities transferred toloans under Section 3855 $ 261 $ 450 $ – $ 711
Total subprime and Alt-Aexposures, net of hedging $ 575 $2,275 $ 22 $ 2,872
Sensitivities of fair value ofsecurities, net of hedging, tochanges in assumptions:
100bp increase in credit spread $ (4) $ (23) $ (1)100bp increase in interest rates – (7) 120% increase in default rates (2) (32) (1)25% decrease in pre-payment
rates (2) (50) (1)
(1) The subprime RMBS exposures rated below BBB- represents our net bought protectionposition.
Off-balance sheet arrangementsFor our off-balance sheet arrangements including multi-sellerconduits, structured investment vehicles and other variable interestentities as at October 31, 2009, refer to the Off-balance sheetarrangements section.
Leveraged financeOur exposure to leveraged finance as at October 31, 2009 wasnominal.
Direct and indirect monoline insuranceIn addition to the monoline insurance previously described, we havedirect and indirect monoline insurance on non-subprime assets. Thetable below shows our direct monoline insurance.
Direct monoline insurance Table 61
As at October 31, 2009
(C$ millions)Principal/
notional Fair value
Financial Security Assurance Holdings Ltd. (FSA) $ 286 $ 26Syncora Holdings Ltd. (Formerly XL Capital Ltd) 259 15AMBAC Financial Group (AMBAC) 108 6
Total $ 653 $ 47
As at October 31, 2009, we held monoline insurance protection of$653 million against default of the issuer or counterparty onnon-subprime trading assets comprising CDOs and CLOs of corporatenames and interest rate swaps. The recorded fair value as atOctober 31, 2009 on these monoline insurance contracts was $47million.
We also have indirect monoline insurance exposure throughassets that we hold and liquidity facilities that we provide. Monolineinsurers provide bond insurance for third-party originated assets thatwe hold, such as U.S. municipal bonds, ARS and GICs, interest rateswaps, public infrastructure bonds and collateralized GICs. In thesecases, we obtain a benefit from the insurance protection. Theprincipal/notional value of these assets as at October 31, 2009 is$1,458 million. The majority of these assets are held in our tradingbook, with changes in fair value reflected in Non-interest income –Trading revenue, and the implied value of the insurance is reflected inthe fair value of the asset. In addition, we provide liquidity facilities of$336 million to certain of our customers in respect of their bondissuance programs where monoline insurance was purchased as partof that program of which $nil was drawn as of October 31, 2009.
Commercial mortgage-backed securities disclosureThe fair value of our total direct holdings of CMBS was $398 millionas at October 31, 2009.
60 Royal Bank of Canada: Annual Report 2009 Management’s Discussion and Analysis
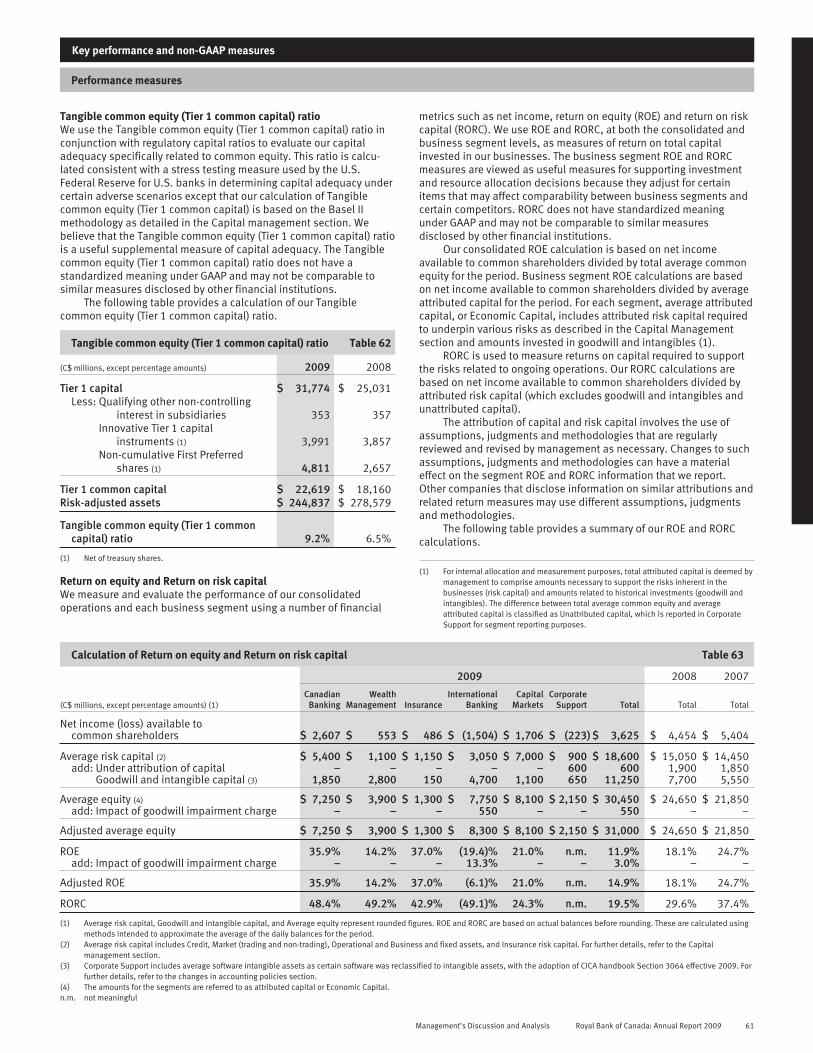
Key performance and non-GAAP measures
Performance measures
Tangible common equity (Tier 1 common capital) ratioWe use the Tangible common equity (Tier 1 common capital) ratio inconjunction with regulatory capital ratios to evaluate our capitaladequacy specifically related to common equity. This ratio is calcu-lated consistent with a stress testing measure used by the U.S.Federal Reserve for U.S. banks in determining capital adequacy undercertain adverse scenarios except that our calculation of Tangiblecommon equity (Tier 1 common capital) is based on the Basel IImethodology as detailed in the Capital management section. Webelieve that the Tangible common equity (Tier 1 common capital) ratiois a useful supplemental measure of capital adequacy. The Tangiblecommon equity (Tier 1 common capital) ratio does not have astandardized meaning under GAAP and may not be comparable tosimilar measures disclosed by other financial institutions.
The following table provides a calculation of our Tangiblecommon equity (Tier 1 common capital) ratio.
Tangible common equity (Tier 1 common capital) ratio Table 62
(C$ millions, except percentage amounts) 2009 2008
Tier 1 capital $ 31,774 $ 25,031Less: Qualifying other non-controlling
interest in subsidiaries 353 357Innovative Tier 1 capital
instruments (1) 3,991 3,857Non-cumulative First Preferred
shares (1) 4,811 2,657
Tier 1 common capital $ 22,619 $ 18,160Risk-adjusted assets $ 244,837 $ 278,579
Tangible common equity (Tier 1 commoncapital) ratio 9.2% 6.5%
(1) Net of treasury shares.
Return on equity and Return on risk capitalWe measure and evaluate the performance of our consolidatedoperations and each business segment using a number of financial
metrics such as net income, return on equity (ROE) and return on riskcapital (RORC). We use ROE and RORC, at both the consolidated andbusiness segment levels, as measures of return on total capitalinvested in our businesses. The business segment ROE and RORCmeasures are viewed as useful measures for supporting investmentand resource allocation decisions because they adjust for certainitems that may affect comparability between business segments andcertain competitors. RORC does not have standardized meaningunder GAAP and may not be comparable to similar measuresdisclosed by other financial institutions.
Our consolidated ROE calculation is based on net incomeavailable to common shareholders divided by total average commonequity for the period. Business segment ROE calculations are basedon net income available to common shareholders divided by averageattributed capital for the period. For each segment, average attributedcapital, or Economic Capital, includes attributed risk capital requiredto underpin various risks as described in the Capital Managementsection and amounts invested in goodwill and intangibles (1).
RORC is used to measure returns on capital required to supportthe risks related to ongoing operations. Our RORC calculations arebased on net income available to common shareholders divided byattributed risk capital (which excludes goodwill and intangibles andunattributed capital).
The attribution of capital and risk capital involves the use ofassumptions, judgments and methodologies that are regularlyreviewed and revised by management as necessary. Changes to suchassumptions, judgments and methodologies can have a materialeffect on the segment ROE and RORC information that we report.Other companies that disclose information on similar attributions andrelated return measures may use different assumptions, judgmentsand methodologies.
The following table provides a summary of our ROE and RORCcalculations.
(1) For internal allocation and measurement purposes, total attributed capital is deemed bymanagement to comprise amounts necessary to support the risks inherent in thebusinesses (risk capital) and amounts related to historical investments (goodwill andintangibles). The difference between total average common equity and averageattributed capital is classified as Unattributed capital, which is reported in CorporateSupport for segment reporting purposes.
Calculation of Return on equity and Return on risk capital Table 63
2009 2008 2007
(C$ millions, except percentage amounts) (1)Canadian
BankingWealth
Management InsuranceInternational
BankingCapital
MarketsCorporate
Support Total Total Total
Net income (loss) available tocommon shareholders $ 2,607 $ 553 $ 486 $ (1,504) $ 1,706 $ (223) $ 3,625 $ 4,454 $ 5,404
Average risk capital (2) $ 5,400 $ 1,100 $ 1,150 $ 3,050 $ 7,000 $ 900 $ 18,600 $ 15,050 $ 14,450add: Under attribution of capital – – – – – 600 600 1,900 1,850
Goodwill and intangible capital (3) 1,850 2,800 150 4,700 1,100 650 11,250 7,700 5,550
Average equity (4) $ 7,250 $ 3,900 $ 1,300 $ 7,750 $ 8,100 $ 2,150 $ 30,450 $ 24,650 $ 21,850add: Impact of goodwill impairment charge – – – 550 – – 550 – –
Adjusted average equity $ 7,250 $ 3,900 $ 1,300 $ 8,300 $ 8,100 $ 2,150 $ 31,000 $ 24,650 $ 21,850
ROE 35.9% 14.2% 37.0% (19.4)% 21.0% n.m. 11.9% 18.1% 24.7%add: Impact of goodwill impairment charge – – – 13.3% – – 3.0% – –
Adjusted ROE 35.9% 14.2% 37.0% (6.1)% 21.0% n.m. 14.9% 18.1% 24.7%
RORC 48.4% 49.2% 42.9% (49.1)% 24.3% n.m. 19.5% 29.6% 37.4%
(1) Average risk capital, Goodwill and intangible capital, and Average equity represent rounded figures. ROE and RORC are based on actual balances before rounding. These are calculated usingmethods intended to approximate the average of the daily balances for the period.
(2) Average risk capital includes Credit, Market (trading and non-trading), Operational and Business and fixed assets, and Insurance risk capital. For further details, refer to the Capitalmanagement section.
(3) Corporate Support includes average software intangible assets as certain software was reclassified to intangible assets, with the adoption of CICA handbook Section 3064 effective 2009. Forfurther details, refer to the changes in accounting policies section.
(4) The amounts for the segments are referred to as attributed capital or Economic Capital.n.m. not meaningful
Management’s Discussion and Analysis Royal Bank of Canada: Annual Report 2009 61

Embedded valueEmbedded value is a measure of shareholder value embedded in thebalance sheet of our Insurance segment, excluding any valueassociated from future new sales. We use the change in embeddedvalue between reporting periods as a measure of the value created bythe insurance operations during the period.
We define embedded value as the value of equity held in ourInsurance segment and the value of in-force business (existingpolicies). The value of in-force business is calculated as the presentvalue of future expected earnings on in-force business less thepresent value of capital required to support in-force business. We usediscount rates that are consistent with other insurance companies.Required capital uses the capital frameworks in the jurisdictions inwhich we operate.
Key drivers affecting the change in embedded value from periodto period are new sales, investment performance, claims andpolicyholder experience, change in actuarial assumptions, changes inforeign exchange rates and changes in shareholder equity arisingfrom transfers in capital.
Embedded value does not have a standardized meaning underGAAP and may not be directly comparable to similar measuresdisclosed by other companies. Given this measure is specifically usedfor our Insurance segment and involves the use of discount rates topresent value the future expected earnings and capital required forthe in-force business, reconciliation to financial statementsinformation is not applicable.
Non-GAAP measures
Adjusted measuresAdjusted measures are adjusted net income, adjusted EPS, adjustedROE and adjusted effective tax rate. We use and report adjustedmeasures consistent with our management framework. We believethat excluding the goodwill impairment charge which we recorded in2009 from these measures is more reflective of ongoing operatingresults and will provide readers with a better understanding ofmanagement’s perspective on our performance. These adjusted
measures should also enhance the comparability of our financialperformance for 2009 to prior years. Adjusted measures arenon-GAAP measures which do not have standardized meanings underGAAP and may not be comparable to similar measures disclosed byother financial institutions.
The following table provides a calculation of our adjustedmeasures.
Adjusted measures Table 64
2009 2008
(C$ millions, except percentage and per share amounts) As reported
Goodwillimpairment
charge Adjusted As reported
Income before income taxes $ 5,526 $ 1,000 $ 6,526 $ 6,005Income taxes 1,568 – 1,568 1,369
Net income before non-controlling interest $ 3,958 $ 1,000 $ 4,958 $ 4,636Non-controlling interest in net income of subsidiaries 100 – 100 81
Net income $ 3,858 $ 1,000 $ 4,858 $ 4,555Preferred dividends (233) – (233) (101)
Net income available to common shareholders $ 3,625 $ 1,000 $ 4,625 $ 4,454
Average number of common shares (thousands) 1,398,675 1,398,675 1,305,706Basic earnings per share (in dollars) $ 2.59 $ .71 $ 3.31 $ 3.41
Average number of diluted common shares (thousands) 1,412,126 1,412,126 1,319,744Diluted earnings per share (in dollars) $ 2.57 $ .71 $ 3.28 $ 3.38
Average common equity $ 30,450 $ 31,000 $ 24,650ROE (1) 11.9% 14.9% 18.1%
Effective tax rate 28.4% 24.0% 22.8%
(1) Based on actual balances before rounding
2009 Defined operating leverageWe use and report defined operating leverage consistent with ourmanagement framework.
Our defined operating leverage refers to the difference betweenour revenue growth rate (as adjusted) and non-interest expensegrowth rate (as adjusted). Revenue is presented on a taxableequivalent basis, while the impact of consolidated VIEs is excludedas they have no material impact on our earnings. Insurance resultsare excluded as certain changes in revenue can be largely offset inInsurance policyholder benefits, claims and acquisition expense,which expense is not captured in our defined operating leveragecalculation. Defined operating leverage does not have a standardizedmeaning under GAAP and is not necessarily comparable with similarinformation reported by other financial institutions.
The following table shows our defined operating leverage ratiocalculation.
2009 Defined operating leverage Table 65
(C$ millions, except percentage amounts) 2009 2008 Change
Total revenue $ 29,106 $ 21,582Add: teb adjustment 366 410Less: Revenue related to variable
interest entities (VIEs) (22) (48)Insurance revenue 5,715 2,610
Total revenue (adjusted) $ 23,779 $ 19,430 22.4%
Non-interest expense $ 14,558 $ 12,351Less: Insurance-related
non-interest expense 559 576
Non-interest expense (adjusted) $ 13,999 $ 11,775 18.9%
Defined operating leverage 3.5%
62 Royal Bank of Canada: Annual Report 2009 Management’s Discussion and Analysis

Accounting and control matters
Critical accounting policies and estimates
Application of critical accounting policies and estimates
Our significant accounting policies are described in Note 1 to our 2009Annual Consolidated Financial Statements. Certain of these policies,as well as estimates made by management in applying such policies,are recognized as critical because they require us to make particularlysubjective or complex judgments about matters that are inherentlyuncertain and because of the likelihood that significantly differentamounts could be reported under different conditions or usingdifferent assumptions. Our critical accounting policies and estimatesrelate to the fair value of financial instruments, other-than-temporaryimpairment of available-for-sale (AFS) and held-to-maturity (HTM)securities, securitization, allowance for credit losses, variable interestentities, goodwill and other intangible assets, pensions and otherpost-employment benefits and income taxes. Our critical accountingpolicies and estimates have been reviewed and approved by our AuditCommittee, in consultation with management, as part of their reviewand approval of our significant accounting policies and estimates.
Financial instruments – recognition and measurement
Fair value of financial instrumentsAll financial instruments are required to be measured at fair value oninitial recognition except for certain related party transactions.Measurement in subsequent periods depends on whether thefinancial instruments have been classified or designated asheld-for-trading (HFT), AFS, HTM, loans and receivables or otherfinancial liabilities. A financial instrument can be designated as HFT(the fair value option (FVO)) on its initial recognition, provided itmeets certain criteria, even if it was not acquired or incurred princi-pally for the purpose of selling or repurchasing in the near term.
Financial assets and financial liabilities HFT, including derivativeinstruments, are measured at fair value with changes in the fairvalues recognized in net income, except for derivatives designated ineffective cash flow hedges or hedges of foreign currency exposure ofa net investment in a self-sustaining foreign operation; the changes inthe fair values of those derivatives are recognized in other compre-hensive income (OCI). AFS financial assets are also measured at fairvalue with unrealized gains and losses, including changes in foreignexchange rates, being recognized in OCI except for investments inequity instruments classified as AFS that do not have a quoted marketprice in an active market, which are measured at cost. Financialassets HTM, loans and receivables, and other financial liabilities aremeasured at amortized cost using the effective interest method.
As at October 31, 2009, approximately $302 billion, or 46%, of ourfinancial assets and $202 billion, or 33%, of our financial liabilities werecarried at fair value ($340 billion, or 47%, of financial assets and $252billion, or 36%, of financial liabilities as at October 31, 2008).
CICA Section 3862, Financial Instruments – Disclosures, estab-lishes a three-level hierarchy for disclosure of financial instrumentsmeasured at fair value, which is essentially the same as the hierarchyunder U.S. GAAP. The classification of assets and liabilities within thehierarchy is based on whether the inputs to the measurementvaluation methodology are observable or unobservable. Observableinputs reflect market-derived or market-based information obtainedfrom independent sources, while unobservable inputs reflect ourestimates about market data. The following three-level fair valuehierarchy is based on the transparency of the inputs used to measurethe fair value of the financial instruments:• Level 1 – inputs are unadjusted quoted prices of identical
instruments in active markets.• Level 2 – inputs other than quoted prices included in Level 1 that
are observable for the asset or liability, either directly orindirectly.
• Level 3 – one or more significant inputs used in a valuationtechnique are unobservable in determining fair values of theinstruments.
Note 2 to our 2009 Annual Consolidated Financial Statements disclosesthe fair values of our financial instruments as at October 31, 2009.
Fair value is defined as the amount at which a financialinstrument could be bought or sold in a current transaction, otherthan in a forced or liquidation sale, between knowledgeable andwilling parties in an arm’s-length transaction under no compulsion toact. The best evidence of fair value is quoted bid or ask price, asappropriate, in an active market. Where bid and ask prices areunavailable, we use the closing price of the most recent transaction ofthat instrument. Where quoted prices are not available for a particularfinancial instrument, we use the quoted price of a financialinstrument with similar characteristics and risk profile or internal orexternal valuation models using observable market-based inputs toestimate the fair value.
The determination of fair value for actively traded financialinstruments that have quoted market prices or readily observablemodel input parameters requires minimal subjectivity. Management’sjudgment is required, however, when the observable market pricesand parameters do not exist. In addition, management exercisesjudgment when establishing market valuation adjustments thatwould be required to determine the fair values. These includevaluation adjustments for liquidity for financial instruments that arenot quoted in an active market, when we believe that the amountrealized on sale may be less than the estimated fair value due toinsufficient liquidity over a short period of time. They also includevaluation adjustments calculated when market prices are notobservable due to insufficient trading volume or a lack of recenttrades in a less active or inactive market.
The majority of our financial instruments classified as HFT, otherthan derivatives and financial assets classified as AFS, comprise orrelate to actively traded debt and equity securities, which are carriedat fair value based on available quoted prices. As few derivatives andfinancial instruments designated as HFT using the FVO are activelyquoted, we rely primarily on internally developed pricing models andestablished industry standard pricing models, such as Black-Schöles,to determine their fair value. In determining the assumptions to beused in our pricing models, we look primarily to external readilyobservable market inputs including factors such as G7 interest-rate-yield curves, currency rates and volatility of certain prices or rates.However, certain derivative financial instruments are valued usingsignificant unobservable market inputs such as default correlations,among others. These inputs are subject to significantly morequantitative analysis and management judgment. Where significantinput parameters are not based on market observable data, we deferthe initial trading profit until the amounts deferred become realizedthrough the receipt and/or payment of cash or once the inputparameters are observable in the market. We also record fair valueadjustments to account for measurement uncertainty due to modelrisk and parameter uncertainty when valuing complex or less activelytraded financial instruments. For further information on our derivativeinstruments, refer to Note 7 to our 2009 Annual ConsolidatedFinancial Statements.
To determine the fair value adjustments on RBC debt designated asHFT, we calculate the present value of the instruments based on thecontractual cash flows over the term of the arrangement by using theRBC effective funding rates at the beginning and end of the period, withthe unrealized change in the present value recorded in net income.
The determination of fair value where quoted prices are notavailable and the identification of appropriate valuation adjustmentsrequire management judgment and are based on quantitative researchand analysis. Group Risk Management is responsible for establishingour valuation methodologies and policies, which address the use andcalculation of valuation adjustments. These methodologies arereviewed on an ongoing basis to ensure that they remain appropriate.Group Risk Management’s oversight in the valuation process alsoincludes ensuring all significant financial valuation models are strictlycontrolled and regularly recalibrated and vetted to provide anindependent perspective. Refer to the Risk, capital and liquiditymanagement section for further details on the sensitivity of financialinstruments used in trading and non-trading activities.
Management’s Discussion and Analysis Royal Bank of Canada: Annual Report 2009 63
Controls over valuations of financial instrumentsAn independent control infrastructure is critical to ensure that ourfinancial instruments fair value measurements are reliable, consistentlydetermined and appropriately valued at market exit price levels. Ourvaluation control infrastructure has senior management oversight and isindependent of business functions that trade or invest in financialinstruments. Valuations are governed by policies and controls, includingindependent price verification, review of daily profit and loss, anddetermination of valuation adjustments for non-readily observablemarket prices or parameters, by staff with appropriate knowledge andexpertise of the instruments and markets in which we transact. Thesepolicies and controls include a review of all new business initiatives toensure minimum standards are met prior to approval.
Other-than-temporary impairment of available-for-sale andheld-to-maturity securitiesAFS and HTM securities with unrealized losses are assessed forimpairment at each reporting date and more frequently whenconditions warrant. When the fair value of any security has declinedbelow its amortized cost, management is required to assess whetherthe decline is other-than-temporary. In making this assessment for AFSsecurities, we consider several factors including: (i) the length of timeand extent to which the fair value has been less than its amortizedcost; (ii) the severity of the impairment; (iii) the cause of theimpairment and the financial condition and near-term prospects of theissuer; and (iv) our intent and ability to hold the investment for aperiod of time sufficient to allow for any anticipated recovery of fairvalue. The decision to record a writedown, its amount and the periodin which it is recorded could change based on management’sjudgment. If the decline in value based on management’s judgment isconsidered to be other-than- temporary, the cumulative changes in thefair values of AFS securities previously recognized in accumulatedother comprehensive income (AOCI) are reclassified to net incomeduring that period. We assess our HTM securities for impairment usingthe same impairment model for Loans. For further details, refer toNotes 1 and 3 to our 2009 Annual Consolidated Financial Statements.
SecuritizationWe periodically securitize Canadian residential mortgages, credit cardreceivables and commercial mortgage loans by selling them tospecial purpose entities (SPEs) or trusts that issue securities toinvestors. Some of the key accounting determinations in asecuritization of our loans are whether the transfer of the loans meetsthe criteria required to be treated as a sale and, if so, the valuation ofour retained interests in the securitized loans. Refer to Note 1 to our2009 Annual Consolidated Financial Statements for a detaileddescription of the accounting policy for loan securitization.
When we securitize loans and retain an interest in the securi-tized loans, it is a matter of judgment whether the loans have beenlegally isolated. We obtain legal opinions where required to give uscomfort that legal isolation of the transferred loans has beenachieved. We often retain interests in securitized loans such asinterest-only strips, servicing rights or cash reserve accounts. Wherequoted market prices are not available, the valuation of retainedinterests in sold assets is based on our best estimate of several keyassumptions such as the payment rate of the transferred loans,weighted average life of the prepayable receivables, excess spread,expected credit losses and discount rate. The fair value of suchretained interests calculated using these assumptions affects thegain or loss that is recognized from the sale of the loans. Refer toNote 5 to our 2009 Annual Consolidated Financial Statements for thevolume of securitization activities of our loans, the gain or lossrecognized on sale and a sensitivity analysis of the key assumptionsused in valuing our retained interests.
Another key accounting determination is whether the SPE that isused to securitize and sell our loans is required to be consolidated.As described in Note 6 to our 2009 Annual Consolidated FinancialStatements, we concluded that none of the SPEs used to securitizeour financial assets should be consolidated.
Allowance for credit lossesThe allowance for credit losses is maintained at levels thatmanagement considers appropriate to cover estimated identified
credit related losses in the portfolio as well as losses that have beenincurred, but are not yet identifiable as at the balance sheet date. Theallowance relates to on-balance sheet exposures, such as loans andacceptances, and off-balance sheet items such as letters of credit,guarantees and unfunded commitments.
The allowance is determined based on management’s identi-fication and evaluation of problem accounts for estimated losses thatexist on the remaining portfolio, and on other factors including thecomposition and credit quality of the portfolio, and changes ineconomic and business conditions. The allowance for credit lossesconsists of specific allowances and the general allowance.
The process for determining the allowances involves quantitativeand qualitative assessments using current and historical creditinformation. Our lending portfolio is reviewed on an ongoing basis toassess whether any borrowers should be classified as impaired andwhether an allowance or write-off is required. The process inherentlyrequires the use of certain assumptions and judgments including:(i) assessing the impaired status and risk ratings of loans;(ii) estimating cash flows and collateral values; (iii) developing defaultand loss rates based on historical and industry data; (iv) adjusting lossrates and risk parameters based on the relevance of historical datagiven changes in credit strategies, processes and policies;(v) assessing the current credit quality of the portfolio based on creditquality trends in relation to impairments, write-offs and recoveries,portfolio characteristics and composition; and (vi) determining thecurrent position in the economic and credit cycles. Changes in theseassumptions or using other reasonable judgments can materiallyaffect the allowance level and thereby our net income.
Specific allowancesSpecific allowances are recorded to recognize estimated losses onboth retail and wholesale loans that have become impaired. Thelosses relating to wholesale borrowers are estimated usingmanagement’s judgment relating to the timing of future cash flowamounts that can be reasonably expected from the borrowers,financially responsible guarantors and the realization of collateral.The amounts expected to be recovered are reduced by estimatedcollection costs and discounted at the effective interest rate of theobligation. The losses relating to retail portfolios are managed on apooled basis and are based on net write-off experience, For creditcards, no specific allowance is maintained as balances are written offwhen a payment is 180 days in arrears. Personal loans are generallywritten off at 150 days past due. Write-offs for other loans aregenerally recorded when there is no realistic prospect of full recovery.
General allowanceA general allowance is established to cover estimated credit lossesincurred in the lending portfolio that have not yet been specificallyidentified as impaired. For wholesale portfolios the determination of thegeneral allowance is based on the application of estimated probability ofdefault, gross exposure at default and loss factors, which are determinedby historical loss experience and delineated by loan type and rating. Forretail portfolios the determination of the general allowance is based onthe application of historical loss rates. In determining the generalallowance level, management also considers the current portfolio creditquality trends, business and economic conditions, the impact of policyand process changes, and other supporting factors.
Total allowance for credit lossesBased on the procedures discussed above, management believesthat the total allowance for credit losses of $3,302 million isadequate to absorb estimated credit losses incurred in the lendingportfolio as at October 31, 2009. This amount includes $114 millionclassified in other liabilities, which relates to letters of credit andguarantees and unfunded commitments.
Variable interest entities
AcG-15 provides guidance on applying the principles of consolidationto certain entities defined as variable interest entities (VIEs). Wherean entity is considered a VIE, the Primary Beneficiary is required toconsolidate the assets, liabilities and results of operations of the VIE.The Primary Beneficiary is the entity that is exposed, through variableinterests, to a majority of the VIE’s expected losses (as defined in
64 Royal Bank of Canada: Annual Report 2009 Management’s Discussion and Analysis

AcG-15) or is entitled to a majority of the VIE’s expected residualreturns (as defined in AcG-15), or both.
We use a variety of complex estimation processes involving bothqualitative and quantitative factors to determine whether an entity isa VIE and, if required, to analyze and calculate the expected lossesand the expected residual returns. These processes involveestimating the future cash flows and performance of the VIE,analyzing the variability in those cash flows, and allocating the cashflows among the identified parties holding variable interests todetermine who is the Primary Beneficiary. In addition, there is asignificant amount of judgment exercised in interpreting the provi-sions of AcG-15 and applying them to our specific transactions.
AcG-15 applies to a variety of our businesses, including ourinvolvement with multi-seller conduits that we administer, creditinvestment products and structured finance transactions. For furtherdetails on our involvement with VIEs, refer to the Off-balance sheetarrangements section and Note 6 to our 2009 Annual ConsolidatedFinancial Statements.
Goodwill and other intangible assets
Under GAAP, goodwill is not amortized and is generally allocated toreporting units which are one level below our operating segments.Goodwill is tested for impairment on an annual basis or morefrequently if an event occurs or circumstances change such that the fairvalue of a reporting unit may be reduced to less than its book value.
Testing goodwill begins with determining the fair value of eachreporting unit and comparing it to its carrying amount, includinggoodwill. If the carrying value of a reporting unit exceeds its fair value,the fair value of the reporting unit’s goodwill must be determined andcompared to its carrying value. The fair value of the goodwill isimputed by determining the fair value of the assets and liabilities ofthe reporting unit. Goodwill is deemed to be impaired if its carryingvalue exceeds the fair value. That excess is the quantum of theimpairment which must be charged to income in the period it isidentified. Subsequent reversals of impairment are prohibited.
Management applies significant judgment in estimating the fairvalue of our reporting units which is accomplished primarily using anearnings-based approach which incorporates each reporting unit’sinternal forecasts of revenues and expenses. The use of this modeland, more generally, our impairment assessment process require theuse of estimates and assumptions, including discount rates, growthrates, and terminal growth rates. Changes in one or more of theestimates or assumptions could have an impact on the determinationof the fair value of our reporting units and thus, the results of theimpairment test. In addition to the earnings-based approach, wherepossible, we use a market-based approach to assess what theappropriate fair value of each reporting unit may be in the currentmarket based on actual market events and comparable companies.
Other intangibles with a finite life are amortized on a straight-linebasis over their estimated useful lives, generally not exceeding 20years. These are also tested for impairment when an event occurs or acondition arises that indicates that the estimated future net cash flowsfrom the asset may be insufficient to recover its carrying amount. Theidentification of such events or conditions may be subject tomanagement’s judgment. Estimating the fair value of a finite-lifeintangible for purposes of determining whether it is impaired alsorequires management to make estimates and assumptions, changes inwhich could have an impact on the determination of the fair value ofthe intangible and thus, the results of the impairment test. We do nothave any intangibles with indefinite lives.
For further details, refer to Notes 1 and 10 to our 2009 AnnualConsolidated Financial Statements.
Pensions and other post-employment benefits
We sponsor a number of defined benefit and defined contributionplans that provide pension and other benefits to eligible employeesafter retirement. These plans include registered pension plans,supplemental pension plans, and health, dental, disability and lifeinsurance plans. The pension plans provide benefits based on yearsof service, contributions and average earnings at retirement.
Due to the long-term nature of these plans, the calculation ofbenefit expenses and obligations depends on various assumptionssuch as discount rates, expected rates of return on assets, healthcarecost trend rates, projected salary increases, retirement age, andmortality and termination rates. Discount rate assumption isdetermined using a yield curve of AA corporate debt securities. Allother assumptions are determined by management and are reviewedannually by the actuaries. Actual experience that differs from theactuarial assumptions will affect the amounts of benefit obligationand expense. The weighted average assumptions used and thesensitivity of key assumptions are presented in Note 20 to our 2009Annual Consolidated Financial Statements.
Income taxes
Management exercises judgment in estimating the provision forincome taxes. We are subject to income tax laws in various juris-dictions where we operate. These complex tax laws are potentiallysubject to different interpretations by us and the relevant taxauthority. The provision for income taxes represents management’sinterpretation of the relevant tax laws and its estimate of current andfuture income tax implications of transactions and events during theperiod. A future income tax asset or liability is determined for eachtemporary difference based on the future tax rates that are expectedto be in effect and management’s assumptions regarding theexpected timing of the reversal of such temporary differences. Wereview both positive and negative evidence in assessing whetherfuture income tax assets are more likely than not to be realized.
Changes in accounting policies
Significant changes in accounting policies and disclosuresduring 2009Canadian GAAPGoodwill and Intangible AssetsOn November 1, 2008, we adopted CICA Handbook Section 3064,Goodwill and Intangible Assets (Section 3064) which provides clarifyingguidance on the criteria that must be satisfied in order for an intangibleasset to be recognized, including internally developed intangible assets.It replaces Section 3062, Goodwill and Other Intangible Assets, andSection 3450, Research and Development Costs.
As a result of adopting Section 3064, we reclassified $789 million ofsoftware from Premises and equipment to Other intangibles on ourConsolidated Balance Sheets as of November 1, 2008 and correspondingdepreciation of $221 million from Non-interest expense – Equipment toNon-interest expense – Amortization of other intangibles on ourConsolidated Statements of Income for the year ended October 31, 2008.
Impairment of Financial AssetsIn August 2009, the CICA issued various amendments to Section3855 including: non-derivative financial assets with fixed or
determinable payments that are not quoted in an active market maybe classified as loans and receivables; loan and receivables for whichwe may not recover substantially all of our initial investment, otherthan because of credit deterioration, must be classified as AFS; andloans and receivables that we intend to sell immediately or in thenear term must be classified as HFT. The amendments also permitcertain financial assets to be reclassified from the HFT and AFScategories into the loans and receivables category. Impairment losseson AFS debt instruments may be reversed under certain circum-stances and impairment for debt instruments classified as loans andreceivables will be assessed using the impairment model for loans.
We adopted these amendments with retrospective application toNovember 1, 2008, as required by the standard. Accordingly, we havereclassified $179 million of HFT and $929 million of AFS securities toloans. The impact on adoption was: (i) an increase of $66 million, netof taxes of $30 million, to our Retained earnings as of November 1,2008, representing an adjustment to the impairment amountcalculated as a result of using the impairment model for loans; and(ii) an increase of $104 million, net of taxes of $57 million, to ourAccumulated other comprehensive income (AOCI) as of November 1,
Management’s Discussion and Analysis Royal Bank of Canada: Annual Report 2009 65

2008, representing the cumulative marked-to-market adjustmentspreviously recorded. Refer to Note 1 to our 2009 Annual ConsolidatedFinancial Statements for additional information.
Fair Value and Liquidity Risk DisclosureIn June 2009, the CICA issued Fair Value and Liquidity Risk Disclosure –Amendments to: Financial Instruments – Disclosures, Section 3862 toimprove fair value and liquidity risk disclosures by requiring all financialinstruments measured at fair value to be categorized into one of threefair value hierarchy levels for disclosure purposes. This hierarchy isessentially the same as the hierarchy under U.S. GAAP (Topic 820). Weadopted these amendments for our fiscal year ended October 31, 2009.
U.S. GAAPFramework on fair value measurementTopic 820, Fair Value Measurements and Disclosures (Topic 820)(FASB Statement No. 157, Fair Value Measurements (FAS 157) andrelated pronouncements) was effective for us on November 1, 2008except for certain non-financial assets and non-financial liabilities forwhich the amendments will be effective on November 1, 2009. Topic820 requires that all financial instruments measured at fair value becategorized into the fair value hierarchy levels and measured basedon the guidance for those levels.
Fair value option for financial assets and liabilitiesFinancial Accounting Standards Board (FASB) guidance under Topic825-10, Financial Instruments (Topic 825-10) (Statement No. 159The Fair Value Option for Financial Assets and Liabilities (FAS 159))provides an entity the option to report selected financial assets andliabilities at fair value and establishes new disclosure requirementsfor assets and liabilities to which the fair value option is applied. Weadopted this guidance on November 1, 2008. The impact on adoptionwas an increase to opening retained earnings of $81 million aftertaxes, representing the difference between the carrying amount andthe fair value of the eligible items for which the fair value option waselected as at November 1, 2008.
Other-than-temporary impairment of securitiesGuidance under Topic 320, Investments – Debt and Equity Securities(FSP FAS 115-2 and FAS 124-2 Recognition and Presentation of Other-than-Temporary Impairments) became effective for us on May 1,2009. It amends the impairment assessment guidance and recog-nition principles of other-than-temporary impairment for debtsecurities and enhances the presentation and disclosure require-ments for debt as well as equity securities. The impact on adoptionwas an increase in retained earnings of $225 million and a corre-sponding decrease to AOCI.
Offsetting of amounts related to certain contractsWe adopted FASB guidance (Staff Position FIN 39-1, Amendment ofFASB Interpretation No. 39) which amends certain aspects of Topic210-20, Balance Sheet – Offsetting and Topic 815 (FIN 39, Offsettingof Amounts Related to Certain Contracts) on November 1, 2008. Thisguidance permits the fair value of derivative instruments and the rightto reclaim cash collateral (a receivable) or the obligation to returncash collateral (a payable) to be offset against the fair value ofderivative instruments executed with the same counterparty underthe same master netting agreement, regardless of whether there is anintention to settle on a net basis. We have offset fair value amountson our U.S. GAAP Consolidated Balance Sheets pursuant to thisguidance, including the comparative periods presented, as follows:as at October 31, 2009, the fair value amounts of derivativeinstruments that we netted against derivative assets and derivativeliabilities was $62.9 billion (October 31, 2008 – $76.2 billion); as atOctober 31, 2009, and the cash collateral applied against derivativeassets and derivative liabilities was $7.9 billion and $3.5 billion,respectively (October 31, 2008 – $5.0 billion and $7.5 billion,respectively). Refer to Note 31 to our 2009 Annual ConsolidatedFinancial Statements for additional information.
Accounting adjustmentsDuring the first quarter of 2009, we corrected certain errors pertainingto prior periods which are described in Note 1 to our 2009 Annual
Consolidated Financial Statements. These errors were not material tothe periods to which they relate; however, as correcting the errors inthe first quarter of 2009 would have materially distorted net incomefor the quarter, we corrected them by decreasing opening retainedearnings for the quarter ended January 31, 2007 by $120 million.
Future changes in accounting policies and disclosureCanadian GAAPBusiness combinationsIn January 2009, the CICA issued three new accounting standards:Handbook Section 1582, Business Combinations, Section 1601,Consolidated Financial Statements and Section 1602, Non-controllinginterests. Section 1582 provides clarification as to what an acquirermust measure when it obtains control of a business, the basis ofvaluation and the date at which valuation should be determined.Acquisition-related costs must be accounted for as expenses in theperiods they are incurred, except for costs incurred to issue debt orshare capital. This new standard will be applicable for acquisitions wecomplete on or after November 1, 2011 although adoption in 2010 ispermitted to facilitate the transition to IFRS in 2011.
Section 1601 establishes standards for preparing consolidatedfinancial statements after the acquisition date; Section 1602establishes standards for the accounting and presentation ofnon-controlling interest. These two standards must be adoptedconcurrently with Section 1582.
U.S. GAAPBusiness combinationsIn December 2007, the FASB issued guidance under Topic 805,Business Combinations (Statement No. 141 (revised 2007), BusinessCombinations), which replaces previous guidance under Topic 805(Statement No. 141, Business Combinations). The new guidance,which will be effective for us on November 1, 2009, includes thefollowing requirements: more assets acquired and liabilities assumedmust be measured at fair value at the acquisition date, liabilitiesrelated to contingent consideration must be remeasured at fair valueand each subsequent reporting period, and all acquisition relatedcosts must be expensed.
Amendments to Guidance on Accounting for Transfers of FinancialAssetsIn June 2009, the FASB issued Statement No. 166, Accounting forTransfers of Financial Assets – an amendment of FASB Statement No.140 (FAS 166), which will be effective for us on November 1, 2010.FAS 166 eliminates the exception for qualifying special purposeentities from consolidation guidance. It also eliminates the exceptionthat permitted sale accounting for certain mortgage securitizationswhen control has not been completely surrendered by the transferor.
Amendments to Consolidation GuidanceIn June 2009, the FASB issued Statement No. 167, Amendments toFASB Interpretation No. 46(R) (FAS167) which will be effective for uson November 1, 2010. FAS167 modifies the characteristics thatidentify a variable interest entity, provides new criteria fordetermining the primary beneficiary and increases the frequency ofrequired assessments to determine whether an entity is the primarybeneficiary of a variable interest entity.
Future adoption of International Financial Reporting StandardsPursuant to the decision made by the CICA, we will begin reporting ourfinancial statements in accordance with IFRS on November 1, 2011,including 2010 comparative results. To manage our transition to IFRS,we have implemented a comprehensive enterprise-wide program thatfocuses on the key areas of impact including financial reporting,systems and processes, as well as communications and training.
In 2008, we completed a thorough organization diagnostic toassess the scope and complexity of the IFRS conversion to us whichidentified the areas with significant differences between IFRS andexisting Canadian GAAP. Generally, the areas that are expected tohave the greatest financial and capital impacts on us include balancesheet de-recognition and consolidation, business combinations, andcumulative foreign exchange translation differences.
66 Royal Bank of Canada: Annual Report 2009 Management’s Discussion and Analysis
However, as IFRS evolves, we continue to monitor and frequentlyrevisit our preliminary conclusions to determine further financial,capital and business implications.
Throughout 2009, we continued to manage the transition to IFRSthrough the completion of activities and deliverables to support thekey areas of impact noted above. To date, we have:• Conducted preliminary assessments of the various accounting
policy elections for first-time IFRS adoption;• Initiated multiple projects within a program framework which are
in progress conducting more thorough GAAP analysis, assessingfinancial and economic impacts, and identifying process andsystems requirements to ensure a successful transition;
• Established frequent and recurring communications with theBoard of Directors, Audit Committee, executive and seniormanagement to ensure timely decisions on key issues and risks;
• Provided frequent updates to our internal and external auditorsand OSFI on key elements of program status, program structureand preliminary assessment of accounting impacts;
• Developed a resourcing model to ensure sufficient programresources are available to meet key deliverables;
• Identified preliminary external communication requirements forthe investor and analyst community; and
• Conducted internal education seminars for key stakeholdersacross RBC in the various business platforms and functionalgroups.As we prepare for our transition, we continue to monitor ongoing
changes to IFRS and adjust our transition and implementation plansaccordingly. Our transition remains aligned to our implementationschedule and we are on track to meet the timelines essential to ourchangeover.
For additional information regarding changes to our current and futureaccounting policies, refer to Notes 1 and 31 to our 2009 AnnualConsolidated Financial Statements.
Pension obligations
Through a number of defined benefit and defined contribution planswe provide pension and post-employment benefits to eligibleemployees. Our defined benefit pension plans provide benefits basedon years of service, contributions and average earnings at retirement.Our other post-employment benefits include health, dental, disabilityand life insurance coverage.
We fund our registered defined benefit pension plans inaccordance with actuarially determined amounts required to satisfyemployee benefit obligations under current pension regulations. Wecontinue to fund our pension plans in accordance with federal andprovincial regulations.
We measured our benefit obligations and pension plan assets asat September 30, 2009. During 2009, corporate bond yields, whichimpact the selection of a discount rate we use to measure our benefit
obligations and pension plan assets, have decreased in the short andmid ranges of the curve as a result of improving market conditions.This has resulted in an actuarial loss of $389 million in our benefitobligation, which offsets our pension plan asset gains of $272 millionand increased our overall pension liability. Gains and losses on ourpension plan assets are amortized over the estimated averageremaining service life of the plan, which decreases the volatility to ourexpenses recognized every year. The strengthening of the Canadiandollar at year-end resulted in a decrease of our pension liability forour U.S. and international plans. Based on our recent fundingvaluation at January 1, 2009, we were required to make plancontributions of $610 million during the year. For further information,refer to Note 20 to our 2009 Annual Consolidated FinancialStatements.
Controls and procedures
Disclosure controls and proceduresOur disclosure controls and procedures are designed to providereasonable assurance that information required to be disclosed by usin reports filed or submitted under Canadian and U.S. securities lawsis recorded, processed, summarized and reported within the timeperiods specified under those laws and include controls andprocedures that are designed to ensure that information is accumu-lated and communicated to management, including the President andChief Executive Officer, and the Chief Administrative Officer and ChiefFinancial Officer, to allow timely decisions regarding requireddisclosure.
As of October 31, 2009, management evaluated, under thesupervision of and with the participation of the President and ChiefExecutive Officer and the Chief Administrative Officer and ChiefFinancial Officer, the effectiveness of our disclosure controls andprocedures as defined under rules adopted by the Canadiansecurities regulatory authorities and the United States Securities andExchange Commission. Based on that evaluation, the President andChief Executive Officer and the Chief Administrative Officer and ChiefFinancial Officer concluded that our disclosure controls andprocedures were effective as of October 31, 2009.
Internal control over financial reportingManagement is responsible for establishing and maintainingadequate internal control over financial reporting. Internal control
over financial reporting is designed to provide reasonable assuranceregarding the reliability of financial reporting and the preparation offinancial statements for external purposes in accordance with GAAP.However, because of its inherent limitations, internal control overfinancial reporting may not prevent or detect misstatements on atimely basis.
Management evaluated, under the supervision of and with theparticipation of the President and Chief Executive Officer and theChief Administrative Officer and Chief Financial Officer, theeffectiveness of our internal control over financial reporting based onthe criteria set forth in the Internal Control – Integrated Frameworkissued by the Committee of Sponsoring Organizations of theTreadway Commission and, based on that evaluation, concluded thatour internal control over financial reporting was effective as ofOctober 31, 2009 and that there were no material weaknesses thathave been identified in our internal control over financial reporting asof October 31, 2009. See Management’s Report on Internal Controlover Financial Reporting and the Report of Independent RegisteredChartered Accountants.
No changes were made in our internal control over financialreporting during the year ended October 31, 2009, that havematerially affected, or are reasonably likely to materially affect, ourinternal control over financial reporting.
Related party transactions
In the ordinary course of business, we provide normal bankingservices, operational services, and enter into other transactions withassociated and other related corporations, including our joint ventureentities, on terms similar to those offered to non-related parties.
We grant loans to directors, officers and other employees at ratesnormally accorded to preferred clients. In addition, we offer deferredshare and other plans to non-employee directors, executives andcertain other key employees. For further information, refer to Notes 9and 27 to our Consolidated Financial Statements.
Management’s Discussion and Analysis Royal Bank of Canada: Annual Report 2009 67

Supplemental information
Net interest income on average assets and liabilities Table 66
Average balances Interest (1) Average rate
(C$ millions, except percentage amounts) 2009 2008 2007 2009 2008 2007 2009 2008 2007
AssetsDeposits with other banks
Canada $ 2,692 $ 1,837 $ 1,570 $ 37 $ 45 $ 43 1.37% 2.45% 2.74%United States 4,674 4,168 2,904 11 137 176 .24 3.29 6.06Other International 3,976 7,802 5,436 114 316 319 2.87 4.05 5.87
11,342 13,807 9,910 162 498 538 1.43 3.61 5.43
SecuritiesTrading 136,963 149,098 162,828 4,041 4,862 6,621 2.95 3.26 4.07Available-for-sale 50,686 39,626 31,516 1,905 1,800 1,044 3.76 4.54 3.31
187,649 188,724 194,344 5,946 6,662 7,665 3.17 3.53 3.94
Asset purchased under reverse repurchaseagreements and securities borrowed 44,476 68,356 71,759 931 2,889 3,620 2.09 4.23 5.04
LoansCanada
Retail 185,318 170,300 152,588 8,625 7,440 9,376 4.65 4.37 6.14Wholesale 35,074 38,558 31,541 1,179 2,443 1,047 3.36 6.34 3.32
220,392 208,858 184,129 9,804 9,883 10,423 4.45 4.73 5.66
United States 42,227 35,096 25,718 1,777 2,161 2,240 4.21 6.16 8.71Other International 17,559 15,623 13,388 1,923 2,939 2,061 10.95 18.81 15.39
280,178 259,577 223,235 13,504 14,983 14,724 4.82 5.77 6.60
Total interest-earning assets 523,645 530,464 499,248 20,543 25,032 26,547 3.92 4.72 5.32Non-interest-bearing deposits with other banks 5,895 3,702 2,137 – – – – – –Customers’ liability under acceptances 10,247 11,274 10,270 – – – – – –Other assets 155,513 104,860 69,345 – – – – – –
Total assets $ 695,300 $ 650,300 $ 581,000 $ 20,543 $ 25,032 $ 26,547 2.95% 3.85% 4.57%
Liabilities and shareholders’ equityDeposits (2)
Canada $ 183,563 $ 174,441 $ 166,983 $ 2,946 $ 4,423 $ 5,669 1.60% 2.54% 3.39%United States 61,990 56,329 53,817 778 1,758 2,563 1.26 3.12 4.76Other International 147,441 163,487 121,924 3,038 5,977 5,538 2.06 3.66 4.54
392,994 394,257 342,724 6,762 12,158 13,770 1.72 3.08 4.02
Obligations related to securities sold short 37,597 45,367 46,654 1,286 1,525 1,997 3.42 3.36 4.28Obligations related to assets sold under
repurchase agreements and securities loaned 36,647 36,558 42,503 409 1,613 2,364 1.12 4.41 5.56Subordinated debentures 7,377 7,183 6,704 350 354 338 4.74 4.93 5.04Other interest-bearing liabilities 3,943 3,962 3,569 230 334 376 5.83 8.43 10.54
Total interest-bearing liabilities 478,558 487,327 442,154 9,037 15,984 18,845 1.89 3.28 4.26Non-interest-bearing deposits 28,964 16,784 25,752 – – – – – –Acceptances 10,247 11,274 10,270 – – – – – –Other liabilities 142,964 108,116 79,087 – – – – – –
Total liabilities $ 660,733 $ 623,501 $ 557,263 $ 9,037 $ 15,984 $ 18,845 1.37% 2.56% 3.38%
Shareholders’ EquityPreferred 4,130 1,795 1,553 – – – – – –Common 30,437 25,004 22,184 – – – – – –
Total liabilities and shareholders’ equity $ 695,300 $ 650,300 $ 581,000 $ 9,037 $ 15,984 $ 18,845 1.30% 2.46% 3.24%
Net interest income and margin $ 695,300 $ 650,300 $ 581,000 $ 11,506 $ 9,048 $ 7,702 1.65% 1.39% 1.33%
Net interest income and margin (average earningassets)Canada $ 311,715 $ 308,574 $ 280,385 $ 7,828 $ 6,929 $ 6,402 2.51% 2.25% 2.28%United States 107,131 108,733 106,044 2,134 1,132 412 1.99 1.04 .39Other International 104,799 113,157 112,819 1,544 987 888 1.47 .87 .79
Total $ 523,645 $ 530,464 $ 499,248 $ 11,506 $ 9,048 $ 7,702 2.20% 1.71% 1.54%
(1) Interest income includes loan fees of $398 million (2008 – $343 million; 2007 – $331 million).(2) Deposits include savings deposits with average balances of $64 billion (2008 – $48 billion; 2007 – $46 billion), interest expense of $.3 billion (2008 – $.5 billion; 2007 – $.4 billion) and
average rates of .5% (2008 – 1.0%; 2007 – .9%). Deposits also include term deposits with average balances of $193 billion (2008 – $227 billion; 2007 – $240 billion), interest expense of$3.8 billion (2008 – $8.0 billion; 2007 – $10.7 billion) and average rates of 1.98% (2008 – 3.50%; 2007 – 4.43%).
68 Royal Bank of Canada: Annual Report 2009 Management’s Discussion and Analysis
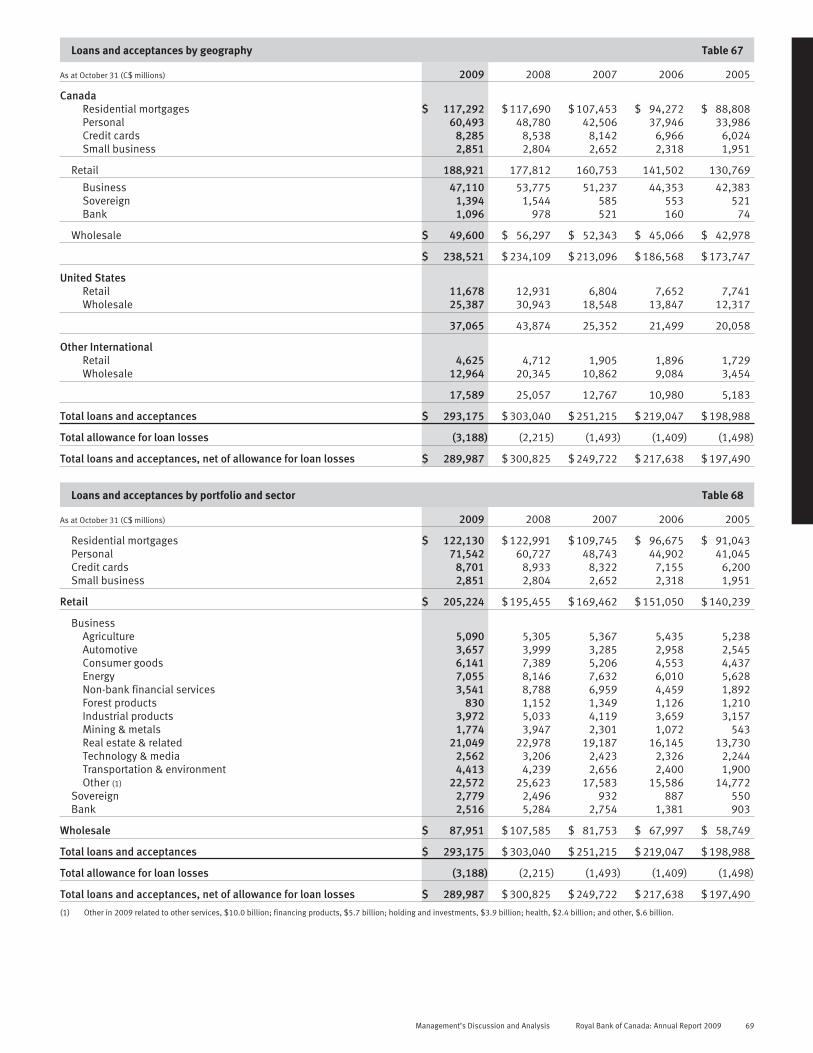
Loans and acceptances by geography Table 67
As at October 31 (C$ millions) 2009 2008 2007 2006 2005
CanadaResidential mortgages $ 117,292 $ 117,690 $ 107,453 $ 94,272 $ 88,808Personal 60,493 48,780 42,506 37,946 33,986Credit cards 8,285 8,538 8,142 6,966 6,024Small business 2,851 2,804 2,652 2,318 1,951
Retail 188,921 177,812 160,753 141,502 130,769
Business 47,110 53,775 51,237 44,353 42,383Sovereign 1,394 1,544 585 553 521Bank 1,096 978 521 160 74
Wholesale $ 49,600 $ 56,297 $ 52,343 $ 45,066 $ 42,978
$ 238,521 $ 234,109 $ 213,096 $ 186,568 $ 173,747
United StatesRetail 11,678 12,931 6,804 7,652 7,741Wholesale 25,387 30,943 18,548 13,847 12,317
37,065 43,874 25,352 21,499 20,058
Other InternationalRetail 4,625 4,712 1,905 1,896 1,729Wholesale 12,964 20,345 10,862 9,084 3,454
17,589 25,057 12,767 10,980 5,183
Total loans and acceptances $ 293,175 $ 303,040 $ 251,215 $ 219,047 $ 198,988
Total allowance for loan losses (3,188) (2,215) (1,493) (1,409) (1,498)
Total loans and acceptances, net of allowance for loan losses $ 289,987 $ 300,825 $ 249,722 $ 217,638 $ 197,490
Loans and acceptances by portfolio and sector Table 68
As at October 31 (C$ millions) 2009 2008 2007 2006 2005
Residential mortgages $ 122,130 $ 122,991 $ 109,745 $ 96,675 $ 91,043Personal 71,542 60,727 48,743 44,902 41,045Credit cards 8,701 8,933 8,322 7,155 6,200Small business 2,851 2,804 2,652 2,318 1,951
Retail $ 205,224 $ 195,455 $ 169,462 $ 151,050 $ 140,239
BusinessAgriculture 5,090 5,305 5,367 5,435 5,238Automotive 3,657 3,999 3,285 2,958 2,545Consumer goods 6,141 7,389 5,206 4,553 4,437Energy 7,055 8,146 7,632 6,010 5,628Non-bank financial services 3,541 8,788 6,959 4,459 1,892Forest products 830 1,152 1,349 1,126 1,210Industrial products 3,972 5,033 4,119 3,659 3,157Mining & metals 1,774 3,947 2,301 1,072 543Real estate & related 21,049 22,978 19,187 16,145 13,730Technology & media 2,562 3,206 2,423 2,326 2,244Transportation & environment 4,413 4,239 2,656 2,400 1,900Other (1) 22,572 25,623 17,583 15,586 14,772
Sovereign 2,779 2,496 932 887 550Bank 2,516 5,284 2,754 1,381 903
Wholesale $ 87,951 $ 107,585 $ 81,753 $ 67,997 $ 58,749
Total loans and acceptances $ 293,175 $ 303,040 $ 251,215 $ 219,047 $ 198,988
Total allowance for loan losses (3,188) (2,215) (1,493) (1,409) (1,498)
Total loans and acceptances, net of allowance for loan losses $ 289,987 $ 300,825 $ 249,722 $ 217,638 $ 197,490
(1) Other in 2009 related to other services, $10.0 billion; financing products, $5.7 billion; holding and investments, $3.9 billion; health, $2.4 billion; and other, $.6 billion.
Management’s Discussion and Analysis Royal Bank of Canada: Annual Report 2009 69
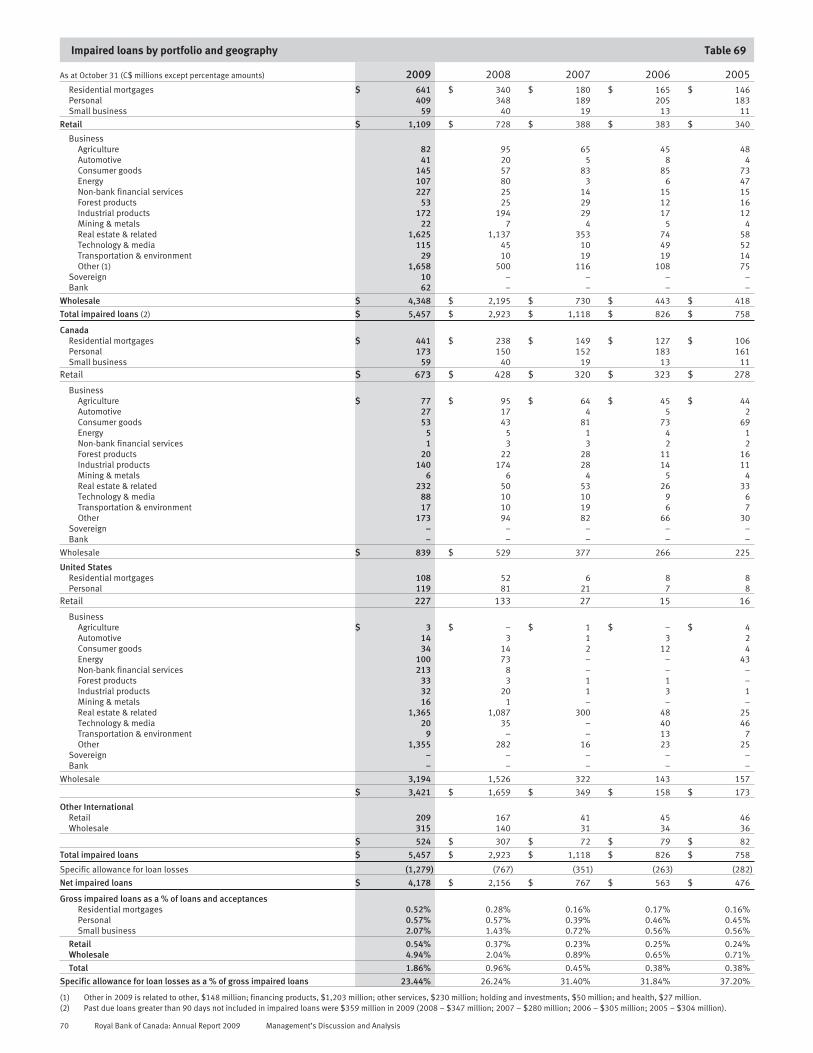
Impaired loans by portfolio and geography Table 69
As at October 31 (C$ millions except percentage amounts) 2009 2008 2007 2006 2005Residential mortgages $ 641 $ 340 $ 180 $ 165 $ 146Personal 409 348 189 205 183Small business 59 40 19 13 11
Retail $ 1,109 $ 728 $ 388 $ 383 $ 340
BusinessAgriculture 82 95 65 45 48Automotive 41 20 5 8 4Consumer goods 145 57 83 85 73Energy 107 80 3 6 47Non-bank financial services 227 25 14 15 15Forest products 53 25 29 12 16Industrial products 172 194 29 17 12Mining & metals 22 7 4 5 4Real estate & related 1,625 1,137 353 74 58Technology & media 115 45 10 49 52Transportation & environment 29 10 19 19 14Other (1) 1,658 500 116 108 75
Sovereign 10 – – – –Bank 62 – – – –
Wholesale $ 4,348 $ 2,195 $ 730 $ 443 $ 418
Total impaired loans (2) $ 5,457 $ 2,923 $ 1,118 $ 826 $ 758
CanadaResidential mortgages $ 441 $ 238 $ 149 $ 127 $ 106Personal 173 150 152 183 161Small business 59 40 19 13 11
Retail $ 673 $ 428 $ 320 $ 323 $ 278
BusinessAgriculture $ 77 $ 95 $ 64 $ 45 $ 44Automotive 27 17 4 5 2Consumer goods 53 43 81 73 69Energy 5 5 1 4 1Non-bank financial services 1 3 3 2 2Forest products 20 22 28 11 16Industrial products 140 174 28 14 11Mining & metals 6 6 4 5 4Real estate & related 232 50 53 26 33Technology & media 88 10 10 9 6Transportation & environment 17 10 19 6 7Other 173 94 82 66 30
Sovereign – – – – –Bank – – – – –
Wholesale $ 839 $ 529 377 266 225
United StatesResidential mortgages 108 52 6 8 8Personal 119 81 21 7 8
Retail 227 133 27 15 16
BusinessAgriculture $ 3 $ – $ 1 $ – $ 4Automotive 14 3 1 3 2Consumer goods 34 14 2 12 4Energy 100 73 – – 43Non-bank financial services 213 8 – – –Forest products 33 3 1 1 –Industrial products 32 20 1 3 1Mining & metals 16 1 – – –Real estate & related 1,365 1,087 300 48 25Technology & media 20 35 – 40 46Transportation & environment 9 – – 13 7Other 1,355 282 16 23 25
Sovereign – – – – –Bank – – – – –
Wholesale 3,194 1,526 322 143 157
$ 3,421 $ 1,659 $ 349 $ 158 $ 173
Other InternationalRetail 209 167 41 45 46Wholesale 315 140 31 34 36
$ 524 $ 307 $ 72 $ 79 $ 82
Total impaired loans $ 5,457 $ 2,923 $ 1,118 $ 826 $ 758
Specific allowance for loan losses (1,279) (767) (351) (263) (282)
Net impaired loans $ 4,178 $ 2,156 $ 767 $ 563 $ 476
Gross impaired loans as a % of loans and acceptancesResidential mortgages 0.52% 0.28% 0.16% 0.17% 0.16%Personal 0.57% 0.57% 0.39% 0.46% 0.45%Small business 2.07% 1.43% 0.72% 0.56% 0.56%
Retail 0.54% 0.37% 0.23% 0.25% 0.24%Wholesale 4.94% 2.04% 0.89% 0.65% 0.71%
Total 1.86% 0.96% 0.45% 0.38% 0.38%
Specific allowance for loan losses as a % of gross impaired loans 23.44% 26.24% 31.40% 31.84% 37.20%
(1) Other in 2009 is related to other, $148 million; financing products, $1,203 million; other services, $230 million; holding and investments, $50 million; and health, $27 million.(2) Past due loans greater than 90 days not included in impaired loans were $359 million in 2009 (2008 – $347 million; 2007 – $280 million; 2006 – $305 million; 2005 – $304 million).
70 Royal Bank of Canada: Annual Report 2009 Management’s Discussion and Analysis
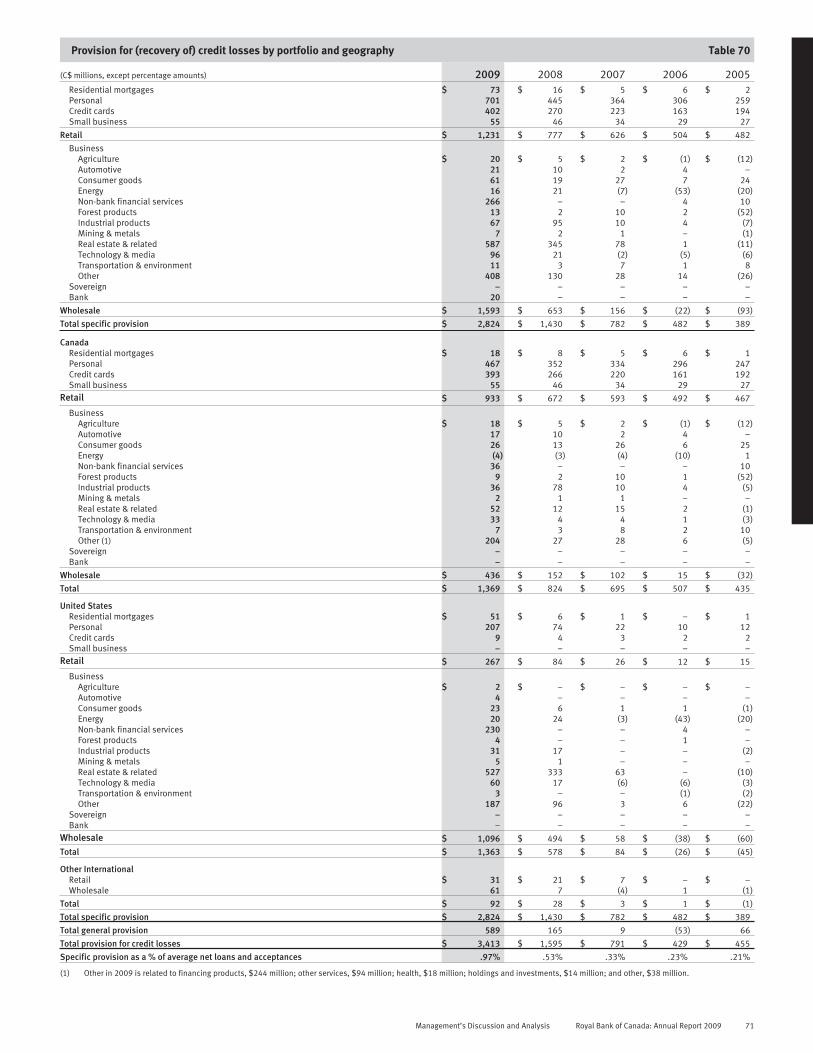
Provision for (recovery of) credit losses by portfolio and geography Table 70
(C$ millions, except percentage amounts) 2009 2008 2007 2006 2005Residential mortgages $ 73 $ 16 $ 5 $ 6 $ 2Personal 701 445 364 306 259Credit cards 402 270 223 163 194Small business 55 46 34 29 27
Retail $ 1,231 $ 777 $ 626 $ 504 $ 482
BusinessAgriculture $ 20 $ 5 $ 2 $ (1) $ (12)Automotive 21 10 2 4 –Consumer goods 61 19 27 7 24Energy 16 21 (7) (53) (20)Non-bank financial services 266 – – 4 10Forest products 13 2 10 2 (52)Industrial products 67 95 10 4 (7)Mining & metals 7 2 1 – (1)Real estate & related 587 345 78 1 (11)Technology & media 96 21 (2) (5) (6)Transportation & environment 11 3 7 1 8Other 408 130 28 14 (26)
Sovereign – – – – –Bank 20 – – – –
Wholesale $ 1,593 $ 653 $ 156 $ (22) $ (93)
Total specific provision $ 2,824 $ 1,430 $ 782 $ 482 $ 389
CanadaResidential mortgages $ 18 $ 8 $ 5 $ 6 $ 1Personal 467 352 334 296 247Credit cards 393 266 220 161 192Small business 55 46 34 29 27
Retail $ 933 $ 672 $ 593 $ 492 $ 467
BusinessAgriculture $ 18 $ 5 $ 2 $ (1) $ (12)Automotive 17 10 2 4 –Consumer goods 26 13 26 6 25Energy (4) (3) (4) (10) 1Non-bank financial services 36 – – – 10Forest products 9 2 10 1 (52)Industrial products 36 78 10 4 (5)Mining & metals 2 1 1 – –Real estate & related 52 12 15 2 (1)Technology & media 33 4 4 1 (3)Transportation & environment 7 3 8 2 10Other (1) 204 27 28 6 (5)
Sovereign – – – – –Bank – – – – –
Wholesale $ 436 $ 152 $ 102 $ 15 $ (32)
Total $ 1,369 $ 824 $ 695 $ 507 $ 435
United StatesResidential mortgages $ 51 $ 6 $ 1 $ – $ 1Personal 207 74 22 10 12Credit cards 9 4 3 2 2Small business – – – – –
Retail $ 267 $ 84 $ 26 $ 12 $ 15
BusinessAgriculture $ 2 $ – $ – $ – $ –Automotive 4 – – – –Consumer goods 23 6 1 1 (1)Energy 20 24 (3) (43) (20)Non-bank financial services 230 – – 4 –Forest products 4 – – 1 –Industrial products 31 17 – – (2)Mining & metals 5 1 – – –Real estate & related 527 333 63 – (10)Technology & media 60 17 (6) (6) (3)Transportation & environment 3 – – (1) (2)Other 187 96 3 6 (22)
Sovereign – – – – –Bank – – – – –
Wholesale $ 1,096 $ 494 $ 58 $ (38) $ (60)
Total $ 1,363 $ 578 $ 84 $ (26) $ (45)
Other InternationalRetail $ 31 $ 21 $ 7 $ – $ –Wholesale 61 7 (4) 1 (1)
Total $ 92 $ 28 $ 3 $ 1 $ (1)
Total specific provision $ 2,824 $ 1,430 $ 782 $ 482 $ 389
Total general provision 589 165 9 (53) 66
Total provision for credit losses $ 3,413 $ 1,595 $ 791 $ 429 $ 455
Specific provision as a % of average net loans and acceptances .97% .53% .33% .23% .21%
(1) Other in 2009 is related to financing products, $244 million; other services, $94 million; health, $18 million; holdings and investments, $14 million; and other, $38 million.
Management’s Discussion and Analysis Royal Bank of Canada: Annual Report 2009 71

Allowance for credit losses by portfolio and geography Table 71
(C$ millions, except percentage amounts) 2009 2008 2007 2006 2005Allowance at beginning of year (1) $ 2,438 $ 1,572 $ 1,486 $ 1,568 $ 1,714Provision for credit losses 3,413 1,595 791 429 455Write-offs by portfolio
Residential mortgages (52) (9) (5) (5) (5)Personal (732) (504) (446) (379) (353)Credit cards (455) (319) (268) (204) (237)Small business (54) (44) (42) (36) (34)
Retail $ (1,293) $ (876) $ (761) $ (624) $ (629)
Business $ (1,373) $ (435) $ (107) $ (89) $ (141)Sovereign – – – – –Bank – – – – –
Wholesale $ (1,373) $ (435) $ (107) $ (89) $ (141)Less developed countries exposures $ – $ – $ – $ – $ –Total write-offs by portfolio $ (2,666) $ (1,311) $ (868) $ (713) $ (770)
Recoveries by portfolioResidential mortgages $ 1 $ 1 $ 1 $ – $ –Personal 74 76 75 64 69Credit cards 53 49 46 41 43Small business 5 7 7 7 9
Retail $ 133 $ 133 $ 129 $ 112 $ 121Business $ 140 $ 29 $ 41 $ 93 $ 53Sovereign – – – – –Bank – – – – –
Wholesale $ 140 $ 29 $ 41 $ 93 $ 53Total recoveries by portfolio $ 273 $ 162 $ 170 $ 205 $ 174
Net write-offs $ (2,393) $ (1,149) $ (698) $ (508) $ (596)Adjustments (2) (156) 281 (7) (3) (5)
Total allowance for credit losses at end of year $ 3,302 $ 2,299 $ 1,572 $ 1,486 $ 1,568
Specific allowance for loan lossesCanada
Residential mortgages $ 39 $ 23 $ 13 $ 11 $ 9Personal 94 79 79 88 101Small business 22 17 9 9 8
Retail $ 155 $ 119 $ 101 $ 108 $ 118
BusinessAgriculture $ 10 $ 13 $ 9 $ 8 $ 14Automotive 6 5 2 3 1Consumer goods 18 12 45 32 31Energy 1 2 – 2 5Non-bank financial services – 9 9 10 10Forest products 8 4 10 2 6Industrial products 63 49 9 8 7Mining & metals 1 1 1 1 –Real estate & related 44 9 18 10 15Technology & media 32 6 5 5 3Transportation & environment 7 5 7 7 4Other 72 23 38 24 16
Sovereign – – – – –Bank – – – – –
Wholesale $ 262 $ 138 $ 153 $ 112 $ 112$ 417 $ 257 $ 254 $ 220 $ 230
United StatesResidential mortgages $ 10 $ 5 $ 1 $ 1 $ 1Personal 34 16 5 2 2Small business – – – – –
Retail $ 44 $ 21 $ 6 $ 3 $ 3
BusinessAgriculture $ 1 $ – $ – $ 1 $ 1Automotive 5 – – 2 2Consumer goods 9 6 – 3 3Energy 42 27 – – 1Non-bank financial services 62 – – 1 –Forest products 2 – – – –Industrial products 17 8 – – –Mining & metals 5 1 – – –Real estate & related 241 241 56 1 1Technology & media 3 13 – – 5Transportation & environment 3 – – – 1Other 233 79 6 4 4
Sovereign – – – – –Bank – – – – –
Wholesale $ 623 $ 375 $ 62 $ 12 $ 18$ 667 $ 396 $ 68 $ 15 $ 21
Other InternationalRetail $ 74 $ 68 $ 13 $ 12 $ 12Wholesale 121 46 16 16 19
$ 195 $ 114 $ 29 $ 28 $ 31Total specific allowance for loan losses $ 1,279 $ 767 $ 351 $ 263 $ 282General allowance
Residential mortgages $ 50 $ 20 $ 16 $ 19 $ 19Personal 671 461 349 365 343Credit cards 327 270 193 195 195Small business 47 47 37 37 37
Retail $ 1,095 $ 798 $ 595 $ 616 $ 594Wholesale $ 814 $ 650 $ 370 $ 349 $ 425General allowance for off-balance sheet items and other items $ 114 $ 84 $ 256 $ 258 $ 267Total general allowance $ 2,023 $ 1,532 $ 1,221 $ 1,223 $ 1,286Total allowance for credit losses $ 3,302 $ 2,299 $ 1,572 $ 1,486 $ 1,568Key ratios
Allowance for credit losses as a % of loans and acceptances 1.13% .76% .63% .68% .79%Net write-offs as a % of average net loans and acceptances .82% .42% .30% .25% .32%
(1) Opening allowance for credit losses as at November 1, 2008 has been restated due to the implementation of amendments to CICA section 3855.(2) Other adjustments include primarily foreign exchange translations on non-Canadian dollar-denominated allowance for credit losses and acquisition adjustments for RBTT $25 million in 2008;
ANB $50 million in 2008; and Flag Bank $21 million in 2007.
72 Royal Bank of Canada: Annual Report 2009 Management’s Discussion and Analysis
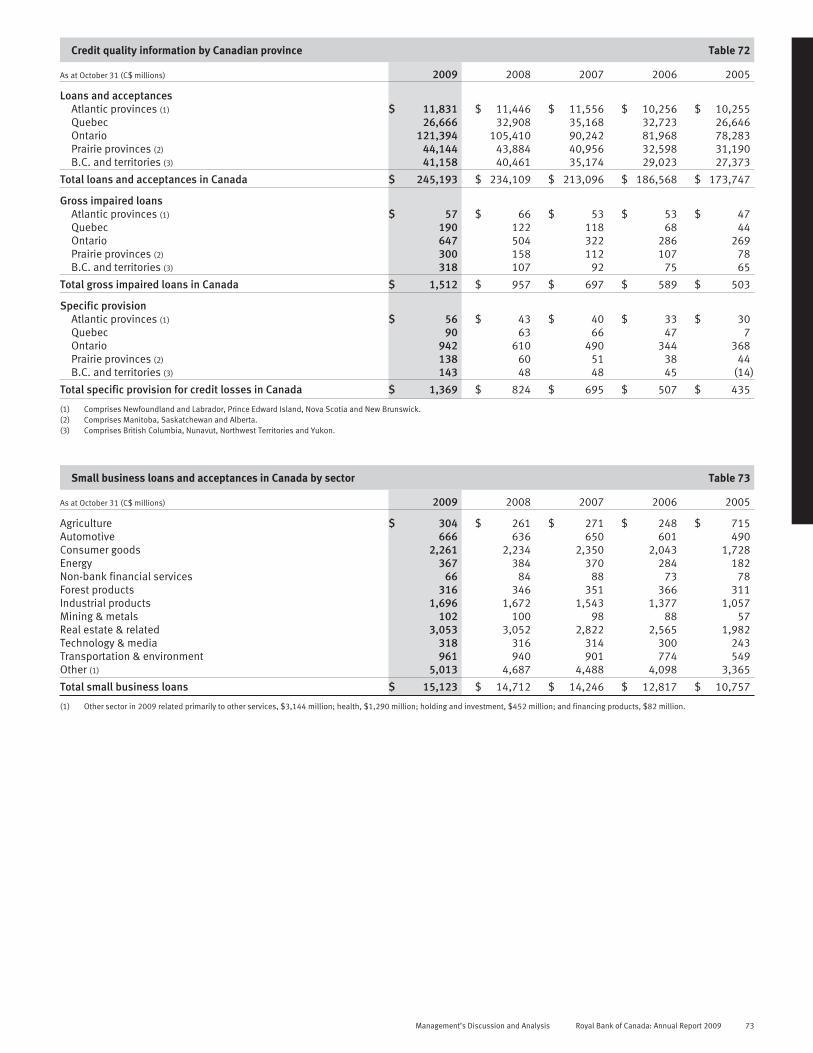
Credit quality information by Canadian province Table 72
As at October 31 (C$ millions) 2009 2008 2007 2006 2005
Loans and acceptancesAtlantic provinces (1) $ 11,831 $ 11,446 $ 11,556 $ 10,256 $ 10,255Quebec 26,666 32,908 35,168 32,723 26,646Ontario 121,394 105,410 90,242 81,968 78,283Prairie provinces (2) 44,144 43,884 40,956 32,598 31,190B.C. and territories (3) 41,158 40,461 35,174 29,023 27,373
Total loans and acceptances in Canada $ 245,193 $ 234,109 $ 213,096 $ 186,568 $ 173,747
Gross impaired loansAtlantic provinces (1) $ 57 $ 66 $ 53 $ 53 $ 47Quebec 190 122 118 68 44Ontario 647 504 322 286 269Prairie provinces (2) 300 158 112 107 78B.C. and territories (3) 318 107 92 75 65
Total gross impaired loans in Canada $ 1,512 $ 957 $ 697 $ 589 $ 503
Specific provisionAtlantic provinces (1) $ 56 $ 43 $ 40 $ 33 $ 30Quebec 90 63 66 47 7Ontario 942 610 490 344 368Prairie provinces (2) 138 60 51 38 44B.C. and territories (3) 143 48 48 45 (14)
Total specific provision for credit losses in Canada $ 1,369 $ 824 $ 695 $ 507 $ 435
(1) Comprises Newfoundland and Labrador, Prince Edward Island, Nova Scotia and New Brunswick.(2) Comprises Manitoba, Saskatchewan and Alberta.(3) Comprises British Columbia, Nunavut, Northwest Territories and Yukon.
Small business loans and acceptances in Canada by sector Table 73
As at October 31 (C$ millions) 2009 2008 2007 2006 2005
Agriculture $ 304 $ 261 $ 271 $ 248 $ 715Automotive 666 636 650 601 490Consumer goods 2,261 2,234 2,350 2,043 1,728Energy 367 384 370 284 182Non-bank financial services 66 84 88 73 78Forest products 316 346 351 366 311Industrial products 1,696 1,672 1,543 1,377 1,057Mining & metals 102 100 98 88 57Real estate & related 3,053 3,052 2,822 2,565 1,982Technology & media 318 316 314 300 243Transportation & environment 961 940 901 774 549Other (1) 5,013 4,687 4,488 4,098 3,365
Total small business loans $ 15,123 $ 14,712 $ 14,246 $ 12,817 $ 10,757
(1) Other sector in 2009 related primarily to other services, $3,144 million; health, $1,290 million; holding and investment, $452 million; and financing products, $82 million.
Management’s Discussion and Analysis Royal Bank of Canada: Annual Report 2009 73

REPORTS AND CONSOLIDATED FINANCIAL STATEMENTS
74 Reports
75 Management’s Responsibilityfor Financial Reporting
75 Report of IndependentRegistered CharteredAccountants
75 Comments by IndependentRegistered CharteredAccountants on Canada-United States of AmericaReporting Difference
76 Management’s Report onInternal Control over FinancialReporting
76 Report of IndependentRegistered CharteredAccountants
77 Consolidated Financial Statements
77 Consolidated Balance Sheets
78 Consolidated Statements ofIncome
79 Consolidated Statements ofComprehensive Income andChanges in Shareholders’Equity
80 Consolidated Statements ofCash Flows
81 Notes to the ConsolidatedFinancial Statements
81 Note 1 Significantaccountingpolicies andestimates
87 Note 2 Fair value offinancialinstruments
93 Note 3 Securities
97 Note 4 Loans
99 Note 5 Securitizations
102Note 6
Variable interestentities
103 Note 7 Derivativeinstruments andhedging activities
108 Note 8 Premises andequipment
108 Note 9 RBC DexiaInvestor Servicesjoint venture
109 Note 10 Goodwill andother Intangibles
109 Note 11 Significantacquisitions
110 Note 12 Other assets
111 Note 13 Deposits
111 Note 14 Insurance
112 Note 15 Other liabilities
112 Note 16 Subordinateddebentures
113 Note 17 Trust capitalsecurities
114 Note 18 Preferred shareliabilities andshare capital
116 Note 19 Non-controllinginterest insubsidiaries
116 Note 20 Pensions andother post-employmentbenefits
119 Note 21 Stock-basedcompensation
121 Note 22 Revenue fromtrading andselected non-trading financialinstruments
121 Note 23 Income taxes
122 Note 24 Earnings pershare
123 Note 25 Guarantees,commitmentsandcontingencies
126 Note 26 Contractualrepricing andmaturityschedule
127 Note 27 Related partytransactions
127 Note 28 Results bybusiness andgeographicsegment
129 Note 29 Nature and extentof risks arisingfrom financialinstruments
129 Note 30 Capitalmanagement
130 Note 31 Reconciliationof the applicationof Canadian andUnited Statesgenerallyacceptedaccountingprinciples
145 Note 32 Parent companyinformation
146 Note 33 Subsequent Event
74 Royal Bank of Canada: Annual Report 2009 Consolidated Financial Statements

Management’s Responsibility for Financial Reporting
The accompanying consolidated financial statements of Royal Bank ofCanada (RBC) were prepared by management, which is responsiblefor the integrity and fairness of the information presented, includingthe many amounts that must of necessity be based on estimates andjudgments. These consolidated financial statements were prepared inaccordance with the Bank Act (Canada) and Canadian generallyaccepted accounting principles (GAAP). Financial informationappearing throughout our Management’s Discussion and Analysis isconsistent with these consolidated financial statements.
RBC’s internal controls are designed to provide reasonableassurance that transactions are authorized, assets are safeguardedand proper records are maintained. These controls include qualitystandards in hiring and training of employees, policies and proce-dures manuals, a corporate code of conduct and accountability forperformance within appropriate and well-defined areas of responsi-bility.
The system of internal controls is further supported by acompliance function, which is designed to ensure that we and ouremployees comply with securities legislation and conflict of interestrules, and by an internal audit staff, which conducts periodic audits ofall aspects of our operations.
The Board of Directors oversees management’s responsibilitiesfor financial reporting through an Audit Committee, which iscomposed entirely of independent directors. This Committee reviewsour consolidated financial statements and recommends them to the
Board for approval. Other key responsibilities of the Audit Committeeinclude reviewing our existing internal control procedures andplanned revisions to those procedures, and advising the directors onauditing matters and financial reporting issues. Our Chief ComplianceOfficer and Chief Internal Auditor have full and unrestricted access tothe Audit Committee.
The Office of the Superintendent of Financial Institutions Canada(OSFI) examines and inquires into the business and affairs of RBC asdeemed necessary to determine whether the provisions of the BankAct are being complied with, and that RBC is in sound financialcondition. In carrying out its mandate, OSFI strives to protect therights and interests of depositors and creditors of RBC.
Deloitte & Touche LLP, Independent Registered CharteredAccountants appointed by the shareholders of RBC upon therecommendation of the Audit Committee and Board, have performedan independent audit of the consolidated financial statements andtheir report follows. The auditors have full and unrestricted access tothe Audit Committee to discuss their audit and related findings.
Gordon M. NixonPresident and Chief Executive Officer
Janice R. FukakusaChief Administrative Officer and Chief Financial Officer
Toronto, December 3, 2009
Report of Independent Registered Chartered Accountants
To the Shareholders of Royal Bank of Canada
We have audited the consolidated balance sheets of Royal Bank ofCanada (the “Bank”) as at October 31, 2009 and 2008 and theconsolidated statements of income, comprehensive income, changesin shareholders’ equity and cash flows for each of the years in thethree year period ended October 31, 2009. These financial state-ments are the responsibility of the Bank’s management. Ourresponsibility is to express an opinion on these financial statementsbased on our audits.
We conducted our audits in accordance with Canadian generallyaccepted auditing standards and the standards of the PublicCompany Accounting Oversight Board (United States). Thesestandards require that we plan and perform an audit to obtainreasonable assurance whether the financial statements are free ofmaterial misstatement. An audit includes examining, on a test basis,evidence supporting the amounts and disclosures in the financialstatements. An audit also includes assessing the accountingprinciples used and significant estimates made by management, aswell as evaluating the overall financial statement presentation. Webelieve that our audits provide a reasonable basis for our opinion.
In our opinion, these consolidated financial statements present
fairly, in all material respects, the financial position of the Bank as atOctober 31, 2009 and 2008 and the results of its operations and itscash flows for each of the years in the three year period endedOctober 31, 2009 in accordance with Canadian generally acceptedaccounting principles.
We have also audited, in accordance with the standards of thePublic Company Accounting Oversight Board (United States), theBank’s internal control over financial reporting as of October 31, 2009based on the criteria established in Internal Control—IntegratedFramework issued by the Committee of Sponsoring Organizations ofthe Treadway Commission and our report dated December 3, 2009expressed an unqualified opinion on the Bank’s internal control overfinancial reporting.
Deloitte & Touche LLPIndependent Registered Chartered AccountantsLicensed Public Accountants
Toronto, CanadaDecember 3, 2009
Comments by Independent Registered Chartered Accountants on Canada-United States of America Reporting Difference
The standards of the Public Company Accounting Oversight Board(United States) require the addition of an explanatory paragraph(following the opinion paragraph) when there is a change inaccounting principles that has a material effect on the comparabilityof the Bank’s financial statements, such as the changes described inNotes 1, 2, 3, 4, and 31 to the consolidated financial statements.Although we conducted our audits in accordance with both Canadiangenerally accepted auditing standards and the standards of thePublic Company Accounting Oversight Board (United States), ourreport to the shareholders dated December 3, 2009, is expressed inaccordance with Canadian reporting standards which do not require a
reference to such a change in accounting principles in the auditors’report when the change is properly accounted for and adequatelydisclosed in the financial statements.
Deloitte & Touche LLPIndependent Registered Chartered AccountantsLicensed Public Accountants
Toronto, CanadaDecember 3, 2009
Consolidated Financial Statements Royal Bank of Canada: Annual Report 2009 75
Management’s Report on Internal Control over Financial Reporting
Management of Royal Bank of Canada (RBC) is responsible forestablishing and maintaining adequate internal control over financialreporting. Internal control over financial reporting is a processdesigned by, or under the supervision of, the President and ChiefExecutive Officer and the Chief Administrative Officer and ChiefFinancial Officer and effected by the Board of Directors, managementand other personnel to provide reasonable assurance regarding thereliability of financial reporting and the preparation of financialstatements for external purposes in accordance with generallyaccepted accounting principles. It includes those policies andprocedures that:• pertain to the maintenance of records that, in reasonable detail,
accurately and fairly reflect the transactions related to anddispositions of our assets
• provide reasonable assurance that transactions are recorded asnecessary to permit preparation of financial statements inaccordance with generally accepted accounting principles, andRBC receipts and expenditures are made only in accordance withauthorizations of management and directors of RBC
• provide reasonable assurance regarding prevention or timelydetection of unauthorized acquisition, use, or disposition of RBCassets that could have a material effect on our financialstatements.
Due to its inherent limitations, internal control over financial reportingmay not prevent or detect misstatements on a timely basis. Also,projections of any evaluation of the effectiveness of internal controlover financial reporting to future periods are subject to the risk thatthe controls may become inadequate because of changes inconditions, or that the degree of compliance with the policies orprocedures may deteriorate.
Management evaluated, under the supervision of and with theparticipation of the President and Chief Executive Officer and theChief Administrative Officer and Chief Financial Officer, theeffectiveness of the internal control over financial reporting of RBC asof October 31, 2009, based on the criteria set forth in Internal Control– Integrated Framework issued by the Committee of SponsoringOrganizations of the Treadway Commission. Based on that evalua-tion, management concluded that, as of October 31, 2009, internalcontrol over financial reporting was effective based on the criteriaestablished in the Internal Control – Integrated Framework. Also,based on the results of our evaluation, management concluded thatthere were no material weaknesses that have been identified ininternal control over financial reporting as of October 31, 2009.
The internal control over financial reporting of RBC as ofOctober 31, 2009 has been audited by Deloitte & Touche LLP,Independent Registered Chartered Accountants, who also audited ourConsolidated Financial Statements for the year ended October 31,2009, as stated in the Report of Independent Registered CharteredAccountants, which report expressed an unqualified opinion on theeffectiveness of our internal control over financial reporting.
Gordon M. NixonPresident and Chief Executive Officer
Janice R. FukakusaChief Administrative Officer and Chief Financial Officer
Toronto, December 3, 2009
Report of Independent Registered Chartered Accountants
To the Shareholders of Royal Bank of Canada
We have audited the internal control over financial reporting of RoyalBank of Canada (the “Bank”) as of October 31, 2009 based on thecriteria established in Internal Control—Integrated Framework issuedby the Committee of Sponsoring Organizations of the TreadwayCommission. The Bank’s management is responsible for maintainingeffective internal control over financial reporting and for itsassessment of the effectiveness of internal control over financialreporting, included in the accompanying Management’s Report onInternal Control over Financial Reporting. Our responsibility is toexpress an opinion on the Bank’s internal control over financialreporting based on our audit.
We conducted our audit in accordance with the standards of thePublic Company Accounting Oversight Board (United States). Thosestandards require that we plan and perform the audit to obtainreasonable assurance about whether effective internal control overfinancial reporting was maintained in all material respects. Our auditincluded obtaining an understanding of internal control over financialreporting, assessing the risk that a material weakness exists, testingand evaluating the design and operating effectiveness of internalcontrol based on the assessed risk, and performing such otherprocedures as we considered necessary in the circumstances. Webelieve that our audit provides a reasonable basis for our opinion.
A company’s internal control over financial reporting is a processdesigned by, or under the supervision of, the company’s principalexecutive and principal financial officers, or persons performingsimilar functions, and effected by the company’s board of directors,management, and other personnel to provide reasonable assuranceregarding the reliability of financial reporting and the preparation offinancial statements for external purposes in accordance withgenerally accepted accounting principles. A company’s internalcontrol over financial reporting includes those policies and proce-dures that (1) pertain to the maintenance of records that, inreasonable detail, accurately and fairly reflect the transactions anddispositions of the assets of the company; (2) provide reasonableassurance that transactions are recorded as necessary to permitpreparation of financial statements in accordance with generallyaccepted accounting principles and that receipts and expenditures ofthe company are being made only in accordance with authorizations
of management and directors of the company; and (3) providereasonable assurance regarding prevention or timely detection ofunauthorized acquisition, use or disposition of the company’s assetsthat could have a material effect on the financial statements.
Because of the inherent limitations of internal control overfinancial reporting, including the possibility of collusion or impropermanagement override of controls, material misstatements due toerror or fraud may not be prevented or detected on a timely basis.Also, projections of any evaluation of the effectiveness of the internalcontrol over financial reporting to future periods are subject to therisk that the controls may become inadequate because of changes inconditions, or that the degree of compliance with the policies orprocedures may deteriorate.
In our opinion, the Bank maintained, in all material respects,effective internal control over financial reporting as of October 31,2009 based on the criteria established in Internal Control—IntegratedFramework issued by the Committee of Sponsoring Organizations ofthe Treadway Commission.
We have also audited, in accordance with Canadian generallyaccepted auditing standards and the standards of the PublicCompany Accounting Oversight Board (United States), theconsolidated financial statements as at and for the year endedOctober 31, 2009 of the Bank and our report dated December 3, 2009expressed an unqualified opinion on those consolidated financialstatements and includes a separate report titled Comments byIndependent Registered Chartered Accountants on Canada-UnitedStates of America Reporting Difference referring to changes inaccounting principles.
Deloitte & Touche LLPIndependent Registered Chartered AccountantsLicensed Public Accountants
Toronto, CanadaDecember 3, 2009
76 Royal Bank of Canada: Annual Report 2009 Consolidated Financial Statements
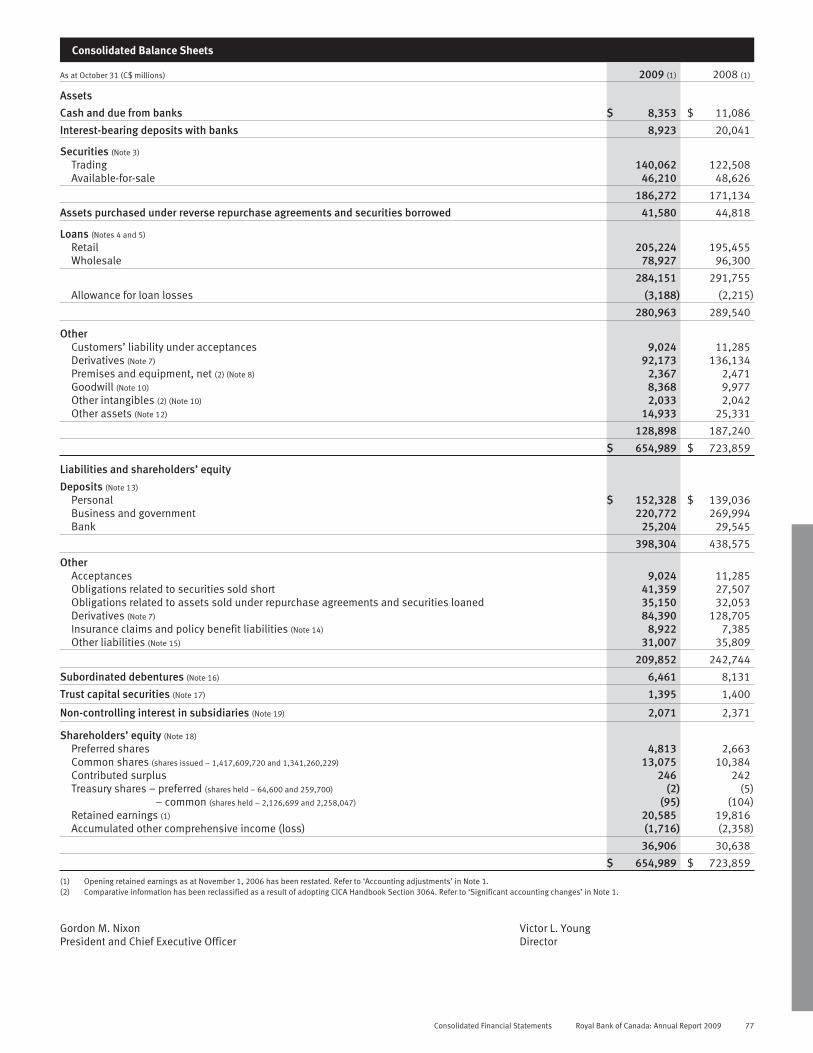
Consolidated Balance Sheets
As at October 31 (C$ millions) 2009 (1) 2008 (1)
Assets
Cash and due from banks $ 8,353 $ 11,086
Interest-bearing deposits with banks 8,923 20,041
Securities (Note 3)
Trading 140,062 122,508Available-for-sale 46,210 48,626
186,272 171,134
Assets purchased under reverse repurchase agreements and securities borrowed 41,580 44,818
Loans (Notes 4 and 5)
Retail 205,224 195,455Wholesale 78,927 96,300
284,151 291,755
Allowance for loan losses (3,188) (2,215)
280,963 289,540
OtherCustomers’ liability under acceptances 9,024 11,285Derivatives (Note 7) 92,173 136,134Premises and equipment, net (2) (Note 8) 2,367 2,471Goodwill (Note 10) 8,368 9,977Other intangibles (2) (Note 10) 2,033 2,042Other assets (Note 12) 14,933 25,331
128,898 187,240
$ 654,989 $ 723,859
Liabilities and shareholders’ equity
Deposits (Note 13)
Personal $ 152,328 $ 139,036Business and government 220,772 269,994Bank 25,204 29,545
398,304 438,575
OtherAcceptances 9,024 11,285Obligations related to securities sold short 41,359 27,507Obligations related to assets sold under repurchase agreements and securities loaned 35,150 32,053Derivatives (Note 7) 84,390 128,705Insurance claims and policy benefit liabilities (Note 14) 8,922 7,385Other liabilities (Note 15) 31,007 35,809
209,852 242,744
Subordinated debentures (Note 16) 6,461 8,131
Trust capital securities (Note 17) 1,395 1,400
Non-controlling interest in subsidiaries (Note 19) 2,071 2,371
Shareholders’ equity (Note 18)
Preferred shares 4,813 2,663Common shares (shares issued – 1,417,609,720 and 1,341,260,229) 13,075 10,384Contributed surplus 246 242Treasury shares – preferred (shares held – 64,600 and 259,700) (2) (5)
– common (shares held – 2,126,699 and 2,258,047) (95) (104)Retained earnings (1) 20,585 19,816Accumulated other comprehensive income (loss) (1,716) (2,358)
36,906 30,638
$ 654,989 $ 723,859
(1) Opening retained earnings as at November 1, 2006 has been restated. Refer to ‘Accounting adjustments’ in Note 1.(2) Comparative information has been reclassified as a result of adopting CICA Handbook Section 3064. Refer to ‘Significant accounting changes’ in Note 1.
Gordon M. Nixon Victor L. YoungPresident and Chief Executive Officer Director
Consolidated Financial Statements Royal Bank of Canada: Annual Report 2009 77

Consolidated Statements of Income
For the year ended October 31 (C$ millions) 2009 2008 2007
Interest incomeLoans $ 13,504 $ 14,983 $ 14,724Securities 5,946 6,662 7,665Assets purchased under reverse repurchase agreements and securities borrowed 931 2,889 3,620Deposits with banks 162 498 538
20,543 25,032 26,547
Interest expenseDeposits 6,762 12,158 13,770Other liabilities 1,925 3,472 4,737Subordinated debentures 350 354 338
9,037 15,984 18,845
Net interest income 11,506 9,048 7,702
Non-interest incomeInsurance premiums, investment and fee income 5,718 2,609 3,152Trading revenue 2,671 (96) 1,999Investment management and custodial fees 1,619 1,759 1,579Mutual fund revenue 1,293 1,561 1,473Securities brokerage commissions 1,358 1,377 1,353Service charges 1,556 1,367 1,303Underwriting and other advisory fees 1,050 875 1,217Foreign exchange revenue, other than trading 638 646 533Card service revenue 732 648 491Credit fees 530 415 293Securitization revenue (Note 5) 1,169 461 261Net (loss) gain on available-for-sale securities (Note 3) (630) (617) 63Other (104) 1,529 1,043
Non-interest income 17,600 12,534 14,760
Total revenue 29,106 21,582 22,462
Provision for credit losses (Note 4) 3,413 1,595 791
Insurance policyholder benefits, claims and acquisition expense 4,609 1,631 2,173
Non-interest expenseHuman resources (Notes 20 and 21) 8,978 7,779 7,860Equipment (1) 1,025 934 847Occupancy 1,045 926 839Communications 761 749 723Professional fees 559 562 530Outsourced item processing 301 341 308Amortization of other intangibles (1) (Note 10) 462 356 258Other 1,427 704 1,108
14,558 12,351 12,473
Goodwill impairment charge 1,000 – –
Income before income taxes 5,526 6,005 7,025Income taxes (Note 23) 1,568 1,369 1,392
Net income before non-controlling interest 3,958 4,636 5,633
Non-controlling interest in net income of subsidiaries 100 81 141
Net income $ 3,858 $ 4,555 $ 5,492
Preferred dividends (Note 18) (233) (101) (88)
Net income available to common shareholders $ 3,625 $ 4,454 $ 5,404
Average number of common shares (in thousands) (Note 24) 1,398,675 1,305,706 1,273,185Basic earnings per share (in dollars) $ 2.59 $3.41 $4.24
Average number of diluted common shares (in thousands) (Note 24) 1,412,126 1,319,744 1,289,314Diluted earnings per share (in dollars) $ 2.57 $3.38 $4.19
Dividends per share (in dollars) $ 2.00 $2.00 $1.82
(1) Comparative information has been reclassified as a result of adopting CICA Handbook Section 3064. Refer to Note 1.
78 Royal Bank of Canada: Annual Report 2009 Consolidated Financial Statements

Consolidated Statements of Comprehensive Income
For the year ended October 31 (C$ millions) 2009 2008 2007
Comprehensive incomeNet income $ 3,858 $ 4,555 $ 5,492
Other comprehensive income, net of taxesNet unrealized gains (losses) on available-for-sale securities 662 (1,376) (93)Reclassification of losses on available-for-sale securities to income 330 373 28
Net change in unrealized gains (losses) on available-for-sale securities 992 (1,003) (65)
Unrealized foreign currency translation (losses) gains (2,973) 5,080 (2,965)Reclassification of losses (gains) on foreign currency translation to income 2 (3) (42)Net foreign currency translation gains (losses) from hedging activities 2,399 (2,672) 1,804
Foreign currency translation adjustments (572) 2,405 (1,203)
Net gains (losses) on derivatives designated as cash flow hedges 156 (603) 80Reclassification of (gains) losses on derivatives designated as cash flow hedges to income (38) 49 31
Net change in cash flow hedges 118 (554) 111
Other comprehensive income (loss) 538 848 (1,157)
Total comprehensive income $ 4,396 $ 5,403 $ 4,335
Consolidated Statements of Changes in Shareholders’ Equity
For the year ended October 31 (C$ millions) 2009 2008 (1) 2007 (1)
Preferred shares (Note 18)
Balance at beginning of year $ 2,663 $ 2,050 $ 1,050Issued 2,150 613 1,150Redeemed for cancellation – – (150)
Balance at end of year 4,813 2,663 2,050
Common shares (Note 18)
Balance at beginning of year 10,384 7,300 7,196Issued 2,691 3,090 170Purchased for cancellation – (6) (66)
Balance at end of year 13,075 10,384 7,300
Contributed surplusBalance at beginning of year 242 235 292Renounced stock appreciation rights (7) (5) (6)Stock-based compensation awards (11) 14 (46)Other 22 (2) (5)
Balance at end of year 246 242 235
Treasury shares – preferred (Note 18)
Balance at beginning of year (5) (6) (2)Sales 13 23 33Purchases (10) (22) (37)
Balance at end of year (2) (5) (6)
Treasury shares – common (Note 18)
Balance at beginning of year (104) (101) (180)Sales 59 51 175Purchases (50) (54) (96)
Balance at end of year (95) (104) (101)
Retained earningsBalance at beginning of year (1) 19,816 18,047 15,771Transition adjustment – Financial instruments (2) 66 – (86)Adjustment (1) – – (120)Net income 3,858 4,555 5,492Preferred share dividends (Note 18) (233) (101) (88)Common share dividends (Note 18) (2,819) (2,624) (2,321)Premium paid on common shares purchased for cancellation – (49) (580)Issuance costs and other (103) (12) (21)
Balance at end of year 20,585 19,816 18,047
Accumulated other comprehensive (loss) incomeTransition adjustment – Financial instruments (2) 59 (45) (45)Unrealized losses on available-for-sale securities (76) (1,068) (65)Unrealized foreign currency translation losses, net of hedging activities (1,374) (802) (3,207)Gains and losses on derivatives designated as cash flow hedges (325) (443) 111
Balance at end of year (1,716) (2,358) (3,206)
Retained earnings and Accumulated other comprehensive income 18,869 17,458 14,841
Shareholders’ equity at end of year $ 36,906 $ 30,638 $ 24,319
(1) Opening retained earnings as at November 1, 2006 has been restated. Refer to Note 1.(2) The 2007 transition adjustment relates to the implementation of the financial instruments accounting standards on November 1, 2006. The 2009 transition adjustment relates to the
amendments to certain of these standards that were effective November 1, 2008. Refer to Note 1.
Consolidated Financial Statements Royal Bank of Canada: Annual Report 2009 79

Consolidated Statements of Cash Flows
For the year ended October 31 (C$ millions) 2009 2008 2007
Cash flows from operating activitiesNet income $ 3,858 $ 4,555 $ 5,492Adjustments to determine net cash from (used in) operating activities
Provision for credit losses 3,413 1,595 791Depreciation (1) 389 318 434Business realignment payments (2) (11) (38)Future income taxes (97) (455) (147)Impairment of goodwill and amortization of other intangibles (1) 1,462 356 96Gain on sale of premises and equipment 5 (17) (16)Gain on securitizations (934) (207) (44)(Gain) loss on available-for-sale securities (17) 1 (146)Writedown of available-for-sale securities 657 631 66Changes in operating assets and liabilities
Insurance claims and policy benefit liabilities 1,537 102 (54)Net change in accrued interest receivable and payable (147) 164 (28)Current income taxes 3,546 (2,705) 1,034Derivative assets 43,961 (69,527) (28,856)Derivative liabilities (44,315) 56,685 29,916Trading securities (11,382) 24,966 10,976Net change in brokers and dealers receivable and payable 2,396 (552) (317)Other 3,073 (4,518) 3,341
Net cash from operating activities 7,403 11,381 22,500
Cash flows from investing activitiesChange in interest-bearing deposits with banks 11,118 (8,160) (1,379)Change in loans, net of securitizations (17,854) (62,725) (42,097)Proceeds from securitizations 21,788 10,047 8,318Proceeds from sale of available-for-sale securities 12,515 8,885 8,117Proceeds from maturity of available-for-sale securities 18,108 14,804 15,350Purchases of available-for-sale securities (32,268) (24,864) (22,012)Net acquisitions of premises and equipment and software (700) (1,265) (706)Change in assets purchased under reverse repurchase agreements
and securities borrowed 3,238 19,650 (4,935)Net cash used in acquisitions (27) (974) (373)
Net cash from (used in) investing activities 15,918 (44,602) (39,717)
Cash flows from financing activitiesChange in deposits (40,742) 61,271 16,831Issue of Trust Subordinated Notes – – 1,000Repayment of subordinated debentures (1,659) (500) (989)Issue of subordinated debentures – 2,000 87Issue of preferred shares 2,150 613 1,150Redemption of preferred shares for cancellation – (300) (150)Issue of RBC Trust Capital Securities (RBC TruCS) – 500 –Issue of common shares 2,439 149 155Purchase of common shares for cancellation – (55) (646)Sales of treasury shares 72 74 208Purchase of treasury shares (60) (76) (133)Dividends paid (2,744) (2,688) (2,278)Issuance costs (77) (11) (23)Dividends/distributions paid by subsidiaries to non-controlling interests (4) (33) (59)Change in obligations related to assets sold under repurchase agreements
and securities loaned 3,097 (6,172) (4,070)Change in obligations related to securities sold short 13,852 (17,192) 6,436Redemption of trust preferred notes (140) – –Change in short-term borrowings of subsidiaries (1,967) 1,618 (145)
Net cash (used in) from financing activities (25,783) 39,198 17,374
Effect of exchange rate changes on cash and due from banks (271) 883 (332)
Net change in cash and due from banks (2,733) 6,860 (175)Cash and due from banks at beginning of year 11,086 4,226 4,401
Cash and due from banks at end of year $ 8,353 $ 11,086 $ 4,226
Supplemental disclosure of cash flow informationAmount of interest paid in year $ 9,910 $ 15,967 $ 18,494Amount of income taxes paid in year $ (102) $ 2,025 $ 1,352
(1) Comparative information has been reclassified as a result of adopting CICA Handbook Section 3064. Refer to Note 1.
80 Royal Bank of Canada: Annual Report 2009 Consolidated Financial Statements

Note 1 Significant accounting policies and estimates
The accompanying Consolidated Financial Statements have beenprepared in accordance with Subsection 308 of the Bank Act (Canada)(the Act), which states that, except as otherwise specified by theOffice of the Superintendent of Financial Institutions Canada (OSFI),our Consolidated Financial Statements are to be prepared inaccordance with Canadian generally accepted accounting principles(GAAP). The significant accounting policies used in the preparation ofthese financial statements, including the accounting requirements ofOSFI, are summarized below. These accounting policies conform, inall material respects, to Canadian GAAP.
GeneralBasis of consolidationOur Consolidated Financial Statements include the assets andliabilities and results of operations of all subsidiaries and variableinterest entities (VIEs) where we are the Primary Beneficiary afterelimination of intercompany transactions and balances. The equitymethod is used to account for investments in associated corporationsand limited partnerships in which we have significant influence.These investments are reported in Other assets. Our share ofearnings, gains and losses realized on dispositions and writedownsto reflect other-than-temporary impairment in the value of theseinvestments is included in Non-interest income. The proportionateconsolidation method is used to account for investments in jointventures in which we exercise joint control, whereby our pro ratashare of assets, liabilities, income and expenses is consolidated.
Use of estimates and assumptionsIn preparing our Consolidated Financial Statements, management isrequired to make estimates and assumptions that affect the reportedamounts of assets, liabilities, net income and related disclosures.Certain estimates, including the allowance for credit losses, the fairvalue of financial instruments, accounting for securitizations,litigation provisions, VIEs, insurance claims and policy benefitliabilities, pensions and other post-employment benefits, the carryingvalue of goodwill and finite lived intangible assets, credit cardcustomer loyalty reward program liability and income taxes, requiremanagement to make subjective or complex judgments. Accordingly,actual results could differ from these and other estimates therebyimpacting our future Consolidated Financial Statements.
Accounting adjustmentsIn 2009, we corrected the following errors pertaining to prior periods:an under accrual of $90 million ($62 million after-tax) of our cardspoints liability; a $63 million ($43 million after-tax) over capital-ization of software development costs; and a $15 millionunderstatement of income taxes. These errors are not material to theperiods to which they relate; however, as correcting them in the firstquarter of 2009 would have materially distorted the net income forthat quarter, we corrected them by decreasing opening retainedearnings for the quarter ended January 31, 2007, by $120 million.
Significant accounting changesGoodwill and Intangible AssetsOn November 1, 2008, we adopted Canadian Institute of CharteredAccountants (CICA) Handbook Section 3064, Goodwill and IntangibleAssets (Section 3064). Section 3064, which replaces Section 3062,Goodwill and Other Intangible Assets, and Section 3450, Researchand Development Costs, provides clarifying guidance on the criteriathat must be satisfied in order for an intangible asset to be recog-nized, including internally developed intangible assets. The CICA’sEmerging Issues Committee (EIC) Abstract No. 27, Revenues andExpenditures During the Pre-operating Period, is no longer applicableonce Section 3064 has been adopted. As a result of adoptingSection 3064, we reclassified $789 million of software from Premisesand equipment to Other intangibles on our Consolidated BalanceSheets as at November 1, 2008. We have also reclassifieddepreciation of $221 million and $162 million from Non-interestexpense – Equipment to Non-interest expense – Amortization of otherintangibles on our Consolidated Statements of Income for the yearended October 31, 2008 and October 31, 2007, respectively.
Credit Risk and the Fair Value of Financial Assets and FinancialLiabilitiesIn January 2009, the EIC issued Abstract No. 173, Credit Risk and theFair Value of Financial Assets and Financial Liabilities (EIC-173).EIC-173 requires an entity to take into account its own credit risk andthat of the relevant counterparty(s) when determining the fair value offinancial assets and financial liabilities, including derivativeinstruments. This EIC, which was effective for us on November 1,2008, had no impact on our financial position or results of operationsbecause we had been incorporating the aforementioned credit risksinto our valuation methodology before the EIC was issued.
Effective Interest Method – Amendments to: Financial Instruments –Recognition and Measurement, Section 3855.In June 2009, the CICA clarified Section 3855 with respect to theeffective interest method which is a method of calculating theamortized cost of financial assets and financial liabilities and ofallocating the interest income or interest expense over the relevantperiod. The impact of the clarification had no material impact on ourconsolidated financial position or results of operations.
Embedded Derivatives on Reclassification of Financial Assets –Amendments to: Financial Instruments – Recognition andMeasurement, Section 3855.In June 2009, the CICA clarified Section 3855 with respect to thereclassification of financial instruments with embedded derivatives. Afinancial instrument classified as held-for-trading may not bereclassified when the embedded derivative that would have to beseparated on reclassification of the combined contract cannot bemeasured separately. The amendment was effective forreclassifications made on or after July 1, 2009 and had no materialimpact on our consolidated financial position or results of operations.
Fair Value and Liquidity Risk Disclosure – Amendments to: FinancialInstruments – Disclosures, Section 3862.In June 2009, the CICA amended Section 3862 to improve fair valueand liquidity risk disclosures. Section 3862 now requires that allfinancial instruments measured at fair value be categorized into oneof three hierarchy levels, described below, for disclosure purposes.Each level is based on the transparency of the inputs used tomeasure the fair values of assets and liabilities:
Level 1 – inputs are unadjusted quoted prices of identicalinstruments in active markets.
Level 2 – inputs other than quoted prices included in Level 1 thatare observable for the asset or liability, either directly or indirectly.
Level 3 – one or more significant inputs used in a valuationtechnique are unobservable in determining fair values of theinstruments.
Determination of fair value and the resulting hierarchy requiresthe use of observable market data whenever available. The classi-fication of a financial instrument in the hierarchy is based upon thelowest level of input that is significant to the measurement of fairvalue. The amendments only impact our disclosures. Refer to Note 2.We have also enhanced our liquidity disclosures by including detailson our sources of funding. Refer to Note 29.
Impairment of Financial Assets – Amendments to: FinancialInstruments – Recognition and Measurement, Section 3855.In August 2009, the CICA issued various amendments toSection 3855 which eliminated the distinction between debtsecurities and other debt instruments and changed the categories towhich debt instruments are required or are permitted to be classified.As a result of these amendments non-derivative financial assets withfixed or determinable payments that are not quoted in an activemarket may be classified as loans and receivables; loan and receiv-ables for which we may not recover substantially all of our initialinvestment, other than because of credit deterioration, must beclassified as available-for-sale; and loans and receivables that weintend to sell immediately or in the near term must be classified asheld-for-trading.
Consolidated Financial Statements Royal Bank of Canada: Annual Report 2009 81
Note 1 Significant accounting policies and estimates (continued)
The amendments also permit, upon adoption and on an on-goingbasis, certain financial assets be reclassified from the held-for-tradingand available-for-sale categories into the loans and receivablescategory, when specified conditions are met. They also requirereversing an impairment loss relating to an available-for-sale debtinstrument when, in a subsequent period, the fair value of theinstrument increases and the increase can be objectively related to anevent occurring after the loss was recognized. Impairment for debtinstruments classified as loans and receivables will be assessedusing the impairment model for loans.
We adopted these amendments with retrospective application toNovember 1, 2008, in accordance with the transitional provisions ofthe amendments; accordingly, we have reclassified $179 million ofheld-for-trading and $929 million of available-for-sale securities toloans and recorded the following transition adjustments in ourConsolidated Financial Statements: (i) an increase of $66 million, netof taxes of $30 million, to our Retained earnings as of November 1,2008, representing an adjustment to the impairment amountcalculated as a result of using the impairment model for loans, and(ii) an increase of $104 million, net of taxes of $57 million, to ourAccumulated other comprehensive income (AOCI) as of November 1,2008, representing the cumulative marked-to-market adjustmentspreviously recorded. Our results for 2009 were also impacted by theamendments as follows: (i) an increase of $64 million, net of taxes, toour Net income, representing an adjustment to the impairmentamount calculated as a result of using the impairment model forloans, and (ii) a reduction to Other comprehensive income (OCI) of$26 million, net of taxes, representing the cumulative unrealizedgains adjustments previously recorded.
We have reclassified $179 million of loans intended to be sold inthe near future upon origination to the held-for-trading category. Werecorded an increase of $2 million, net of taxes, to our Net income,representing marked-to-market adjustments on these reclassifiedloans.
Financial Instruments – Recognition and MeasurementSecuritiesSecurities are classified, based on management’s intentions, asheld-for-trading, available-for-sale or held-to-maturity. Certain debtsecurities may be classified as loans and receivables as ofNovember 1, 2008 in accordance with the CICA’s amendments toSection 3855 discussed earlier in this Note under “Significantaccounting changes.”
Held-for-trading securities include securities purchased for salein the near term and securities designated as held-for-trading underthe fair value option and are reported at fair value. Obligations todeliver Trading securities sold but not yet purchased are recorded asliabilities and carried at fair value. Realized and unrealized gains andlosses on these securities are recorded as Trading revenue inNon-interest income. Dividend and interest income accruing onTrading securities is recorded in Interest income. Interest anddividends accrued on interest-bearing and equity securities sold shortare recorded in Interest expense.
Available-for-sale securities include: (i) securities which may besold in response to or in anticipation of changes in interest rates andresulting prepayment risk, changes in foreign currency risk, changesin funding sources or terms, or to meet liquidity needs, and (ii) loansubstitute securities which are client financings that have beenstructured as after-tax investments rather than conventional loans inorder to provide the clients with a borrowing rate advantage.Available-for-sale securities are measured at fair value with thedifference between the fair value and its amortized cost, includingchanges in foreign exchange rates, recognized in OCI, net of tax.Purchase premiums or discounts on available-for-sale debt securitiesare amortized over the life of the security using the effective interestmethod and are recognized in Net interest income. Investments inequity instruments classified as available-for-sale that do not have aquoted market price in an active market are measured at cost.
At each reporting date, and more frequently when conditionswarrant, we evaluate our available-for-sale securities with unrealizedlosses to determine whether those unrealized losses are other-than-
temporary. This determination is based on consideration of severalfactors including: (i) the length of time and extent to which the fairvalue has been less than its amortized cost; (ii) the severity of theimpairment; (iii) the cause of the impairment and the financialcondition and near-term prospects of the issuer; and (iv) our intentand ability to hold the investment for a period of time sufficient toallow for any anticipated recovery of fair value. If our assessmentindicates that the impairment in value is other-than-temporary, or wedo not have the intent or ability to hold the security until its fair valuerecovers, the security is written down to its current fair value, and aloss is recognized in net income.
Gains and losses realized on disposal of available-for-salesecurities and losses related to other-than-temporary impairment invalue of available-for-sale securities are included in Non-interestincome as Net gains or losses on available-for-sale securities.
Held-to-maturity securities are debt securities where we have theintention and ability to hold the investment until its maturity date.These securities are carried at amortized cost using the effectiveinterest method. Interest income and amortization of premiums anddiscounts on debt securities are recorded in Net interest income. Wehold a nominal amount of held-to-maturity securities in our normalcourse of business. All held-to-maturity securities have been includedwith Available-for-sale securities on our Consolidated Balance Sheets.
We assess our held-to-maturity securities for impairment usingthe same impairment model for loans in accordance with the CICA’samendments to Section 3855 discussed earlier in this Note under“Significant accounting changes.” Refer to the Loans section fordetails.
We account for all of our securities using settlement dateaccounting except that changes in fair value between the trade dateand settlement date are reflected in income for securities classified ordesignated as held-for-trading while changes in the fair value ofavailable-for-sale securities between the trade and settlement datesare recorded in OCI.
Fair value optionA financial instrument can be designated as held-for-trading (the fairvalue option) on its initial recognition even if the financial instrumentwas not acquired or incurred principally for the purpose of selling orrepurchasing it in the near term. An instrument that is classified asheld-for-trading by way of this fair value option must have a reliablymeasurable fair value and satisfy one of the following criteriaestablished by OSFI: (i) it eliminates or significantly reduces ameasurement or recognition inconsistency that would otherwise arisefrom measuring assets or liabilities, or recognizing gains and losseson them on a different basis; (ii) it belongs to a group of financialassets or financial liabilities or both that are managed and evaluatedon a fair value basis in accordance with our risk management orinvestment strategy, and are reported to senior management on thatbasis; or (iii) it is an embedded derivative in a financial ornon-financial host contract and the derivative is not closely related tothe host contract.
Financial instruments designated as held-for-trading using thefair value option are recorded at fair value and any gain or loss arisingdue to changes in fair value are included in income. These instru-ments cannot be reclassified out of held-for-trading category whilethey are held or issued.
Transaction costsTransaction costs are expensed as incurred for financial instrumentsclassified or designated as held-for-trading. For other financialinstruments, transaction costs are capitalized on initial recognition.
Assets purchased under reverse repurchase agreements and soldunder repurchase agreementsWe purchase securities under agreements to resell (reverserepurchase agreements) and take possession of these securities.Reverse repurchase agreements are treated as collateralized lendingtransactions whereby we monitor the market value of the securitiespurchased and additional collateral is obtained when appropriate. Wealso have the right to liquidate the collateral held in the event of
82 Royal Bank of Canada: Annual Report 2009 Consolidated Financial Statements

counterparty default. We also sell securities under agreements torepurchase (repurchase agreements), which are treated ascollateralized borrowing transactions.
Reverse repurchase agreements and repurchase agreements arecarried on our Consolidated Balance Sheets at the amounts at whichthe securities were initially acquired or sold plus accrued interest,respectively, except when they are designated using the fair valueoption as held-for-trading and are recorded at fair value. Interestearned on reverse repurchase agreements is included in Interestincome, and interest incurred on repurchase agreements is includedin Interest expense, respectively, in our Consolidated Statements ofIncome. Changes in fair value for reverse repurchase agreements andrepurchase agreements carried at fair value under the fair valueoption are included in Trading revenue in Non-interest income.
SecuritizationsOur various securitization activities generally consist of the transfer offinancial assets to independent special purpose entities (SPEs) ortrusts that issue securities to investors. SPEs may be a VIE as definedby CICA Accounting Guideline (AcG) 15, Consolidation of VariableInterest Entities (AcG-15) or a Qualifying SPEs (QSPEs) as definedunder AcG-12, Transfer of Receivables.
These transactions are accounted for as sales and the trans-ferred assets are removed from our Consolidated Balance Sheetswhen we are deemed to have surrendered control over such assetsand have received consideration other than beneficial interests inthese transferred assets. For control to be surrendered, all of thefollowing must occur: (i) the transferred assets must be isolated fromthe seller, even in bankruptcy or other receivership; (ii) the purchasermust have the legal right to sell or pledge the transferred assets or, ifthe purchaser is a QSPE, its investors have the right to sell or pledgetheir ownership interest in the entity; and (iii) the seller must notcontinue to control the transferred assets through an agreement torepurchase them or have a right to cause the assets to be returned. Ifany one of these conditions is not met, the transfer is considered tobe a secured borrowing, the assets remain on our ConsolidatedBalance Sheets, and the proceeds are recognized as a liability.
In the case of loan securitizations, we sell loans or packagemortgage-backed securities (MBS) to SPEs or trusts that issuesecurities to investors.
When MBS are created, we reclassify the loans at their carryingcosts into MBS and retained interests on our Consolidated BalanceSheets. The retained interest largely represents the excess spread ofloan interest over the MBS rate of return. The initial carrying value ofthe MBS and the related retained interests are determined based ontheir relative fair value on the date of securitization. MBS areclassified as held-for-trading or available-for-sale securities, based onmanagement’s intent. Retained interests are classified asavailable-for-sale or as held-for-trading using the fair value option.Both MBS and retained interests classified as available-for-sale aresubject to periodic impairment review.
Gains on the sale of loans or MBS are recognized in Non-interestincome and are dependent on the previous carrying amount of the loansor MBS involved in the transfer. To obtain fair values, quoted marketprices are used, if available. When quotes are not available for retainedinterests, we generally determine fair value based on the present valueof expected future cash flows using management’s best estimates of keyassumptions such as payment rates, weighted average life of the pre-payable receivables, excess spread, expected credit losses and discountrates commensurate with the risks involved.
For each securitization transaction where we have retained theservicing rights, we assess whether the benefits of servicing representadequate compensation. When the benefits of servicing are morethan adequate, a servicing asset is recognized in Other – Otherassets. When the benefits of servicing are not expected to beadequate, we recognize a servicing liability in Other – Otherliabilities. Neither an asset nor a liability is recognized when we havereceived adequate compensation. A servicing asset or liability isamortized in proportion to and over the period of estimated netservicing income.
In the case of bond securitizations, we purchase municipalgovernment, government related and corporate bonds, and issuesecurities that are sold to third party investors. We do not retain any
beneficial interest unless we purchase some of the certificatesissued.
AcceptancesAcceptances are short-term negotiable instruments issued by ourclients to third parties which we guarantee. The potential liabilityunder acceptances is reported in Other – Other Liabilities on ourConsolidated Balance Sheets. The recourse against our clients in thecase of a call on these commitments is reported as a correspondingasset of the same amount in Other – Other Assets. Fees earned arereported in Non-interest income.
DerivativesDerivatives are primarily used in sales and trading activities.Derivatives are also used to manage our exposures to interest rate,currency, credit and other market risks. The most frequently usedderivative products are interest rate swaps, interest rate futures,forward rate agreements, interest rate options, foreign exchangeforward contracts, currency swaps, foreign currency futures, foreigncurrency options, equity swaps and credit derivatives. All derivativeinstruments are recorded on our Consolidated Balance Sheets at fairvalue, including those derivatives that are embedded in financial ornon-financial contracts that are not closely related to the hostcontracts. An embedded derivative is a component of a hybridinstrument that includes a non-derivative host contract, with theeffect that some of the cash flows of the hybrid instrument vary in away similar to a stand-alone derivative. When an embeddedderivative is separated, the host contract is accounted for based onGAAP applicable to contract of that type without the embeddedderivative. All embedded derivatives are presented on a combinedbasis with the host contracts although they are separated formeasurement purposes.
When derivatives are used in sales and trading activities, therealized and unrealized gains and losses on derivatives are recog-nized in Non-interest income – Trading revenue. Derivatives with apositive fair value are reported as Derivative assets and derivativeswith a negative fair value are reported as Derivative liabilities. Wherewe have both the legal right and intent to settle derivative assets andliabilities simultaneously with a counterparty, the net fair value of thederivative positions is reported as an asset or liability, as appropriate.Market and credit valuation adjustments, and premiums paid are alsoincluded in Derivative assets, while premiums received are shown inDerivative liabilities.
When derivatives are used to manage our own exposures, wedetermine for each derivative whether hedge accounting can beapplied, as discussed below.
To determine the fair value adjustments on RBC debt designatedas held-for-trading, we calculate the present value of the instrumentsbased on the contractual cash flows over the term of the arrangementby using RBC’s effective funding rate at the beginning and end of theperiod with the unrealized change in present value recorded in Netincome.
Hedge accountingWe use derivatives and non-derivatives in our hedging strategies tomanage our exposure to interest rate, currency, credit and othermarket risks. Where hedge accounting can be applied, a hedgerelationship is designated and documented at inception to detail theparticular risk management objective and the strategy for undertakingthe hedge transaction. The documentation identifies the specificasset, liability or anticipated cash flows being hedged, the risk that isbeing hedged, the type of hedging instrument used and howeffectiveness will be assessed. The hedging instrument must behighly effective in accomplishing the objective of offsetting eitherchanges in the fair value or anticipated cash flows attributable to therisk being hedged both at inception and throughout the life of thehedge. Hedge accounting is discontinued prospectively when it isdetermined that the hedging instrument is no longer effective as ahedge, the hedging instrument is terminated or sold, or upon the saleor early termination of the hedged item. Refer to Note 7 for the fairvalue of the derivatives and non-derivative instruments categorizedby their hedging relationships, as well as derivatives that are notdesignated in hedging relationships.
Consolidated Financial Statements Royal Bank of Canada: Annual Report 2009 83

Note 1 Significant accounting policies and estimates (continued)
Fair value hedgesIn a fair value hedging relationship, the carrying value of the hedgeditem is adjusted for changes in fair value attributable to the hedgedrisk and recognized in Non-interest income. Changes in the fair valueof the hedged item, to the extent that the hedging relationship iseffective, are offset by changes in the fair value of the hedgingderivative, which are also recognized in Non-interest income. Whenhedge accounting is discontinued, the carrying value of the hedgeditem is no longer adjusted and the cumulative fair value adjustmentsto the carrying value of the hedged items are amortized to Net incomeover the remaining term of the original hedging relationship.
We predominantly use interest rate swaps to hedge our exposureto the changes in a fixed interest rate instrument’s fair value causedby changes in interest rates. We also use, in limited circumstances,certain cash instruments to hedge our exposure to the changes in fairvalue of monetary assets attributable to changes in foreign currencyexchange rates.
Cash flow hedgesIn a cash flow hedging relationship, the effective portion of the changein the fair value of the hedging derivative, net of taxes, is recognized inOCI while the ineffective portion is recognized in Non-interest income.When hedge accounting is discontinued, the amounts previouslyrecognized in AOCI are reclassified to Net interest income during theperiods when the variability in the cash flows of the hedged itemaffects Net interest income. Gains and losses on derivatives arereclassified immediately to Net income when the hedged item is sold orterminated early. We predominantly use interest rate swaps to hedgethe variability in cash flows related to a variable rate asset or liability.
Net investment hedgesIn hedging a foreign currency exposure of a net investment in a self-sustaining foreign operation, the effective portion of foreign exchangegains and losses on the hedging instruments, net of applicable taxes,is recognized in OCI and the ineffective portion is recognized inNon-interest income. The amounts previously recognized in AOCI arerecognized in Net income when there is a reduction in the hedged netinvestment as a result of a dilution or sale of the net investment, orreduction in equity of the foreign operation as a result of dividenddistributions. We use foreign currency-denominated liabilities andforeign exchange contracts to manage our foreign currency exposuresto net investments in self-sustaining foreign operations having afunctional currency other than the Canadian dollar.
LoansLoans are recorded at amortized cost unless upon origination, weintend to sell them in the near future or they have been designated asheld-for-trading using the fair value option. Loans recorded atamortized cost are net of an allowance for loan losses and unearnedincome which comprises unearned interest and unamortized loanfees. Loans designated as held-for-trading are carried at fair value.
Loans recorded at amortized cost are subject to periodicimpairment review and are classified as impaired when, inmanagement’s opinion, there is no longer reasonable assurance ofthe timely collection of the full amount of principal or interest.Whenever a payment is 90 days past due, loans other than credit cardbalances and loans guaranteed or insured by a Canadian government(federal or provincial) or a Canadian government agency (collectively,Canadian government) are classified as impaired unless they are fullysecured and collection efforts are reasonably expected to result inrepayment of debt within 180 days of the loan becoming past due.Credit card balances are written off when a payment is 180 days inarrears. Loans guaranteed by a Canadian government are classifiedas impaired when the loan is contractually 365 days in arrears. Whena loan is identified as impaired, the accrual of interest is discontinuedand any previously accrued but unpaid interest on the loan is chargedto the Provision for credit losses. Interest received on impaired loansis credited to the carrying value of the loan. If the loan is completelywritten off, subsequent payments are credited to the Provision for
credit losses. Impaired loans are returned to performing status whenall past due amounts, including interest, have been collected, loanimpairment charges have been reversed, and the credit quality hasimproved such that timely collection of principal and interest isreasonably assured.
When an impaired loan is identified, the carrying amount of theloan is reduced to its estimated realizable amount, which ismeasured by discounting the expected future cash flows at theeffective interest rate inherent in the loan. In subsequent periods,recoveries of amounts previously written off and any increase in thecarrying value of the loan are credited to the Allowance for creditlosses on our Consolidated Balance Sheets. Where a portion of a loanis written off and the remaining balance is restructured, the new loanis carried on an accrual basis when there is no longer any reasonabledoubt regarding the collectability of principal or interest, andpayments are not 90 days past due.
Assets acquired in respect of problem loans are recorded at theirfair value less costs of disposition. Fair value is determined based oneither current market value where available or discounted cash flows.Any excess of the carrying value of the loan over the recorded fairvalue of the assets acquired is recognized by a charge to theProvision for credit losses.
Fees that relate to activities such as originating, restructuring orrenegotiating loans are deferred and recognized as Interest incomeover the expected term of such loans using the effective interestmethod. Where there is reasonable expectation that a loan will result,commitment and standby fees are also recognized as interest incomeover the expected term of the resulting loan using the effectiveinterest method. Otherwise, such fees are recorded as other liabilitiesand amortized to non-interest income over the commitment orstandby period.
Allowance for credit lossesThe allowance for credit losses is maintained at levels thatmanagement considers appropriate to cover estimated identifiedcredit related losses in the portfolio as well as losses that have beenincurred, but are not yet identifiable as at the balance sheet date. Theallowance relates to on-balance sheet exposures, such as loans andacceptances, and off-balance sheet items such as letters of credit,guarantees and unfunded commitments.
The allowance is increased by a charge to the provision for creditlosses and decreased by the amount of write-offs, net of recoveries.The allowance for credit losses for on-balance sheet items is includedas a reduction to assets, and the allowance relating to off-balancesheet items is included in Other liabilities.
The allowance is determined based on management’s identi-fication and evaluation of problem accounts for estimated losses thatexist on the remaining portfolio, and on other factors including thecomposition and credit quality of the portfolio, and changes ineconomic and business conditions. The allowance for credit lossesconsists of specific allowances and the general allowance.
Specific allowancesSpecific allowances are recorded to recognize estimated losses onboth retail and wholesale loans that have become impaired. Thelosses relating to wholesale borrowers, including small businessloans individually managed, are estimated using management’sjudgment relating to the timing of future cash flow amounts that canbe reasonably expected from the borrowers, financially responsibleguarantors and the realization of collateral. The amounts expected tobe recovered are reduced by estimated collection costs anddiscounted at the effective interest rate of the obligation. The lossesrelating to retail portfolios, including residential mortgages, andpersonal and small business loans managed on a pooled basis arebased on net write-off experience. For credit cards, no specificallowance is maintained as balances are written off when a paymentis 180 days in arrears. Personal loans are generally written off at150 days past due. Write-offs for other loans are generally recordedwhen there is no realistic prospect of full recovery.
84 Royal Bank of Canada: Annual Report 2009 Consolidated Financial Statements

General allowanceA general allowance is established to cover estimated credit lossesincurred in the lending portfolio that have not yet been specificallyidentified as impaired. For heterogeneous loans (wholesale loansincluding small business loans individually managed), the determi-nation of the general allowance is based on the application ofestimated probability of default, gross exposure at default and lossfactors, which are determined by historical loss experience anddelineated by loan type and rating. For homogeneous portfolios (retailloans) including residential mortgages, credit cards, as well aspersonal and small business loans that are managed on a pooledbasis, the determination of the general allowance is based on theapplication of historical loss rates. In determining the generalallowance level, management also considers the current portfoliocredit quality trends, business and economic conditions, the impactof policy and process changes, and other supporting factors.
GuaranteesIn the normal course of our business, we enter into numerousagreements that may contain features that meet the definition of aguarantee pursuant to AcG-14, Disclosure of Guarantees. AcG-14defines a guarantee to be a contract (including an indemnity) thatcontingently requires us to make payments (in cash, other assets, ourown shares or provision of services) to a third party based on:(i) changes in an underlying interest rate, foreign exchange rate,equity or commodity instrument, index or other variable, that isrelated to an asset, a liability or an equity security of the counterparty;(ii) failure of another party to perform under an obligating agreement;or (iii) failure of another third party to pay its indebtedness when due.Liabilities are recognized on our Consolidated Balance Sheets at theinception of a guarantee for the fair value of the obligation under-taken in issuing the guarantee. No subsequent remeasurement at fairvalue is required unless the financial guarantee qualifies as aderivative. If the financial guarantee meets the definition of aderivative, it is remeasured at fair value at each balance sheet dateand reported as a derivative in Other assets or Other liabilities asappropriate.
Offsetting financial assets and financial liabilitiesFinancial assets and financial liabilities are presented net when wehave a legally enforceable right to set off the recognized amounts andintend to settle on a net basis or to realize the asset and settle theliability simultaneously.
InsurancePremiums from long-duration contracts, primarily life insurance, arerecognized when due in Non-interest income—Insurance premiums,investment and fee income. Premiums from short-duration contracts,primarily property and casualty, and fees for administrative servicesare recognized in Insurance premiums, investment and fee incomeover the related contract period. Unearned premiums of the short-duration contracts, representing the unexpired portion of premiums,are reported in Other liabilities. Investments made by our insuranceoperations are classified as available-for-sale or loans and receiv-ables, except for investments supporting the policy benefit liabilitieson life and health insurance contracts and a portion of property andcasualty contracts. These are designated as held-for-trading under thefair value option with changes in fair value reported in Insurancepremiums, investment and fee income.
Insurance claims and policy benefit liabilities represent currentclaims and estimates for future insurance policy benefits. Liabilitiesfor life insurance contracts are determined using the Canadian AssetLiability Method (CALM), which incorporates assumptions formortality, morbidity, policy lapses and surrenders, investment yields,policy dividends, operating and policy maintenance expenses, andprovisions for adverse deviation. These assumptions are reviewed atleast annually and updated in response to actual experience andmarket conditions. Liabilities for property and casualty insurancerepresent estimated provisions for reported and unreported claims.Liabilities for life and property and casualty insurance are included inInsurance claims and policy benefit liabilities. Changes in Insuranceclaims and policy benefit liabilities are included in the Insurance
policyholder benefits, claims and acquisition expense in ourConsolidated Statements of Income in the period in which theestimates changed.
Reinsurance recoverables related to property and casualtyinsurance business, which are included in Other assets, includeamounts related to paid benefits and unpaid claims. Reinsurancerecoverables related to our life insurance business are included inInsurance claims and policy benefit liabilities to offset the relatedliabilities.
Acquisition costs for new insurance business consist ofcommissions, premium taxes, certain underwriting costs and othercosts that vary with the acquisition of new business. Deferredacquisition costs for life insurance products are implicitly recognizedin Insurance claims and policy benefit liabilities by CALM. For propertyand casualty insurance, these costs are classified as Other assets andamortized over the policy term.
Segregated funds are lines of business in which we issue a contractwhere the benefit amount is directly linked to the market value of theinvestments held in the underlying fund. The contractual arrangement issuch that the underlying assets are registered in our name but thesegregated fund policyholders bear the risk and rewards of the fund’sinvestment performance. We provide minimum death benefit andmaturity value guarantees on segregated funds. The liability associatedwith these minimum guarantees is recorded in Insurance claims andpolicy benefit liabilities. Segregated funds are not included in ourConsolidated Financial Statements. We derive only fee income fromsegregated funds, which is reflected in Insurance premiums, investmentand fee income. Fee income includes management fees, mortality,policy, administration and surrender charges.
Pensions and other post-employment benefits and stock-basedcompensationPensions and other post-employment benefitsWe offer a number of benefit plans, which provide pension and otherbenefits to eligible employees (as described in Note 20). These plansinclude registered defined benefit pension plans, supplementalpension plans, defined contribution plans and health, dental,disability and life insurance plans.
Investments held by the pension funds primarily comprise equityand fixed income securities. Pension fund assets are valued at fairvalue. For the principal defined benefit plans, the expected return onplan assets, which is reflected in the pension benefit expense, iscalculated using a market-related value approach. Under thisapproach, assets are valued at an adjusted market value, wherebyrealized and unrealized capital gains and losses are amortized over 3years on a straight-line basis. For the majority of the non-principaland supplemental defined benefit pension plans, the expected returnon plan assets is calculated based on fair value of assets.
Actuarial valuations for the defined benefit plans are performedon a regular basis to determine the present value of the accruedpension and other post-employment benefits, based on projectionsof employees’ compensation levels to the time of retirement and thecosts of health, dental, disability and life insurance, respectively.
Our defined benefit pension expense, which is included inNon-interest expense – Human resources, consists of the cost ofemployee pension benefits for the current year’s service, interest coston the liabilities, expected investment return on the market-relatedvalue or market value of plan assets and the amortization of priorservice costs, net actuarial gains or losses and transitional assets orobligations. For some of our defined benefit plans, including theprincipal defined benefit plans, actuarial gains or losses aredetermined each year and amortized over the expected averageremaining service life of employee groups covered by the plans. Forthe remaining defined benefit plans, net actuarial gains or losses inexcess of 10% of the greater of the plan assets or the benefitobligation at the beginning of the year are amortized over theexpected average remaining service life of employee groups coveredby the plan.
Gains and losses on settlements of defined benefit plans arerecognized in Non-interest expense – Human Resources whensettlement occurs. Curtailment gains and losses are recognized in theperiod when the curtailment becomes probable and the impact canbe reasonably estimated.
Consolidated Financial Statements Royal Bank of Canada: Annual Report 2009 85
Note 1 Significant accounting policies and estimates (continued)
The cumulative excess of pension fund contributions over theamounts recorded as expenses is reported as a Prepaid pensionbenefit cost in Other assets. The cumulative excess of expense overfund contributions is reported as Accrued pension and other post-employment benefit expense in Other liabilities.
Our defined contribution plan expense is included inNon-interest expense – Human resources for services rendered byemployees during the period.
Stock-based compensationWe offer stock-based compensation plans to certain key employeesand to our non-employee directors as described in Note 21.
We use the fair value method to account for stock optionsgranted to employees whereby compensation expense is recognizedover the applicable vesting period with a corresponding increase incontributed surplus. When the options are exercised, the exerciseprice proceeds together with the amount initially recorded incontributed surplus are credited to common shares. Stockappreciation rights (SARs) obligations that are fully vested give rise tocompensation expense as a result of changes in the market price ofour common shares. These expenses, net of related hedges, arerecorded as Non-interest expense – Human resources in ourConsolidated Statements of Income with a corresponding increase inOther liabilities on our Consolidated Balance Sheets.
Our other compensation plans include performance deferredshare plans and deferred share unit plans for key employees (thePlans). The deferred share plans are settled in our common shares orcash and the deferred share unit plans are settled in cash. Theobligations for the Plans are accrued over their vesting period. Forshare-settled awards, our accrued obligations are based on themarket price of our common shares at the date of grant. For cash-settled awards, our accrued obligations are periodically adjusted forfluctuations in the market price of our common shares and dividendsaccrued. Changes in our obligations under the Plans, net of relatedhedges, are recorded as Non-interest expense – Human resources inour Consolidated Statements of Income with a correspondingincrease in Other liabilities or Contributed surplus on ourConsolidated Balance Sheets.
The compensation cost attributable to options and awards, grantedto employees who are eligible to retire or will become eligible to retireduring the vesting period, is recognized immediately if the employee iseligible to retire on the grant date or over the period between the grantdate and the date the employee becomes eligible to retire.
Our contributions to the employee savings and share ownershipplans are expensed as incurred.
Income taxesWe use the asset and liability method whereby income taxes reflectthe expected future tax consequences of temporary differencesbetween the carrying amounts of assets or liabilities for accountingpurposes compared with tax purposes. A future income tax asset orliability is determined for each temporary difference based on the taxrates that are expected to be in effect when the underlying items ofincome and expense are expected to be realized, except for earningsrelated to our foreign operations where repatriation of such amountsis not contemplated in the foreseeable future. Income taxes reportedon our Consolidated Statements of Income include the current andfuture portions of the expense. Income taxes applicable to itemscharged or credited to Shareholders’ equity are netted with suchitems. Changes in future income taxes related to a change in tax ratesare recognized in the period when the tax rate change is substantivelyenacted. Our Consolidated Statements of Income include items thatare non-taxable or non-deductible for income tax purposes and,accordingly, cause the income tax provision to be different from whatit would be if based on statutory rates.
Net future income taxes accumulated as a result of temporarydifferences and tax loss carryforwards are included in Other assets.On a quarterly basis, we review our future tax assets to determinewhether it is more likely than not that the benefits associated withthese assets will be realized; this review involves evaluating both
positive and negative evidence. A valuation allowance is establishedto reduce future income tax assets to the amount that we believe ismore likely than not to be realized. We review both positive andnegative evidence in assessing whether future income tax assets aremore likely than not to be realized.
Business combinations, goodwill and other intangiblesAll business combinations are accounted for using the purchasemethod. Identifiable intangible assets are recognized separately fromGoodwill and included in Other intangibles. Goodwill represents theexcess of the price paid for the business acquired over the fair valueof the net identifiable assets acquired, and is assigned to reportingunits of a business segment. A reporting unit comprises businessoperations with similar economic characteristics and strategies, andis defined by GAAP as the level of reporting at which goodwill istested for impairment and is either a business segment or one levelbelow. Upon disposal of a portion of a reporting unit, goodwill isallocated to the disposed portion based on the fair value of thatportion relative to the total reporting unit. The goodwill allocated tothe portion of the reporting unit to be retained is tested for impair-ment.
Goodwill is evaluated for impairment annually as at August 1 ormore often if events or circumstances indicate there may be animpairment. We test our goodwill by first determining the fair value ofeach reporting unit and comparing it to its carrying value, includingthe allocated goodwill. If the carrying value of a reporting unitexceeds its fair value, the fair value of the reporting unit’s goodwillmust be determined and compared to its carrying value. The fair valueof the goodwill is imputed by determining the fair value of assets andliabilities of the reporting unit. Goodwill impairment is measured asthe excess of the carrying amount of the reporting unit’s allocatedgoodwill over the implied fair value of the goodwill, and is charged toIncome in the period in which the impairment is identified.Subsequent reversals of impairment are prohibited.
The fair value of each reporting unit is determined primarilyusing an earnings-based approach which incorporates each reportingunit’s internal forecasts of revenue and expenses. Estimates andassumptions of discount rates, growth rates, and terminal growthrates are incorporated in this approach. Changes to these estimatesor assumptions could have an impact on the determination of the fairvalue of our reporting units and thus, the results of the impairmenttest. In addition to the earnings-based approach, where possible, weuse a market-based approach to estimate the fair value of eachreporting unit based on actual market events and comparablecompanies.
Other intangibles with a finite life are amortized on a straight-line basis over their estimated useful lives, generally not exceeding20 years, and are also tested for impairment when conditions existwhich may indicate that the estimated future net cash flows from theasset will be insufficient to recover its carrying amount.
OtherTranslation of foreign currenciesMonetary assets and liabilities denominated in foreign currencies aretranslated into Canadian dollars at rates prevailing at the balancesheet date. Non-monetary assets and liabilities are translated intoCanadian dollars at historical rates. Income and expenses denomi-nated in foreign currencies are translated at average rates ofexchange for the year.
Assets and liabilities of our self-sustaining operations withfunctional currencies other than the Canadian dollar are translatedinto Canadian dollars at rates prevailing at the balance sheet date,and income and expenses of these foreign operations are translatedat average rates of exchange for the year.
Unrealized gains or losses arising as a result of the translation ofour foreign self-sustaining operations along with the effective portionof related hedges are reported as a component of OCI on an after-taxbasis. Upon disposal or dilution of our interest in such investments,an appropriate portion of the accumulated net translation gains orlosses is included in Non-interest income.
86 Royal Bank of Canada: Annual Report 2009 Consolidated Financial Statements
Other foreign currency translation gains and losses are includedin Non-interest income.
Premises and equipmentPremises and equipment are stated at cost less accumulateddepreciation. Depreciation is recorded principally on a straight-linebasis over the estimated useful lives of the assets, which are 25 to50 years for buildings, 3 to 10 years for computer equipment, and7 to 10 years for furniture, fixtures and other equipment. Theamortization period for leasehold improvements is the lesser of theuseful life of the leasehold improvements or the lease term plus thefirst renewal period, if reasonably assured of renewal, up to amaximum of 10 years. Gains and losses on disposal are recorded inNon-interest income.
Future accounting changesBusiness Combinations, Consolidated Financial Statements, andNon-controlling InterestsIn January 2009, the CICA issued three new accounting standards:Handbook Section 1582, Business Combinations, Section 1601,Consolidated Financial Statements and Section 1602, Non-controllingInterests. Section 1582 provides clarification as to what an acquirermust measure when it obtains control of a business, the basis ofvaluation and the date at which the valuation should be determined.Acquisition-related costs must be accounted for as expenses in theperiods they are incurred, except for costs incurred to issue debt orshare capital. This new standard will be applicable for acquisitions wecomplete on or after November 1, 2011 although adoption in 2010 ispermitted to facilitate the transition to IFRS in 2011.
Section 1601 establishes standards for preparing consolidatedfinancial statements after the acquisition date; Section 1602establishes standards for the accounting and presentation ofnon-controlling interest. These new standards must be adoptedconcurrently with Section 1582.
Embedded Prepayment Option – Amendments to: FinancialInstruments – Recognition and Measurement, Section 3855.In June 2009, the CICA provided clarification to Section 3855 withrespect to the accounting for embedded prepayment option. Anembedded prepayment option in an interest-only or principal-only stripis closely related to the host contract, provided the host contractinitially resulted from separating the right to receive contractual cashflows of a financial instrument, that, in and of itself, did not contain anembedded derivative; and does not contain any terms not present inthe original host debt contract. This new standard will be applicable tous on November 1, 2011 although adoption in 2010 is permitted tofacilitate the transition to IFRS in 2011. We are currently assessing theimpact of adopting this amendment on our consolidated financialposition and results of operations.
International Financial Reporting StandardsThe CICA has announced that Canadian GAAP for publicly accountableenterprises companies will be replaced with IFRS over a transitionperiod expected to end in 2011. We will begin reporting our financialstatements in accordance with IFRS on November 1, 2011.
Note 2 Fair value of financial instruments
The fair value of a financial instrument is the amount at which thefinancial instrument could be exchanged in an arm’s-length trans-action between knowledgeable and willing parties under nocompulsion to act. Fair values of identical instruments traded inactive markets are determined by reference to last quoted prices, inthe most advantageous active market for that instrument. In theabsence of an active market, we determine fair values based onquoted prices for instruments with similar characteristics and riskprofiles. Fair values of financial instruments determined usingvaluation models require the use of inputs. In determining thoseinputs, we look primarily to external, readily observable marketinputs, when available, including factors such as interest rate yieldcurves, currency rates, and price and rate volatilities, as applicable. Insome circumstances, we use input parameters that are not based onobservable market data. In these cases, we may adjust model valuesto reflect the valuation uncertainty (model and parameter valuationadjustments) in order to determine what the fair value would bebased on the assumptions that market participants would use inpricing the financial instrument. These adjustments are made in orderto determine the fair value of the instruments.
For some securities, we may record valuation adjustments forliquidity for financial instruments that are not quoted in an active marketwhen we believe that the amount realized on sale may be less than theestimated fair value due to insufficient liquidity in the market over ashort period of time. We also include valuation adjustments calculatedwhen market prices are not observable due to insufficient tradingvolume or a lack of recent trades in a less active or inactive market.
We make valuation adjustments for the credit risk of ourderivative portfolios in order to arrive at their fair values. Theseadjustments take into account the creditworthiness of our counter-parties, the current and potential future mark-to-market of thetransactions, and the effects of credit mitigants such as masternetting agreements and collateral agreements. Credit valuationadjustments are frequently updated due to the changes in derivativevalues and counterparty performance risk. Changes to creditvaluation adjustments are recorded in current period income.
We have documented our internal policies that detail ourprocesses for determining fair value, including the methodologiesused in establishing our valuation adjustments. These methodologies
are consistently applied and periodically reviewed by Group RiskManagement.
Trading and available-for-sale securities and derivative-relatedassets represent 92% of the total fair-value assets, and depositsdesignated as held-for-trading and derivative-related liabilitiesrepresent 69% of the total fair-value liabilities.
The majority of our financial instruments classified as held-for-trading (other than derivatives) and as available-for-sale compriseactively traded debt and equity securities and are carried at fair valuebased on available quoted prices.
All of our derivatives transactions are accounted for on a fairvalue basis. Fair values of exchange-traded derivatives are based onlast exchange prices. Over-the-counter derivatives are valued usingeither industry standard or internally developed valuation models.Valuation model inputs are either observable or unobservable.
Observable inputs of the financial instruments include G7interest-rate-yield curves, currency rates and volatility of certainprices or rates. Unobservable inputs consist of non-G7 interest-rate-yield curves, prepayment speeds, credit speads, probability ofdefaults, recovery rates, equity volatility and correlations of proba-bility of defaults, market reference interest rates or baskets ofcommon stock.
Valuation methods and assumptions used in measuring fair valuesof deposits designated as held-for-trading are described in the Carryingvalue and fair value of selected financial instruments section below.
Deferred unrealized gains or losses at inceptionAn unrealized gain or loss at inception for financial instruments is thedifference between the transaction price and its fair value on thetrade date. Unrealized gains or losses at inception are recognized inNet income only if the fair value of the instrument is: (i) evidenced bya quoted market price in an active market or observable currentmarket transactions that are substantially the same; (ii) based on avaluation technique that uses all significant observable marketinputs; or (iii) the risks associated with the derivative contract arefully offset by another contract(s) with a third party(ies). For financialinstruments where the fair value is not evidenced by the above-mentioned criteria or the risks associated with the original contractare not fully transferred to a third party, the unrealized gain or loss at
Consolidated Financial Statements Royal Bank of Canada: Annual Report 2009 87
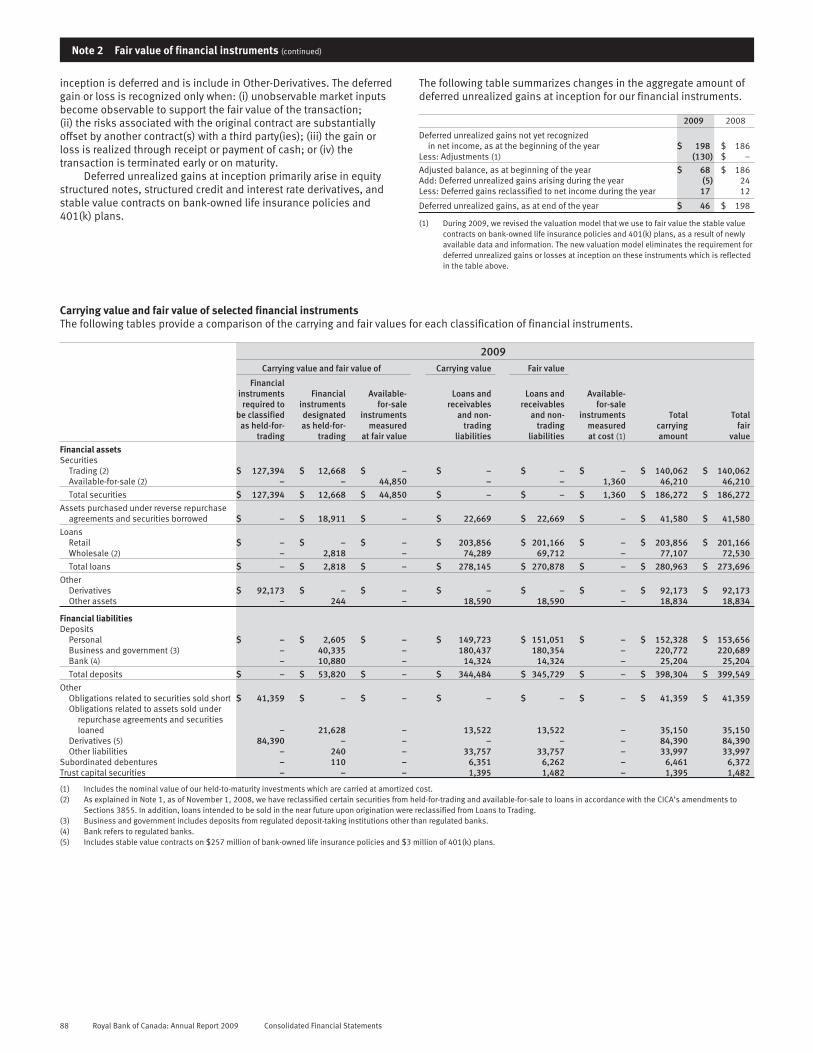
Note 2 Fair value of financial instruments (continued)
inception is deferred and is include in Other-Derivatives. The deferredgain or loss is recognized only when: (i) unobservable market inputsbecome observable to support the fair value of the transaction;(ii) the risks associated with the original contract are substantiallyoffset by another contract(s) with a third party(ies); (iii) the gain orloss is realized through receipt or payment of cash; or (iv) thetransaction is terminated early or on maturity.
Deferred unrealized gains at inception primarily arise in equitystructured notes, structured credit and interest rate derivatives, andstable value contracts on bank-owned life insurance policies and401(k) plans.
The following table summarizes changes in the aggregate amount ofdeferred unrealized gains at inception for our financial instruments.
2009 2008
Deferred unrealized gains not yet recognizedin net income, as at the beginning of the year $ 198 $ 186
Less: Adjustments (1) (130) $ –
Adjusted balance, as at beginning of the year $ 68 $ 186Add: Deferred unrealized gains arising during the year (5) 24Less: Deferred gains reclassified to net income during the year 17 12
Deferred unrealized gains, as at end of the year $ 46 $ 198
(1) During 2009, we revised the valuation model that we use to fair value the stable valuecontracts on bank-owned life insurance policies and 401(k) plans, as a result of newlyavailable data and information. The new valuation model eliminates the requirement fordeferred unrealized gains or losses at inception on these instruments which is reflectedin the table above.
Carrying value and fair value of selected financial instrumentsThe following tables provide a comparison of the carrying and fair values for each classification of financial instruments.
2009Carrying value and fair value of Carrying value Fair value
Financialinstruments
required tobe classified
as held-for-trading
Financialinstrumentsdesignatedas held-for-
trading
Available-for-sale
instrumentsmeasured
at fair value
Loans andreceivables
and non-trading
liabilities
Loans andreceivables
and non-trading
liabilities
Available-for-sale
instrumentsmeasuredat cost (1)
Totalcarryingamount
Totalfair
valueFinancial assetsSecurities
Trading (2) $ 127,394 $ 12,668 $ – $ – $ – $ – $ 140,062 $ 140,062Available-for-sale (2) – – 44,850 – – 1,360 46,210 46,210Total securities $ 127,394 $ 12,668 $ 44,850 $ – $ – $ 1,360 $ 186,272 $ 186,272
Assets purchased under reverse repurchaseagreements and securities borrowed $ – $ 18,911 $ – $ 22,669 $ 22,669 $ – $ 41,580 $ 41,580
LoansRetail $ – $ – $ – $ 203,856 $ 201,166 $ – $ 203,856 $ 201,166Wholesale (2) – 2,818 – 74,289 69,712 – 77,107 72,530Total loans $ – $ 2,818 $ – $ 278,145 $ 270,878 $ – $ 280,963 $ 273,696
OtherDerivatives $ 92,173 $ – $ – $ – $ – $ – $ 92,173 $ 92,173Other assets – 244 – 18,590 18,590 – 18,834 18,834
Financial liabilitiesDeposits
Personal $ – $ 2,605 $ – $ 149,723 $ 151,051 $ – $ 152,328 $ 153,656Business and government (3) – 40,335 – 180,437 180,354 – 220,772 220,689Bank (4) – 10,880 – 14,324 14,324 – 25,204 25,204Total deposits $ – $ 53,820 $ – $ 344,484 $ 345,729 $ – $ 398,304 $ 399,549
OtherObligations related to securities sold short $ 41,359 $ – $ – $ – $ – $ – $ 41,359 $ 41,359Obligations related to assets sold under
repurchase agreements and securitiesloaned – 21,628 – 13,522 13,522 – 35,150 35,150
Derivatives (5) 84,390 – – – – – 84,390 84,390Other liabilities – 240 – 33,757 33,757 – 33,997 33,997
Subordinated debentures – 110 – 6,351 6,262 – 6,461 6,372Trust capital securities – – – 1,395 1,482 – 1,395 1,482
(1) Includes the nominal value of our held-to-maturity investments which are carried at amortized cost.(2) As explained in Note 1, as of November 1, 2008, we have reclassified certain securities from held-for-trading and available-for-sale to loans in accordance with the CICA’s amendments to
Sections 3855. In addition, loans intended to be sold in the near future upon origination were reclassified from Loans to Trading.(3) Business and government includes deposits from regulated deposit-taking institutions other than regulated banks.(4) Bank refers to regulated banks.(5) Includes stable value contracts on $257 million of bank-owned life insurance policies and $3 million of 401(k) plans.
88 Royal Bank of Canada: Annual Report 2009 Consolidated Financial Statements

2008Carrying value and fair value of Carrying value Fair value
Financialinstrumentsrequired to
be classifiedas held-for-
trading
Financialinstrumentsdesignatedas held-for-
trading
Available-for-sale
instrumentsmeasured
at fair value
Loans andreceivables
and non-trading
liabilities
Loans andreceivables
and non-trading
liabilities
Available-for-sale
instrumentsmeasuredat cost (1)
Totalcarryingamount
Totalfair
value
Financial assetsSecurities
Trading $ 104,414 $ 18,094 $ – $ – $ – $ – $122,508 $122,508Available-for-sale (2) – – 47,039 – – 1,587 48,626 48,626
Total securities $ 104,414 $ 18,094 $ 47,039 $ – $ – $ 1,587 $171,134 $171,134
Assets purchased under reverse repurchaseagreements and securities borrowed $ – $ 15,607 $ – $ 29,211 $ 29,211 $ – $ 44,818 $ 44,818
LoansRetail $ – $ – $ – $ 194,448 $ 198,127 $ – $194,448 $198,127Wholesale – 7,137 – 87,955 88,615 – 95,092 95,752
Total loans $ – $ 7,137 $ – $ 282,403 $ 286,742 $ – $289,540 $293,879
OtherDerivatives (3) $ 136,134 $ – $ – $ – $ – $ – $136,134 $136,134Other assets – 136 – 30,903 30,903 – 31,039 31,039
Financial liabilitiesDeposits
Personal $ – $ 2,678 $ – $ 136,358 $ 137,181 $ – $139,036 $139,859Business and government (4) – 67,462 – 202,532 202,564 – 269,994 270,026Bank (5) – 7,268 – 22,277 22,277 – 29,545 29,545
Total deposits $ – $ 77,408 $ – $ 361,167 $ 362,022 $ – $438,575 $439,430
OtherObligations related to securities sold short $ 27,507 $ – $ – $ – $ – $ – $ 27,507 $ 27,507Obligations related to assets sold under
repurchase agreements and securities loaned – 17,870 – 14,183 14,183 – 32,053 32,053Derivatives 128,705 – – – – – 128,705 128,705Other liabilities – – – 42,271 42,458 – 42,271 42,458
Subordinated debentures – 81 – 8,050 7,605 – 8,131 7,686Trust capital securities – – – 1,400 1,448 – 1,400 1,448
(1) Includes the nominal value of our held-to-maturity investments which are carried at amortized cost.(2) Loan substitutes are classified as available-for-sale securities. Also includes the securities reclassified from trading to available-for-sale on August 1, 2008. Refer to Note 3.(3) Includes stable value contracts on $2 million of bank-owned life insurance policies and $1 million of 401 (k) plans.(4) Business and government includes deposits from regulated deposit-taking institutions other than regulated banks.(5) Bank refers to regulated banks.
The following tables present information on loans and receivablesdesignated as held-for-trading using the fair value option, themaximum exposure to credit risk, the extent to which the risk ismitigated by credit derivatives and similar instruments, and changesin the fair value of these assets. We measure the change in the fair
value of loans and receivables designated as held-for-trading due tochanges in credit risk as the difference between the total change inthe fair value of the instrument during the period and the change infair value calculated using the appropriate risk-free yield curves.
2009
Loans and receivables designated as held–for–trading
Carryingamount ofloans and
receivablesdesignatedas held-for-
trading
Maximumexposure to
credit risk
Change in fairvalue since
November 1,2008
attributable tochanges incredit risk
Cumulativechange in fair
value sinceinitial
recognitionattributable to
changes incredit risk
Extent towhichcredit
derivativesor similar
instrumentsmitigate
credit risk
Change infair value of
creditderivatives
or similarinstruments
sinceNovember 1,
2008
Cumulativechange in fair
value of creditderivatives
or similarinstruments (1)
Interest-bearing deposits with banks $ 2,773 $ 2,773 $ – $ – $ – $ – $ –Assets purchased under reverse repurchase
agreements and securities borrowed 18,911 18,911 – – – – –Loans – Wholesale 2,818 2,818 27 (75) 428 (52) 10
Total $ 24,502 $ 24,502 $ 27 $ (75) $ 428 $ (52) $ 10
(1) The cumulative change is measured from the later of November 1, 2006, or the initial recognition of the credit derivative or similar instruments.
Consolidated Financial Statements Royal Bank of Canada: Annual Report 2009 89
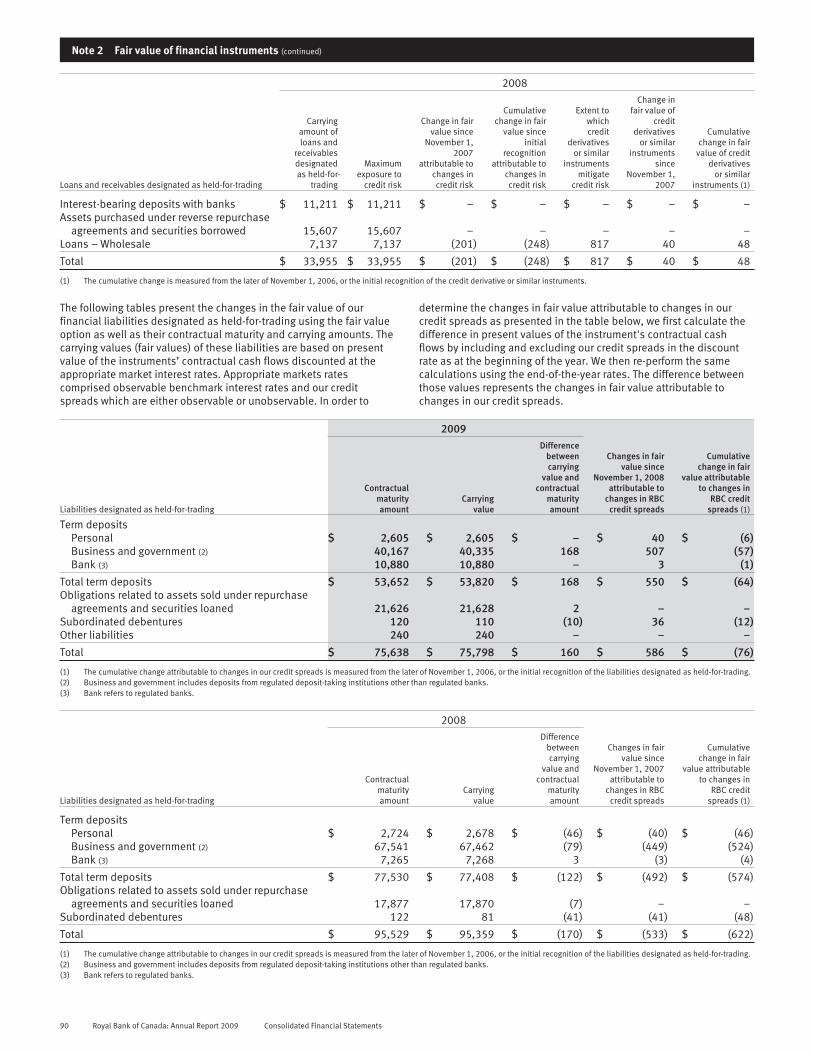
Note 2 Fair value of financial instruments (continued)
2008
Loans and receivables designated as held-for-trading
Carryingamount ofloans and
receivablesdesignatedas held-for-
trading
Maximumexposure to
credit risk
Change in fairvalue since
November 1,2007
attributable tochanges incredit risk
Cumulativechange in fair
value sinceinitial
recognitionattributable to
changes incredit risk
Extent towhichcredit
derivativesor similar
instrumentsmitigate
credit risk
Change infair value of
creditderivatives
or similarinstruments
sinceNovember 1,
2007
Cumulativechange in fair
value of creditderivatives
or similarinstruments (1)
Interest-bearing deposits with banks $ 11,211 $ 11,211 $ – $ – $ – $ – $ –Assets purchased under reverse repurchase
agreements and securities borrowed 15,607 15,607 – – – – –Loans – Wholesale 7,137 7,137 (201) (248) 817 40 48
Total $ 33,955 $ 33,955 $ (201) $ (248) $ 817 $ 40 $ 48
(1) The cumulative change is measured from the later of November 1, 2006, or the initial recognition of the credit derivative or similar instruments.
The following tables present the changes in the fair value of ourfinancial liabilities designated as held-for-trading using the fair valueoption as well as their contractual maturity and carrying amounts. Thecarrying values (fair values) of these liabilities are based on presentvalue of the instruments’ contractual cash flows discounted at theappropriate market interest rates. Appropriate markets ratescomprised observable benchmark interest rates and our creditspreads which are either observable or unobservable. In order to
determine the changes in fair value attributable to changes in ourcredit spreads as presented in the table below, we first calculate thedifference in present values of the instrument's contractual cashflows by including and excluding our credit spreads in the discountrate as at the beginning of the year. We then re-perform the samecalculations using the end-of-the-year rates. The difference betweenthose values represents the changes in fair value attributable tochanges in our credit spreads.
2009
Liabilities designated as held-for-trading
Contractualmaturityamount
Carryingvalue
Differencebetweencarrying
value andcontractual
maturityamount
Changes in fairvalue since
November 1, 2008attributable to
changes in RBCcredit spreads
Cumulativechange in fair
value attributableto changes in
RBC creditspreads (1)
Term depositsPersonal $ 2,605 $ 2,605 $ – $ 40 $ (6)Business and government (2) 40,167 40,335 168 507 (57)Bank (3) 10,880 10,880 – 3 (1)
Total term deposits $ 53,652 $ 53,820 $ 168 $ 550 $ (64)Obligations related to assets sold under repurchase
agreements and securities loaned 21,626 21,628 2 – –Subordinated debentures 120 110 (10) 36 (12)Other liabilities 240 240 – – –
Total $ 75,638 $ 75,798 $ 160 $ 586 $ (76)
(1) The cumulative change attributable to changes in our credit spreads is measured from the later of November 1, 2006, or the initial recognition of the liabilities designated as held-for-trading.(2) Business and government includes deposits from regulated deposit-taking institutions other than regulated banks.(3) Bank refers to regulated banks.
2008
Liabilities designated as held-for-trading
Contractualmaturityamount
Carryingvalue
Differencebetweencarrying
value andcontractual
maturityamount
Changes in fairvalue since
November 1, 2007attributable to
changes in RBCcredit spreads
Cumulativechange in fair
value attributableto changes in
RBC creditspreads (1)
Term depositsPersonal $ 2,724 $ 2,678 $ (46) $ (40) $ (46)Business and government (2) 67,541 67,462 (79) (449) (524)Bank (3) 7,265 7,268 3 (3) (4)
Total term deposits $ 77,530 $ 77,408 $ (122) $ (492) $ (574)Obligations related to assets sold under repurchase
agreements and securities loaned 17,877 17,870 (7) – –Subordinated debentures 122 81 (41) (41) (48)
Total $ 95,529 $ 95,359 $ (170) $ (533) $ (622)
(1) The cumulative change attributable to changes in our credit spreads is measured from the later of November 1, 2006, or the initial recognition of the liabilities designated as held-for-trading.(2) Business and government includes deposits from regulated deposit-taking institutions other than regulated banks.(3) Bank refers to regulated banks.
90 Royal Bank of Canada: Annual Report 2009 Consolidated Financial Statements

Fair value of assets and liabilities classified using the fair value hierarchyThe following table presents the financial instruments measured at fair value classified by the fair value hierarchy set out in Section 3862 asdescribed in Note 1:
As at October 31, 2009
Fair value measurements using (1) Nettingadjustments (2)
Assets/liabilities
at fair valueLevel 1 Level 2 Level 3
Financial assets
Interest bearing deposits with banks $ – $ 2,773 $ – $ – $ 2,773
SecuritiesTrading
Canadian government debt (3)
Federal – 25,269 5 – 25,274Provincial and municipal – 5,073 54 – 5,127
U.S. state, municipal and agencies debt (3) – 13,289 9 – 13,298Other OECD government debt (4) – 8,033 – – 8,033Mortgage-backed securities (3) – 20 1,052 – 1,072Asset-backed securities
CDOs (5) – – 3,074 – 3,074Non-CDO securities – 211 321 – 532
Corporate debt and other debt – 46,015 303 – 46,318Equities 34,313 119 2,902 – 37,334
$ 34,313 $ 98,029 $ 7,720 $ – $ 140,062
Available-for-sale (6)
Canadian government debt (3)
Federal – 12,161 – – 12,161Provincial and municipal 237 897 – – 1,134
U.S. state, municipal and agencies debt (3) – 3,435 2,358 – 5,793Other OECD government debt (4) 908 2,622 – – 3,530Mortgage-backed securities (3) – 4 1,848 – 1,852Asset-backed securities
CDOs – – 222 – 222Non-CDO securities – 3,050 1,155 – 4,205
Corporate debt and other debt 177 10,802 3,580 – 14,559Equities 537 147 560 – 1,244Loan substitute securities – 150 – – 150
$ 1,859 $ 33,268 $ 9,723 $ – $ 44,850
Assets purchased under reverse repurchase agreements andsecurities borrowed – 18,911 – – 18,911
Loans – 2,441 377 – 2,818
OtherDerivatives 3,413 83,739 5,289 (268) 92,173Other assets 244 – – – 244
$ 39,829 $ 239,161 $ 23,109 $ (268) $ 301,831
Financial Liabilities
DepositsPersonal $ – $ – $ 2,605 $ – $ 2,605Business and government – 35,994 4,341 – 40,335Bank – 10,880 – – 10,880
OtherObligations related to securities sold short 14,006 27,203 150 – 41,359Obligations related to assets sold under repurchase agreements
and securities loaned – 21,628 – – 21,628Derivatives 1,368 77,824 5,466 (268) 84,390Other liabilities – – 240 – 240Subordinated debentures – – 110 – 110
$ 15,374 $ 173,529 $ 12,912 $ (268) $ 201,547
(1) There were no significant transfers between Levels 1 and 2.(2) The netting adjustments represent the impact of offsetting derivative credit exposures on contracts where we have both a legally enforceable master netting agreement in place and we intend
to settle the contracts on either a net basis or simultaneously. Hence, some of the derivative related assets and liabilities are reported on a net basis.(3) As at October 31, 2009, residential and commercial MBS included in Trading securities were $12,414 million and $185 million, respectively, and in Available-for-sale securities, $8,454
million and $213 million, respectively.(4) OECD stands for Organisation for Economic Corporation and Development.(5) CDOs stand for Collateralized Debt Obligations.(6) Excludes $1,360 million of Availabe-for-sale securities that are carried at cost.
Consolidated Financial Statements Royal Bank of Canada: Annual Report 2009 91

Note 2 Fair value of financial instruments (continued)
Changes in fair value measurement for instruments categorized in Level 3The following table presents the changes in fair value measurements for instruments included in Level 3 of the fair value hierarchy set out inSection 3862 as described in Note 1:
2009
Fair valueNovember 1,
2008
Totalrealized/
unrealizedgains
(losses)included in
earnings (1)
Totalunrealized
gains (losses)included in
othercomprehensive
income (2)
Purchasesof asset/
issuancesof
liabilities
Sales ofassets/
settlementsof liabilities
andothers (3)
Transfersinto
Level 3 (1)
Transfersout of
Level 3 (1)
Fair valueOctober 31,
2009
Changes inunrealized gains(losses) included
earnings forassets and
liabilities for theyear ended
October 31, 2009for positions
still held
Assets
SecuritiesTrading
Canadian government debt (4)
Federal $ – $ – $ – $ 5 $ – $ – $ – $ 5 $ –Provincial and municipal – (13) – 2 16 51 (2) 54 –
U.S. state, municipal and agencies debt (4) 206 4 (3) 42 3 – (243) 9 (2)Other OECD government debt 150 9 7 22 (110) – (78) – –Mortgage-backed securities (4) 1,531 110 (191) 2,788 (1,645) 101 (1,642) 1,052 117Asset-backed securities
CDOs 4,208 256 (308) 337 (1,403) 85 (101) 3,074 153Non-CDO securities 605 (12) (4) 3,628 (3,780) 168 (284) 321 –
Corporate debt and other debt 1,482 (150) (63) 1,384 (2,000) 831 (1,181) 303 (9)Equities 10,315 (301) (354) 32 (7,068) 289 (11) 2,902 (256)
$ 18,497 $ (97) $ (916) $ 8,240 $ (15,987) $ 1,525 $ (3,542) $ 7,720 $ 3
Available-for-saleU.S. state, municipal and agencies debt (4) $ 2,522 $ (16) $ (215) $ 1,104 $ (1,035) $ 797 $ (799) $ 2,358 –Other OECD government debt 402 – 9 – (411) – – – –Mortgage-backed securities (4) 2,646 (183) (1) 69 (895) 212 – 1,848 –Asset-backed securities
CDOs 256 (20) 43 – (57) – – 222 –Non-CDO securities 1,568 – (102) 725 (1,045) 9 – 1,155 –
Corporate debt and other debt 3,783 (136) (306) 569 (343) 44 (31) 3,580 –Equities 78 – (67) 626 (60) 1 (18) 560 –
$ 11,255 $ (355) $ (639) $ 3,093 $ (3,846) $ 1,063 $ (848) $ 9,723 $ –
Loans – Wholesale $ 651 $ (202) $ (45) $ 26 $ (53) $ – $ – $ 377 $ 18Other
Derivatives, net of derivative related liabilities (5) (1,010) (52) (32) 4,275 (3,562) 164 40 (177) 1,159
$ 29,393 $ (706) $ (1,632) $ 15,634 $ (23,448) $ 2,752 $ (4,350) $ 17,643 $ 1,180
Liabilities
DepositsPersonal $ (2,656) $ (355) $ (42) $ (1,511) $ 1,695 $ – $ 264 $ (2,605) $ (157)Business and government (12,214) 1,120 591 18 3,346 (703) 3,501 (4,341) (1,073)
OtherObligations related to securities sold short (22) 12 (6) 459 (917) (98) 422 (150) 23Other liabilities – – – – – (240) – (240) –Subordinated debentures (81) (31) 2 – – – – (110) (31)
$ (14,973) $ 746 $ 545 $ (1,034) $ 4,124 $ (1,041) $ 4,187 $ (7,446) $ (1,238)
(1) Transfers in and out of Level 3 are assumed to occur at the end of the period. For an asset or a liability that transfers into Level 3 during the period, the entire change in fair value for theperiod is excluded from the "Total realized/unrealized gains/(losses) included in earnings" column of the reconciliation, whereas for transfers out of Level 3 during the period, the entirechange in fair value for the period is included in the said column of the reconciliation. During the year ended October 31, 2009, we transferred approximately $1.6 billion of MBS andapproximately $1.2 billion of corporate debt and other debt out of Level 3 due to the reclassification of certain Agency residential MBS and the improved price transparency, respectively. Afurther $3.5 billion of business and government deposits were transferred out of Level 3 due to the decline of credit spreads and the improved observability of credit spreads.
(2) Includes the foreign currency translation gains or losses arising on consolidation of foreign subsidiaries relating to the Level 3 instruments, where applicable. The unrealized gains or (losses)on Available-for-sale securities were $398 million for the year ended October 31, 2009, excluding the translation gains or losses.
(3) Other includes amortization of premiums or discounts recognized in net income.(4) As at October 31, 2009, residential and commercial MBS included in Trading securities were $12,414 million and $185 million, respectively, and in Available-for-sale securities were $8,454
million and $213 million, respectively.(5) Net derivatives as at October 31, 2009 included derivative assets of $5,289 million and derivative liabilities of $5,466 million.
92 Royal Bank of Canada: Annual Report 2009 Consolidated Financial Statements

Level 3 financial instruments include hedge fund investments withcertain redemption restrictions, certain structured debt securities(asset-backed securities, auction-rate securities and U.S. Non-agencyMBS), non-OECD government and corporate debt with long-datedmaturities and significant unobservable spreads, derivativesreferenced to the performance of certain CDOs, commodity swaps,credit default swaps, equity derivatives and structured notes.
Fair values of certain Level 3 instruments are based on brokerquotes, pricing services, fund managers’ information, andunobservable credit spreads and therefore, no other reasonably
possible alternative assumptions could be applied to the valuations.In addition, some of the instruments are fully hedged and anychanges in fair values of the instruments due to the use of otherreasonably possible alternative assumptions would have equal andoffsetting valuation effects on the hedges. For the significantinstruments that other reasonably possible alternative assumptionsare available to the valuation models, we used these assumptions torecalculate the fair values of the instruments, resulting in an increasein total Level 3 fair value by $103 million and a decrease of totalLevel 3 fair value of $216 million.
Note 3 Securities (1)
The following table presents the financial instruments we held at the end of the period, measured at carrying value:
Term to maturity (2)
Within 3months
3 monthsto 1 year
1 to 5years
Over 5 yearsto 10 years
Over10 years
With nospecific
maturity2009Total
2008Total
2007Total
Trading accountCanadian government debt $ 1,749 $ 4,863 $ 15,484 $ 5,023 $ 3,282 $ – $ 30,401 $ 20,911 $ 15,207U.S. government debt 1,736 1,030 2,746 1,341 6,445 – 13,298 8,728 6,603Other OECD government debt (3) 224 860 3,460 1,898 1,591 – 8,033 2,488 4,236Mortgage-backed securities (4) 36 26 379 232 637 – 1,310 2,476 4,408Asset-backed securities (4) 73 161 1,878 623 259 – 2,994 4,551 9,387Corporate debt and other debt (4)
Bankers’ acceptances 390 38 – – – – 428 13 374Certificates of deposit 349 1,047 403 27 40 – 1,866 2,174 4,712Other (5) 3,371 7,877 19,776 5,251 7,652 471 44,398 39,063 42,438
Equities – – – – – 37,334 37,334 42,104 60,120
7,928 15,902 44,126 14,395 19,906 37,805 140,062 122,508 147,485
Available-for-sale securities (1)Canadian government debt
FederalAmortized cost 45 4 11,493 209 13 – 11,764 13,123 7,742Fair value 46 4 11,883 216 12 – 12,161 13,544 7,769Yield (6) 5.5% 1.0% 3.3% 3.9% 5.7% – 3.3% 3.6% 4.5%
Provincial and municipalAmortized cost 1 242 832 19 10 – 1,104 674 279Fair value 1 242 862 19 10 – 1,134 678 278Yield (6) 1.7% 1.1% 4.3% 5.1% 4.5% – 3.7% 4.8% 4.2%
U.S. state, municipal and agencies debtAmortized cost 545 869 452 359 3,556 – 5,781 9,230 4,407Fair value 546 870 472 374 3,531 – 5,793 8,890 4,370Yield (6) .2% 1.7% 5.1% 4.4% 2.4% – 2.4% 3.8% 4.2%
Other OECD government debt (3)Amortized cost 1,579 1,365 467 102 – – 3,513 1,267 819Fair value 1,580 1,369 477 104 – – 3,530 1,270 818Yield (6) .9% 1.4% 3.7% 4.5% – – 1.6% 1.5% 1.4%
Mortgage-backed securities (5)Amortized cost – – 56 54 1,947 – 2,057 4,278 3,143Fair value – – 55 55 1,742 – 1,852 3,548 3,096Yield (6) – – 2.2% 4.9% 4.7% – 4.6% 5.6% 6.3%
Asset-backed securitiesAmortized cost 133 644 885 948 1,906 – 4,516 5,192 1,179Fair value 126 662 909 945 1,785 – 4,427 4,796 1,114Yield (6) .7% 4.0% 2.5% 1.0% 1.3% – 1.9% 4.5% 5.9%
Corporate debt and other debt (5)Amortized cost 5,073 3,128 3,163 1,061 1,914 227 14,566 13,102 9,850Fair value 5,101 3,161 3,343 1,046 1,717 191 14,559 12,785 9,794Yield (6) 2.3% 2.0% 2.9% 4.0% 2.7% 2.2% 2.5% 5.5% 4.8%
Equities (7)Cost – – – – – 2,437 2,437 3,057 2,715Fair value – – – – – 2,412 2,412 2,683 2,874
Loan substituteCost – – – – – 256 256 256 656Fair value – – – – – 186 186 227 652Yield (6) – – – – – 3.7% 3.7% 5.6% 5.1%
Amortized cost 7,376 6,252 17,348 2,752 9,346 2,920 45,994 50,179 30,790Fair value 7,400 6,308 18,001 2,759 8,797 2,789 46,054 48,421 30,765
Held-to-maturity securities (1)Amortized cost 82 2 41 14 17 – 156 205 5Fair value 82 2 41 14 17 – 156 205 5
Total carrying value of securities (1) $ 15,410 $ 22,212 $ 62,168 $ 17,168 $ 28,720 $ 40,594 $ 186,272 $ 171,134 $ 178,255
(1) Available-for-sale securities, including loan substitutes, are carried at fair value and held-to-maturity securities are carried at amortized cost.(2) Actual maturities may differ from contractual maturities shown above since borrowers may have the right to prepay obligations with or without prepayment penalties.(3) OECD stands for Organisation for Economic Co-operation and Development.(4) Includes CDOs which are presented as Asset-backed securities – CDOs in the table entitled “Fair value of assets and liabilities classified using the fair value hierarchy” in Note 2.(5) As explained in Note 1, as of November 1, 2008, we have reclassified certain securities from held-for-trading and available-for-sale to loans in accordance with the CICA’s amendments to
Section 3855. The reclassified securities are included in the 2008 balances and excluded from the 2009 balances in this table.(6) The weighted average yield is derived using the contractual interest rate and the carrying value at the end of the year for the respective securities.(7) Includes the value of the shares received in 2008 upon the Visa Inc. restructuring which are carried at cost.
Consolidated Financial Statements Royal Bank of Canada: Annual Report 2009 93

Note 3 Securities (1) (continued)
Reclassification of financial instrumentsAs reported in Note 3 to our 2008 Annual Consolidated FinancialStatements, as of August 1, 2008, we had reclassified certainsecurities from held-for-trading to available-for-sale in accordancewith the CICA’s amendments to Sections 3855, 3861 and 3862 whichwere issued in October 2008. Current year information regarding
these securities, which were not impacted by the 2009 amendmentsto Section 3855 discussed in Note 1, and additional MBS that werereclassified but not included in the table entitled “Reclassification ofsecurities from held-for-trading securities to available-for-sale” inNote 3 to our 2008 Annual Consolidated Financial Statements, ispresented in the following table.
As at and for the year ended October 31, 2009 As at and for the year ended October 31, 2008
Financial assets
Totalcarrying
value andfair value
Change infair value
during theyear (1)
Income/gains(losses)
recognizedin net income
during theyear (2)
Totalcarrying
value andfair value (3)
Change infair value
during theyear (1)
Income/gains(losses)
recognizedin net income
during theyear (2)
U.S. state, municipal and agency debt $ 1,904 $ 13 $ 54 $ 4,267 $ (87) $ 40Mortgage-backed securities 500 67 28 939 (167) 17Asset-backed securities 1,007 48 29 1,326 (122) 9Corporate debt and other debt 641 (2) 17 723 (102) 8
$ 4,052 $ 126 $ 128 $ 7,255 $ (478) $ 74
(1) This amount represents the change in fair value of securities we held at the end of the period and includes any principal draw downs or redemptions on these securities.(2) The total amount includes net income of $27 million related to securities and debt redeemed or sold during the year ended October 31, 2009 (year ended October 31, 2008 – $nil).(3) Certain amounts presented have been reclassified from those reported in prior periods. The reclassifications have no impact to the total balance.
Unrealized gains and losses on available-for-sale securities (1), (2)
2009 2008
Amortizedcost
Grossunrealized
gains
Grossunrealized
lossesFair
valueAmortized
cost
Grossunrealized
gains
Grossunrealized
lossesFair
value
Canadian government debtFederal $ 11,764 $ 404 $ (7) $ 12,161 $ 13,123 $ 422 $ (1) $ 13,544Provincial and municipal 1,104 31 (1) 1,134 674 5 (1) 678
U.S. federal, state, municipal and agencies debt 5,781 129 (117) 5,793 9,230 16 (356) 8,890Other OECD government debt 3,517 18 (1) 3,534 1,271 4 (1) 1,274Mortgage-backed securities (3) 2,057 24 (229) 1,852 4,280 4 (734) 3,550Asset-backed securities
CDOs 234 11 (24) 222 335 1 (82) 253Non-CDO securities 4,282 67 (143) 4,205 4,857 10 (325) 4,543
Corporate debt and other debt (3) 14,718 382 (389) 14,711 13,301 136 (453) 12,984Equities 2,437 45 (70) 2,412 3,057 4 (378) 2,683Loan substitute securities 256 – (70) 186 256 – (29) 227
$ 46,150 $ 1,111 $ (1,051) $ 46,210 $ 50,384 $ 602 $ (2,360) $ 48,626
(1) Includes $156 million (2008 – $205 million) held-to-maturity securities.(2) The majority of the MBS are residential. Amortized cost, gross unrealized gains, gross unrealized losses and fair value related to commercial MBS are $224 million, $1 million, $(11) million
and $213 million, respectively for 2009 (2008 – $249 million, $nil, $(14) million and $235 million).(3) As explained in Note 1, as of November 1, 2008, we have reclassified certain securities from available-for-sale to loans in accordance with the CICA’s amendments to Section 3855. The
reclassified securities are included in the 2008 balances in this table but excluded from the 2009 balances.
Realized gains and losses on available-for-sale securities (1), (2)
2009 2008 2007
Realized gains $ 296 $ 99 $ 204Realized losses and writedowns (936) (731) (124)
Net (losses) gains on available-for-sale securities $ (640) $ (632) $ 80
(1) Available-for-sale securities, including loan substitutes, are carried at fair value and held-to-maturity securities are carried at amortized cost.(2) The following related to our insurance operations are included in the Insurance premiums, investment and fee income line on the Consolidated Statements of Income: Realized gains – 2009
– $12 million, 2008 – $1 million, and 2007 – $17 million; Realized losses and writedowns – 2009 – $22 million, 2008 – $16 million, and 2007 – $nil.
94 Royal Bank of Canada: Annual Report 2009 Consolidated Financial Statements

Fair value and unrealized losses position for available-for-sale securities
2009 (1)
Less than 12 months 12 months or more Total
Fairvalue
Unrealizedlosses
Fairvalue
Unrealizedlosses
Fairvalue
Unrealizedlosses
Canadian government debtFederal $ 1,108 $ 7 $ – $ – $ 1,108 $ 7Provincial and municipal 13 1 – – 13 1
U.S. state, municipal and agencies debt 154 7 1,081 110 1,235 117Other OECD government debt 456 1 44 – 500 1Mortgage-backed securities (2) 83 11 1,475 218 1,558 229Asset-backed securities
CDOs – – 205 24 205 24Non-CDO securities 770 8 721 135 1,491 143
Corporate debt and other debt (2) 924 42 1,321 347 2,245 389Equities 60 42 103 28 163 70Loan substitute securities – – 150 70 150 70
Total temporarily impaired securities $ 3,568 $ 119 $ 5,100 $ 932 $ 8,668 $ 1,051
(1) The majority of the MBS are residential. Fair value and unrealized losses of commercial MBS for less than 12 months are $nil and $nil, respectively and for 12 months or more are $156million and $11 million, respectively.
(2) As explained in Note 1, as of November 1, 2008, we have reclassified certain securities from available-for-sale to loans in accordance with the CICA’s amendments to Section 3855. Thereclassified securities are included in the 2008 balances in the table below, but excluded from the 2009 balances.
2008 (1)
Less than 12 months 12 months or more Total
Fairvalue
Unrealizedlosses
Fairvalue
Unrealizedlosses
Fairvalue
Unrealizedlosses
Canadian government debtFederal $ 126 $ 1 $ – $ – $ 126 $ 1Provincial and municipal 236 1 – – 236 1
U.S. state, municipal and agencies debt 6,546 321 270 35 6,816 356Other OECD government debt 99 1 – – 99 1Mortgage-backed securities 2,128 348 996 386 3,124 734Asset-backed securities
CDOs – – 246 82 246 82Non-CDO securities 4,073 314 115 11 4,188 325
Corporate debt and other debt 3,360 294 633 159 3,993 453Equities 970 217 347 161 1,317 378Loan substitute securities – – 191 29 191 29
Total temporarily impaired securities $ 17,538 $ 1,497 $ 2,798 $ 863 $ 20,336 $ 2,360
(1) The majority of the MBS are residential. Fair value and unrealized losses of commercial MBS for less than 12 months are $103 million and $3 million, respectively and for 12 months or moreare $109 million and $11 million, respectively.
Available-for-sale and held-to-maturity securities are assessed forimpairment at each reporting date and more frequently whenconditions warrant. Our impairment review is primarily based on thefactors described in Note 1. Depending on the nature of the securitiesunder review we apply specific methodology to assess whether it isprobable that the amortized cost of the security would be recovered.As at October 31, 2009, our gross unrealized losses onavailable-for-sale and held-to-maturity securities were $1,051 million.
When assessing other-than-temporary impairment for debtinstruments including Government, State, Municipal, Agency andCorporate debt and perpetual preferred shares we primarilyconsidered counterparty ratings and security-specific factors,including internal and external ratings, subordination, transactionstructure, credit enhancement and other market and security-specificfactors. For more complex debt instruments including Non-agencyU.S. MBS, asset-backed securities (ABS) and other structuredproducts, we primarily use cash flow projection models whichincorporate actual and projected cash flows for each security using anumber of assumptions and inputs that are based on security specificfactors. The inputs and assumptions used such as default,prepayment and recovery rates are based on updated market data,the latter being largely dependent upon forecasted house priceswhich were assessed at the municipal level, provided by a third-partyvendor. We also consider internal and external ratings, subordination,transaction structure, credit enhancement and other market andsecurity-specific factors. We do a further review of the security, if themodel predicts that it is probable that we will not be able to recover
the entire principal and interest amount in order to assess whether aloss would ultimately be realized.
With respect to debt securities where, based on management’sjudgment, it was not probable that all principal and interest would berecovered, the securities were deemed to be other-than-temporarilyimpaired and were written down to their fair value.
As equity securities do not have contractual cash flows, they areassessed differently than debt securities. For equity securities held atcost and those with unrealized losses we assess whether there is anyobjective evidence that suggest that the security is other-than-temporarily impaired. The factors we consider include the length oftime and extent the fair value has been below the cost, the financialcondition and near term prospects of the issuer. We also consider theestimated recoverable value and the period of recovery. We conductfurther analysis for securities where the fair value had been belowcost for greater than twelve months. For equity securities, wheremanagement believes that the fair value will not recover prior to theirdisposition, there has been an unrealized loss for a prolonged periodof time or the unrealized loss is significant, these securities weredeemed to be other-than-temporarily impaired and were written downto their fair value.
The majority of the $117 million unrealized loss on U.S. state,municipal and agencies debt securities related to U.S. agency MBSand U.S. auction rate securities (ARS). The issuing agencies aresupported by the U.S. government and the unrealized losses on thesesecurities largely reflect the liquidity concerns in the current market.
Consolidated Financial Statements Royal Bank of Canada: Annual Report 2009 95

Note 3 Securities (1) (continued)
The MBS largely consist of Non-agency U.S. Alt-A, prime andsubprime securities. The U.S. Alt-A and the prime are high qualitysuper senior tranches with credit support through subordination,overcollateralization, and excess spread. The unrealized losses of$229 million are primarily on Alt A and prime securities. The losses onNon-agency U.S. MBS are significantly lower compared to the prioryear reflecting the price improvements during the year resulting fromimproved U.S. housing and financial markets.
ABS are mainly comprised of U.S. insured and uninsured studentloans U.S. ARS, CDOs and securities backed by credit card receiv-ables. The majority of these instruments are highly rated withsignificant credit support and have experienced significant priceimprovements over the year. There are unrealized losses of $167million which primarily relate to U.S. ARS and uninsured studentloans. Based on our assessment, these losses are temporary innature and we do not intend to sell these securities prior to recoveryof value.
Corporate and other debt mainly includes certificate of depositsissued by global financial institutions, corporate debt and bonds,Non-OECD government securities and hybrid instruments. Themajority of these securities are highly rated and are well diversifiedwith global financial institutions being the largest concentration. TheNon-OECD government securities are primarily related to Caribbeancountries where we have ongoing operations. The net unrealizedlosses of $389 million are significantly lower compared to a year agoand mainly reflect the low interest rate environment and improvedspreads.
Equity holdings are largely comprised of publicly traded commonand preferred shares. To a lesser extent, we also hold investments inprivate and venture companies. As at October 31, 2009, the Canadianbank common shares that we hold were deemed to be other-than-temporarily impaired due to the prolonged decline in value and werewritten down to their fair value. The remaining unrealized losses of$70 million mainly relates to publicly traded common and preferredshares.
The loan substitute securities are predominantly perpetualpreferred shares of highly rated Canadian entities.
Based on our assessment, the unrealized losses on the abovementioned securities as at October 31, 2009, are temporary in natureand we intend to hold them until recovery of their fair value whichmay be on maturity of the debt securities.
Held-to-maturity securitiesHeld-to-maturity securities stated at amortized costs are subject toperiodic impairment review and are classified as impaired when, inmanagement’s opinion, there is no longer reasonable assurance ofthe timely collection of the full amount of principal or interest. Inaccordance with the recent amendments to CICA Section 3855 ourimpairment review of held-to-maturity securities is primarily based onthe impairment model for loans as described in Note 1 to the financialstatements. Based on our assessment, there is no impairment onheld-to-maturity investments as at October 31, 2009.
Net gains /losses on Available-for-sale securitiesWhen we determine that a security is other-than-temporarilyimpaired, the amortized cost of the security is written down to fairvalue and the previous loss in AOCI is reclassified in net income.During 2009, $640 million of net losses were recognized in netincome (2008 – $631 million) on available-for sale securities. Themajority of these losses were attributable to Non-agency U.S. MBS,Canadian bank common shares, hybrid instruments and CDOs. Thelosses also included write-downs of securities we intend to sell.Included in this amount is $21 million of write-down for ouravailable-for-sale securities relating to our insurance operationswhich has been reflected in the Insurance premiums, investment andfee income line on our Consolidated Statements of Income (2008 –$10 million). During 2009, $17 million net gains (2008 – $1 millionnet loss) were realized due to sales of available-for-sale securities.
Interest and dividends on available-for-sale and held-to-maturity securities (1), (2)
2009 2008 2007
Taxable interest income (3) $ 2,362 $ 2,089 $ 1,373Non-taxable interest income 110 99 31Dividends 82 110 85
$ 2,554 $ 2,298 $ 1,489
(1) Available-for-sale securities, including loan substitutes, are carried at fair value and held-to-maturity securities are carried at amortized cost.(2) The following related to our insurance operations are included in the Insurance premiums, investment and fee income line on the Consolidated Statements of Income: Taxable interest income
– 2009 – $601 million, 2008 – $452 million, and 2007 – $405 million; Non-taxable interest income – 2009 – $33 million, 2008 – $29 million and 2007 – $29 million; Dividends – 2009 –$15 million, 2008 – $17 million, and 2007 – $11 million.
(3) As explained in Note 1, as of November 1, 2008, we have reclassified certain securities from available-for-sale to loans in accordance with CICA’s amendments to Section 3855. Interestincome recognized on the reclassified loans are included in the 2008 balances in this table but excluded from the 2009 balances.
96 Royal Bank of Canada: Annual Report 2009 Consolidated Financial Statements
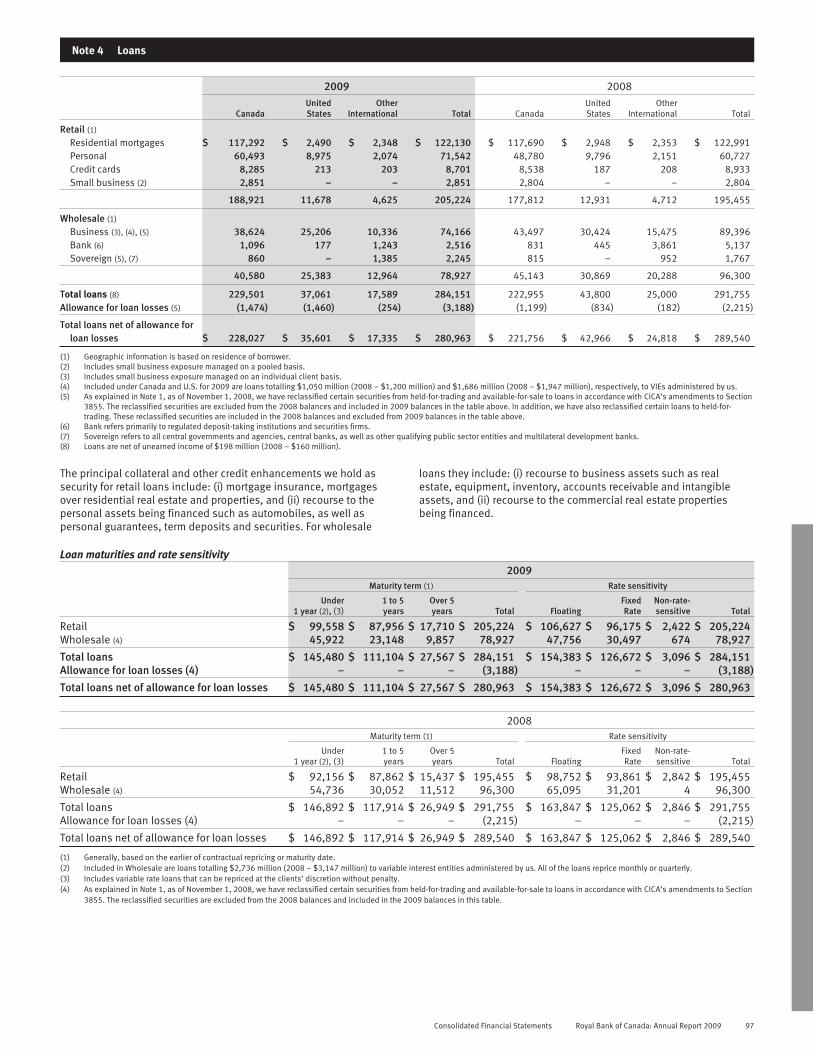
Note 4 Loans
2009 2008
CanadaUnitedStates
OtherInternational Total Canada
UnitedStates
OtherInternational Total
Retail (1)
Residential mortgages $ 117,292 $ 2,490 $ 2,348 $ 122,130 $ 117,690 $ 2,948 $ 2,353 $ 122,991Personal 60,493 8,975 2,074 71,542 48,780 9,796 2,151 60,727Credit cards 8,285 213 203 8,701 8,538 187 208 8,933Small business (2) 2,851 – – 2,851 2,804 – – 2,804
188,921 11,678 4,625 205,224 177,812 12,931 4,712 195,455
Wholesale (1)
Business (3), (4), (5) 38,624 25,206 10,336 74,166 43,497 30,424 15,475 89,396Bank (6) 1,096 177 1,243 2,516 831 445 3,861 5,137Sovereign (5), (7) 860 – 1,385 2,245 815 – 952 1,767
40,580 25,383 12,964 78,927 45,143 30,869 20,288 96,300
Total loans (8) 229,501 37,061 17,589 284,151 222,955 43,800 25,000 291,755Allowance for loan losses (5) (1,474) (1,460) (254) (3,188) (1,199) (834) (182) (2,215)
Total loans net of allowance forloan losses $ 228,027 $ 35,601 $ 17,335 $ 280,963 $ 221,756 $ 42,966 $ 24,818 $ 289,540
(1) Geographic information is based on residence of borrower.(2) Includes small business exposure managed on a pooled basis.(3) Includes small business exposure managed on an individual client basis.(4) Included under Canada and U.S. for 2009 are loans totalling $1,050 million (2008 – $1,200 million) and $1,686 million (2008 – $1,947 million), respectively, to VIEs administered by us.(5) As explained in Note 1, as of November 1, 2008, we have reclassified certain securities from held-for-trading and available-for-sale to loans in accordance with CICA’s amendments to Section
3855. The reclassified securities are excluded from the 2008 balances and included in 2009 balances in the table above. In addition, we have also reclassified certain loans to held-for-trading. These reclassified securities are included in the 2008 balances and excluded from 2009 balances in the table above.
(6) Bank refers primarily to regulated deposit-taking institutions and securities firms.(7) Sovereign refers to all central governments and agencies, central banks, as well as other qualifying public sector entities and multilateral development banks.(8) Loans are net of unearned income of $198 million (2008 – $160 million).
The principal collateral and other credit enhancements we hold assecurity for retail loans include: (i) mortgage insurance, mortgagesover residential real estate and properties, and (ii) recourse to thepersonal assets being financed such as automobiles, as well aspersonal guarantees, term deposits and securities. For wholesale
loans they include: (i) recourse to business assets such as realestate, equipment, inventory, accounts receivable and intangibleassets, and (ii) recourse to the commercial real estate propertiesbeing financed.
Loan maturities and rate sensitivity2009
Maturity term (1) Rate sensitivity
Under1 year (2), (3)
1 to 5years
Over 5years Total Floating
FixedRate
Non-rate-sensitive Total
Retail $ 99,558 $ 87,956 $ 17,710 $ 205,224 $ 106,627 $ 96,175 $ 2,422 $ 205,224Wholesale (4) 45,922 23,148 9,857 78,927 47,756 30,497 674 78,927
Total loans $ 145,480 $ 111,104 $ 27,567 $ 284,151 $ 154,383 $ 126,672 $ 3,096 $ 284,151Allowance for loan losses (4) – – – (3,188) – – – (3,188)
Total loans net of allowance for loan losses $ 145,480 $ 111,104 $ 27,567 $ 280,963 $ 154,383 $ 126,672 $ 3,096 $ 280,963
2008Maturity term (1) Rate sensitivity
Under1 year (2), (3)
1 to 5years
Over 5years Total Floating
FixedRate
Non-rate-sensitive Total
Retail $ 92,156 $ 87,862 $ 15,437 $ 195,455 $ 98,752 $ 93,861 $ 2,842 $ 195,455Wholesale (4) 54,736 30,052 11,512 96,300 65,095 31,201 4 96,300
Total loans $ 146,892 $ 117,914 $ 26,949 $ 291,755 $ 163,847 $ 125,062 $ 2,846 $ 291,755Allowance for loan losses (4) – – – (2,215) – – – (2,215)
Total loans net of allowance for loan losses $ 146,892 $ 117,914 $ 26,949 $ 289,540 $ 163,847 $ 125,062 $ 2,846 $ 289,540
(1) Generally, based on the earlier of contractual repricing or maturity date.(2) Included in Wholesale are loans totalling $2,736 million (2008 – $3,147 million) to variable interest entities administered by us. All of the loans reprice monthly or quarterly.(3) Includes variable rate loans that can be repriced at the clients’ discretion without penalty.(4) As explained in Note 1, as of November 1, 2008, we have reclassified certain securities from held-for-trading and available-for-sale to loans in accordance with CICA’s amendments to Section
3855. The reclassified securities are excluded from the 2008 balances and included in the 2009 balances in this table.
Consolidated Financial Statements Royal Bank of Canada: Annual Report 2009 97
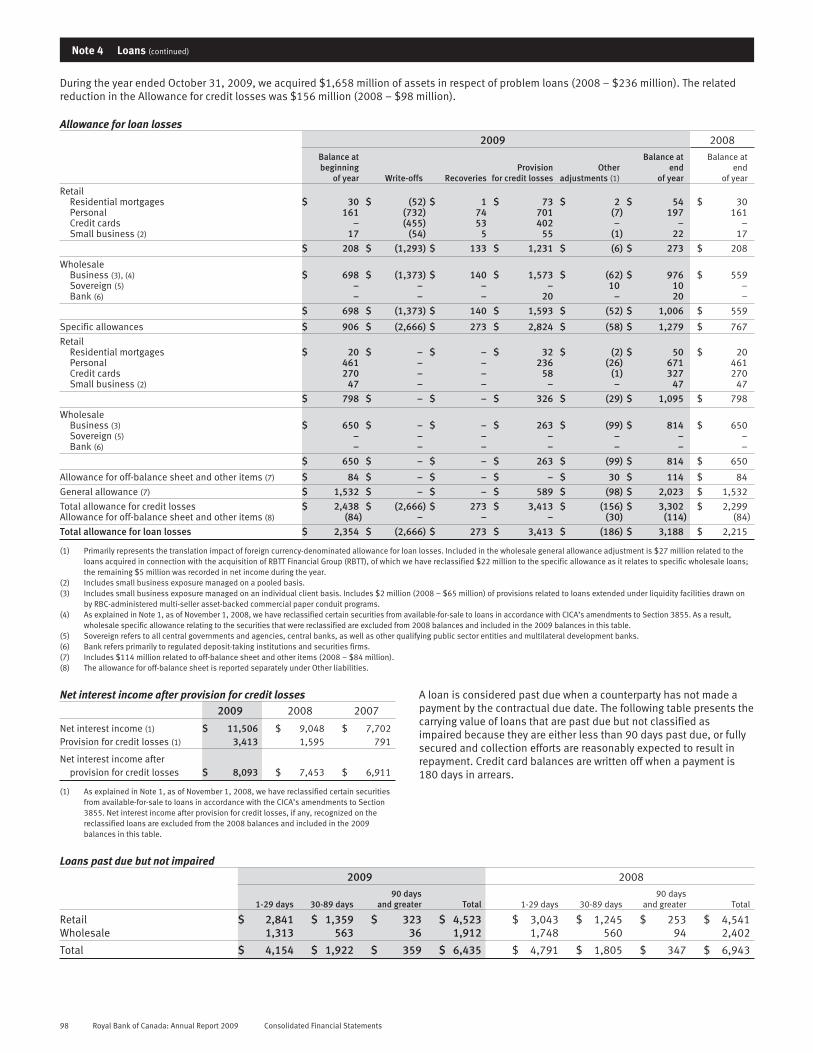
Note 4 Loans (continued)
During the year ended October 31, 2009, we acquired $1,658 million of assets in respect of problem loans (2008 – $236 million). The relatedreduction in the Allowance for credit losses was $156 million (2008 – $98 million).
Allowance for loan losses2009 2008
Balance atbeginning
of year Write-offs RecoveriesProvision
for credit lossesOther
adjustments (1)
Balance atend
of year
Balance atend
of year
RetailResidential mortgages $ 30 $ (52) $ 1 $ 73 $ 2 $ 54 $ 30Personal 161 (732) 74 701 (7) 197 161Credit cards – (455) 53 402 – – –Small business (2) 17 (54) 5 55 (1) 22 17
$ 208 $ (1,293) $ 133 $ 1,231 $ (6) $ 273 $ 208
WholesaleBusiness (3), (4) $ 698 $ (1,373) $ 140 $ 1,573 $ (62) $ 976 $ 559Sovereign (5) – – – – 10 10 –Bank (6) – – – 20 – 20 –
$ 698 $ (1,373) $ 140 $ 1,593 $ (52) $ 1,006 $ 559
Specific allowances $ 906 $ (2,666) $ 273 $ 2,824 $ (58) $ 1,279 $ 767
RetailResidential mortgages $ 20 $ – $ – $ 32 $ (2) $ 50 $ 20Personal 461 – – 236 (26) 671 461Credit cards 270 – – 58 (1) 327 270Small business (2) 47 – – – – 47 47
$ 798 $ – $ – $ 326 $ (29) $ 1,095 $ 798
WholesaleBusiness (3) $ 650 $ – $ – $ 263 $ (99) $ 814 $ 650Sovereign (5) – – – – – – –Bank (6) – – – – – – –
$ 650 $ – $ – $ 263 $ (99) $ 814 $ 650
Allowance for off-balance sheet and other items (7) $ 84 $ – $ – $ – $ 30 $ 114 $ 84
General allowance (7) $ 1,532 $ – $ – $ 589 $ (98) $ 2,023 $ 1,532
Total allowance for credit losses $ 2,438 $ (2,666) $ 273 $ 3,413 $ (156) $ 3,302 $ 2,299Allowance for off-balance sheet and other items (8) (84) – – – (30) (114) (84)
Total allowance for loan losses $ 2,354 $ (2,666) $ 273 $ 3,413 $ (186) $ 3,188 $ 2,215
(1) Primarily represents the translation impact of foreign currency-denominated allowance for loan losses. Included in the wholesale general allowance adjustment is $27 million related to theloans acquired in connection with the acquisition of RBTT Financial Group (RBTT), of which we have reclassified $22 million to the specific allowance as it relates to specific wholesale loans;the remaining $5 million was recorded in net income during the year.
(2) Includes small business exposure managed on a pooled basis.(3) Includes small business exposure managed on an individual client basis. Includes $2 million (2008 – $65 million) of provisions related to loans extended under liquidity facilities drawn on
by RBC-administered multi-seller asset-backed commercial paper conduit programs.(4) As explained in Note 1, as of November 1, 2008, we have reclassified certain securities from available-for-sale to loans in accordance with CICA’s amendments to Section 3855. As a result,
wholesale specific allowance relating to the securities that were reclassified are excluded from 2008 balances and included in the 2009 balances in this table.(5) Sovereign refers to all central governments and agencies, central banks, as well as other qualifying public sector entities and multilateral development banks.(6) Bank refers primarily to regulated deposit-taking institutions and securities firms.(7) Includes $114 million related to off-balance sheet and other items (2008 – $84 million).(8) The allowance for off-balance sheet is reported separately under Other liabilities.
Net interest income after provision for credit losses2009 2008 2007
Net interest income (1) $ 11,506 $ 9,048 $ 7,702Provision for credit losses (1) 3,413 1,595 791
Net interest income afterprovision for credit losses $ 8,093 $ 7,453 $ 6,911
(1) As explained in Note 1, as of November 1, 2008, we have reclassified certain securitiesfrom available-for-sale to loans in accordance with the CICA’s amendments to Section3855. Net interest income after provision for credit losses, if any, recognized on thereclassified loans are excluded from the 2008 balances and included in the 2009balances in this table.
A loan is considered past due when a counterparty has not made apayment by the contractual due date. The following table presents thecarrying value of loans that are past due but not classified asimpaired because they are either less than 90 days past due, or fullysecured and collection efforts are reasonably expected to result inrepayment. Credit card balances are written off when a payment is180 days in arrears.
Loans past due but not impaired2009 2008
1-29 days 30-89 days90 days
and greater Total 1-29 days 30-89 days90 days
and greater Total
Retail $ 2,841 $ 1,359 $ 323 $ 4,523 $ 3,043 $ 1,245 $ 253 $ 4,541Wholesale 1,313 563 36 1,912 1,748 560 94 2,402
Total $ 4,154 $ 1,922 $ 359 $ 6,435 $ 4,791 $ 1,805 $ 347 $ 6,943
98 Royal Bank of Canada: Annual Report 2009 Consolidated Financial Statements

Impaired loans (1)
2009 2008
GrossSpecific
allowances Net Net
RetailResidential mortgages $ 641 $ (54) $ 587 $ 310Personal 409 (197) 212 187Small business (2) 59 (22) 37 23
$ 1,109 $ (273) $ 836 $ 520
WholesaleBusiness (3), (4) $ 4,276 $ (976) $ 3,300 $ 1,636Sovereign (5) 10 (10) – –Bank (6) 62 (20) 42 –
$ 4,348 $ (1,006) $ 3,342 $ 1,636Total $ 5,457 $ (1,279) $ 4,178 $ 2,156
(1) Average balance of gross impaired loans for the year was $4,643 million (2008 – $1,906 million).(2) Includes small business exposure managed on a pooled basis.(3) Includes small business exposure managed on an individual client basis. Includes gross and net impaired loans of $65 million (2008 – $203 million) and $63 million (2008 – $138 million),
respectively, related to loans extended under liquidity facilities drawn on by RBC-administered multi-seller asset-backed commercial paper conduit programs.(4) As explained in Note 1, as of November 1, 2008, we have reclassified certain securities from available-for-sale to loans in accordance with CICA’s amendments to Section 3855. The
reclassified securities are excluded from the 2008 balances and included in the 2009 balances in this table.(5) Sovereign refers to all central governments and agencies, central banks, as well as other qualifying public sector entities and multilateral development banks.(6) Bank refers primarily to regulated deposit-taking institutions and securities firms.
Note 5 Securitizations
Securitization activities by major product typeWe periodically securitize our credit card receivables, residentialmortgage loans and bond securitizations primarily to diversify ourfunding sources, enhance our liquidity position and for capitalpurposes. We also securitize residential and commercial mortgageloans for sales and trading activities.
Credit card receivablesWe securitize a portion of our credit card receivables through a SPE ona revolving basis. The SPE is financed through the issuance of seniorand subordinated notes collateralized by the underlying credit cardreceivables. The issuances are rated by at least two of Dominion BondRating Service (DBRS), Moody’s Investors Service (Moody’s) andStandard & Poor’s (S&P). This SPE meets the criteria for a QSPE and,accordingly, as the transferor of the credit card receivables, we areprecluded from consolidating it.
Our continuing involvement includes servicing the credit cardreceivables sold to the QSPE and performing an administrative rolefor the QSPE. We also provide first-loss protection to the QSPE in twoforms. First, we have an interest in the excess spread from the QSPEwhich is subordinate to the QSPE’s obligation to the holders of itsasset-backed securities. Excess spread is the residual net interestincome after all trust expenses have been paid. Our excess spreadserves to absorb losses with respect to the credit card receivablesbefore payments to the QSPE’s noteholders are affected. The presentvalue of this excess spread is reported as a retained interest withinour AFS securities on our Consolidated Balance Sheets. In addition,we provide loans to the QSPE to pay upfront expenses. These loansrank subordinate to all notes issued by the QSPE.
We own all of the subordinated securities issued by the QSPEand report them within our AFS securities in our Consolidated BalanceSheets. The subordinated securities owned by us representapproximately 4.5% of the total securities issued by the QSPE as atOctober 31, 2009 and provide credit support for the senior securities.We also act as counterparty in interest rate and cross currency swapagreements under which we pay the QSPE the interest due toinvestors, we may own some senior securities as investments or formarket-making activities and retain a cash reserve account from timeto time.
Canadian residential mortgage loansWe securitize insured Canadian residential mortgage loans throughthe creation of MBS and sell a portion of these MBS as part ofgovernment auctions as well as to a government-sponsored SPE on arevolving basis. The SPE is financed through the issuance ofgovernment-guaranteed mortgage bonds which are sold to third partyinvestors. Proceeds of the issuances are used by the SPE to purchasethe government-guaranteed MBS from eligible sellers.
Our continuing involvement includes servicing the underlyingmortgages we have securitized ourselves or through an independentservicer. We also retain interests in the form of excess spread on thesold MBS. The present value of this excess spread is reported as aretained interest within our available-for-sale or held-for-tradingsecurities on our Consolidated Balance Sheets. In addition, we alsoact as counterparty in interest rate swap agreements under which wepay the SPE the interest due to investors and receive the interest onthe government-guaranteed MBS relating to our sold portion.
U.S. residential mortgage loansWe originate and sell U.S. residential mortgage loans into thesecondary mortgage market to issuers or guarantors of MBS. Theissuers are usually government-sponsored entities which securitizethese mortgages into MBS securities and guarantee as to timelypayment of principal and interest. Our continuing involvementincludes only servicing the underlying mortgages we have sold forfunding and liquidity purposes ourselves or through an independentservicer.
Commercial mortgage loansWe securitize commercial mortgages by selling them in collateralpools, which meet certain diversification, leverage and debt coveragecriteria, to SPEs, one of which is sponsored by us. The SPEs financethe purchase of these pools by issuing certificates with varyingdegrees of subordination. The certificates issued by the SPE which wesponsor range from AAA to B- and are rated by any two of DBRS,Moody’s and S&P. The most subordinated certificates are unrated.The certificates represent undivided interests in the collateral pool,and the SPE which we sponsor, having sold all undivided interestsavailable in the pool, retains none of the risk of the collateral pools.
Consolidated Financial Statements Royal Bank of Canada: Annual Report 2009 99

Note 5 Securitizations (continued)
We do not retain any beneficial interests in the loans sold unlesswe purchase some of the securities issued by the SPEs for our ownaccount. We are the primary servicer under contract with a third-partymaster servicer for the loans that are sold to our sponsored SPE.
Bond SecuritizationsWe participate in bond securitizations activities where we purchasegovernment, government related and corporate bonds, repackages
those bonds in participation certificates, add a structure fee incomeand sell to third party investors. The structure fee income is recog-nized in our Income Statement at the time of sale to third partyinvestors. Our continuing involvement includes only servicing theunderlying bonds we sold to third party investors and we do not retainany beneficial interest unless we purchase some of the certificatesissued.
The following table summarizes our securitization activities for 2009, 2008 and 2007.
2009 (1) 2008 2007 (1)
Canadianresidential
mortgageloans
(2), (4), (7)
U.S.residential
mortgageloans (5)
Bondparticipation
certificates(2), (8)
Creditcard
loans(2), (3)
Canadianresidential
mortgageloans
(2), (4), (7)
U.S.residential
mortgageloans (5)
Commercialmortgage
loans(2), (6)
Bondparticipation
certificates(2), (8)
Canadianresidential
mortgageloans
(2), (4), (7)
U.S.residential
mortgageloans (5)
Commercialmortgage
loans(2), (6)
Securitized and sold $ 21,392 $ 568 $ 15 $ 1,470 $ 7,892 $ 516 $ 166 $ 47 $ 6,188 $ 295 $ 1937Net cash proceeds received 21,202 570 16 1,404 7,846 519 156 48 6,097 298 1876Asset-backed securities
purchased – – – 65 – – 9 – – – 47Retained rights to future excess
interest 1,121 – – 9 242 – – – 146 – –Pre-tax gain (loss) on
sale, net of hedging activities 770 2 1 8 168 3 (1) 1 55 3 (14)
(1) We did not securitize any credit card loans during the period.(2) We did not recognize an asset or a liability for our servicing rights with respect to the securitized transactions as we received adequate compensation for our services.(3) With respect to the securitization of credit card loans in 2008, the net cash proceeds received represent gross cash proceeds of $1,469 million less funds used to purchase notes of
$65 million issued by Golden Credit Card Trust. The principal value of the notes was $65 million.(4) Canadian insured residential mortgage loans securitized during the year through the creation of MBS and retained as at October 31, 2009 were $6,745 million (2008 – $9,464 million; 2007
– $3,110 million). These securities are carried at fair value.(5) U.S. residential mortgage loans securitized and sold include insured and non-insured mortgages. We recognized nominal servicing rights with respect to securitized loans during the period.
None of these securities were retained.(6) During the year ended October 31, 2008, the net cash proceeds received represent gross proceeds of $165 million (2007 – $1,923 million) less funds used to purchase notes of $9 million
(2007 – $47 million). The principal value of the notes was $10 million (2007 – $48 million). There were no activities during 2009.(7) Pre-tax gain (loss) on sale includes the results of our economic hedging activities of $(161) million (2008 – $(28) million). Economic hedging activities during 2007 were nominal.(8) Includes bond securitizations activities of RBTT. None of the securities sold were retained.
Cash flows from securitizations (1)
2009 2008 2007
Creditcard
loans
Canadianresidential
mortgageloans
Creditcard
loans
Canadianresidential
mortgageloans
Creditcard
loans
Canadianresidential
mortgageloans
Proceeds reinvested in revolving securitizations $ 17,157 $ 14,100 $ 17,934 $ 4,320 $ 15,684 $ 4,602Cash flows from excess spread (2) 270 629 254 179 256 234Other cash flows received (3) 42 – 39 – 48 –
(1) This analysis is not applicable for commercial mortgage loans, U.S. residential mortgage loans and bond securitizations as we have not retained rights to future excess spread in thesetransactions.
(2) Includes servicing fees received.(3) Includes cash flows received on AFS securities held by us including principal and interest payment received.
The key assumptions used to value the retained interests at the date of the securitization activities are as follows:
Key assumptions (1), (2)
2009 (3) 2008 2007 (3)
Canadianresidential
mortgage loansCredit card
loans
Canadianresidential
mortgage loans
Canadianresidential
mortgage loans
Expected weighted average life of prepayable receivables (in years) 2.70 .25 4.05 2.91Payment rate 26.76% 37.02% 27.55% 28.59%Excess spread, net of credit losses 2.34 3.86 1.05 .86Discount rate .40 - 3.07% 10.00% 2.22 - 4.77% 4.15 - 5.05%
(1) All rates are annualized except the payment rate for credit card loans which is monthly.(2) This analysis is not applicable for commercial mortgage loans, U.S. residential mortgage loans and bond securitizations as we have not retained rights to future excess spread in these
transactions.(3) We did not securitize any credit card loans during the period.
Static pool credit losses provide a measure of the credit risk in oursecuritized assets and are calculated by totalling actual incurred andprojected credit losses and dividing the result by the original balanceof the loans securitized. The expected static pool credit loss ratio for
securitized credit card loans at October 31, 2009 was .87% (2008 –.54%). Static credit pool losses are not applicable to residentialmortgages as substantially all the mortgages are governmentguaranteed.
100 Royal Bank of Canada: Annual Report 2009 Consolidated Financial Statements
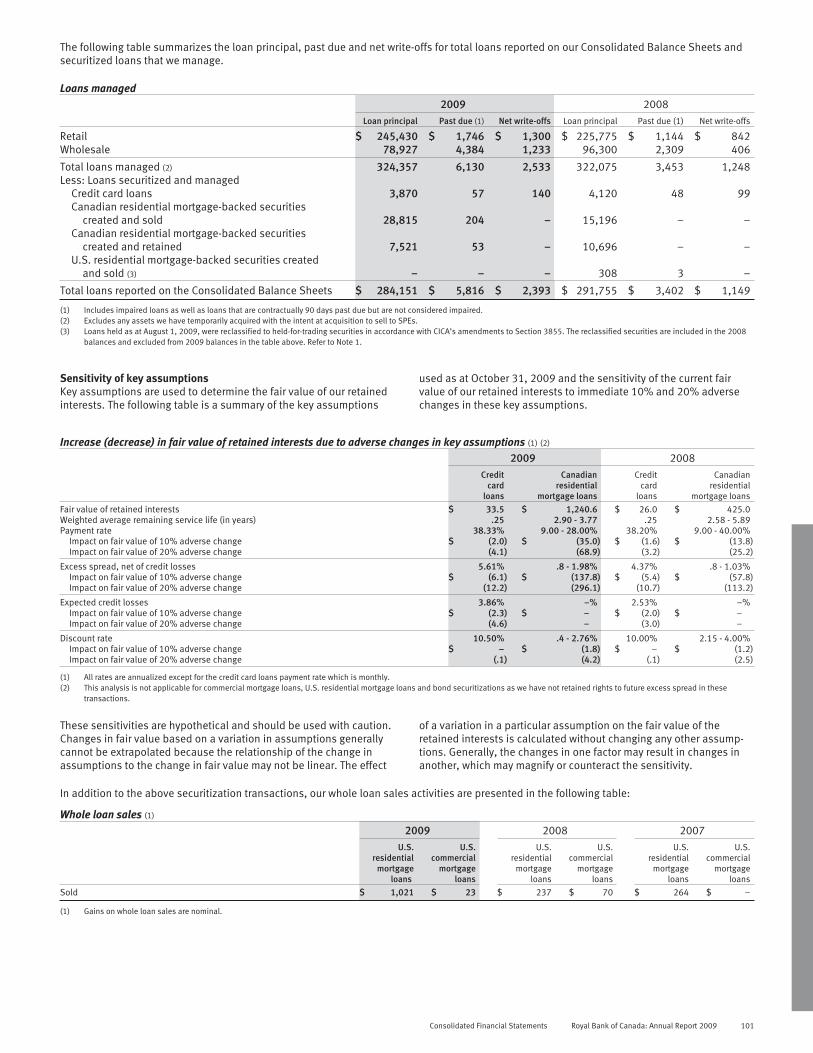
The following table summarizes the loan principal, past due and net write-offs for total loans reported on our Consolidated Balance Sheets andsecuritized loans that we manage.
Loans managed2009 2008
Loan principal Past due (1) Net write-offs Loan principal Past due (1) Net write-offs
Retail $ 245,430 $ 1,746 $ 1,300 $ 225,775 $ 1,144 $ 842Wholesale 78,927 4,384 1,233 96,300 2,309 406
Total loans managed (2) 324,357 6,130 2,533 322,075 3,453 1,248Less: Loans securitized and managed
Credit card loans 3,870 57 140 4,120 48 99Canadian residential mortgage-backed securities
created and sold 28,815 204 – 15,196 – –Canadian residential mortgage-backed securities
created and retained 7,521 53 – 10,696 – –U.S. residential mortgage-backed securities created
and sold (3) – – – 308 3 –
Total loans reported on the Consolidated Balance Sheets $ 284,151 $ 5,816 $ 2,393 $ 291,755 $ 3,402 $ 1,149
(1) Includes impaired loans as well as loans that are contractually 90 days past due but are not considered impaired.(2) Excludes any assets we have temporarily acquired with the intent at acquisition to sell to SPEs.(3) Loans held as at August 1, 2009, were reclassified to held-for-trading securities in accordance with CICA’s amendments to Section 3855. The reclassified securities are included in the 2008
balances and excluded from 2009 balances in the table above. Refer to Note 1.
Sensitivity of key assumptionsKey assumptions are used to determine the fair value of our retainedinterests. The following table is a summary of the key assumptions
used as at October 31, 2009 and the sensitivity of the current fairvalue of our retained interests to immediate 10% and 20% adversechanges in these key assumptions.
Increase (decrease) in fair value of retained interests due to adverse changes in key assumptions (1) (2)
2009 2008Credit
cardloans
Canadianresidential
mortgage loans
Creditcard
loans
Canadianresidential
mortgage loans
Fair value of retained interests $ 33.5 $ 1,240.6 $ 26.0 $ 425.0Weighted average remaining service life (in years) .25 2.90 - 3.77 .25 2.58 - 5.89Payment rate 38.33% 9.00 - 28.00% 38.20% 9.00 - 40.00%
Impact on fair value of 10% adverse change $ (2.0) $ (35.0) $ (1.6) $ (13.8)Impact on fair value of 20% adverse change (4.1) (68.9) (3.2) (25.2)
Excess spread, net of credit losses 5.61% .8 - 1.98% 4.37% .8 - 1.03%Impact on fair value of 10% adverse change $ (6.1) $ (137.8) $ (5.4) $ (57.8)Impact on fair value of 20% adverse change (12.2) (296.1) (10.7) (113.2)
Expected credit losses 3.86% –% 2.53% –%Impact on fair value of 10% adverse change $ (2.3) $ – $ (2.0) $ –Impact on fair value of 20% adverse change (4.6) – (3.0) –
Discount rate 10.50% .4 - 2.76% 10.00% 2.15 - 4.00%Impact on fair value of 10% adverse change $ – $ (1.8) $ – $ (1.2)Impact on fair value of 20% adverse change (.1) (4.2) (.1) (2.5)
(1) All rates are annualized except for the credit card loans payment rate which is monthly.(2) This analysis is not applicable for commercial mortgage loans, U.S. residential mortgage loans and bond securitizations as we have not retained rights to future excess spread in these
transactions.
These sensitivities are hypothetical and should be used with caution.Changes in fair value based on a variation in assumptions generallycannot be extrapolated because the relationship of the change inassumptions to the change in fair value may not be linear. The effect
of a variation in a particular assumption on the fair value of theretained interests is calculated without changing any other assump-tions. Generally, the changes in one factor may result in changes inanother, which may magnify or counteract the sensitivity.
In addition to the above securitization transactions, our whole loan sales activities are presented in the following table:
Whole loan sales (1)
2009 2008 2007U.S.
residentialmortgage
loans
U.S.commercial
mortgageloans
U.S.residential
mortgageloans
U.S.commercial
mortgageloans
U.S.residential
mortgageloans
U.S.commercial
mortgageloans
Sold $ 1,021 $ 23 $ 237 $ 70 $ 264 $ –
(1) Gains on whole loan sales are nominal.
Consolidated Financial Statements Royal Bank of Canada: Annual Report 2009 101

Note 6 Variable interest entities (VIEs)
The following table provides information about VIEs as at October 31, 2009 and 2008, in which we have significant variable interests, and thosewe consolidate under AcG-15, because we are the Primary Beneficiary.
2009 2008
Totalassets
Maximumexposure to
lossTotal
assets
Maximumexposure to
loss
Unconsolidated VIEs in which we have significant variable interests (1)Multi-seller conduits (2) $ 26,181 $ 26,550 $ 42,698 $ 43,448Structured finance VIEs (3) 9,613 2,527 10,904 3,927Credit investment product VIEs 930 505 2,649 1,281Third-party conduits 575 250 734 386Investment funds (3) 84 28 816 184Other 340 103 155 63
$ 37,723 $ 29,963 $ 57,956 $ 49,289
Consolidated VIEs (4), (5)Structured finance VIEs (3) $ 2,620 $ 2,491Investment funds 588 1,268Compensation vehicles 64 76Credit investment product VIEs – 196Other 3 113
$ 3,275 $ 4,144
(1) The maximum exposure to loss resulting from our significant variable interests in these VIEs consists mostly of investments, loans, liquidity facilities and fair value of derivatives. We haverecognized $4,020 million (2008 – $5,586 million) of this exposure on our Consolidated Balance Sheets.
(2) Total assets represent maximum assets that may have to be purchased by the conduits under purchase commitments outstanding as at October 31, 2009. Actual assets held by theseconduits as at October 31, 2009, were $18,908 million (2008 – $33,591 million).
(3) We revisited certain unconsolidated structured finance VIEs in which we previously reported we have significant variable interests and determined that they should have been excluded from thedisclosure in the comparative period. The total assets and maximum exposure to loss related to these entities as at October 31, 2008 was $4,341 million and $1,392 million, respectively. Similarly, ourOctober 31, 2008 comparatives for investment funds have been revised to exclude certain VIEs. The total assets and maximum exposure to loss related to these entities as at October 31, 2008 was$366 million and $165 million, respectively. In addition, certain consolidated structured finance VIEs which were not previously disclosed should have been included in the comparative numbers. Thetotal assets of these entities as at October 31, 2008 was $803 million.
(4) The assets that support the obligations of the consolidated VIEs are reported on our Consolidated Balance Sheets primarily as follows: Interest-bearing deposits with banks of $120 million(2008 – $114 million), Trading securities of $272 million (2008 – $1,409 million), Available-for-sale securities of $1,234 million (2008 – $798 million), Loans of $1,496 million (2008 –$1,543 million) and Other assets of $91 million (2008 – $204 million). The compensation vehicles hold $64 million (2008 – $76 million) of our common shares, which are reported asTreasury shares. The obligation to provide our common shares to employees is recorded as an increase to Contributed surplus as the expense for the corresponding stock-basedcompensation plan is recognized.
(5) Investors have recourse only to the assets of the related VIEs and do not have recourse to our general assets unless we breach our contractual obligations relating to those VIEs, provide liquidityfacilities or credit enhancement facilities to, or enter into derivative transactions with, the VIEs.
Multi-seller and third-party conduitsWe administer six multi-seller asset-backed commercial paperconduit programs (multi-seller conduits). These conduits primarilypurchase financial assets from clients and finance those purchasesby issuing asset-backed commercial paper. Our clients primarilyutilize multi-seller conduits to diversify their financing sources and toreduce funding costs.
An unrelated third party (expected loss investor) absorbs creditlosses, up to a maximum contractual amount, that may occur in thefuture on the assets in the multi-seller conduits (multi-seller conduitfirst-loss position) before the multi-seller conduits’ debt holders andus. In return for assuming this multi-seller conduit first-loss position,each multi-seller conduit pays the expected loss investor a returncommensurate with its risk position. The expected loss investorabsorbs a majority of each multi-seller conduit’s expected losses;therefore, we are not the Primary Beneficiary and do not consolidatethese conduits. However, we continue to hold a significant variableinterest in these multi-seller conduits resulting from our provision ofbackstop liquidity and partial credit enhancement facilities andentitlement to residual fees.
We hold significant variable interests in third-party asset-backedsecurity conduits primarily through providing liquidity support andcredit enhancement facilities. However, we are not the PrimaryBeneficiary and do not consolidate these conduits.
As the result of the restructuring of non-bank-sponsored ABCPconduits in 2009, Master Asset Vehicle II (MAV II), which is a VIE, wascreated. We are not required to consolidate MAV II as we do not have amajority of its exposure. Our significant variable interests in MAV II consistof our participating in the margin funding facility and the note investments.
The liquidity and credit enhancement facilities are described inNote 25.
Structured finance VIEsIn 2008, we purchased U.S. ARS from entities which funded theirlong-term investments in student loans by issuing short-term senior
and subordinated notes. Certain of these entities are VIEs (U.S. ARSVIEs). We are subjected to losses on these U.S. ARS VIEs if defaultsare experienced on the underlying student loans; however, theprincipal and accrued interest on the student loans are largelyguaranteed by U.S. government agencies. In our role as auctionremarketing agent for some of these entities, we are under no legalobligation to purchase the notes issued by these entities in theauction process. We hold significant variable interests in certainunconsolidated entities. We consolidate the entities where ourinvestments expose us to a majority of the expected losses.
We also sold ARS into Tender Option Bond (ARS TOB) programs,where each ARS TOB program consists of a credit enhancement (CE)trust and a TOB trust. Each ARS sold to the TOB program is supportedby a letter of credit issued by us, which requires us to extend fundingif there are any credit losses on the ARS, and is financed by theissuance of floating-rate certificates to short-term investors and aresidual certificate to a single third-party investor. We are theremarketing agent for the floating-rate certificates and we provideliquidity facilities to each of the ARS TOB programs to purchase anyfloating-rate certificates that have been tendered but not remarketed.We receive market-based fees for acting as the remarketing agent andproviding the letters of credit and liquidity facilities. Both the CE andthe TOB trusts are VIEs. In 2009, the ARS underlying certain of the ARSTOB programs experienced cash flow deterioration which resulted inexternal rating downgrades. As a result, we consolidated certain ofthese ARS TOB programs where our updated expected loss calcu-lations indicated that we are exposed to a majority of the expectedloss through our letters of credit and liquidity facilities. We continueto hold significant variable interests through the provision of thefacilities in other unconsolidated ARS TOB programs where theresidual certificate holder is exposed to a majority of the expectedlosses in these trusts. The liquidity facilities and letters of credit aredescribed in Note 25.
102 Royal Bank of Canada: Annual Report 2009 Consolidated Financial Statements

The structure of other non-ARS TOB programs that we areinvolved with is similar to the structure of the ARS TOB programdescribed above. We also hold the residual certificates issued bythese non-ARS TOB programs which will expose us to interest ratebasis risk and may provide liquidity facilities and credit enhance-ments to these non-ARS TOB programs. We consolidate the non-ARSTOB programs where we are exposed to a majority of the expectedlosses as a result of our continuing involvement with the non-ARSTOB programs.
In 2008, we sold ARS to an unaffiliated and unconsolidated VIEat fair market value. The purchase of the ARS by the VIE was financedby a loan from us, and the loan is secured by various assets of theentity. We are the remarketing agent for the ARS. We have significantvariable interests in this VIE as a result of providing the ARS loan, acredit facility and guarantees, which are secured by cash collateral, tothe VIE. This VIE also enters into interest rate derivatives with othercounterparties who are exposed to the majority of its variability; as aresult, we do not consolidate this entity.
Creation of credit investment productsWe use VIEs to generally transform credit derivatives into cashinstruments, to distribute credit risk and to create customized creditproducts to meet investors’ specific requirements. We enter intoderivative contracts, including credit derivatives, to purchaseprotection from these VIEs (credit protection) in order to convertvarious risk factors such as yield, currency or credit risk of underlyingassets to meet the needs of the investors. We transfer assets to theseVIEs as collateral for notes issued but the transfer of assets does notmeet sale recognition criteria under AcG-12.
These VIEs issue funded notes. In certain instances, we invest inthe funded notes issued by these VIEs. Some of the VIEs also issueunfunded notes in the form of senior credit derivatives or fundingcommitment and we may be an investor of these unfunded notes. Theinvestors in the funded and unfunded notes ultimately bear the costof any payments made by the VIEs as a result of the credit protectionprovided to us. We may hold significant variable interests in VIEs as aresult of our investment in the notes.
Investment fundsWe enter into fee-based equity derivative transactions with thirdparties including mutual funds, unit investment trusts and otherinvestment funds. These transactions provide their investors with thedesired exposure, and we hedge our exposure from these derivativesby investing in other funds. We consolidate the investment fundswhen we are exposed to a majority of the expected losses of thefunds.
Compensation vehiclesWe use compensation trusts, which primarily hold our own commonshares, to economically hedge our obligation to certain employeesunder some of our stock-based compensation programs. Weconsolidate the trusts in which we are the Primary Beneficiary.
Capital trustsRBC Subordinated Notes Trust (Trust III) and RBC Capital Trust II(Trust II) were created to issue innovative capital instruments, theproceeds of which were used to purchase senior deposit notes fromus. Although we own the common equity and voting control of thesetrusts, we are not the Primary Beneficiary since we are not exposed tothe majority of the expected losses, and we do not have a significantvariable interest in these trusts. For details on the senior depositnotes and innovative capital instruments, refer to Notes 13 and 17,respectively.
Securitization of our financial assetsWe employ VIEs in the process of securitizing our assets, none of whichare consolidated under AcG-15. One entity is a QSPE, which is specificallyexempt from consolidation, and our level of participation in each of theremaining VIEs relative to others does not expose us to a majority of theexpected losses. We also do not have significant variable interests inthese VIEs. For details on our securitization activities, refer to Note 5.
Additional details about our VIEs are provided in Note 31.
Note 7 Derivative instruments and hedging activities
Derivative instruments are categorized as either financial ornon-financial derivatives. Financial derivatives are financial contractswhose value is derived from an underlying interest rate, foreignexchange rate, credit risk, and equity or equity index. Non-financialderivatives are contracts whose value is derived from a preciousmetal, commodity instrument or index. Notional amount ofderivatives represents the contract amount used as a reference pointto calculate payments. Notional amounts are generally not exchangedby counterparties, and do not reflect our exposure at default.
Financial derivativesForwards and futuresForward contracts are effectively tailor-made agreements that aretransacted between counterparties in the over-the-counter market,whereas futures are standardized contracts with respect to amountsand settlement dates, and are traded on regular futures exchanges.Examples of forwards and futures are described below:
Interest rate forwards (forward rate agreements) and futures arecontractual obligations to buy or sell an interest-rate sensitive financialinstrument on a predetermined future date at a specified price.
Foreign exchange forwards and futures are contractual obliga-tions to exchange one currency for another at a specified price forsettlement at a predetermined future date.
Equity forwards and futures are contractual obligations to buy orsell at a fixed value (the contracted price) of an equity index, a basketof stocks or a single stock at a predetermined future date.
SwapsSwaps are over-the-counter contracts in which two counterpartiesexchange a series of cash flows based on agreed upon rates to anotional amount. The various swap agreements that we enter into areas follows:
Interest rate swaps are agreements where two counterpartiesexchange a series of payments based on different interest ratesapplied to a notional amount in a single currency. Cross currencyswaps involve the exchange of fixed payments in one currency for thereceipt of fixed payments in another currency. Cross currency interestrate swaps involve the exchange of both interest and principalamounts in two different currencies.
Equity swaps are contracts in which one counterparty agrees topay or receive from the other cash flows based on changes in thevalue of an equity index, a basket of stocks or a single stock.
OptionsOptions are contractual agreements under which the seller (writer)grants the purchaser the right, but not the obligation, either to buy(call option) or sell (put option), a security, exchange rate, interestrate, or other financial instrument or commodity at a predeterminedprice, at or by a specified future date. The seller (writer) of an optioncan also settle the contract by paying the cash settlement value of thepurchaser’s right. The seller (writer) receives a premium from thepurchaser for this right. The various option agreements that we enterinto include interest rate options, foreign currency options, equityoptions and index options.
Consolidated Financial Statements Royal Bank of Canada: Annual Report 2009 103

Note 7 Derivative instruments and hedging activities (continued)
Credit derivativesCredit derivatives are over-the-counter contracts that transfer creditrisk related to an underlying financial instrument (referenced asset)from one counterparty to another. Examples of credit derivativesinclude credit default swaps, credit default baskets and total returnswaps.
Credit default swaps provide protection against the decline invalue of the referenced asset as a result of specified credit eventssuch as default or bankruptcy. It is similar in structure to an optionwhereby the purchaser pays a premium to the seller of the creditdefault swap in return for payment contingent on a credit eventaffecting the referenced asset.
Credit default baskets are similar to credit default swaps exceptthat the underlying referenced financial instrument is a group ofassets instead of a single asset.
Total return swaps are contracts where one counterparty agreesto pay or receive from the other cash flows based on changes in thevalue of the referenced asset.
Other derivative productsCertain warrants and loan commitments that meet the definition ofderivative are also included as derivative instruments.
Non-financial derivativesWe also transact in non-financial derivative products includingprecious metal and commodity derivative contracts in both theover-the-counter and exchange markets.
Derivatives issued for trading purposesMost of our derivative transactions relate to sales and trading activ-ities. Sales activities include the structuring and marketing ofderivative products to clients to enable them to transfer, modify orreduce current or expected risks. Trading involves market-making,positioning and arbitrage activities. Market-making involves quotingbid and offer prices to other market participants with the intention ofgenerating revenue based on spread and volume. Positioninginvolves managing market risk positions with the expectation ofprofiting from favourable movements in prices, rates or indices.Arbitrage activities involve identifying and profiting from pricedifferentials between markets and products.
Derivatives issued for other-than-trading purposesWe also use derivatives for purposes other than trading, primarily forhedging, in conjunction with the management of interest rate, credit,
equity and foreign exchange risk related to our funding, lending,investment activities and asset/liability management.
Interest rate swaps are used to manage our exposure to interestrate risk by modifying the repricing or maturity characteristics ofexisting and/or anticipated assets and liabilities, including fundingand investment activities. Purchased interest rate options are used tohedge redeemable deposits and other options embedded inconsumer products. We manage our exposure to foreign currency riskwith cross currency swaps and foreign exchange forward contracts.We predominantly use credit derivatives to manage our creditexposures. We mitigate industry sector concentrations and single-name exposures related to our credit portfolio by purchasing creditderivatives to transfer credit risk to third parties.
Certain derivatives and cash instruments are specificallydesignated and qualify for hedge accounting. We apply hedgeaccounting to minimize volatility in earnings caused by changes ininterest rates or foreign exchange rates. Interest rate and currencyfluctuations will either cause assets and liabilities to appreciate ordepreciate in market value or cause variability in anticipated cashflows. When a hedging instrument functions effectively, gains, losses,revenue and expenses of the hedging instrument will offset the gains,losses, revenue and expenses of the hedged item. We largely assessand measure the effectiveness of a derivative that is designated as ahedging instrument based on the change in its fair value. When cashinstruments are designated as hedges of currency risks, only changesin their value due to currency risk are included in the assessment andmeasurement of hedge effectiveness. We did not apply hedgeaccounting to any anticipated transactions or firm commitmentsduring the year.
From time to time, we also enter into derivative transactions toeconomically hedge certain exposures that do not otherwise qualifyfor hedge accounting, or where hedge accounting is not consideredeconomically feasible to implement. In such circumstances, changesin fair value are reflected in Non-interest income.
As at October 31, 2009, after-tax net unrealized losses of$423 million (2008 – after-tax net unrealized losses of $579 million)were recognized in AOCI, representing the cumulative effectiveportions of our cash flow hedges.
After-tax unrealized losses of $7 million (before-tax unrealizedlosses of $10 million) included in AOCI as at October 31, 2009 areexpected to be reclassified to Net interest income within the next12 months.
The following table presents the fair values of the derivative and non-derivative instruments categorized by their hedging relationships, as wellas derivatives that are not designated in hedging relationships.
Derivatives and non-derivative instruments2009 2008
Designated as hedging instruments inhedging relationships
Designated as hedging instrumentsin hedging relationships
Cash flowhedges
Fairvalue
hedges
Netinvestment
hedges
Not designatedin a hedging
relationship (1)Cash flow
hedges
Fairvalue
hedges
Netinvestment
hedges
Not designatedin a hedging
relationship (1)
AssetsDerivative instruments $ 1,130 $ 2,107 $ 139 $ 88,797 $ 879 $ 1,397 $ 355 $ 133,503
LiabilitiesDerivative instruments $ 1,493 $ 82 $ 327 $ 82,488 $ 1,597 $ 61 $ 1,229 $ 125,818Non-derivative instruments (2) – 278 5,233 n.a. – 449 5,886 n.a.
(1) Derivative liabilities include stable value contracts on $257 million of bank-owned life insurance policies and $3 million of 401(k) plans; in 2008 – these were derivative assets of $2 millionand $1 million, respectively.
(2) Non-derivative instruments are carried at amortized cost.n.a. not applicable
104 Royal Bank of Canada: Annual Report 2009 Consolidated Financial Statements

Results of hedge activities recorded in Net income and OCI2009 2008
Net gains(losses)
included inNon- interest
income
Net gains(losses)
included inNet interest
income
After-taxunrealized
gains(losses)
included inOCI
Net gains(losses)
included inNon-
interestincome
Net gains(losses)
included inNet interest
income
After-taxunrealized
gains(losses)
included inOCI
Fair value hedgesIneffective portion $ 9 $ n.a. $ n.a. $ (6) $ n.a. $ n.a.
Cash flow hedgesIneffective portion 9 n.a. n.a. (8) n.a. n.a.Effective portion n.a. n.a. 156 n.a. n.a. (603)Reclassified to income during the year (1) n.a. 56 n.a. n.a. (72) n.a.
Net investment hedgesForeign currency (losses) gains n.a. n.a. (2,973) n.a. n.a. 5,080Gains (losses) from hedges n.a. n.a. 2,399 n.a. n.a. (2,672)
$ 18 $ 56 $ (418) $ (14) $ (72) $ 1,805
(1) After-tax gains of $38 million were reclassified from AOCI to income for the year ended October 31, 2009 (2008 – losses of $49 million).n.a. not applicable
Notional amount of derivatives by term to maturity (absolute amounts)2009 2008
Term to maturity
Within1 year
1 to5 years
Over 5years (1) Total Trading
Other thanTrading Trading
Other thanTrading
Over-the-counter contractsInterest rate contracts
Forward rate agreements $ 308,668 $ 47,396 $ – $ 356,064 $ 356,064 $ – $ 265,042 $ –Swaps 744,559 1,282,069 649,366 2,675,994 2,467,890 208,104 2,534,700 223,502Options purchased 9,228 50,440 53,723 113,391 113,067 324 91,826 781Options written 21,924 51,746 103,156 176,826 176,826 – 164,847 218
Foreign exchange contractsForward contracts 617,524 25,924 1,048 644,496 585,913 58,583 856,124 45,599Cross currency swaps 5,990 7,505 11,991 25,486 25,198 288 25,484 545Cross currency interest rate swaps 55,422 196,419 100,266 352,107 315,253 36,854 291,688 53,470Options purchased 29,740 6,639 2,023 38,402 38,399 3 46,334 63Options written 30,418 5,947 1,382 37,747 37,746 1 46,234 57
Credit derivatives (2) 19,800 79,757 29,628 129,185 127,012 2,173 272,525 3,314Other contracts (3) 40,825 38,203 7,436 86,464 85,248 1,216 104,037 959
Exchange-traded contractsInterest rate contracts
Futures – long positions 16,915 16,994 57,272 91,181 91,133 48 72,024 164Futures – short positions 21,823 9,253 67,414 98,490 98,490 – 96,872 –Options purchased 25,666 – – 25,666 25,666 – 14,693 –Options written 28,473 129 – 28,602 28,602 – 11,565 –
Foreign exchange contractsFutures – long positions 14 – – 14 14 – 222 –Futures – short positions 32 – – 32 32 – 394 –
Other contracts (3) 97,477 16,149 5,999 119,625 119,625 – 196,650 –
$ 2,074,498 $ 1,834,570 $ 1,090,704 $ 4,999,772 $ 4,692,178 $ 307,594 $ 5,091,261 $ 328,672
(1) Includes contracts maturing in over 10 years with a notional value of $286,951 million (2008 – $255,281 million). The related gross positive replacement cost is $14,067 million (2008 –$9,840 million).
(2) Comprises credit default swaps, total return swaps and credit default baskets, including credit derivatives given guarantee treatment for OSFI regulatory reporting purposes. Credit derivativeswith a notional value of $2,163 million (2008 – $3,167 million) are economic hedges. Trading credit derivatives comprise protection purchased of $68,643 million (2008 – $140,010 million)and protection sold of $58,369 million (2008 – $132,515 million); other-than-trading credit derivatives comprise protection purchased of $2,163 million (2008 – $3,167 million) andprotection sold of $10 million (2008 – $147 million).
(3) Comprises precious metal, commodity, stable value and equity derivative contracts.
Consolidated Financial Statements Royal Bank of Canada: Annual Report 2009 105

Note 7 Derivative instruments and hedging activities (continued)
Fair value of derivative instruments2009 2008
Average fair valuefor year ended (1)
Year-endfair value
Average fair value for yearended (1)
Year-endfair value
Positive Negative Positive Negative Positive Negative Positive Negative
Held or issued for trading purposesInterest rate contracts
Forward rate agreements $ 336 $ 274 $ 221 $ 196 $ 191 $ 143 $ 329 $ 220Swaps 56,487 51,138 47,660 43,119 21,632 21,559 32,596 30,448Options purchased 1,744 – 1,712 – 797 – 1,569 –Options written – 2,353 – 2,007 – 1,216 – 1,714
58,567 53,765 49,593 45,322 22,620 22,918 34,494 32,382
Foreign exchange contractsForward contracts 17,465 17,631 8,790 8,923 12,831 12,793 37,096 36,682Cross currency swaps 2,004 1,665 2,219 1,614 2,396 1,777 1,597 1,574Cross currency interest rate swaps 13,787 12,725 10,846 9,993 12,628 11,806 18,654 18,628Options purchased 1,685 – 1,377 – 1,214 – 1,850 –Options written – 1,591 – 1,385 – 1,160 – 1,830
34,941 33,612 23,232 21,915 29,069 27,536 59,197 58,714
Credit derivatives (2) 11,739 10,343 5,192 4,398 13,131 11,868 16,456 15,344Other contracts (3) 12,298 10,774 8,148 8,112 8,617 11,486 18,914 17,322
$ 117,545 $ 108,494 $ 86,165 $ 79,747 $ 73,437 $ 73,808 $ 129,061 $ 123,762
Held or issued for other than trading purposesInterest rate contracts
Swaps $ 4,334 $ 2,807 $ 3,687 $ 2,774Options purchased 9 – 19 –Options written – – – 31
4,343 2,807 3,706 2,805
Foreign exchange contractsForward contracts 466 490 1,404 1,299Cross currency swaps 4 7 10 24Cross currency interest rate swaps 1,866 1,587 3,377 2,544Options purchased – – 10 –Options written – – – 6
2,336 2,084 4,801 3,873
Credit derivatives (2) 128 20 400 15Other contracts (3) 102 – 15 6
6,909 4,911 8,922 6,699
Total gross fair values before netting (4), (5) 93,074 84,658 137,983 130,461Valuation adjustments determined on a pooled basis (633) – (1,117) –Impact of master netting agreements
With intent to settle net or simultaneously (6) (268) (268) (1,756) (1,756)
$ 92,173 $ 84,390 $ 135,110 $ 128,705
Impact of master netting agreementsWithout intent to settle net or simultaneously (7) (62,868) (62,868) (76,179) (76,179)
$ 29,305 $ 21,522 $ 58,931 $ 52,526
(1) Average fair value amounts are calculated based on monthly balances.(2) Comprises credit default swaps, total return swaps and credit default baskets, including credit derivatives given guarantee treatment for OSFI regulatory reporting purposes.(3) Comprises precious metal, commodity, stable value and equity derivative contracts. Certain warrants and loan commitments that meet the definition of derivatives are also included.(4) Total gross fair values before netting include market and credit valuation adjustments that are determined on an instrument-specific basis. Positive year-end fair values exclude margin
requirements of $67 million (2008 – $1,024 million).(5) In our Consolidated Balance Sheets, the margin requirements are included in Derivative assets for 2008 but are included in Other assets for 2009.(6) Impact of offsetting credit exposures on contracts where we have both a legally enforceable master netting agreement in place and we intend to settle the contracts on either a net basis or
simultaneously.(7) Additional impact of offsetting credit exposures on contracts where we have a legally enforceable master netting agreement in place but do not intend to settle the contracts on a net basis or
simultaneously.
Fair value of derivative instruments by term to maturity2009 2008
Less than1 year
1 to5 years
Over5 years Total Total
Derivative assets (1) $ 22,819 $ 37,748 $ 31,606 $ 92,173 $ 135,110Derivative liabilities (2) 20,572 35,162 28,656 84,390 128,705
(1) Market and credit valuation adjustments that are determined on an instrument-specificbasis and on a pooled basis are included. For 2009, Derivative assets in the table aboveand in our Consolidated Balance Sheets exclude margin requirements of $67 millionthat are included in Other assets. For 2008, Derivative assets in the table above excludemargin requirements of $1,024 million which are included in our Consolidated BalanceSheets.
(2) Includes stable value contracts on $257 million of bank-owned life insurance policiesand $3 million of 401(k) plans; in 2008 – these were derivative assets of $2 million and$1 million respectively.
106 Royal Bank of Canada: Annual Report 2009 Consolidated Financial Statements
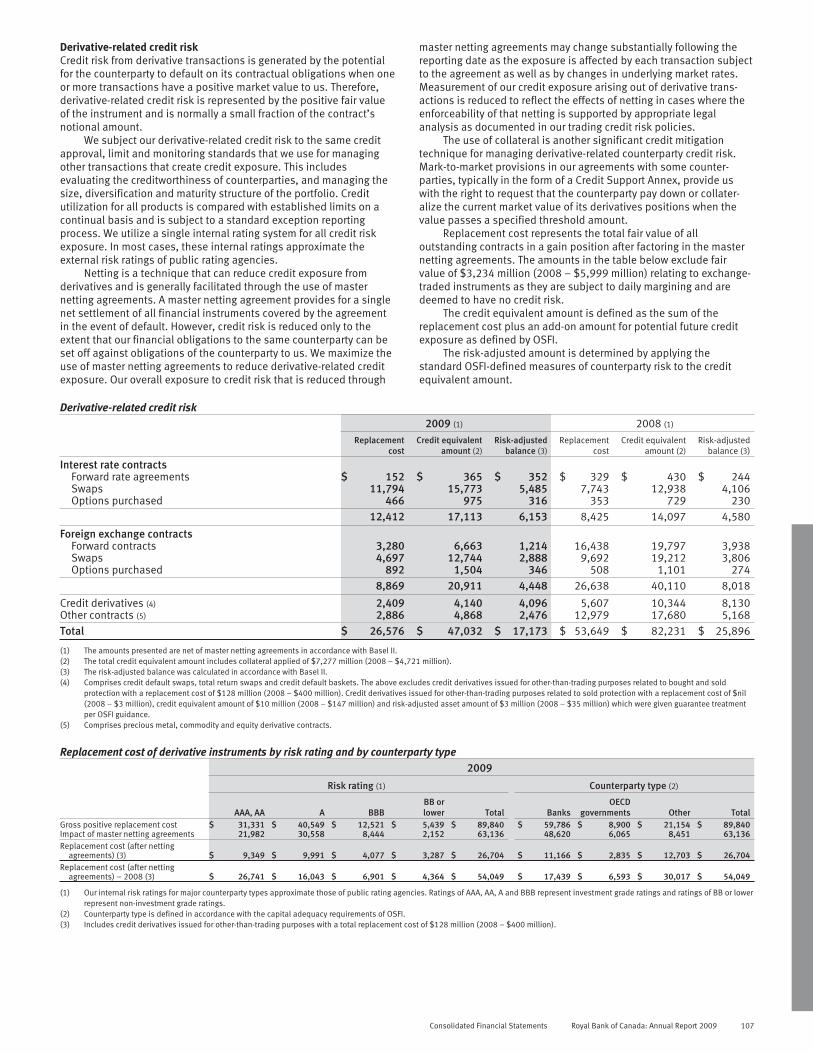
Derivative-related credit riskCredit risk from derivative transactions is generated by the potentialfor the counterparty to default on its contractual obligations when oneor more transactions have a positive market value to us. Therefore,derivative-related credit risk is represented by the positive fair valueof the instrument and is normally a small fraction of the contract’snotional amount.
We subject our derivative-related credit risk to the same creditapproval, limit and monitoring standards that we use for managingother transactions that create credit exposure. This includesevaluating the creditworthiness of counterparties, and managing thesize, diversification and maturity structure of the portfolio. Creditutilization for all products is compared with established limits on acontinual basis and is subject to a standard exception reportingprocess. We utilize a single internal rating system for all credit riskexposure. In most cases, these internal ratings approximate theexternal risk ratings of public rating agencies.
Netting is a technique that can reduce credit exposure fromderivatives and is generally facilitated through the use of masternetting agreements. A master netting agreement provides for a singlenet settlement of all financial instruments covered by the agreementin the event of default. However, credit risk is reduced only to theextent that our financial obligations to the same counterparty can beset off against obligations of the counterparty to us. We maximize theuse of master netting agreements to reduce derivative-related creditexposure. Our overall exposure to credit risk that is reduced through
master netting agreements may change substantially following thereporting date as the exposure is affected by each transaction subjectto the agreement as well as by changes in underlying market rates.Measurement of our credit exposure arising out of derivative trans-actions is reduced to reflect the effects of netting in cases where theenforceability of that netting is supported by appropriate legalanalysis as documented in our trading credit risk policies.
The use of collateral is another significant credit mitigationtechnique for managing derivative-related counterparty credit risk.Mark-to-market provisions in our agreements with some counter-parties, typically in the form of a Credit Support Annex, provide uswith the right to request that the counterparty pay down or collater-alize the current market value of its derivatives positions when thevalue passes a specified threshold amount.
Replacement cost represents the total fair value of alloutstanding contracts in a gain position after factoring in the masternetting agreements. The amounts in the table below exclude fairvalue of $3,234 million (2008 – $5,999 million) relating to exchange-traded instruments as they are subject to daily margining and aredeemed to have no credit risk.
The credit equivalent amount is defined as the sum of thereplacement cost plus an add-on amount for potential future creditexposure as defined by OSFI.
The risk-adjusted amount is determined by applying thestandard OSFI-defined measures of counterparty risk to the creditequivalent amount.
Derivative-related credit risk2009 (1) 2008 (1)
Replacementcost
Credit equivalentamount (2)
Risk-adjustedbalance (3)
Replacementcost
Credit equivalentamount (2)
Risk-adjustedbalance (3)
Interest rate contractsForward rate agreements $ 152 $ 365 $ 352 $ 329 $ 430 $ 244Swaps 11,794 15,773 5,485 7,743 12,938 4,106Options purchased 466 975 316 353 729 230
12,412 17,113 6,153 8,425 14,097 4,580
Foreign exchange contractsForward contracts 3,280 6,663 1,214 16,438 19,797 3,938Swaps 4,697 12,744 2,888 9,692 19,212 3,806Options purchased 892 1,504 346 508 1,101 274
8,869 20,911 4,448 26,638 40,110 8,018
Credit derivatives (4) 2,409 4,140 4,096 5,607 10,344 8,130Other contracts (5) 2,886 4,868 2,476 12,979 17,680 5,168Total $ 26,576 $ 47,032 $ 17,173 $ 53,649 $ 82,231 $ 25,896
(1) The amounts presented are net of master netting agreements in accordance with Basel II.(2) The total credit equivalent amount includes collateral applied of $7,277 million (2008 – $4,721 million).(3) The risk-adjusted balance was calculated in accordance with Basel II.(4) Comprises credit default swaps, total return swaps and credit default baskets. The above excludes credit derivatives issued for other-than-trading purposes related to bought and sold
protection with a replacement cost of $128 million (2008 – $400 million). Credit derivatives issued for other-than-trading purposes related to sold protection with a replacement cost of $nil(2008 – $3 million), credit equivalent amount of $10 million (2008 – $147 million) and risk-adjusted asset amount of $3 million (2008 – $35 million) which were given guarantee treatmentper OSFI guidance.
(5) Comprises precious metal, commodity and equity derivative contracts.
Replacement cost of derivative instruments by risk rating and by counterparty type2009
Risk rating (1) Counterparty type (2)
AAA, AA A BBBBB orlower Total Banks
OECDgovernments Other Total
Gross positive replacement costImpact of master netting agreements
$ 31,33121,982
$ 40,54930,558
$ 12,5218,444
$ 5,4392,152
$ 89,84063,136
$ 59,78648,620
$ 8,9006,065
$ 21,1548,451
$ 89,84063,136
Replacement cost (after nettingagreements) (3) $ 9,349 $ 9,991 $ 4,077 $ 3,287 $ 26,704 $ 11,166 $ 2,835 $ 12,703 $ 26,704
Replacement cost (after nettingagreements) – 2008 (3) $ 26,741 $ 16,043 $ 6,901 $ 4,364 $ 54,049 $ 17,439 $ 6,593 $ 30,017 $ 54,049
(1) Our internal risk ratings for major counterparty types approximate those of public rating agencies. Ratings of AAA, AA, A and BBB represent investment grade ratings and ratings of BB or lowerrepresent non-investment grade ratings.
(2) Counterparty type is defined in accordance with the capital adequacy requirements of OSFI.(3) Includes credit derivatives issued for other-than-trading purposes with a total replacement cost of $128 million (2008 – $400 million).
Consolidated Financial Statements Royal Bank of Canada: Annual Report 2009 107

Note 8 Premises and equipment
2009 2008
CostAccumulateddepreciation
Net bookvalue Cost
Accumulateddepreciation
Net bookvalue
Land $ 250 $ – $ 250 $ 216 $ – $ 216Buildings 942 479 463 845 427 418Computer equipment 2,018 1,537 481 2,100 1,444 656Furniture, fixtures and other equipment 1,401 972 429 1,395 981 414Leasehold improvements 1,642 898 744 1,624 857 767
$ 6,253 $ 3,886 $ 2,367 $ 6,180 $ 3,709 $ 2,471
The depreciation expense for premises and equipment for 2009 was $389 million (2008 – $318 million; 2007 – $272 million).
Note 9 RBC Dexia Investor Services joint venture
RBC Dexia Investor ServicesWe operate our institutional and investor services business (IIS)through our joint venture, RBC Dexia Investor Services (RBC Dexia IS).
Assets and liabilities representing our interest in RBC Dexia ISand our proportionate share of its financial results before adjustingfor related party transactions are presented in the following tables:
As at
October 312009
October 312008
Consolidated Balance SheetsAssets (1) $ 15,502 $ 19,136Liabilities 14,438 18,114
(1) Includes $73 million (2008 – $72 million) of goodwill and $137 million (2008 – $158million) of intangible assets.
For the year ended
October 312009
October 312008
October 312007
Consolidated Statementsof IncomeNet interest income $ 152 $ 162 $ 116Non-interest income 496 647 600Non-interest expense 593 602 529Net income 34 135 125
Consolidated Statements ofCash FlowsCash flows from (used in)
operating activities $ 446 $ (1,433) $ (546)Cash flows from (used in)
investing activities 2,869 (2,158) (2,299)Cash flows (used in) from
financing activities (3,328) 3,713 2,856
We provide certain services to RBC Dexia IS, which includeadministrative and technology support, human resources, and creditand banking facilities to support its operations. RBC Dexia IS alsoprovides certain services to us, including custody and trusteeship,fund and investment administration, transfer agency and investorservices. These services and facilities are provided by the respectiveparties in the normal course of operations on terms similar to thoseoffered to non-related parties. The amount of income earned andexpenses incurred by RBC Dexia IS related to transactions with RBCare as follows:
For the year ended
October 312009
October 312008
October 312007
Net interest income $ 49 $ 145 $ 157Non-interest income 25 28 26Non-interest expense 37 38 34
108 Royal Bank of Canada: Annual Report 2009 Consolidated Financial Statements
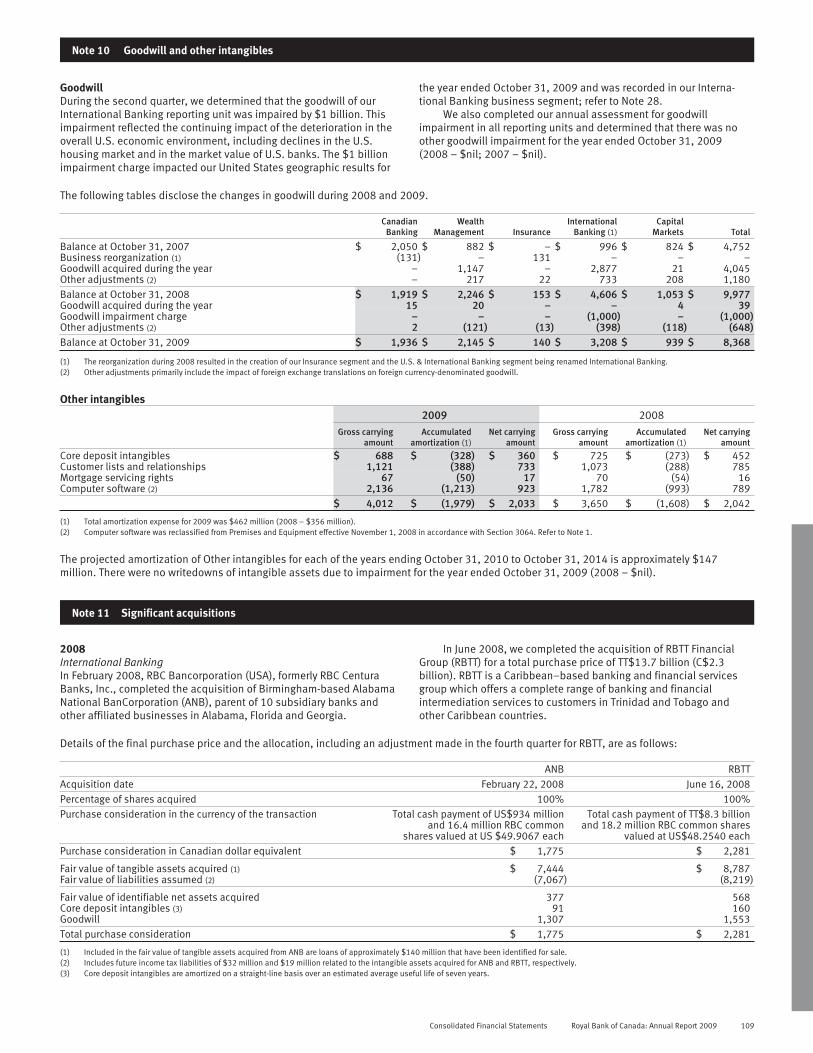
Note 10 Goodwill and other intangibles
GoodwillDuring the second quarter, we determined that the goodwill of ourInternational Banking reporting unit was impaired by $1 billion. Thisimpairment reflected the continuing impact of the deterioration in theoverall U.S. economic environment, including declines in the U.S.housing market and in the market value of U.S. banks. The $1 billionimpairment charge impacted our United States geographic results for
the year ended October 31, 2009 and was recorded in our Interna-tional Banking business segment; refer to Note 28.
We also completed our annual assessment for goodwillimpairment in all reporting units and determined that there was noother goodwill impairment for the year ended October 31, 2009(2008 – $nil; 2007 – $nil).
The following tables disclose the changes in goodwill during 2008 and 2009.
CanadianBanking
WealthManagement Insurance
InternationalBanking (1)
CapitalMarkets Total
Balance at October 31, 2007 $ 2,050 $ 882 $ – $ 996 $ 824 $ 4,752Business reorganization (1) (131) – 131 – – –Goodwill acquired during the year – 1,147 – 2,877 21 4,045Other adjustments (2) – 217 22 733 208 1,180Balance at October 31, 2008 $ 1,919 $ 2,246 $ 153 $ 4,606 $ 1,053 $ 9,977Goodwill acquired during the year 15 20 – – 4 39Goodwill impairment charge – – – (1,000) – (1,000)Other adjustments (2) 2 (121) (13) (398) (118) (648)Balance at October 31, 2009 $ 1,936 $ 2,145 $ 140 $ 3,208 $ 939 $ 8,368
(1) The reorganization during 2008 resulted in the creation of our Insurance segment and the U.S. & International Banking segment being renamed International Banking.(2) Other adjustments primarily include the impact of foreign exchange translations on foreign currency-denominated goodwill.
Other intangibles2009 2008
Gross carryingamount
Accumulatedamortization (1)
Net carryingamount
Gross carryingamount
Accumulatedamortization (1)
Net carryingamount
Core deposit intangibles $ 688 $ (328) $ 360 $ 725 $ (273) $ 452Customer lists and relationships 1,121 (388) 733 1,073 (288) 785Mortgage servicing rights 67 (50) 17 70 (54) 16Computer software (2) 2,136 (1,213) 923 1,782 (993) 789
$ 4,012 $ (1,979) $ 2,033 $ 3,650 $ (1,608) $ 2,042
(1) Total amortization expense for 2009 was $462 million (2008 – $356 million).(2) Computer software was reclassified from Premises and Equipment effective November 1, 2008 in accordance with Section 3064. Refer to Note 1.
The projected amortization of Other intangibles for each of the years ending October 31, 2010 to October 31, 2014 is approximately $147million. There were no writedowns of intangible assets due to impairment for the year ended October 31, 2009 (2008 – $nil).
Note 11 Significant acquisitions
2008International BankingIn February 2008, RBC Bancorporation (USA), formerly RBC CenturaBanks, Inc., completed the acquisition of Birmingham-based AlabamaNational BanCorporation (ANB), parent of 10 subsidiary banks andother affiliated businesses in Alabama, Florida and Georgia.
In June 2008, we completed the acquisition of RBTT FinancialGroup (RBTT) for a total purchase price of TT$13.7 billion (C$2.3billion). RBTT is a Caribbean–based banking and financial servicesgroup which offers a complete range of banking and financialintermediation services to customers in Trinidad and Tobago andother Caribbean countries.
Details of the final purchase price and the allocation, including an adjustment made in the fourth quarter for RBTT, are as follows:
ANB RBTTAcquisition date February 22, 2008 June 16, 2008Percentage of shares acquired 100% 100%Purchase consideration in the currency of the transaction Total cash payment of US$934 million
and 16.4 million RBC commonshares valued at US $49.9067 each
Total cash payment of TT$8.3 billionand 18.2 million RBC common shares
valued at US$48.2540 eachPurchase consideration in Canadian dollar equivalent $ 1,775 $ 2,281
Fair value of tangible assets acquired (1) $ 7,444 $ 8,787Fair value of liabilities assumed (2) (7,067) (8,219)
Fair value of identifiable net assets acquired 377 568Core deposit intangibles (3) 91 160Goodwill 1,307 1,553Total purchase consideration $ 1,775 $ 2,281
(1) Included in the fair value of tangible assets acquired from ANB are loans of approximately $140 million that have been identified for sale.(2) Includes future income tax liabilities of $32 million and $19 million related to the intangible assets acquired for ANB and RBTT, respectively.(3) Core deposit intangibles are amortized on a straight-line basis over an estimated average useful life of seven years.
Consolidated Financial Statements Royal Bank of Canada: Annual Report 2009 109
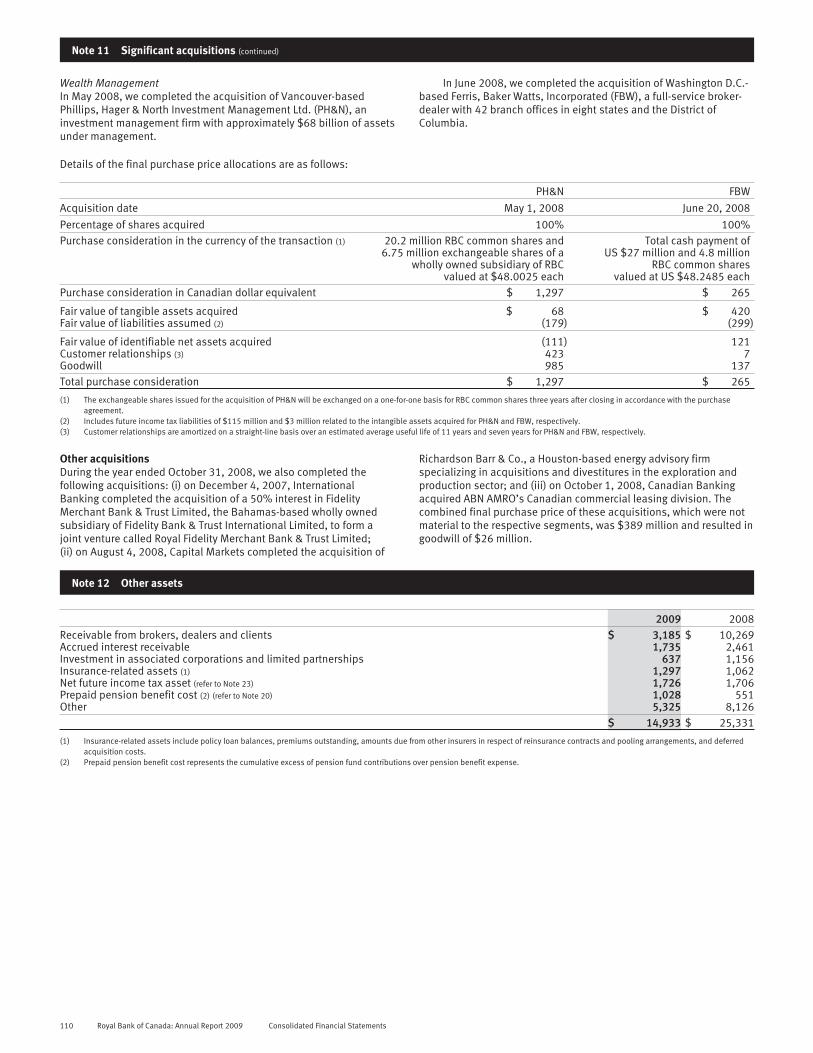
Note 11 Significant acquisitions (continued)
Wealth ManagementIn May 2008, we completed the acquisition of Vancouver-basedPhillips, Hager & North Investment Management Ltd. (PH&N), aninvestment management firm with approximately $68 billion of assetsunder management.
In June 2008, we completed the acquisition of Washington D.C.-based Ferris, Baker Watts, Incorporated (FBW), a full-service broker-dealer with 42 branch offices in eight states and the District ofColumbia.
Details of the final purchase price allocations are as follows:
PH&N FBW
Acquisition date May 1, 2008 June 20, 2008
Percentage of shares acquired 100% 100%Purchase consideration in the currency of the transaction (1) 20.2 million RBC common shares and
6.75 million exchangeable shares of awholly owned subsidiary of RBC
valued at $48.0025 each
Total cash payment ofUS $27 million and 4.8 million
RBC common sharesvalued at US $48.2485 each
Purchase consideration in Canadian dollar equivalent $ 1,297 $ 265
Fair value of tangible assets acquired $ 68 $ 420Fair value of liabilities assumed (2) (179) (299)
Fair value of identifiable net assets acquired (111) 121Customer relationships (3) 423 7Goodwill 985 137Total purchase consideration $ 1,297 $ 265
(1) The exchangeable shares issued for the acquisition of PH&N will be exchanged on a one-for-one basis for RBC common shares three years after closing in accordance with the purchaseagreement.
(2) Includes future income tax liabilities of $115 million and $3 million related to the intangible assets acquired for PH&N and FBW, respectively.(3) Customer relationships are amortized on a straight-line basis over an estimated average useful life of 11 years and seven years for PH&N and FBW, respectively.
Other acquisitionsDuring the year ended October 31, 2008, we also completed thefollowing acquisitions: (i) on December 4, 2007, InternationalBanking completed the acquisition of a 50% interest in FidelityMerchant Bank & Trust Limited, the Bahamas-based wholly ownedsubsidiary of Fidelity Bank & Trust International Limited, to form ajoint venture called Royal Fidelity Merchant Bank & Trust Limited;(ii) on August 4, 2008, Capital Markets completed the acquisition of
Richardson Barr & Co., a Houston-based energy advisory firmspecializing in acquisitions and divestitures in the exploration andproduction sector; and (iii) on October 1, 2008, Canadian Bankingacquired ABN AMRO’s Canadian commercial leasing division. Thecombined final purchase price of these acquisitions, which were notmaterial to the respective segments, was $389 million and resulted ingoodwill of $26 million.
Note 12 Other assets
2009 2008Receivable from brokers, dealers and clients $ 3,185 $ 10,269Accrued interest receivable 1,735 2,461Investment in associated corporations and limited partnerships 637 1,156Insurance-related assets (1) 1,297 1,062Net future income tax asset (refer to Note 23) 1,726 1,706Prepaid pension benefit cost (2) (refer to Note 20) 1,028 551Other 5,325 8,126
$ 14,933 $ 25,331
(1) Insurance-related assets include policy loan balances, premiums outstanding, amounts due from other insurers in respect of reinsurance contracts and pooling arrangements, and deferredacquisition costs.
(2) Prepaid pension benefit cost represents the cumulative excess of pension fund contributions over pension benefit expense.
110 Royal Bank of Canada: Annual Report 2009 Consolidated Financial Statements

Note 13 Deposits
The following table details our deposit liabilities.
2009 2008Demand (1) Notice (2) Term (3), (4), (5) Total Total
Personal $ 73,629 $ 9,837 $ 68,862 $ 152,328 $ 139,036Business and government (4), (5) 105,220 1,717 113,835 220,772 269,994Bank 4,023 18 21,163 25,204 29,545
$ 182,872 $ 11,572 $ 203,860 $ 398,304 $ 438,575Non-interest-bearing
Canada $ 41,175 $ 34,463United States 4,893 4,682Other International 3,041 4,579
Interest-bearingCanada (4), (5) 174,345 168,246United States 47,930 68,450Other International 126,920 158,155
$ 398,304 $ 438,575
(1) Deposits payable on demand include all deposits for which we do not have the right to notice of withdrawal. These deposits include both savings and chequing accounts.(2) Deposits payable after notice include all deposits for which we can legally require notice of withdrawal. These deposits are primarily savings accounts.(3) Term deposits include deposits payable on a fixed date. These deposits include term deposits, guaranteed investment certificates and similar instruments. At October 31, 2009, the balance
of term deposits also includes senior deposit notes we have issued to provide long-term funding of $75.5 billion (2008 – $63.9 billion).(4) The senior deposit note of $900 million issued to Trust II (refer to Note 17) is included in Business and government deposits. This senior deposit note bears interest at an annual rate of
5.812% and will mature on December 31, 2053. The note is redeemable at our option, in whole or in part, on and after December 31, 2008, subject to the approval of OSFI. It may beredeemed earlier, at our option in certain specified circumstances, subject to the approval of OSFI. Each $1,000 of the note principal is convertible at any time into 40 of our Non-cumulativeredeemable First Preferred Shares Series U at the option of Trust II. Trust II will exercise this conversion right in circumstances in which holders of RBC Trust Capital Securities Series 2013(RBC TruCS 2013) exercise their holder exchange right. Refer to Note 17 for more information on RBC TruCS 2013.
(5) Business and government deposits also include a senior deposit note of $999.8 million issued to Trust III (refer to Note 17). This senior deposit note bears interest at an annual rate of 4.72%and will mature on April 30, 2017. Subject to OSFI’s approval, the note is redeemable at our option, in whole or in part, on or after April 30, 2012, at the Redemption Price and may also beredeemed earlier at our option at the Early Redemption Price. The Redemption Price is an amount equal to $1,000 plus the unpaid distributions to the redemption date. The Early RedemptionPrice is an amount equal to the greater of: (i) the Redemption Price, and (ii) the price calculated to provide an annual yield, equal to the yield on Government of Canada bonds from theredemption date to April 30, 2012, plus 11 basis points.
The following table presents the contractual maturities of ourdemand, notice and term deposit liabilities. Included in “within 1year” are deposits payable on demand and deposits payable afternotice.
Deposits (1)
2009 2008Within 1 year $ 258,322 $ 357,1121 to 2 years 78,338 30,7682 to 3 years 28,892 19,9123 to 4 years 15,570 10,8714 to 5 years 5,464 11,319Over 5 years 11,718 8,593
$ 398,304 $ 438,575
(1) The aggregate amount of term deposits in denominations of $100,000 or more as atOctober 31, 2009 was $167 billion (2008 – $221 billion).
Average deposit balances and average of interest paid ratesAverage balances Average rates
2009 2008 2009 2008
Canada $ 207,506 $ 187,182 1.42% 2.36%United States 65,138 58,997 1.19 2.98Other International 149,314 164,862 2.03 3.63
$ 421,958 $ 411,041 1.60% 2.96%
Note 14 Insurance
Insurance claims and policy benefit liabilities2009 2008
Life and Health $ 8,151 $ 6,676Property and Casualty 532 459Reinsurance 239 250Total $ 8,922 $ 7,385
Future policy benefit liabilities 8,093 6,660Claims liabilities 829 725Total $ 8,922 $ 7,385
The net increase in Insurance claims and policy benefit liabilities overthe prior year comprised: (i) the net increase in life and health andproperty and casualty liabilities attributable to business growth;(ii) the increase due to market movements on assets backing life andhealth, reinsurance and property and casualty liabilities; and (iii) thefavourable impact of the appreciation of the Canadian dollar on U.S.dollar-denominated liabilities.
Furthermore, the review of various actuarial assumptions andcompletion of certain actuarial experience studies resulted in a netincrease of $20 million in life and health insurance liabilities (2008 –a net decrease of $144 million). This was predominantly driven by the
impact of ongoing experience studies, refinements to cash flowmodels and methods, investment portfolio changes and updatedinterest rate assumptions.
ReinsuranceIn the ordinary course of business, our insurance operations reinsurerisks to other insurance and reinsurance companies in order toprovide greater diversification, limit loss exposure to large risks, andprovide additional capacity for future growth. These cedingreinsurance arrangements do not relieve our insurance subsidiariesfrom their direct obligation to the insureds. We evaluate the financialcondition of the reinsurers and monitor our concentrations of creditrisks to minimize our exposure to losses from reinsurer insolvency.
Reinsurance amounts (ceded premiums) included in Non-interestincome for the years ended October 31 are shown in the table below.
Net premiums2009 2008 2007
Gross premiums $ 4,884 $ 3,760 $ 3,445Ceded premiums (995) (896) (852)
$ 3,889 $ 2,864 $ 2,593
Consolidated Financial Statements Royal Bank of Canada: Annual Report 2009 111

Note 15 Other liabilities
2009 2008
Short-term borrowings of subsidiaries $ 3,295 $ 5,402Payable to brokers, dealers and clients 4,922 9,610Accrued interest payable 2,052 2,925Accrued pension and other post-employment benefit expense (1) (refer to Note 20) 1,436 1,383Insurance-related liabilities 488 428Dividends payable 775 701Payroll and related compensation 5,010 3,855Trade payables and related accounts 1,500 2,329Taxes payable 1,946 139Cheques and other items in transit 2,099 1,193Other 7,484 7,844
$ 31,007 $ 35,809
(1) Accrued pension and other post-employment benefit expense represents the cumulative excess of pension and other post-employment benefit expense over pension and other post-employment fund contributions.
Note 16 Subordinated debentures
The debentures are unsecured obligations and are subordinated inright of payment to the claims of depositors and certain othercreditors. All redemptions, cancellations and exchanges ofsubordinated debentures are subject to the consent and approval of
OSFI. All subordinated debentures are redeemable at our option.The amounts presented below are net of our holdings in these
securities which have not been cancelled and are still outstanding.
Maturity Earliest par value redemption date Interest rateDenominated inforeign currency 2009 2008
March 15, 2009 6.50% US$125 $ – $ 151January 27, 2014 January 27, 2009 (1) 3.96% (2) – 500June 1, 2014 June 1, 2009 (1) 4.18% (2) – 1,001November 14, 2014 10.00% 264 271January 25, 2015 January 25, 2010 (3) 7.10% (2) 506 528June 24, 2015 June 24, 2010 3.70% (2) 809 816April 12, 2016 April 12, 2011 (4) 6.30% (2) 403 407March 11, 2018 March 11, 2013 (5) 4.84% (6) 1,048 1,039June 6, 2018 June 6, 2013 (7) 5.00% (8) 1,013 1,012November 4, 2018 November 4, 2013 (9) 5.45% (2) 1,106 1,102June 8, 2023 9.30% 110 110June 26, 2037 June 26, 2017 (10) 2.86% (11) JPY10,000 110 81October 1, 2083 (12) (13) 224 224June 6, 2085 (12) (14) US$189 205 228June 18, 2103 June 18, 2009 (15) 5.95% (16) 673 672
$ 6,471 $ 8,142Deferred financing costs (10) (11)
$ 6,461 $ 8,131
The terms and conditions of the debentures are as follows:(1) Redeemed on the earliest par value redemption date at principal plus accrued interest
to the redemption date.(2) Interest at stated interest rate until earliest par value redemption date, and thereafter at
a rate of 1.00% above the 90-day Bankers’ Acceptance rate.(3) Redeemable at any time prior to the earliest par value redemption date at the greater of:
(i) the fair value of the subordinated debentures based on the yield on Government ofCanada bonds plus 12.5 basis points and (ii) par value, and thereafter at any time at parvalue.
(4) Redeemable at any time prior to the earliest par value redemption date at the greater of:(i) the fair value of the subordinated debentures based on the yield on Government ofCanada bonds plus 22 basis points and (ii) par value, and thereafter at any time at parvalue.
(5) Redeemable at any time prior to the earliest par value redemption date at the greater of:(i) the fair value of the subordinated debentures based on the yield on Government ofCanada bonds plus 42.5 basis points and (ii) par value, and thereafter at any time at parvalue.
(6) Interest at stated interest rate until earliest par value redemption date, and thereafter ata rate of 2.00% above the 90-day Bankers’ Acceptance rate.
(7) Redeemable at any time prior to the earliest par value redemption date at the greater of:(i) the fair value of the subordinated debentures based on the yield on Government ofCanada bonds plus 44 basis points and (ii) par value, and thereafter at any time at parvalue.
(8) Interest at stated interest rate until earliest par value redemption date, and thereafter ata rate of 2.15% above the 90-day Bankers’ Acceptance rate.
(9) Redeemable at any time prior to the earliest par value redemption date at the greater of:(i) the fair value of the subordinated debentures based on the yield on Government ofCanada bonds plus 14 basis points and (ii) par value, and thereafter at any time at parvalue.
(10) Redeemable on or after June 26, 2017 at par value.(11) Fixed interest rate at 2.86% per annum, payable semi-annually.(12) Redeemable on any interest payment date at par value.(13) Interest at a rate of 40 basis points above the 30-day Bankers’ Acceptance rate.(14) Interest at a rate of 25 basis points above the U.S. dollar 3-month LIMEAN. In the event
of a reduction of the annual dividend we declare on our common shares, the interestpayable on the debentures is reduced pro rata to the dividend reduction and the interestreduction is payable with the proceeds from the sale of newly issued common shares.
(15) Redeemable on June 18, 2009, or every fifth anniversary of such date at par value.Redeemable on any other date at the greater of par and the yield on a non-callableGovernment of Canada bond plus 21 basis points if redeemed prior to June 18, 2014, or43 basis points if redeemed at any time after June 18, 2014.
(16) Interest at a rate of 5.95% until earliest par value redemption date and every 5 yearsthereafter at the 5-year Government of Canada yield plus 172 basis points.
Maturity scheduleThe aggregate maturities of subordinated debentures, based on thematurity dates under the terms of issue, are as follows:
2009
Within 1 year $ –1 to 5 years –5 to 10 years 5,149Thereafter 1,322
$ 6,471
112 Royal Bank of Canada: Annual Report 2009 Consolidated Financial Statements

Note 17 Trust capital securities
We issue innovative capital instruments, RBC Trust Capital Securities(RBC TruCS) and RBC Trust Subordinated Notes (RBC TSNs), throughthree SPEs: RBC Capital Trust (Trust), Trust II and Trust III.
In 2008, we issued $500 million of RBC Trust Capital SecuritiesSeries 2008-1 (RBC TruCS 2008-1) through our consolidatedsubsidiary, Trust, a closed-end trust. The issue was priced at $1,000per RBC TruCS 2008-1, and the proceeds were used to fund theTrust’s acquisition of trust assets. The holders of RBC TruCS 2008-1do not have any conversion rights or any other redemption rights. As aresult, upon consolidation of the Trust, RBC TruCS 2008-1 areclassified as Non-controlling interest in subsidiaries (refer toNote 19).
In prior years, we also issued non-voting RBC Trust CapitalSecurities Series 2010, 2011 and 2015 (RBC TruCS 2010, 2011 and2015) through the Trust. RBC TruCS 2010 and 2011 are classified asTrust capital securities. The proceeds of the RBC TruCS 2010 and2011 were used to fund the Trust’s acquisition of trust assets.Holders of RBC TruCS 2010 and 2011 are eligible to receive semi-annual non-cumulative fixed cash distributions.
Unlike the RBC TruCS 2010 and 2011, the holders of RBC TruCS2015 do not have any conversion rights or any other redemptionrights. As a result, upon consolidation of the Trust, RBC TruCS 2015are classified as Non-controlling interest in subsidiaries (refer toNote 19). Holders of RBC TruCS 2015 are eligible to receive semi-annual non-cumulative fixed cash distributions until December 31,2015 and a floating-rate cash distribution thereafter.
Trust II, an open-end trust, has issued non-voting RBC TruCS2013, the proceeds of which were used to purchase a senior deposit
note from us. Trust II is a VIE under AcG-15 (refer to Note 6). We do notconsolidate Trust II as we are not the Primary Beneficiary; therefore,the RBC TruCS 2013 issued by Trust II are not reported on ourConsolidated Balance Sheets, but the senior deposit note is reportedin Business and government deposit liabilities (refer to Note 13).Holders of RBC TruCS 2013 are eligible to receive semi-annualnon-cumulative fixed cash distributions.
No cash distributions will be payable by the trusts on RBC TruCSif we fail to declare regular dividends on our preferred shares, or onour common shares if no preferred shares are then outstanding. Inthis case, the net distributable funds of the trusts will be distributedto us as holders of residual interest in the trusts. Should the trusts failto pay the semi-annual distributions in full, we will not declaredividends of any kind on any of our preferred or common shares for aspecified period of time.
In 2007, we issued $1 billion innovative subordinateddebentures, RBC TSNs – Series A, through Trust III. Trust III is aclosed-end trust. The proceeds were used to purchase a seniordeposit note from us. Trust III is a VIE under AcG -15. We do notconsolidate Trust III as we are not the Primary Beneficiary (refer toNote 6); therefore, the RBC TSNs – Series A issued by Trust III are notreported on our Consolidated Balance Sheet but the senior depositnote issued by us to Trust III is reported in Business and governmentdeposit liabilities (refer to Note 13).
The table below presents the significant terms and conditions ofRBC TruCS and RBC TSNs as at October 31, 2009 and 2008.
Redemption date Conversion date 2009 2008
Issuer Issuance date Distribution datesAnnual
yieldAt the option of
the issuerAt the optionof the holder
Principalamount
Principalamount
RBC Capital Trust (1),(2),(3),(4),(5),(6),(7)Included in Trust capital securities
650,000 Trust Capital Securities – Series 2010 July 24, 2000 June 30, December 31 7.288% December 31, 2005 December 31, 2010 $ 650 $ 650750,000 Trust Capital Securities – Series 2011 December 6, 2000 June 30, December 31 7.183% December 31, 2005 December 31, 2011 750 750
$ 1,400 $ 1,400Included in Non-controlling interest in subsidiaries
1,200,000 Trust Capital Securities – Series 2015 October 28, 2005 June 30, December 31 4.87%(8) December 31, 2010 Holder does not haveconversion option
1,200 1,200
500,000 Trust Capital Securities – Series 2008-1 April 28, 2008 June 30, December 31 6.821%(8) June 30, 2013 Holder does not haveconversion option
500 500
$ 3,100 $ 3,100
RBC Capital Trust II (2),(3),(4),(6),(7),(9)900,000 Trust Capital Securities – Series 2013 July 23, 2003 June 30, December 31 5.812% December 31, 2008 Any time $ 900 $ 900
RBC Subordinated Notes Trust (3),(4),(5),(6),(7),(10),(11)$1 billion 4.58% Trust Subordinated Notes – Series A April 30, 2007 April 30, October 30 4.584% Any time Holder does not have
conversion option$ 1,000 $ 1,000
The significant terms and conditions of the RBC TruCS and RBC TSNs are as follows:(1) Subject to the approval of OSFI, the Trust may, in whole (but not in part), on the
Redemption date specified above, and on any Distribution date thereafter, redeem theRBC TruCS 2008-1, 2010, 2011 and 2015, without the consent of the holders.
(2) Subject to the approval of OSFI, upon occurrence of a special event as defined, prior tothe Redemption date specified above, the trusts may redeem all, but not part of, RBCTruCS 2008-1, 2010, 2011, 2013 or 2015 without the consent of the holders.
(3) Issuer Redemption Price: The RBC TruCS 2008-1 may be redeemed for cash equivalentto: (i) the Early Redemption Price if the redemption occurs prior to June 30, 2018, or(ii) the Redemption Price if the redemption occurs on or after June 30, 2018. The RBCTruCS 2010 and 2011 may be redeemed for cash equivalent to: (i) the Early RedemptionPrice if the redemption occurs earlier than six months prior to the conversion datespecified above, or (ii) the Redemption Price if the redemption occurs on or after thedate that is six months prior to the conversion date as indicated above. The RBC TruCS2013 and 2015 may be redeemed for cash equivalent to: (i) the Early Redemption Priceif the redemption occurs prior to December 31, 2013 and 2015, respectively, or (ii) theRedemption Price if the redemption occurs on or after December 31, 2013 and 2015,respectively. The RBC TSNs – Series A may be redeemed, in whole or in part, subject tothe approval of OSFI, for cash equivalent to: (i) the Early Redemption Price if the notesare redeemed prior to April 30, 2012, or (ii) the Redemption Price if the notes areredeemed on or after April 30, 2012. Redemption Price refers to an amount equal to$1,000 plus the unpaid distributions to the Redemption date. Early Redemption Pricerefers to an amount equal to the greater of: (i) the Redemption Price, and (ii) the pricecalculated to provide an annual yield, equal to the yield on a Government of Canadabond issued on the Redemption date with a maturity date of June 30, 2018, plus77 basis points, for RBC TruCS 2008-1, a maturity date of June 30, 2010 and 2011, plus33 basis points and 40 basis points, for RBC TruCS 2010 and 2011, respectively, and a
maturity date of December 31, 2013 and 2015, plus 23 basis points and 19.5 basispoints, for RBC TruCS 2013 and 2015, respectively; and a maturity date of April 30,2012, plus 11 basis points for RBC TSNs – Series A.
(4) Automatic Exchange Event: Without the consent of the holders, each RBC TruCS 2008-1will be exchanged automatically for 40 of our non-cumulative redeemable BankPreferred Shares Series AI, each RBC TruCS 2010, 2011, 2013 and 2015 will beexchanged automatically for 40 of our non-cumulative redeemable First Preferred SharesSeries Q, R, T and Z, respectively, and each RBC TSN-Series A will be exchangedautomatically for an equal principal amount of Bank Series 10 Subordinated Notes uponoccurrence of any one of the following events: (i) proceedings are commenced for ourwinding-up; (ii) OSFI takes control of us; (iii) we have Tier 1 capital ratio of less than 5%or Total capital ratio of less than 8%; or (iv) OSFI has directed us to increase our capitalor provide additional liquidity and we elect such automatic exchange or we fail tocomply with such direction. The Bank Preferred Shares Series AI and the First PreferredShares Series T and Z pay semi-annual non-cumulative cash dividends and Series T isconvertible at the option of the holder into a variable number of common shares.
(5) From time to time, we purchase some of the innovative capital instruments and holdthem temporarily. As at October 31, 2009 we held $5 million of RBC TruCS 2008-1,$2 million of RBC TruCS 2010, $2 million of RBC TruCS 2011 and $10 million of RBCTSNs – Series A as treasury holdings which were deducted from regulatory capital. As atOctober 31, 2008 we held none.
(6) Regulatory capital: According to OSFI guidelines, innovative capital instruments maycomprise up to 15% of net Tier 1 capital with an additional 5% eligible for Tier 2Bcapital. RBC TSN-Series A qualifies as Tier 2B capital. As at October 31, 2009, $3,991million represents Tier 1 capital (2008 – $3,857 million), $1,017 million represents Tier2B capital (2008 – $1,169 million) and $19 million of our treasury holdings ofinnovative capital is deducted for regulatory capital purposes (2008 – $nil).
Consolidated Financial Statements Royal Bank of Canada: Annual Report 2009 113

Note 17 Trust capital securities (continued)
(7) Holder Exchange Right: Holders of RBC TruCS 2010 and 2011 may exchange, on anydistribution date on or after the conversion date specified above, RBC TruCS 2010 and2011 for 40 non-cumulative redeemable Bank First Preferred Shares, Series Q andSeries R, respectively. Holders of RBC TruCS 2013 may, at any time, exchange all or partof their holdings for 40 non-cumulative redeemable First Preferred Shares Series U, foreach RBC TruCS 2013 held. The First Preferred Shares Series Q, R and U pay semi-annualnon-cumulative cash dividends as and when declared by our Board of Directors and areconvertible at the option of the holder into a variable number of common shares.Holders of RBC TruCS 2008-1, RBC TruCS 2015 and RBC TSNs- Series A do not havesimilar exchange rights.
(8) The non-cumulative cash distribution on the RBC TruCS 2015 will be 4.87% paid semi-annually until December 31, 2015, and at one half of the sum of 180-day Bankers’Acceptance rate plus 1.5%, thereafter. The non-cumulative cash distribution on the RBC
TruCS 2008-1 will be 6.821%, paid semi-annually in an amount of $34.105 on June 30and December 31 of each year until June 30, 2018, and floating distributions thereafterat the six-month Bankers’ Acceptance rate plus 350 basis points.
(9) Subject to the approval of OSFI, Trust II may, in whole or in part, on the Redemption datespecified above, and on any distribution date thereafter, redeem any outstanding RBCTruCS 2013, without the consent of the holders.
(10) The cash distribution on the RBC TSNs – Series A will be 4.58% paid semi-annually untilApril 30, 2012, and at 90-day Bankers’ Acceptance rate plus 1% thereafter paidquarterly until their maturity on April 30, 2017.
(11) We will guarantee the payment of principal, interest, the redemption price, if any, andany other amounts of the RBC TSNs – Series A when they become due and payable,whether at stated maturity, call for redemption, automatic exchange or otherwiseaccording to the terms of the Bank Subordinated Guarantee and the Trust Indenture.
Note 18 Preferred share liabilities and share capital
Authorized share capitalPreferred – An unlimited number of First Preferred Shares and SecondPreferred Shares without nominal or par value, issuable in series; theaggregate consideration for which all the First Preferred Shares and all
the Second Preferred Shares that may be issued may not exceed$20 billion and $5 billion, respectively.
Common – An unlimited number of shares without nominal orpar value may be issued.
Issued and outstanding shares (1)
2009 2008 2007Number of
shares(000s) Amount
Dividendsdeclared
per share
Number ofshares(000s) Amount
Dividendsdeclared
per share
Number ofshares(000s) Amount
Dividendsdeclared
per share
Preferred share liabilitiesFirst preferred
Non-cumulative Series N (2) – $ – $ – – $ – $ .88 11,916 $ 298 $ 1.18Treasury shares – sales – – – – 152 4Treasury shares – purchases – – – – (68) (2)
Preferred share liabilities, net of treasury holdings – $ – – $ – 12,000 $ 300
Preferred sharesFirst preferred (3)
Non-cumulative Series W 12,000 $ 300 $ 1.23 12,000 $ 300 $ 1.23 12,000 $ 300 $ 1.23Non-cumulative Series AA 12,000 300 1.11 12,000 300 1.11 12,000 300 1.11Non-cumulative Series AB 12,000 300 1.18 12,000 300 1.18 12,000 300 1.18Non-cumulative Series AC 8,000 200 1.15 8,000 200 1.15 8,000 200 1.22Non-cumulative Series AD 10,000 250 1.13 10,000 250 1.13 10,000 250 1.06Non-cumulative Series AE 10,000 250 1.13 10,000 250 1.13 10,000 250 .95Non-cumulative Series AF 8,000 200 1.11 8,000 200 1.11 8,000 200 .77Non-cumulative Series AG 10,000 250 1.13 10,000 250 1.13 10,000 250 .65Non-cumulative Series AH 8,500 213 1.41 8,500 213 .81 – – –Non-cumulative, 5-Year Rate Reset Series AJ 16,000 400 1.49 16,000 400 – – – –Non-cumulative, 5-Year Rate Reset Series AL 12,000 300 1.48 – – – – – –Non-cumulative, 5-Year Rate Reset Series AN 9,000 225 1.50 – – – – – –Non-cumulative, 5-Year Rate Reset Series AP 11,000 275 1.34 – – – – – –Non-cumulative, 5-Year Rate Reset Series AR 14,000 350 1.27 – – – – – –Non-cumulative, 5-Year Rate Reset Series AT 11,000 275 1.11 – – – – – –Non-cumulative, 5-Year Rate Reset Series AV 16,000 400 1.01 – – – – – –Non-cumulative, 5-Year Rate Reset Series AX 13,000 325 .87 – – – – – –
$ 4,813 $ 2,663 $2,050
Common sharesBalance at beginning of year 1,341,260 $10,384 1,276,260 $ 7,300 1,280,890 $7,196Issued on new acquisitions – – 59,675 2,937 – –Issued for general business purpose 65,263 2,301 – – – –Issued under Dividend Reinvestment Plan 5,279 232 – – – –Issued under the stock option plan (4) 5,808 158 6,445 153 7,215 170Purchased for cancellation – – (1,120) (6) (11,845) (66)
Balance at end of year 1,417,610 $13,075 $ 2.00 1,341,260 $10,384 $ 2.00 1,276,260 $7,300 $ 1.82
Treasury shares – Preferred sharesBalance at beginning of year (260) $ (5) (249) $ (6) (94) (2)Sales 618 13 1,060 23 1,345 33Purchases (423) (10) (1,071) (22) (1,500) (37)
Balance at end of year (65) $ (2) (260) $ (5) (249) $ (6)
Treasury shares – Common sharesBalance at beginning of year (2,258) $ (104) (2,444) $ (101) (5,486) $ (180)Sales 1,364 59 1,269 51 4,756 175Purchases (1,233) (50) (1,083) (54) (1,714) (96)
Balance at end of year (2,127) $ (95) (2,258) $ (104) (2,444) $ (101)
(1) The 6.75 million exchangeable shares of a wholly owned subsidiary of RBC issued forthe acquisition of PH&N are not included in this table. Refer to Note 11.
(2) On August 22, 2008, we redeemed Non-cumulative First Preferred Shares Series N at aredemption price equal to the carrying value.
(3) First Preferred Shares Series were issued at $25 per share.
(4) Includes fair value adjustments to stock options of $6 million (2008 – $5 million), theexercise of stock options from tandem stock appreciation rights (SARs) awards,resulting in a reversal of the accrued liability, net of related income taxes, of $13 million(2008 – $4 million), and from renounced tandem SARs, net of related income taxes, of$7 million (2008 – $4 million).
114 Royal Bank of Canada: Annual Report 2009 Consolidated Financial Statements

Terms of preferred share liabilities and preferred shares
Dividendper share (1)
Initialperiodannual
yieldDividend
reset rate (6)Redemption
date (2)Issuedate
Redemptionprice (2), (3)
Conversion date (5)
At the option ofthe bank (2), (4)
At the option ofthe holder
Preferred sharesFirst preferred
Non-cumulative Series W $ .306250 4.90% February 24, 2010 January 31, 2005 $ 26.00 February 24, 2010 Not convertibleNon-cumulative Series AA .278125 4.45% May 24, 2011 April 4, 2006 26.00 Not convertible Not convertibleNon-cumulative Series AB .293750 4.70% August 24, 2011 July 20, 2006 26.00 Not convertible Not convertibleNon-cumulative Series AC .287500 4.60% November 24, 2011 November 1, 2006 26.00 Not convertible Not convertibleNon-cumulative Series AD .281250 4.50% February 24, 2012 December 13, 2006 26.00 Not convertible Not convertibleNon-cumulative Series AE .281250 4.50% February 24, 2012 January 19, 2007 26.00 Not convertible Not convertibleNon-cumulative Series AF .278125 4.45% May 24, 2012 March 14, 2007 26.00 Not convertible Not convertibleNon-cumulative Series AG .281250 4.50% May 24, 2012 April 26, 2007 26.00 Not convertible Not convertibleNon-cumulative Series AH .353125 5.65% May 24, 2013 April 29, 2008 26.00 Not convertible Not convertibleNon-cumulative, 5-Year Rate Reset Series AJ .312500 5.00% 1.93% February 24, 2014 September 16, 2008 25.00 Not convertible Not convertibleNon-cumulative, 5-Year Rate Reset Series AL .350000 5.60% 2.67% February 24, 2014 November 3, 2008 25.00 Not convertible Not convertibleNon-cumulative, 5-Year Rate Reset Series AN .390625 6.25% 3.50% February 24, 2014 December 8, 2008 25.00 Not convertible Not convertibleNon-cumulative, 5-Year Rate Reset Series AP .390625 6.25% 4.19% February 24, 2014 January 14, 2009 25.00 Not convertible Not convertibleNon-cumulative, 5-Year Rate Reset Series AR .390625 6.25% 4.50% February 24, 2014 January 29, 2009 25.00 Not convertible Not convertibleNon-cumulative, 5-Year Rate Reset Series AT .390625 6.25% 4.06% August 24, 2014 March 9, 2009 25.00 Not convertible Not convertibleNon-cumulative, 5-Year Rate Reset Series AV .390625 6.25% 4.42% August 24, 2014 April 1, 2009 25.00 Not convertible Not convertibleNon-cumulative, 5-Year Rate Reset Series AX .381250 6.10% 4.13% November 24, 2014 April 29, 2009 25.00 Not convertible Not convertible
(1) Non-cumulative preferential dividends on Series W, AA, AB, AC, AD, AE, AF, AG, AH, AJ,AL, AN, AP, AR, AT, AV and AX are payable quarterly, as and when declared by the Boardof Directors, on or about the 24th day of February, May, August and November.
(2) The redemption price represents the price as at October 31, 2009 or the contractualredemption price, whichever is applicable. Subject to the consent of OSFI and therequirements of the Act, we may, on or after the dates specified above, redeem FirstPreferred Shares. These may be redeemed for cash, in the case of Series W, at a priceper share of $26, if redeemed during the 12 months commencing February 24, 2010,and decreasing by $.25 each 12-month period thereafter to a price per share of $25 ifredeemed on or after February 24, 2014; and in the case of Series AA, at a price pershare of $26, if redeemed during the 12 months commencing May 24, 2011, anddecreasing by $.25 each 12- month period thereafter to a price per share of $25 ifredeemed on or after May 24, 2015; and in the case of Series AB, at a price per share of$26, if redeemed during the 12 months commencing August 24, 2011, and decreasingby $.25 each 12-month period thereafter to a price per share of $25 if redeemed on orafter August 24, 2015; and in the case of Series AC, at a price per share of $26, ifredeemed during the 12 months commencing November 24, 2011, and decreasing by$.25 each 12- month period thereafter to a price per share of $25 if redeemed on orafter November 24, 2015; and in the case of Series AD, at a price per share of $26, ifredeemed during the 12 months commencing February 24, 2012, and decreasing by$.25 each 12- month period thereafter to a price per share of $25 if redeemed on orafter February 24, 2016; and in the case of Series AE, at a price per share of $26, ifredeemed during the 12 months commencing February 24, 2012, and decreasing by$.25 each 12- month period thereafter to a price per share of $25 if redeemed on orafter February 24, 2016; and in the case of Series AF, at a price per share of $26, ifredeemed during the 12 months commencing May 24, 2012, and decreasing by $.25each 12- month period thereafter to a price per share of $25 if redeemed on or afterMay 24, 2016; and in the case of Series AG, at a price per share of $26, if redeemedduring the 12 months commencing May 24, 2012, and decreasing by $.25 each 12-month period thereafter to a price per share of $25 if redeemed on or after May 24,2016; and in the case of Series AH, at a price per share of $26, if redeemed during the12 months commencing May 24, 2013, and decreasing by $.25 each 12- month period
thereafter to a price per share of $25 if redeemed on or after May 24, 2017; and in thecase of Series AJ, at a price per share of $25, if redeemed on February 24, 2014 and oneach February 24 every fifth year thereafter; and in the case of Series AL, at a price pershare of $25, if redeemed on February 24, 2014 and on each February 24 every fifth yearthereafter; and in the case of Series AN, at a price per share of $25, if redeemed onFebruary 24, 2014 and on each February 24 every fifth year thereafter; and in the case ofSeries AP, at a price per share of $25, if redeemed on February 24, 2014 and on eachFebruary 24 every fifth year thereafter; and in the case of Series AR, at a price per shareof $25, if redeemed on February 24, 2014 and on each February 24 every fifth yearthereafter; and in the case of Series AT, at a price per share of $25, if redeemed onAugust 24, 2014 and on each August 24 every fifth year thereafter; and in the case ofSeries AV, at a price per share of $25, if redeemed on August 24, 2014 and on eachAugust 24 every fifth year thereafter; and in the case of Series AX, at a price per share of$25, if redeemed on November 24, 2014 and on each November 24 every fifth yearthereafter.
(3) Subject to the consent of OSFI and the requirements of the Act, we may purchase theFirst Preferred Shares W, AA, AB, AC, AD, AE, AF, AG, AH, AJ, AL, AN, AP, AR, AT, AV andAX for cancellation at the lowest price or prices at which, in the opinion of the Board ofDirectors, such shares are obtainable.
(4) Subject to the approval of the Toronto Stock Exchange, we may, on or after the datesspecified above, convert First Preferred Shares Series W into our common shares. FirstPreferred Shares may be converted into that number of common shares determined bydividing the then-applicable redemption price by the greater of $2.50 and 95% of theweighted average trading price of common shares at such time.
(5) The conversion date refers to the date of conversion to common shares.(6) The dividend rate will reset on the earliest redemption date and every fifth year
thereafter at a rate equal to the 5-year Government of Canada bond yield plus thepremium indicated. The holders have the option to convert their shares into non-cumulative floating rate First Preferred Shares subject to certain conditions on theearliest redemption date and every fifth year thereafter at a rate equal to the three-month Government of Canada Treasury Bill rate plus the premium indicated.
Restrictions on the payment of dividendsWe are prohibited by the Act from declaring any dividends on ourpreferred or common shares when we are, or would be placed as aresult of the declaration, in contravention of the capital adequacy andliquidity regulations or any regulatory directives issued under the Act.We may not pay dividends on our common shares at any time unlessall dividends to which preferred shareholders are then entitled havebeen declared and paid or set apart for payment.
We have agreed that if Trust or Trust II fail to pay any requireddistribution on the trust capital securities in full, we will not declaredividends of any kind on any of our preferred or common shares.Refer to Note 17.
Currently, these limitations do not restrict the payment ofdividends on our preferred or common shares.
We have also agreed that if, on any day we report financialresults for a quarter: (i) we report a cumulative consolidated net lossfor the immediately preceding four quarters, and (ii) during theimmediately preceding quarter we fail to declare any cash dividendson all of our outstanding preferred and common shares, we may deferpayments of interest on the Series 2014-1 Reset Subordinated Notes(matures on June 18, 2103). During any period while interest is being
deferred: (i) interest will accrue on these notes but will notcompound; (ii) we may not declare or pay dividends (except by way ofstock dividend) on, or redeem or repurchase, any of our preferred orcommon shares; and (iii) we may not make any payment of interest,principal or premium on any debt securities or indebtedness forborrowed money issued or incurred by us that rank subordinate tothese notes.
Dividend reinvestment planOur dividend reinvestment plan (plan) provides registered commonshareholders with a means to receive additional common sharesrather than cash dividends. The plan is only open to registeredshareholders residing in Canada or the United States.
Management has the flexibility to fund the plan through openmarket share purchases or treasury issuances.
Shares available for future issuancesAs at October 31, 2009, 62.6 million common shares are available forfuture issue relating to our dividend reinvestment plan and potentialexercise of stock options outstanding. In addition, we may issue up to40 million shares from treasury under the RBC Umbrella Savings andSecurities Purchase Plan that was approved by shareholders onFebruary 26, 2009.
Consolidated Financial Statements Royal Bank of Canada: Annual Report 2009 115

Note 18 Preferred share liabilities and share capital (continued)
OthersWe announced on October 29, 2009, that the Toronto Stock Exchangehas approved RBC to repurchase up to 20 million common shares.Subject to consultation with OSFI, purchases under the NormalCourse Issuer Bid (NCIB) may commence on November 1, 2009 andwill terminate on October 31, 2010.
Normal Course Issuer BidDetails of common shares repurchased under NCIBs during 2009,2008 and 2007 are given below.
2009 2008 2007
NCIB period
Number ofshares
eligible forrepurchase
(000s)
Number ofshares
repurchased(000s)
Averagecost per
share Amount
Number ofshares
eligible forrepurchase
(000s)
Number ofshares
repurchased(000s)
Averagecost per
share Amount
Number ofshares
eligible forrepurchase
(000s)
Number ofshares
repurchased(000s)
Averagecost per
share AmountNovember 1, 2008 –
October 31, 2009 20,000 – $ – $ – – – – – – – – –November 1, 2007 –
October 31, 2008 – – – – 20,000 1,120 $ 49.50 $ 55 – – – –November 1, 2006 –
October 31, 2007 – – – – – – – – 40,000 11,845 $ 54.59 $ 646
Note 19 Non-controlling interest in subsidiaries
2009 2008
RBC Trust Capital Securities (TruCS)– Series 2015 $ 1,219 $ 1,220– Series 2008-1 506 511
Consolidated VIEs 7 205Others 339 435
$ 2,071 $ 2,371
We consolidate VIEs in which we are the Primary Beneficiary. TheseVIEs include structured finance VIEs, investment funds, creditinvestment product VIEs and compensation vehicles as described inNote 6.
We issued RBC TruCS Series 2015 in 2005 and Series 2008-1 in2008 which are reported as Non-controlling interest in subsidiariesupon consolidation as discussed in Note 17. As at October 31, 2009,$20 million (2008 – $20 million) of accrued interest was included inRBC TruCS Series 2015. Series 2008-1 includes $11 million (2008 –$11 million) of accrued interest, net of $5 million (2008 – $nil) oftreasury holdings.
Note 20 Pensions and other post-employment benefits
We offer a number of defined benefit and defined contribution plans,which provide pension and post-employment benefits to eligibleemployees. Our defined benefit pension plans provide benefits basedon years of service, contributions and average earnings at retirement.Our other post-employment benefit plans include health, dental,disability and life insurance coverage.
We fund our registered defined benefit pension plans inaccordance with actuarially determined amounts required to satisfyemployee benefit obligations under current pension regulations. Forour principal pension plans, the most recent actuarial valuationperformed for funding purposes was completed on January 1, 2009.
Due to the market conditions in late 2008, we were required toincrease our pension plans contributions before December 31, 2009based on the results of our January 1, 2009 funding valuation.
For 2009, total contributions to our pension and other post-employment benefit plans were $757 million and $40 million (2008 –$285 million and $43 million), respectively. For 2010, totalcontributions to pension plans and other post-employment benefitplans are expected to be approximately $833 million and $43 million,respectively. The next actuarial valuation for funding purposes will becompleted on January 1, 2010.
For financial reporting purposes, we measure our benefitobligations and pension plan assets as at September 30 each year.
116 Royal Bank of Canada: Annual Report 2009 Consolidated Financial Statements

The following tables present financial information related to all of our material pension and other post-employment plans worldwide, includingexecutive retirement arrangements.
Plan assets, benefit obligation and funded statusPension plans (1) Other post-employment plans (2)
2009 2008 2009 2008
Change in fair value of plan assetsOpening fair value of plan assets $ 5,826 $ 6,784 $ 41 $ 52Actual return on plan assets 272 (877) 1 (4)Company contributions (3) 610 191 40 45Plan participant contributions 31 29 7 6Benefits paid (353) (343) (65) (58)Business acquisitions – 7 – –Other 7 – 2 –Change in foreign currency exchange rate (50) 35 – –
Closing fair value of plan assets $ 6,343 $ 5,826 $ 26 $ 41
Change in benefit obligationOpening benefit obligation $ 6,214 $ 6,846 $ 1,315 $ 1,504Service cost 141 174 14 16Interest cost 413 389 87 83Plan participant contributions 31 29 7 6Actuarial (gain) loss 389 (932) (27) (264)Benefits paid (353) (343) (65) (58)Plan amendments and curtailments (1) (12) – –Business acquisitions – 12 – 11Other 9 – 2 –Change in foreign currency exchange rate (60) 51 (9) 17
Closing benefit obligation $ 6,783 $ 6,214 $ 1,324 $ 1,315
Funded statusExcess of benefit obligation over plan assets $ (440) $ (388) $ (1,298) $ (1,274)Unrecognized net actuarial loss 1,276 769 206 272Unrecognized transitional (asset) obligation (6) (8) 1 1Unrecognized prior service cost 44 62 (259) (283)Contributions between September 30 and October 31 (3) 65 14 3 3
Prepaid asset (accrued liability) as at October 31 $ 939 $ 449 $ (1,347) $ (1,281)
Amounts recognized in our Consolidated Balance Sheets consist of:Other assets $ 1,028 $ 551 $ – $ –Other liabilities (89) (102) (1,347) (1,281)
Net amount recognized as at October 31 $ 939 $ 449 $ (1,347) $ (1,281)
Weighted average assumptions to calculate benefit obligationDiscount rate 6.40% 6.70% 6.39% 6.72%Rate of increase in future compensation 3.30% 3.30% 3.30% 3.30%
(1) For pension plans with funding deficits, the benefit obligations and fair values of plan assets totalled $6,078 million (2008 – $5,359 million) and $5,436 million (2008 – $4,917 million),respectively.
(2) For our other post-employment plans, the assumed healthcare cost trend rates for the next year used to measure the expected cost of benefits covered by the post-employment health and lifeplans were 5.4% for medical decreasing to an ultimate rate of 4.1% in 2018 and 4.5% for dental.
(3) As our measurement date of the pension and other post-employment plans is September 30, company contributions in the above table represent contributions from October 1, 2008 toSeptember 30, 2009. In order to arrive at the total contributions for the year ended October 31, 2009, this amount should be adjusted for the contributions made in the month of October aswell as the defined contribution pension expense presented in the Pension benefit expense table.
Benefits payment projection for defined benefit pension and otherpost-employment plans
Pension plansOther post-
employment plans
2010 $ 375 $ 652011 377 672012 385 702013 394 732014 405 762015-2019 2,203 433
Composition of defined benefit pension plan assetsThe defined benefit pension plan assets are composed of adiversified mix of equity, fixed income and alternative securitiesincluding investments in hedge fund of funds, multi-strategy hedgefunds and infrastructure. The equity securities include 1.4 million(2008 – .4 million) of our common shares having a fair value of $80million (2008 – $20 million). Dividends amounting to $1.9 million(2008 – $1.8 million) were received on our common shares held inthe plan assets during the year.
The following table presents the allocation of the plan assets bysecurities category.
Asset categoryActual
2009 2008
Equity securities 49% 51%Debt securities 45% 45%Other 6% 4%
Total 100% 100%
Investment policy and strategiesPension plan assets are invested prudently over the long term in orderto meet pension obligations at a reasonable cost. The asset mixpolicy takes into consideration a number of factors including thefollowing:(i) investment characteristics including expected returns, volatilities
and correlations between plan assets and plan liabilities;(ii) the plan’s tolerance for risk, which dictates the trade-off
between increased short-term volatility and enhanced long-termexpected returns;
Consolidated Financial Statements Royal Bank of Canada: Annual Report 2009 117
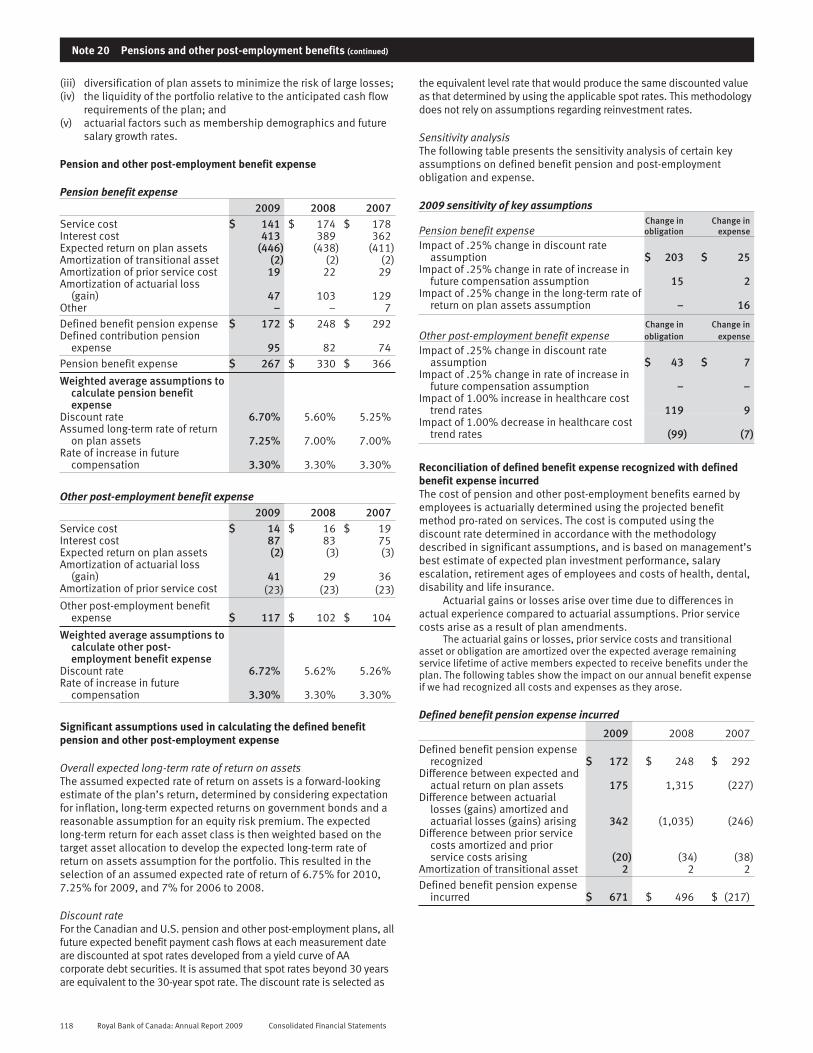
Note 20 Pensions and other post-employment benefits (continued)
(iii) diversification of plan assets to minimize the risk of large losses;(iv) the liquidity of the portfolio relative to the anticipated cash flow
requirements of the plan; and(v) actuarial factors such as membership demographics and future
salary growth rates.
Pension and other post-employment benefit expense
Pension benefit expense2009 2008 2007
Service cost $ 141 $ 174 $ 178Interest cost 413 389 362Expected return on plan assets (446) (438) (411)Amortization of transitional asset (2) (2) (2)Amortization of prior service cost 19 22 29Amortization of actuarial loss
(gain) 47 103 129Other – – 7Defined benefit pension expense $ 172 $ 248 $ 292Defined contribution pension
expense 95 82 74Pension benefit expense $ 267 $ 330 $ 366
Weighted average assumptions tocalculate pension benefitexpense
Discount rate 6.70% 5.60% 5.25%Assumed long-term rate of return
on plan assets 7.25% 7.00% 7.00%Rate of increase in future
compensation 3.30% 3.30% 3.30%
Other post-employment benefit expense2009 2008 2007
Service cost $ 14 $ 16 $ 19Interest cost 87 83 75Expected return on plan assets (2) (3) (3)Amortization of actuarial loss
(gain) 41 29 36Amortization of prior service cost (23) (23) (23)Other post-employment benefit
expense $ 117 $ 102 $ 104
Weighted average assumptions tocalculate other post-employment benefit expense
Discount rate 6.72% 5.62% 5.26%Rate of increase in future
compensation 3.30% 3.30% 3.30%
Significant assumptions used in calculating the defined benefitpension and other post-employment expense
Overall expected long-term rate of return on assetsThe assumed expected rate of return on assets is a forward-lookingestimate of the plan’s return, determined by considering expectationfor inflation, long-term expected returns on government bonds and areasonable assumption for an equity risk premium. The expectedlong-term return for each asset class is then weighted based on thetarget asset allocation to develop the expected long-term rate ofreturn on assets assumption for the portfolio. This resulted in theselection of an assumed expected rate of return of 6.75% for 2010,7.25% for 2009, and 7% for 2006 to 2008.
Discount rateFor the Canadian and U.S. pension and other post-employment plans, allfuture expected benefit payment cash flows at each measurement dateare discounted at spot rates developed from a yield curve of AAcorporate debt securities. It is assumed that spot rates beyond 30 yearsare equivalent to the 30-year spot rate. The discount rate is selected as
the equivalent level rate that would produce the same discounted valueas that determined by using the applicable spot rates. This methodologydoes not rely on assumptions regarding reinvestment rates.
Sensitivity analysisThe following table presents the sensitivity analysis of certain keyassumptions on defined benefit pension and post-employmentobligation and expense.
2009 sensitivity of key assumptions
Pension benefit expenseChange inobligation
Change inexpense
Impact of .25% change in discount rateassumption $ 203 $ 25
Impact of .25% change in rate of increase infuture compensation assumption 15 2
Impact of .25% change in the long-term rate ofreturn on plan assets assumption – 16
Other post-employment benefit expenseChange inobligation
Change inexpense
Impact of .25% change in discount rateassumption $ 43 $ 7
Impact of .25% change in rate of increase infuture compensation assumption – –
Impact of 1.00% increase in healthcare costtrend rates 119 9
Impact of 1.00% decrease in healthcare costtrend rates (99) (7)
Reconciliation of defined benefit expense recognized with definedbenefit expense incurredThe cost of pension and other post-employment benefits earned byemployees is actuarially determined using the projected benefitmethod pro-rated on services. The cost is computed using thediscount rate determined in accordance with the methodologydescribed in significant assumptions, and is based on management’sbest estimate of expected plan investment performance, salaryescalation, retirement ages of employees and costs of health, dental,disability and life insurance.
Actuarial gains or losses arise over time due to differences inactual experience compared to actuarial assumptions. Prior servicecosts arise as a result of plan amendments.
The actuarial gains or losses, prior service costs and transitionalasset or obligation are amortized over the expected average remainingservice lifetime of active members expected to receive benefits under theplan. The following tables show the impact on our annual benefit expenseif we had recognized all costs and expenses as they arose.
Defined benefit pension expense incurred
2009 2008 2007Defined benefit pension expense
recognized $ 172 $ 248 $ 292Difference between expected and
actual return on plan assets 175 1,315 (227)Difference between actuarial
losses (gains) amortized andactuarial losses (gains) arising 342 (1,035) (246)
Difference between prior servicecosts amortized and priorservice costs arising (20) (34) (38)
Amortization of transitional asset 2 2 2Defined benefit pension expense
incurred $ 671 $ 496 $ (217)
118 Royal Bank of Canada: Annual Report 2009 Consolidated Financial Statements

Other post-employment benefit expense incurred
2009 2008 2007
Other post-employment benefitexpense recognized $ 117 $ 102 $ 104
Difference between expected andactual return on plan assets 1 8 (1)
Difference between actuarial losses(gains) amortized and actuariallosses (gains) arising (67) (293) (33)
Difference between prior service costsamortized and prior service costsarising 23 24 23
Other post-employment benefitexpense incurred $ 74 $ (159) $ 93
Note 21 Stock-based compensation
We offer stock-based compensation to certain key employees and toour non-employee directors. We use derivatives and compensationtrusts to manage our economic exposure to volatility in the price ofour common shares under many of these plans. The stock-basedcompensation amounts recorded in Non-interest expense – Humanresources in our Consolidated Statements of Income are net of theimpact of these derivatives.
Stock option plansWe have stock option plans for certain key employees and fornon-employee directors. On November 19, 2002, the Board ofDirectors discontinued all further grants of options under thenon-employee directors plan. Under the employee stock option plan,options are periodically granted to purchase common shares. Theexercise price for each grant is determined as the higher of thevolume-weighted average of the trading prices per board lot(100 shares) of our common shares on the Toronto Stock Exchange:(i) on the day preceding the day of grant, and (ii) the five consecutivetrading days immediately preceding the day of grant. Stock optionsare normally granted at the end of the year, with the exercise pricedetermined at least five business days after the release of theyear-end financial results. The options vest over a four-year period foremployees and are exercisable for a period not exceeding 10 yearsfrom the grant date.
For options issued prior to November 1, 2002, that were notaccompanied by tandem SARs, no compensation expense wasrecognized as the option’s exercise price was not less than themarket price of the underlying stock on the day of grant. When theoptions are exercised, the proceeds received are credited to commonshares.
Between November 29, 1999 and June 5, 2001, grants of optionsunder the employee stock option plan were accompanied by tandemSARs. With tandem SARs, participants could choose to exercise a SARinstead of the corresponding option. In such cases, the participantsreceived a cash payment equal to the difference between the closingprice of common shares on the day immediately preceding the day ofexercise and the exercise price of the option. During the last quarterof 2002 and first quarter of 2003, certain executive participantsvoluntarily renounced their SARs while retaining the correspondingoptions. SARs obligations are now fully vested and give rise tocompensation expense as a result of changes in the market price ofour common shares. These grants, which are accompanied by tandemSARs, resulted in a compensation expense of $8 million for the yearended October 31, 2009 (2008 – $21 million gain; 2007 –$19 million expense).
A summary of our stock option activity and related information2009 2008 2007
Numberof options
(000s)
Weightedaverage
exercise price
Numberof options
(000s)
Weightedaverage
exercise price
Numberof options
(000s)
Weightedaverage
exercise price
Outstanding at beginning of year 21,773 $ 31.66 26,623 $ 27.71 32,243 $ 24.66Granted 2,659 35.29 2,020 52.87 1,835 55.06Exercised – Common shares (1), (2) (5,808) 22.69 (6,445) 21.72 (7,215) 21.10
– SARs (397) 19.84 (148) 19.30 (204) 21.50Cancelled (350) 33.72 (277) 48.36 (36) 36.42
Outstanding at end of year 17,877 $ 35.32 21,773 $ 31.66 26,623 $ 27.71
Exercisable at end of year 12,806 $ 31.68 17,247 $ 26.92 21,924 $ 24.17Available for grant 17,999 19,925 21,527
(1) Cash received for options exercised during the year was $132 million (2008 – $140 million; 2007 – $152 million).(2) New shares were issued for all options exercised in 2009, 2008 and 2007. Refer to Note 18.
Consolidated Financial Statements Royal Bank of Canada: Annual Report 2009 119
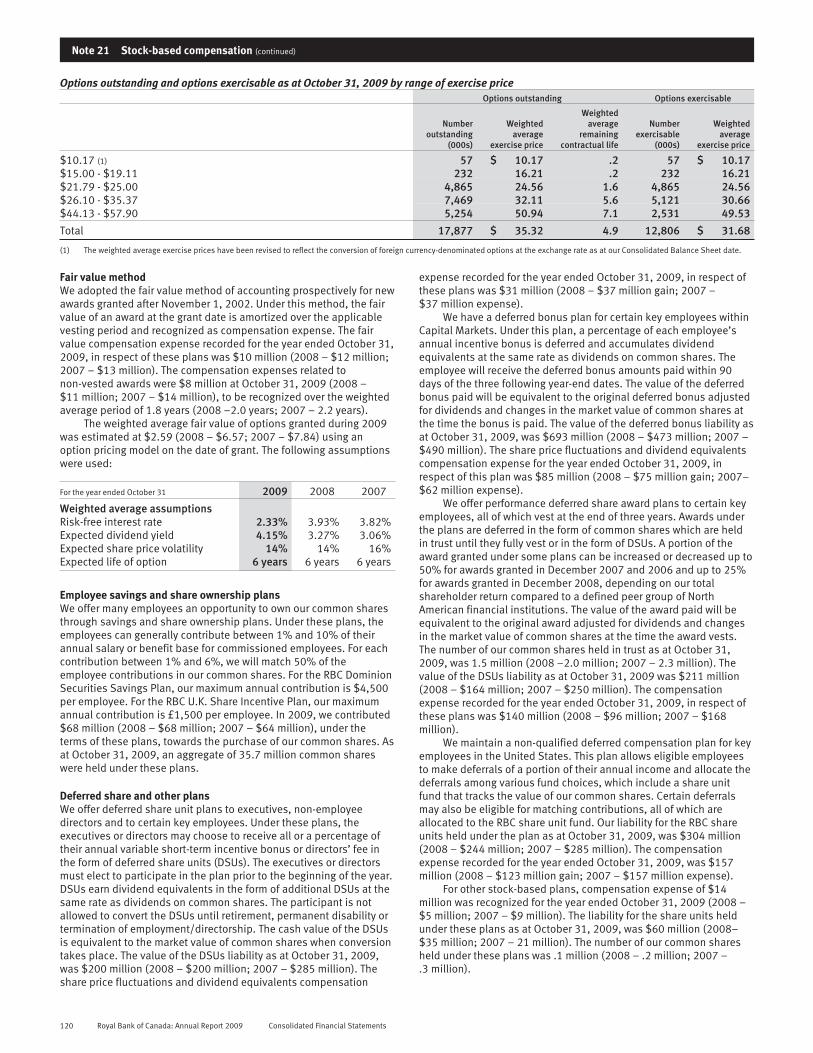
Note 21 Stock-based compensation (continued)
Options outstanding and options exercisable as at October 31, 2009 by range of exercise priceOptions outstanding Options exercisable
Numberoutstanding
(000s)
Weightedaverage
exercise price
Weightedaverage
remainingcontractual life
Numberexercisable
(000s)
Weightedaverage
exercise price
$10.17 (1) 57 $ 10.17 .2 57 $ 10.17$15.00 - $19.11 232 16.21 .2 232 16.21$21.79 - $25.00 4,865 24.56 1.6 4,865 24.56$26.10 - $35.37 7,469 32.11 5.6 5,121 30.66$44.13 - $57.90 5,254 50.94 7.1 2,531 49.53
Total 17,877 $ 35.32 4.9 12,806 $ 31.68
(1) The weighted average exercise prices have been revised to reflect the conversion of foreign currency-denominated options at the exchange rate as at our Consolidated Balance Sheet date.
Fair value methodWe adopted the fair value method of accounting prospectively for newawards granted after November 1, 2002. Under this method, the fairvalue of an award at the grant date is amortized over the applicablevesting period and recognized as compensation expense. The fairvalue compensation expense recorded for the year ended October 31,2009, in respect of these plans was $10 million (2008 – $12 million;2007 – $13 million). The compensation expenses related tonon-vested awards were $8 million at October 31, 2009 (2008 –$11 million; 2007 – $14 million), to be recognized over the weightedaverage period of 1.8 years (2008 –2.0 years; 2007 – 2.2 years).
The weighted average fair value of options granted during 2009was estimated at $2.59 (2008 – $6.57; 2007 – $7.84) using anoption pricing model on the date of grant. The following assumptionswere used:
For the year ended October 31 2009 2008 2007
Weighted average assumptionsRisk-free interest rate 2.33% 3.93% 3.82%Expected dividend yield 4.15% 3.27% 3.06%Expected share price volatility 14% 14% 16%Expected life of option 6 years 6 years 6 years
Employee savings and share ownership plansWe offer many employees an opportunity to own our common sharesthrough savings and share ownership plans. Under these plans, theemployees can generally contribute between 1% and 10% of theirannual salary or benefit base for commissioned employees. For eachcontribution between 1% and 6%, we will match 50% of theemployee contributions in our common shares. For the RBC DominionSecurities Savings Plan, our maximum annual contribution is $4,500per employee. For the RBC U.K. Share Incentive Plan, our maximumannual contribution is £1,500 per employee. In 2009, we contributed$68 million (2008 – $68 million; 2007 – $64 million), under theterms of these plans, towards the purchase of our common shares. Asat October 31, 2009, an aggregate of 35.7 million common shareswere held under these plans.
Deferred share and other plansWe offer deferred share unit plans to executives, non-employeedirectors and to certain key employees. Under these plans, theexecutives or directors may choose to receive all or a percentage oftheir annual variable short-term incentive bonus or directors’ fee inthe form of deferred share units (DSUs). The executives or directorsmust elect to participate in the plan prior to the beginning of the year.DSUs earn dividend equivalents in the form of additional DSUs at thesame rate as dividends on common shares. The participant is notallowed to convert the DSUs until retirement, permanent disability ortermination of employment/directorship. The cash value of the DSUsis equivalent to the market value of common shares when conversiontakes place. The value of the DSUs liability as at October 31, 2009,was $200 million (2008 – $200 million; 2007 – $285 million). Theshare price fluctuations and dividend equivalents compensation
expense recorded for the year ended October 31, 2009, in respect ofthese plans was $31 million (2008 – $37 million gain; 2007 –$37 million expense).
We have a deferred bonus plan for certain key employees withinCapital Markets. Under this plan, a percentage of each employee’sannual incentive bonus is deferred and accumulates dividendequivalents at the same rate as dividends on common shares. Theemployee will receive the deferred bonus amounts paid within 90days of the three following year-end dates. The value of the deferredbonus paid will be equivalent to the original deferred bonus adjustedfor dividends and changes in the market value of common shares atthe time the bonus is paid. The value of the deferred bonus liability asat October 31, 2009, was $693 million (2008 – $473 million; 2007 –$490 million). The share price fluctuations and dividend equivalentscompensation expense for the year ended October 31, 2009, inrespect of this plan was $85 million (2008 – $75 million gain; 2007–$62 million expense).
We offer performance deferred share award plans to certain keyemployees, all of which vest at the end of three years. Awards underthe plans are deferred in the form of common shares which are heldin trust until they fully vest or in the form of DSUs. A portion of theaward granted under some plans can be increased or decreased up to50% for awards granted in December 2007 and 2006 and up to 25%for awards granted in December 2008, depending on our totalshareholder return compared to a defined peer group of NorthAmerican financial institutions. The value of the award paid will beequivalent to the original award adjusted for dividends and changesin the market value of common shares at the time the award vests.The number of our common shares held in trust as at October 31,2009, was 1.5 million (2008 –2.0 million; 2007 – 2.3 million). Thevalue of the DSUs liability as at October 31, 2009 was $211 million(2008 – $164 million; 2007 – $250 million). The compensationexpense recorded for the year ended October 31, 2009, in respect ofthese plans was $140 million (2008 – $96 million; 2007 – $168million).
We maintain a non-qualified deferred compensation plan for keyemployees in the United States. This plan allows eligible employeesto make deferrals of a portion of their annual income and allocate thedeferrals among various fund choices, which include a share unitfund that tracks the value of our common shares. Certain deferralsmay also be eligible for matching contributions, all of which areallocated to the RBC share unit fund. Our liability for the RBC shareunits held under the plan as at October 31, 2009, was $304 million(2008 – $244 million; 2007 – $285 million). The compensationexpense recorded for the year ended October 31, 2009, was $157million (2008 – $123 million gain; 2007 – $157 million expense).
For other stock-based plans, compensation expense of $14million was recognized for the year ended October 31, 2009 (2008 –$5 million; 2007 – $9 million). The liability for the share units heldunder these plans as at October 31, 2009, was $60 million (2008–$35 million; 2007 – 21 million). The number of our common sharesheld under these plans was .1 million (2008 – .2 million; 2007 –.3 million).
120 Royal Bank of Canada: Annual Report 2009 Consolidated Financial Statements
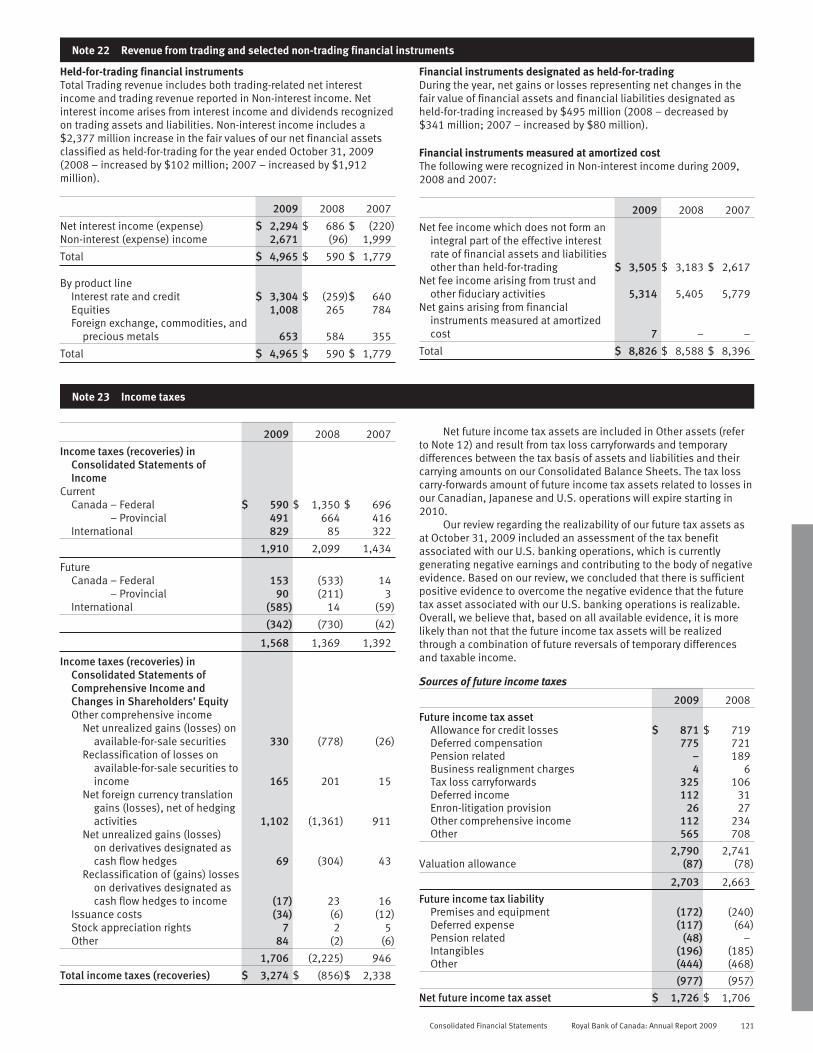
Note 22 Revenue from trading and selected non-trading financial instruments
Held-for-trading financial instrumentsTotal Trading revenue includes both trading-related net interestincome and trading revenue reported in Non-interest income. Netinterest income arises from interest income and dividends recognizedon trading assets and liabilities. Non-interest income includes a$2,377 million increase in the fair values of our net financial assetsclassified as held-for-trading for the year ended October 31, 2009(2008 – increased by $102 million; 2007 – increased by $1,912million).
2009 2008 2007
Net interest income (expense) $ 2,294 $ 686 $ (220)Non-interest (expense) income 2,671 (96) 1,999
Total $ 4,965 $ 590 $ 1,779
By product lineInterest rate and credit $ 3,304 $ (259)$ 640Equities 1,008 265 784Foreign exchange, commodities, and
precious metals 653 584 355
Total $ 4,965 $ 590 $ 1,779
Financial instruments designated as held-for-tradingDuring the year, net gains or losses representing net changes in thefair value of financial assets and financial liabilities designated asheld-for-trading increased by $495 million (2008 – decreased by$341 million; 2007 – increased by $80 million).
Financial instruments measured at amortized costThe following were recognized in Non-interest income during 2009,2008 and 2007:
2009 2008 2007
Net fee income which does not form anintegral part of the effective interestrate of financial assets and liabilitiesother than held-for-trading $ 3,505 $ 3,183 $ 2,617
Net fee income arising from trust andother fiduciary activities 5,314 5,405 5,779
Net gains arising from financialinstruments measured at amortizedcost 7 – –
Total $ 8,826 $ 8,588 $ 8,396
Note 23 Income taxes
2009 2008 2007
Income taxes (recoveries) inConsolidated Statements ofIncome
CurrentCanada – Federal $ 590 $ 1,350 $ 696
– Provincial 491 664 416International 829 85 322
1,910 2,099 1,434
FutureCanada – Federal 153 (533) 14
– Provincial 90 (211) 3International (585) 14 (59)
(342) (730) (42)
1,568 1,369 1,392
Income taxes (recoveries) inConsolidated Statements ofComprehensive Income andChanges in Shareholders' EquityOther comprehensive income
Net unrealized gains (losses) onavailable-for-sale securities 330 (778) (26)
Reclassification of losses onavailable-for-sale securities toincome 165 201 15
Net foreign currency translationgains (losses), net of hedgingactivities 1,102 (1,361) 911
Net unrealized gains (losses)on derivatives designated ascash flow hedges 69 (304) 43
Reclassification of (gains) losseson derivatives designated ascash flow hedges to income (17) 23 16
Issuance costs (34) (6) (12)Stock appreciation rights 7 2 5Other 84 (2) (6)
1,706 (2,225) 946
Total income taxes (recoveries) $ 3,274 $ (856)$ 2,338
Net future income tax assets are included in Other assets (referto Note 12) and result from tax loss carryforwards and temporarydifferences between the tax basis of assets and liabilities and theircarrying amounts on our Consolidated Balance Sheets. The tax losscarry-forwards amount of future income tax assets related to losses inour Canadian, Japanese and U.S. operations will expire starting in2010.
Our review regarding the realizability of our future tax assets asat October 31, 2009 included an assessment of the tax benefitassociated with our U.S. banking operations, which is currentlygenerating negative earnings and contributing to the body of negativeevidence. Based on our review, we concluded that there is sufficientpositive evidence to overcome the negative evidence that the futuretax asset associated with our U.S. banking operations is realizable.Overall, we believe that, based on all available evidence, it is morelikely than not that the future income tax assets will be realizedthrough a combination of future reversals of temporary differencesand taxable income.
Sources of future income taxes
2009 2008
Future income tax assetAllowance for credit losses $ 871 $ 719Deferred compensation 775 721Pension related – 189Business realignment charges 4 6Tax loss carryforwards 325 106Deferred income 112 31Enron-litigation provision 26 27Other comprehensive income 112 234Other 565 708
2,790 2,741Valuation allowance (87) (78)
2,703 2,663
Future income tax liabilityPremises and equipment (172) (240)Deferred expense (117) (64)Pension related (48) –Intangibles (196) (185)Other (444) (468)
(977) (957)
Net future income tax asset $ 1,726 $ 1,706
Consolidated Financial Statements Royal Bank of Canada: Annual Report 2009 121

Note 23 Income taxes (continued)
Reconciliation to statutory tax rate
2009 2008 2007
Income taxes at Canadian statutory tax rate $ 1,735 31.4% $ 1,952 32.5% $ 2,431 34.6%(Decrease) increase in income taxes resulting from
Lower average tax rate applicable to subsidiaries (359) (6.5) (450) (7.5) (734) (10.4)Goodwill impairment charge 314 5.7 – – – –Tax-exempt income from securities (300) (5.4) (326) (5.4) (272) (3.9)Tax rate change – – 51 .8 30 .4Other 178 3.2 142 2.4 (63) (0.9)
Income taxes reported in Consolidated Statements of Income and effective tax rate $ 1,568 28.4% $ 1,369 22.8% $ 1,392 19.8%
International earnings of certain subsidiaries would be taxed onlyupon their repatriation to Canada. We have not recognized a futureincome tax liability for these undistributed earnings as we do notcurrently expect them to be repatriated. Taxes that would be payable
if all foreign subsidiaries’ accumulated unremitted earnings wererepatriated are estimated at $821 million as at October 31, 2009(2008 – $920 million; 2007 – $843 million).
Note 24 Earnings per share
2009 2008 2007
Basic earnings per shareNet income $ 3,858 $ 4,555 $ 5,492Preferred share dividends (233) (101) (88)
Net income available to common shareholders $ 3,625 $ 4,454 $ 5,404
Average number of common shares (in thousands) 1,398,675 1,305,706 1,273,185Basic earnings per share $ 2.59 $ 3.41 $ 4.24
Diluted earnings per shareNet income available to common shareholders $ 3,625 $ 4,454 $ 5,404
Average number of common shares (in thousands) 1,398,675 1,305,706 1,273,185Stock options (1) 5,002 8,497 13,254Issuable under other stock-based compensation plans 2,036 2,148 2,875Exchangeable shares (2) 6,413 3,393 –
Average number of diluted common shares (in thousands) 1,412,126 1,319,744 1,289,314Diluted earnings per share $ 2.57 $ 3.38 $ 4.19
(1) The dilutive effect of stock options was calculated using the treasury stock method. For 2009, we excluded from the calculation of diluted EPS 5,294,977 average options outstanding with anexercise price of $50.89 as the exercise price of these options was greater than the average market price of our common shares. For 2008, we excluded from the calculation of dilutedearnings per share 3,541,989 average options outstanding with an exercise price of $53.99 as the exercise price of these options was greater than the average market price of our commonshares. For 2007, we excluded from the calculation of diluted earnings per share 16,224 average options outstanding with an exercise price of $57.90 as the exercise price of these optionswas greater than the average market price of our common shares.
(2) During 2008, exchangeable shares were issued for the acquisition of PH&N. Refer to Note 11.
122 Royal Bank of Canada: Annual Report 2009 Consolidated Financial Statements

Note 25 Guarantees, commitments and contingencies
GuaranteesThe table below summarizes significant guarantees we have providedto third parties. As the carrying value of the financial guarantees isnot indicative of the maximum potential amount of future payments,we continue to consider financial guarantees as off-balance sheet
credit instruments. The maximum potential amount of futurepayments represents the maximum risk of loss if there was a totaldefault by the guaranteed parties, without consideration of possiblerecoveries under recourse provisions, insurance policies or fromcollateral held or pledged.
2009 2008Maximum potential
amount of futurepayments
Carryingamount
Maximum potentialamount of future
paymentsCarryingamount
Credit derivatives and written put options (1) $ 19,720 $ 1,049 $ 43,700 $ 5,742Backstop liquidity facilities (2) 24,982 66 40,892 59Stable value products (3) 21,777 260 24,876 –Financial standby letters of credit and performance guarantees (4) 18,082 96 22,185 75Credit enhancements 3,240 45 4,873 22Mortgage loans sold with recourse 1,103 – 210 –
(1) The carrying amount is included in Other – Derivatives on our Consolidated Balance Sheets. The notional amount of the contract approximates the maximum potential amount of futurepayments.
(2) Certain RBC-administered multi-seller asset-backed commercial paper conduit programs drew down certain of our backstop liquidity facilities. As at October 31, 2009, these loans totalledUS$1.6 billion (C$1.7 billion) before the allowance for loan losses of US$2 million (C$2 million) and are included in Wholesale Loans – Business on our Consolidated Balance Sheets.
(3) The notional amount of the contract approximates the maximum potential amount of future payments. The maximum potential amount of future payments comprise $8.3 billion (October 31,2008 – $9.4 billion) for bank-owned life insurance policies and $13.5 billion (October 31, 2008 – $15.4 billion) for U.S. Employee Retirement Income Security Act of 1974 (ERISA)-governedpension plans such as 401(k) plans. During the year, we recorded unrealized losses of approximately $111 million (2008 – $149 million) in connection with the bank-owned life insurancepolicies stable value contracts. Almost all of the unrealized losses, mostly related to changes in cash flow projections and discount rates, were related to one contract that was restructured toremove the economic consequences of an early surrender of the bank-owned life insurance policy and establish a fixed derivative maturity date.
(4) The carrying amount is included in Other – Other liabilities on our Consolidated Balance Sheets. The amount includes $.8 billion (2008 – $1.4 billion) maximum potential amount of futurepayments related to the ARS TOB programs and represents the higher of the notional amounts of the letters of credit and the liquidity facilities.
In addition to the above guarantees, we transact substantially all ofour securities lending activities in which we act as an agent for theowners of securities through our joint venture, RBC Dexia IS. As atOctober 31, 2009, RBC Dexia IS securities lending indemnificationstotalled $34.7 billion (2008 – $45.7 billion); we are exposed to 50%of this amount.
Except for credit derivatives and written put options, our clientsgenerally have the right to request settlement of, or draw on, ourguarantees within one year; however, these guarantees can only bedrawn if certain conditions are met. These conditions, along withcollateral requirements, are described below. Generally, our creditderivatives and written put options are effective immediately uponexecution of the contract. The settlement of these instruments isdependent on the occurrence of specified events, which are alsodescribed below. We believe that it is highly unlikely that all orsubstantially all of the guarantees will be drawn or settled within oneyear, and contracts may expire without being drawn or settled.
Credit derivatives and written put optionsOur clients may enter into credit derivatives or written put options forspeculative or hedging purposes. AcG-14 defines a guarantee toinclude derivative contracts that contingently require us to makepayments to a guaranteed party based on changes in an underlyingthat is related to an asset, a liability or an equity security of aguaranteed party. We have disclosed only amounts for transactionswhere it would be probable, based on the information available to us,that the client would use the credit derivative or written put option toprotect against changes in an underlying that is related to an asset, aliability or an equity security held by the client.
We enter into written credit derivatives that are over-the-countercontractual agreements to compensate another party for its financialloss following the occurrence of a credit event in relation to aspecified reference obligation, such as a bond or loan. The terms ofthese credit derivatives vary based on the contract and generallyexpire within 10 years.
We enter into written put options that are contractual agree-ments under which we grant the purchaser the right, but not theobligation, to sell, by or at a set date, a specified amount of afinancial instrument at a predetermined price. Written put optionsthat typically qualify as guarantees include foreign exchangecontracts, equity-based contracts and certain commodity-basedcontracts. The term of these options varies based on the contract andcan range up to nine years.
Collateral we hold for credit derivatives and written put optionsis managed on a portfolio basis and may include cash, governmentT-bills and bonds.
Backstop liquidity facilitiesBackstop liquidity facilities are provided to asset-backed commercialpaper conduit programs (programs) administered by us and thirdparties, as an alternative source of financing in the event that suchprograms are unable to access commercial paper markets, or inlimited circumstances, when predetermined performance measures ofthe financial assets owned by these programs are not met. Wegenerally provide liquidity facilities for a term of one to three years.
Backstop liquidity facilities are also provided to non-asset-backed programs such as variable rate demand notes issued by thirdparties. These standby facilities provide liquidity support to the issuerto buy the notes if the issuer is unable to remarket the notes, as longas the instrument and/or the issuer maintains the investment graderating.
The terms of the backstop liquidity facilities do not require us toadvance money to these programs in the event of bankruptcy or topurchase non-performing or defaulted assets.
Stable value productsWe sell stable value products that offer book value protectionprimarily to plan sponsors of United States Employee RetirementIncome Security Act of 1974 (ERISA)-governed pension plans such as401(k) plans and 457 plans as well as bank-owned life insurancepolicies. The book value protection is provided on portfolios ofintermediate/short-term fixed income securities and is intended tocover any shortfall in the event that plan participants withdraw funds,policyholders surrender their life insurance policies, or the contract issettled at the termination date when market value is below bookvalue.
Financial standby letters of credit and performance guaranteesFinancial standby letters of credit and performance guaranteesrepresent irrevocable assurances that we will make payments in theevent that a client cannot meet its obligations to third parties. Forcertain guarantees, the guaranteed party can request payment fromus even though the client has not defaulted on its obligations. Theterm of these guarantees can range up to eight years. Our policy forrequiring collateral security with respect to these instruments and thetypes of collateral security held is generally the same as for loans.
Consolidated Financial Statements Royal Bank of Canada: Annual Report 2009 123

Note 25 Guarantees, commitments and contingencies (continued)
When collateral security is taken, it is determined on anaccount-by-account basis according to the risk of the borrower andthe specifics of the transaction. Collateral security may include cash,securities and other assets pledged.
Credit enhancementsWe provide partial credit enhancement to multi-seller programsadministered by us to protect commercial paper investors in the eventthat the collection on the underlying assets, the transaction-specificcredit enhancement or the liquidity proves to be insufficient to pay formaturing commercial paper. Each of the asset pools is structured toachieve a high investment-grade credit profile through creditenhancement related to each transaction. The term of these creditfacilities is approximately three years.
Mortgage loans sold with recourseThrough our various agreements with investors, we may be requiredto repurchase U.S. originated mortgage loans sold to an investor if theloans are uninsured for greater than one year, or refund any premiumreceived where mortgage loans are prepaid or in default within 120days. The mortgage loans are fully collateralized by residentialproperties.
Securities lending indemnificationsWe generally transact securities lending transactions through our jointventure, RBC Dexia IS. In these transactions, RBC Dexia IS acts as anagent for the owner of a security, who agrees to lend the security to aborrower for a fee, under the terms of a pre-arranged contract. Theborrower must fully collateralize the security loaned at all times. Aspart of this custodial business, an indemnification may be provided tosecurities lending customers to ensure that the fair value of securitiesloaned will be returned in the event that the borrower fails to return theborrowed securities and the collateral held is insufficient to cover thefair value of those securities. These indemnifications normallyterminate without being drawn upon. The term of theseindemnifications varies, as the securities loaned are recallable ondemand. Collateral held for our securities lending transactionstypically includes cash or securities that are issued or guaranteed bythe Canadian government, U.S. government or other OECD countries.
IndemnificationsIn the normal course of our operations, we provide indemnificationswhich are often standard contractual terms to counterparties intransactions such as purchase and sale contracts, fiduciary, agency,licensing and service agreements, director/officer contracts andleasing transactions. These indemnification agreements may requireus to compensate the counterparties for costs incurred as a result ofchanges in laws and regulations (including tax legislation) or as aresult of litigation claims or statutory sanctions that may be sufferedby the counterparty as a consequence of the transaction. The terms ofthese indemnification agreements will vary based on the contract. Thenature of the indemnification agreements prevents us from making areasonable estimate of the maximum potential amount we could berequired to pay to counterparties. Historically, we have not made anysignificant payments under such indemnifications.
Other off-balance sheet credit instrumentsIn addition to financial guarantees, we utilize other off-balance sheetcredit instruments to meet the financing needs of our clients. Thecontractual amounts of these credit instruments represent themaximum possible credit risk without taking into account the fairvalue of any collateral, in the event other parties fail to perform theirobligations under these instruments.
Commitments to extend credit represent unused portions ofauthorizations to extend credit in the form of loans, bankers’acceptances or letters of credit.
In securities lending transactions, we lend our own or our clients’securities to a borrower for a fee under the terms of a pre-arrangedcontract. The borrower must fully collateralize the security loaned atall times.
Uncommitted amounts represent an amount for which we retainthe option to extend credit to a borrower.
Documentary and commercial letters of credit, which are writtenundertakings by us on behalf of a client authorizing a third party todraw drafts on us up to a stipulated amount under specific terms andconditions, are collateralized by the underlying shipment of goods towhich they relate.
Our credit review process, our policy for requiring collateralsecurity and the types of collateral security held are generally thesame as for loans. Except for our securities lending and uncommittedamounts, our other off-balance sheet credit instruments can generallybe drawn at any time within the term to maturity, and our clients maydraw on these facilities within one year from October 31, 2009.However, many of these instruments expire without being drawnupon. As a result, the contractual amounts may not necessarilyrepresent our actual future credit risk exposure or cash flowrequirements.
The following table summarizes the contractual amounts of our otheroff-balance sheet credit instruments.
Other off-balance sheet credit instruments
2009 2008
Commitments to extend credit (1)
Original term to maturity of 1 year or less $ 28,989 $ 44,135Original term to maturity of more than 1 year 52,475 60,572
Securities lending 22,746 27,547Uncommitted amounts (2) 181,172 170,780Documentary and commercial letters of credit 481 558
$ 285,863 $ 303,592
(1) Includes liquidity facilities.(2) Uncommitted amounts include uncommitted liquidity loan facilities of $24.9 billion
(2008 – $41.4 billion) provided to RBC-administered multi-seller conduits. As atOctober 31, 2009, $nil (2008 – $nil) was drawn upon on these facilities and is includedin Loans.
Pledged assetsIn the ordinary course of business, we pledge assets with terms andconditions that are usual and customary to our regular lending,borrowing and trading activities recorded on our ConsolidatedBalance Sheets. The following are examples of our general terms andconditions on pledged assets:• The risks and rewards of the pledged assets reside with the
pledgor.• The pledged asset is returned to the pledgor when the necessary
conditions have been satisfied.• The right of the pledgee to sell or re-pledge the asset is
dependent on the specific agreement under which the collateralis pledged.
• If there is no default, the pledgee must return the comparableasset to the pledgor upon satisfaction of the obligation.
We are also required to provide intraday pledges to the Bank ofCanada when we use the Large Value Transfer System (LVTS), which isa real-time electronic wire transfer system that continuouslyprocesses all Canadian dollar large-value or time-critical paymentsthroughout the day. The pledged assets earmarked for LVTS activitiesare normally released back to us at the end of the settlement cycleeach day. Therefore, the pledged assets amount is not included in thetable below. For the year ended October 31, 2009, we had on average$4.5 billion (2008 – $3.2 billion) of assets pledged intraday to theBank of Canada on a daily basis. There are infrequent occasionswhere we are required to take an overnight advance from the Bank ofCanada to cover a settlement requirement, in which case anequivalent value of the pledged assets would be used to secure theadvance. There were no overnight advances taken on October 31,2009 and October 31, 2008.
124 Royal Bank of Canada: Annual Report 2009 Consolidated Financial Statements
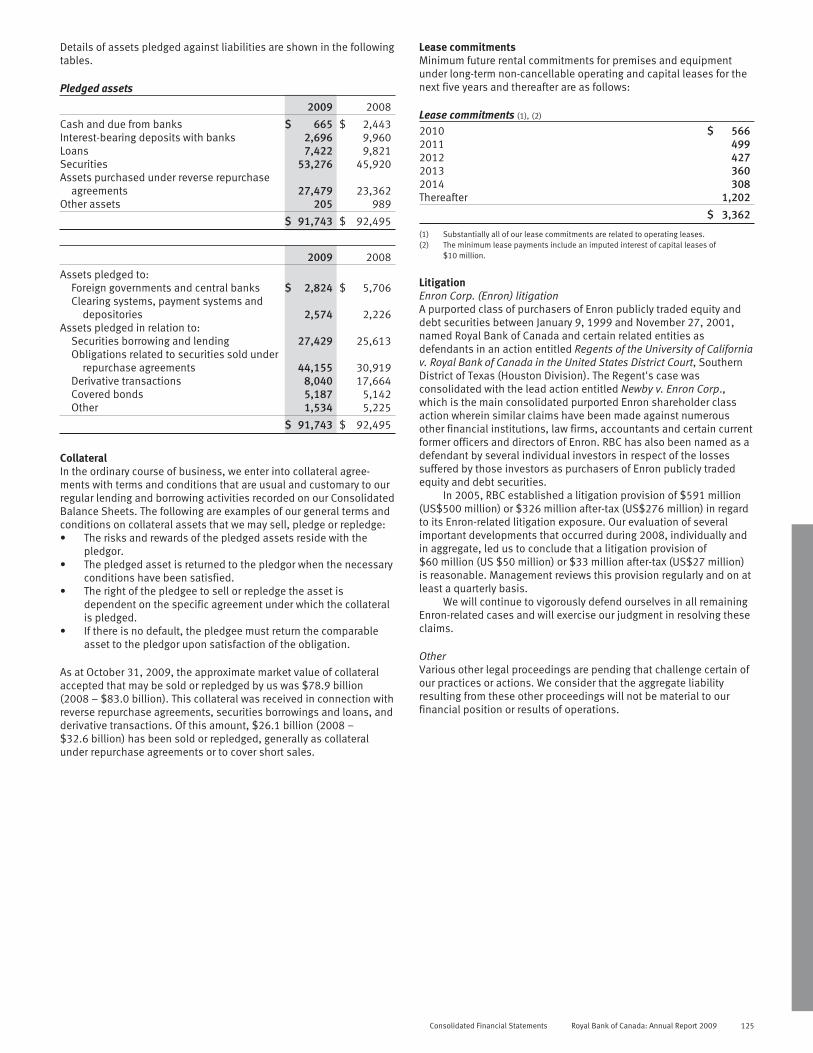
Details of assets pledged against liabilities are shown in the followingtables.
Pledged assets
2009 2008
Cash and due from banks $ 665 $ 2,443Interest-bearing deposits with banks 2,696 9,960Loans 7,422 9,821Securities 53,276 45,920Assets purchased under reverse repurchase
agreements 27,479 23,362Other assets 205 989
$ 91,743 $ 92,495
2009 2008
Assets pledged to:Foreign governments and central banks $ 2,824 $ 5,706Clearing systems, payment systems and
depositories 2,574 2,226Assets pledged in relation to:
Securities borrowing and lending 27,429 25,613Obligations related to securities sold under
repurchase agreements 44,155 30,919Derivative transactions 8,040 17,664Covered bonds 5,187 5,142Other 1,534 5,225
$ 91,743 $ 92,495
CollateralIn the ordinary course of business, we enter into collateral agree-ments with terms and conditions that are usual and customary to ourregular lending and borrowing activities recorded on our ConsolidatedBalance Sheets. The following are examples of our general terms andconditions on collateral assets that we may sell, pledge or repledge:• The risks and rewards of the pledged assets reside with the
pledgor.• The pledged asset is returned to the pledgor when the necessary
conditions have been satisfied.• The right of the pledgee to sell or repledge the asset is
dependent on the specific agreement under which the collateralis pledged.
• If there is no default, the pledgee must return the comparableasset to the pledgor upon satisfaction of the obligation.
As at October 31, 2009, the approximate market value of collateralaccepted that may be sold or repledged by us was $78.9 billion(2008 – $83.0 billion). This collateral was received in connection withreverse repurchase agreements, securities borrowings and loans, andderivative transactions. Of this amount, $26.1 billion (2008 –$32.6 billion) has been sold or repledged, generally as collateralunder repurchase agreements or to cover short sales.
Lease commitmentsMinimum future rental commitments for premises and equipmentunder long-term non-cancellable operating and capital leases for thenext five years and thereafter are as follows:
Lease commitments (1), (2)
2010 $ 5662011 4992012 4272013 3602014 308Thereafter 1,202
$ 3,362
(1) Substantially all of our lease commitments are related to operating leases.(2) The minimum lease payments include an imputed interest of capital leases of
$10 million.
LitigationEnron Corp. (Enron) litigationA purported class of purchasers of Enron publicly traded equity anddebt securities between January 9, 1999 and November 27, 2001,named Royal Bank of Canada and certain related entities asdefendants in an action entitled Regents of the University of Californiav. Royal Bank of Canada in the United States District Court, SouthernDistrict of Texas (Houston Division). The Regent's case wasconsolidated with the lead action entitled Newby v. Enron Corp.,which is the main consolidated purported Enron shareholder classaction wherein similar claims have been made against numerousother financial institutions, law firms, accountants and certain currentformer officers and directors of Enron. RBC has also been named as adefendant by several individual investors in respect of the lossessuffered by those investors as purchasers of Enron publicly tradedequity and debt securities.
In 2005, RBC established a litigation provision of $591 million(US$500 million) or $326 million after-tax (US$276 million) in regardto its Enron-related litigation exposure. Our evaluation of severalimportant developments that occurred during 2008, individually andin aggregate, led us to conclude that a litigation provision of$60 million (US $50 million) or $33 million after-tax (US$27 million)is reasonable. Management reviews this provision regularly and on atleast a quarterly basis.
We will continue to vigorously defend ourselves in all remainingEnron-related cases and will exercise our judgment in resolving theseclaims.
OtherVarious other legal proceedings are pending that challenge certain ofour practices or actions. We consider that the aggregate liabilityresulting from these other proceedings will not be material to ourfinancial position or results of operations.
Consolidated Financial Statements Royal Bank of Canada: Annual Report 2009 125

Note 26 Contractual repricing and maturity schedule
The following table details our exposure to interest rate risk asdefined and prescribed by CICA Handbook Section 3862, FinancialInstruments-Disclosures. On- and off-balance sheet financialinstruments are reported based on the earlier of their contractualrepricing date or maturity date. Effective interest rates have beendisclosed where applicable. The effective rates shown representhistorical rates for fixed-rate instruments carried at amortized costand current market rates for floating-rate instruments or instrumentscarried at fair value. The following table does not incorporate
management’s expectation of future events where expected repricingor maturity dates differ significantly from the contractual dates. Weincorporate these assumptions in the management of interest raterisk exposure. These assumptions include expected repricing oftrading instruments and certain loans and deposits. Taking intoaccount these assumptions on the consolidated contractual repricingand maturity schedule at October 31, 2009, would result in a changein the under-one-year gap from $(70.5) billion to $(67.7) billion(2008 – $(63.0) billion to $(48.7) billion).
Immediatelyinterest
rate-sensitiveUnder 3months
3 to 6months
Over 6 to12 months
Over 1 to5 years
Over 5years
Non-rate-sensitive Total
AssetsCash and deposits with banks $ – $ 15,396 $ – $ – $ – $ – $ 1,880 $ 17,276
Effective interest rate – 2.68% – – – – –Securities
Trading – 7,928 5,027 10,875 44,126 34,301 37,805 140,062Effective interest rate – 5.32% 3.14% 2.50% 2.62% 3.83% –
Available-for-sale – 7,482 5,605 705 18,041 11,587 2,790 46,210Effective interest rate – 1.09% .62% 3.40% 3.63% 4.07% –
Assets purchased under reverse repurchaseagreements and securities borrowed – 41,580 – – – – – 41,580Effective interest rate – .40% – – – – –
Loans (net of allowance for loan losses) (1) 140,133 32,369 11,872 16,345 73,972 5,896 376 280,963Effective interest rate – 1.68% 3.37% 4.97% 5.04% 5.30% –
Derivatives 60,439 6,199 9 – – – 25,526 92,173Effective interest rate – .40% .28% – – – –
Other assets – – – – – – 36,725 36,725
$200,572 $110,954 $22,513 $27,925 $136,139 $51,784 $105,102 $654,989
LiabilitiesDeposits $166,137 $108,959 $16,125 $29,130 $ 71,041 $ 5,773 $ 1,139 $398,304
Effective interest rate – 1.49% 1.44% 2.44% 2.86% 6.12% –Obligations related to assets sold under
repurchase agreements and securities loaned – 33,937 525 – 498 190 – 35,150Effective interest rate – 2.41% 3.11% – 2.62% 3.91% –
Obligations related to securities sold short – 14,238 547 331 6,417 5,964 13,862 41,359Effective interest rate – .46% 1.41% 2.85% 2.85% 3.97% –
Derivatives 55,575 4,394 – – – – 24,421 84,390Effective interest rate – .40% – – – – –
Other liabilities – 1 248 – 731 4,745 43,228 48,953Effective interest rate – 2.22% 2.44% – 4.08% 5.63% –
Subordinated debentures – 1,177 – 808 3,564 912 – 6,461Effective interest rate – 6.44% – 3.70% 5.24% 6.97% –
Trust capital securities – – – 1,395 – – 1,395Effective interest rate – – – – 7.23% – –
Non-controlling interest in subsidiaries – – – – 1,219 506 346 2,071Effective interest rate – – – – 4.87% 6.82% –
Shareholders’ equity – – 300 – 4,188 325 32,093 36,906
$221,712 $162,706 $17,745 $30,269 $ 89,053 $18,415 $115,089 $654,989
Total gap based on contractual repricing $ (21,140) $ (51,752) $ 4,768 $ (2,344) $ 47,086 $33,369 $ (9,987) $ –
Canadian dollar (21,117) (51,850) 4,741 (2,381) 47,003 33,334 (9,741) (11)Foreign currency (23) 98 27 37 83 35 (246) 11
Total gap $ (21,140) $ (51,752) $ 4,768 $ (2,344) $ 47,086 $33,369 $ (9,987) $ –
Canadian dollar – 2008 $ (29,221) $ (36,638) $ 3,174 $ (513) $ 31,164 $24,247 $ (7,788) $ 1Foreign currency – 2008 (34) 75 63 53 56 34 (248) (1)
Total gap – 2008 $ (29,255) $ (36,563) $ 3,237 $ (460) $ 31,220 $24,281 $ 7,540 $ –
(1) Includes loans totalling $2,736 million (2008 – $3,147 million) to variable interest entities administered by us.
126 Royal Bank of Canada: Annual Report 2009 Consolidated Financial Statements

Note 27 Related Party transactions
In the ordinary course of business, we provide normal bankingservices and operational services, and enter into other transactionswith associated and other related corporations, including our jointventure entities, on terms similar to those offered to non-relatedparties. Refer to Note 9 for more information regarding our jointventure, RBC Dexia IS.
We grant loans to directors, officers and other employees atrates normally accorded to preferred clients. As at October 31, 2009,the aggregate indebtedness, excluding routine indebtedness, to RBCor its subsidiaries of current directors and executive officers wasapproximately $.2 million (2008 – $.6 million). Routine indebtedness
includes: (i) loans made on terms no more favourable than loans toemployees generally, but not exceeding $50,000 to any director orexecutive officer; (ii) loans to employees, fully secured against theirresidence and not exceeding their annual salary; (iii) loans, otherthan to employees, on substantially the same terms available to othercustomers with comparable credit ratings and involving no more thanthe usual risk of collectability; and (iv) loans for purchases on usualtrade terms, or for ordinary travel or expense advances, with usualcommercial repayment arrangements. We also offer deferred shareand other plans to non-employee directors, executives and certainother key employees. Refer to Note 21.
Note 28 Results by business and geographic segment
2009Canadian
BankingWealth
Management InsuranceInternational
BankingCapital
Markets (1)Corporate
Support (1) Total CanadaUnitedStates
OtherInter-
nationalNet interest income $ 6,947 $ 397 $ – $ 1,687 $ 3,399 $ (924) $ 11,506 $ 7,828 $ 2,134 $ 1,544Non-interest income 2,943 3,683 5,715 903 3,524 832 17,600 9,464 5.565 2,571Total revenue 9,890 4,080 5,715 2,590 6,923 (92) 29,106 17,292 7,699 4,115Provision for credit losses 1,275 – – 980 702 456 3,413 1,479 1,821 113Insurance policyholder
benefits, claims andacquisition expense – – 4,609 – – – 4,609 2,100 1,571 938
Non-interest expense 4,729 3,262 559 2,346 3,628 34 14,558 7,632 4,572 2,354Goodwill impairment
charge – – – 1,000 – – 1,000 – 1,000 –Net income (loss) before
income taxes 3,886 818 547 (1,736) 2,593 (582) 5,526 6,081 (1,266) 710Income taxes (recoveries) 1,223 235 51 (299) 826 (468) 1,568 1,707 (132) (7)Non-controlling interest – – – 9 (1) 92 100 92 (1) 9Net income (loss) $ 2,663 $ 583 $ 496 $ (1,446) $ 1,768 $ (206) $ 3,858 $ 4,282 $ (1,132) $ 708
Less: Preferred dividends 56 30 10 58 62 17 233 118 78 37Net income (loss) available
to common shareholders $ 2,607 $ 553 $ 486 $ (1,504) $ 1,706 $ (223) $ 3,625 $ 4,164 $ (1,210) $ 671Average assets (2) $ 258,900 $ 20,500 $ 13,100 $ 63,700 $ 347,900 $ (8,800) $ 695,300 $ 375,000 $ 144,500 $ 175,800
2008Canadian
BankingWealth
Management InsuranceInternational
BankingCapital
Markets (1)Corporate
Support (1) Total CanadaUnitedStates
OtherInter-
nationalNet interest income $ 6,718 $ 468 $ – $ 1,330 $ 1,527 $ (995) $ 9,048 $ 6,929 $ 1,132 $ 987Non-interest income 2,868 3,519 2,610 771 2,408 358 12,534 8,220 2,521 1,793Total revenue 9,586 3,987 2,610 2,101 3,935 (637) 21,582 15,149 3,653 2,780Provision for credit losses 867 1 – 497 183 47 1,595 924 643 28Insurance policyholder
benefits, claims andacquisition expense – – 1,631 – – – 1,631 922 30 679
Non-interest expense 4,758 3,038 576 1,876 2,121 (18) 12,351 7,490 2,991 1,870Net income (loss) before
income taxes 3,961 948 403 (272) 1,631 (666) 6,005 5,813 (11) 203Income taxes 1,299 283 14 (128) 465 (564) 1,369 1,750 (159) (222)Non-controlling interest – – – 9 (4) 76 81 76 (4) 9Net income (loss) $ 2,662 $ 665 $ 389 $ (153) $ 1,170 $ (178) $ 4,555 $ 3,987 $ 152 $ 416
Less: Preferred dividends 28 12 4 21 23 13 101 60 30 11Net income (loss) available
to common shareholders $ 2,634 $ 653 $ 385 $ (174) $ 1,147 $ (191) $ 4,454 $ 3,927 $ 122 $ 405Average assets (2) $ 232,300 $ 16,900 $ 12,600 $ 51,300 $ 340,300 $ (3,100) $ 650,300 $ 354,700 $ 143,500 $ 152,100
2007Canadian
BankingWealth
Management InsuranceInternational
BankingCapital
Markets (1)Corporate
Support (1) Total CanadaUnitedStates
OtherInter-
nationalNet interest income $ 6,353 $ 427 $ – $ 1,031 $ 623 $ (732) $ 7,702 $ 6,402 $ 412 $ 888Non-interest income 2,976 3,565 3,192 884 3,766 377 14,760 8,638 4,322 1,800Total revenue 9,329 3,992 3,192 1,915 4,389 (355) 22,462 15,040 4,734 2,688Provision for (recovery of)
credit losses 788 1 – 109 (22) (85) 791 696 90 5Insurance policyholder
benefits, claims andacquisition expense – – 2,173 – – – 2,173 1,230 474 469
Non-interest expense 4,748 2,902 537 1,481 2,769 36 12,473 7,409 3,405 1,659Net income (loss) before
income taxes 3,793 1,089 482 325 1,642 (306) 7,025 5,705 765 555Income taxes 1,248 327 40 74 278 (575) 1,392 1,705 (62) (251)Non-controlling interest – – – 9 72 60 141 83 49 9Net income $ 2,545 $ 762 $ 442 $ 242 $ 1,292 $ 209 $ 5,492 $ 3,917 $ 778 $ 797
Less: Preferred dividends 29 9 5 14 20 11 88 56 24 8Net income available to
common shareholders $ 2,516 $ 753 $ 437 $ 228 $ 1,272 $ 198 $ 5,404 $ 3,861 $ 754 $ 789Average assets (2) $ 207,500 $ 16,600 $ 12,500 $ 39,700 $ 311,200 $ (6,500) $ 581,000 $ 317,900 $ 135,100 $ 128,000
(1) Taxable equivalent basis.(2) Calculated using methods intended to approximate the average of the daily balances for the period.
Consolidated Financial Statements Royal Bank of Canada: Annual Report 2009 127
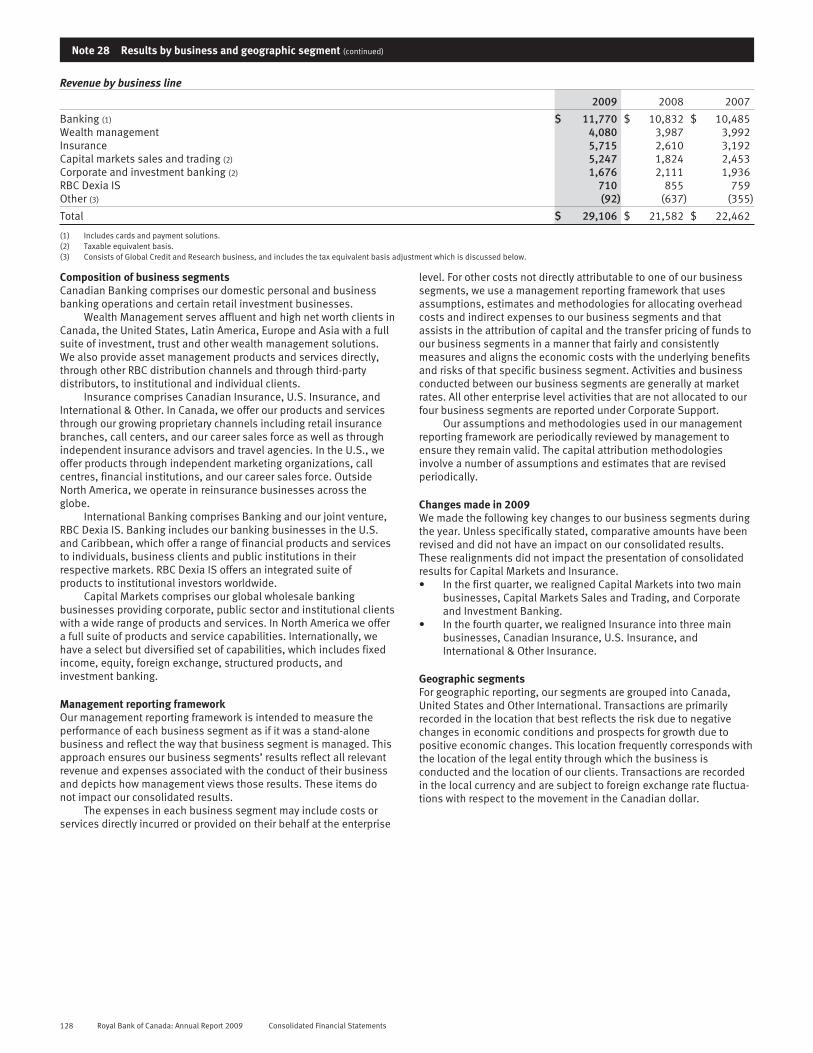
Note 28 Results by business and geographic segment (continued)
Revenue by business line
2009 2008 2007
Banking (1) $ 11,770 $ 10,832 $ 10,485Wealth management 4,080 3,987 3,992Insurance 5,715 2,610 3,192Capital markets sales and trading (2) 5,247 1,824 2,453Corporate and investment banking (2) 1,676 2,111 1,936RBC Dexia IS 710 855 759Other (3) (92) (637) (355)
Total $ 29,106 $ 21,582 $ 22,462
(1) Includes cards and payment solutions.(2) Taxable equivalent basis.(3) Consists of Global Credit and Research business, and includes the tax equivalent basis adjustment which is discussed below.
Composition of business segmentsCanadian Banking comprises our domestic personal and businessbanking operations and certain retail investment businesses.
Wealth Management serves affluent and high net worth clients inCanada, the United States, Latin America, Europe and Asia with a fullsuite of investment, trust and other wealth management solutions.We also provide asset management products and services directly,through other RBC distribution channels and through third-partydistributors, to institutional and individual clients.
Insurance comprises Canadian Insurance, U.S. Insurance, andInternational & Other. In Canada, we offer our products and servicesthrough our growing proprietary channels including retail insurancebranches, call centers, and our career sales force as well as throughindependent insurance advisors and travel agencies. In the U.S., weoffer products through independent marketing organizations, callcentres, financial institutions, and our career sales force. OutsideNorth America, we operate in reinsurance businesses across theglobe.
International Banking comprises Banking and our joint venture,RBC Dexia IS. Banking includes our banking businesses in the U.S.and Caribbean, which offer a range of financial products and servicesto individuals, business clients and public institutions in theirrespective markets. RBC Dexia IS offers an integrated suite ofproducts to institutional investors worldwide.
Capital Markets comprises our global wholesale bankingbusinesses providing corporate, public sector and institutional clientswith a wide range of products and services. In North America we offera full suite of products and service capabilities. Internationally, wehave a select but diversified set of capabilities, which includes fixedincome, equity, foreign exchange, structured products, andinvestment banking.
Management reporting frameworkOur management reporting framework is intended to measure theperformance of each business segment as if it was a stand-alonebusiness and reflect the way that business segment is managed. Thisapproach ensures our business segments’ results reflect all relevantrevenue and expenses associated with the conduct of their businessand depicts how management views those results. These items donot impact our consolidated results.
The expenses in each business segment may include costs orservices directly incurred or provided on their behalf at the enterprise
level. For other costs not directly attributable to one of our businesssegments, we use a management reporting framework that usesassumptions, estimates and methodologies for allocating overheadcosts and indirect expenses to our business segments and thatassists in the attribution of capital and the transfer pricing of funds toour business segments in a manner that fairly and consistentlymeasures and aligns the economic costs with the underlying benefitsand risks of that specific business segment. Activities and businessconducted between our business segments are generally at marketrates. All other enterprise level activities that are not allocated to ourfour business segments are reported under Corporate Support.
Our assumptions and methodologies used in our managementreporting framework are periodically reviewed by management toensure they remain valid. The capital attribution methodologiesinvolve a number of assumptions and estimates that are revisedperiodically.
Changes made in 2009We made the following key changes to our business segments duringthe year. Unless specifically stated, comparative amounts have beenrevised and did not have an impact on our consolidated results.These realignments did not impact the presentation of consolidatedresults for Capital Markets and Insurance.• In the first quarter, we realigned Capital Markets into two main
businesses, Capital Markets Sales and Trading, and Corporateand Investment Banking.
• In the fourth quarter, we realigned Insurance into three mainbusinesses, Canadian Insurance, U.S. Insurance, andInternational & Other Insurance.
Geographic segmentsFor geographic reporting, our segments are grouped into Canada,United States and Other International. Transactions are primarilyrecorded in the location that best reflects the risk due to negativechanges in economic conditions and prospects for growth due topositive economic changes. This location frequently corresponds withthe location of the legal entity through which the business isconducted and the location of our clients. Transactions are recordedin the local currency and are subject to foreign exchange rate fluctua-tions with respect to the movement in the Canadian dollar.
128 Royal Bank of Canada: Annual Report 2009 Consolidated Financial Statements

Note 29 Nature and extent of risks arising from financial instruments
We are exposed to credit, market and liquidity and funding risks as aresult of holding financial instruments. Our risk measurement andobjectives, policies and methodologies for managing these risks aredisclosed in the shaded text along with those tables specificallymarked with on asterisk(*) on pages 40 to 54 of the ManagementDiscussion and Analysis. These shaded text and tables are an integralpart of these Consolidated Financial Statements.
Concentrations of credit risk exist if a number of clients areengaged in similar activities, are located in the same geographic
region or have comparable economic characteristics such that theirability to meet contractual obligations would be similarly affected bychanges in economic, political or other conditions.
Concentrations of credit risk indicate the relative sensitivity ofour performance to developments affecting a particular industry orgeographic location. The amounts of credit exposure associated withour on- and off-balance sheet financial instruments are summarizedin the following table.
Concentration of credit risk2009 2008
Canada % United States % Europe %
OtherInter-
national % Total Canada % United States % Europe %
OtherInter-
national % Total
On-balance sheet assets otherthan derivatives (1) $245,193 73% 50,463 15% $28,778 9% $10,321 3% $334,755 $240,620 69% $ 56,382 16% $ 40,519 12% $10,337 3% $347,858Derivatives before master
netting agreement (2), (3) 14,668 16 19,854 22 48,412 54 6,778 8 89,712 24,033 18 27,106 21 69,728 53 10,716 8 131,583
$259,861 61% $ 70,317 17% $77,190 18% $17,099 4% $424,467 $264,653 55% $ 83,488 18% $110,247 23% $21,053 4% $479,441
Off-balance sheet creditinstruments (4)Committed and
uncommitted (5) $180,369 69% $ 47,227 18% $15,672 6% $19,368 7% $262,636 $177,317 64% $ 62,932 23% $ 17,388 6% $17,850 7% $275,487Other 22,805 57 8,187 21 8,116 20 627 2 39,735 24,820 51 11,047 23 10,615 22 1,998 4 48,480
$203,174 67% $ 55,414 18% $23,788 8% $19,995 7% $302,371 $202,137 62% $ 73,979 23% $ 28,003 9% $19,848 6% $323,967
(1) Includes assets purchased under reverse repurchase agreements and securities borrowed, loans and customers’ liability under acceptances. The largest concentrations in Canada are Ontarioat 50% (2008 – 51%), the Prairies at 18% (2008 – 16%), British Columbia and the territories at 17% (2008 – 16%) and Quebec at 11% (2008 – 12%). No industry accounts for more than18% (2008 – 19%) of total on-balance sheet credit instruments.
(2) The largest concentration of credit exposure by counterparty type is banks at 67% (2008 – 62%).(3) Excludes credit derivatives classified as other than trading with a replacement cost of $128 million (2008 – $400 million).(4) Represents financial instruments with contractual amounts representing credit risk.(5) Retail and wholesale commitments comprise 39% (2008 – 32%) and 61% (2008 – 68%), respectively, of our total commitments. The largest sector concentration in the wholesale portfolio
relates to Non-bank financial services at 20% (2008 – 34%), Financing products at 16% (2008 – 6%), Energy at 10% (2008 – 9%), Real estate and related at 7% (2008 – 7%), Other servicesat 7% (2008 – 5%), Bank at 3% (2008 – 11%), and Sovereign at 6% (2008 – 6%).
Note 30 Capital management
Regulatory capital and capital ratiosCapital levels for Canadian banks are regulated pursuant to guide-lines issued by OSFI, based on standards issued by the Bank forInternational Settlements, Basel Committee on Banking Supervision.Regulatory capital is allocated to two tiers: Tier 1 and Tier 2. Tier 1capital comprises the highest quality capital and is a core measure ofa bank’s financial strength. Tier 1 capital consists of more permanentcomponents of capital, is free of mandatory fixed charges againstearnings and has a subordinate legal position to the rights ofdepositors and other creditors of the financial institution. Tier 2capital is composed of supplementary capital instruments thatcontribute to the overall strength of a financial institution as a goingconcern. Total capital is defined as the sum of Tier 1 and Tier 2capital.
Regulatory capital ratios are calculated by dividing Tier 1 andTotal capital by risk-adjusted assets (RAA). OSFI requires banks tomeet minimum risk-based capital requirements for exposures tocredit risk, operational risk, and where they have significant tradingactivity, market risk. RAA is calculated for each of these risk types andadded together to determine total RAA.
In addition, OSFI formally establishes risk-based capital targetsfor deposit-taking institutions in Canada. These targets are currently aTier 1 capital ratio of greater than or equal to 7% and a Total capital
ratio of greater than or equal to 10%. In addition to the Tier 1 andTotal capital ratios, Canadian banks are required to ensure that theirassets-to-capital multiple, which is calculated by dividing grossadjusted assets by Total capital, does not exceed a maximum levelprescribed by OSFI. Our assets-to-capital multiple remains below themaximum prescribed by OSFI.
Regulatory capital and capital ratios2009 2008
CapitalTier 1 capital $ 31,774 $ 25,031Total capital 34,881 30,710
Risk-adjusted assetsCredit risk 185,051 229,537Market risk 23,321 17,220Operational risk 36,465 31,822
Total risk-adjusted assets $ 244,837 $ 278,579
Capital ratiosTier 1 capital 13.0% 9.0%Total capital 14.2% 11.0%Assets-to-capital multiple 16.3X 20.1X
Consolidated Financial Statements Royal Bank of Canada: Annual Report 2009 129
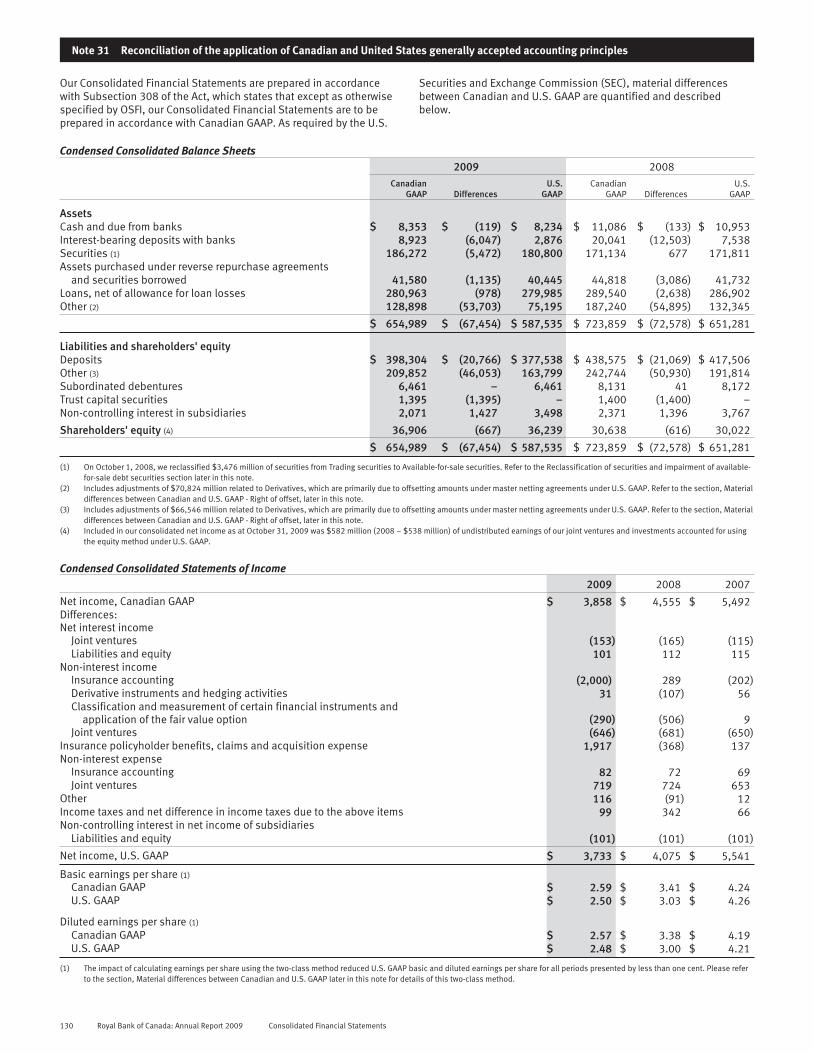
Note 31 Reconciliation of the application of Canadian and United States generally accepted accounting principles
Our Consolidated Financial Statements are prepared in accordancewith Subsection 308 of the Act, which states that except as otherwisespecified by OSFI, our Consolidated Financial Statements are to beprepared in accordance with Canadian GAAP. As required by the U.S.
Securities and Exchange Commission (SEC), material differencesbetween Canadian and U.S. GAAP are quantified and describedbelow.
Condensed Consolidated Balance Sheets2009 2008
CanadianGAAP Differences
U.S.GAAP
CanadianGAAP Differences
U.S.GAAP
AssetsCash and due from banks $ 8,353 $ (119) $ 8,234 $ 11,086 $ (133) $ 10,953Interest-bearing deposits with banks 8,923 (6,047) 2,876 20,041 (12,503) 7,538Securities (1) 186,272 (5,472) 180,800 171,134 677 171,811Assets purchased under reverse repurchase agreements
and securities borrowed 41,580 (1,135) 40,445 44,818 (3,086) 41,732Loans, net of allowance for loan losses 280,963 (978) 279,985 289,540 (2,638) 286,902Other (2) 128,898 (53,703) 75,195 187,240 (54,895) 132,345
$ 654,989 $ (67,454) $ 587,535 $ 723,859 $ (72,578) $ 651,281
Liabilities and shareholders' equityDeposits $ 398,304 $ (20,766) $ 377,538 $ 438,575 $ (21,069) $ 417,506Other (3) 209,852 (46,053) 163,799 242,744 (50,930) 191,814Subordinated debentures 6,461 – 6,461 8,131 41 8,172Trust capital securities 1,395 (1,395) – 1,400 (1,400) –Non-controlling interest in subsidiaries 2,071 1,427 3,498 2,371 1,396 3,767
Shareholders' equity (4) 36,906 (667) 36,239 30,638 (616) 30,022
$ 654,989 $ (67,454) $ 587,535 $ 723,859 $ (72,578) $ 651,281
(1) On October 1, 2008, we reclassified $3,476 million of securities from Trading securities to Available-for-sale securities. Refer to the Reclassification of securities and impairment of available-for-sale debt securities section later in this note.
(2) Includes adjustments of $70,824 million related to Derivatives, which are primarily due to offsetting amounts under master netting agreements under U.S. GAAP. Refer to the section, Materialdifferences between Canadian and U.S. GAAP - Right of offset, later in this note.
(3) Includes adjustments of $66,546 million related to Derivatives, which are primarily due to offsetting amounts under master netting agreements under U.S. GAAP. Refer to the section, Materialdifferences between Canadian and U.S. GAAP - Right of offset, later in this note.
(4) Included in our consolidated net income as at October 31, 2009 was $582 million (2008 – $538 million) of undistributed earnings of our joint ventures and investments accounted for usingthe equity method under U.S. GAAP.
Condensed Consolidated Statements of Income2009 2008 2007
Net income, Canadian GAAP $ 3,858 $ 4,555 $ 5,492Differences:Net interest income
Joint ventures (153) (165) (115)Liabilities and equity 101 112 115
Non-interest incomeInsurance accounting (2,000) 289 (202)Derivative instruments and hedging activities 31 (107) 56Classification and measurement of certain financial instruments and
application of the fair value option (290) (506) 9Joint ventures (646) (681) (650)
Insurance policyholder benefits, claims and acquisition expense 1,917 (368) 137Non-interest expense
Insurance accounting 82 72 69Joint ventures 719 724 653
Other 116 (91) 12Income taxes and net difference in income taxes due to the above items 99 342 66Non-controlling interest in net income of subsidiaries
Liabilities and equity (101) (101) (101)
Net income, U.S. GAAP $ 3,733 $ 4,075 $ 5,541
Basic earnings per share (1)
Canadian GAAP $ 2.59 $ 3.41 $ 4.24U.S. GAAP $ 2.50 $ 3.03 $ 4.26
Diluted earnings per share (1)
Canadian GAAP $ 2.57 $ 3.38 $ 4.19U.S. GAAP $ 2.48 $ 3.00 $ 4.21
(1) The impact of calculating earnings per share using the two-class method reduced U.S. GAAP basic and diluted earnings per share for all periods presented by less than one cent. Please referto the section, Material differences between Canadian and U.S. GAAP later in this note for details of this two-class method.
130 Royal Bank of Canada: Annual Report 2009 Consolidated Financial Statements

Condensed Consolidated Statements of Cash Flows2009 2008 2007
Cash flows from operating activities, Canadian GAAP $ 7,403 $ 11,381 $ 22,500U.S. GAAP adjustment for net income (125) (480) 49Adjustments to determine net cash used in operating activities (3,990) (1,875) (1,419)
Net cash from operating activities, U.S. GAAP 3,288 9,026 21,130
Cash flows from (used in) investing activities, Canadian GAAP 15,918 (44,602) (39,717)Adjustments to determine net cash from investing activities 2,009 5,059 2,450
Net cash from (used in) investing activities, U.S. GAAP 17,927 (39,543) (37,267)Cash flows (used in) from financing activities, Canadian GAAP (25,783) 39,198 17,374
Adjustments to determine net cash from (used in) investing activities 2,120 (2,759) (1,057)Net cash (used in) from financing activities, U.S. GAAP (23,663) 36,439 16,317Effect of exchange rate changes on cash and due from banks (271) 883 (332)
Net change in cash and due from banks $ (2,719) $ 6,805 $ (152)Cash and due from banks at beginning of year 10,953 4,148 4,300Cash and due from banks at end of year, U.S. GAAP $ 8,234 $ 10,953 $ 4,148
Accumulated other comprehensive income (loss), net of income taxes2009 2008 2007
Canadian GAAP Differences U.S. GAAP Canadian GAAP Differences U.S. GAAP U.S. GAAP
Transition adjustments (1) $ 59 $ (80) $ (21) $ (45) $ 45 $ – $ –Unrealized gains (losses) on available-for-sale securities:
Transition adjustment and unrealized gains (losses) of other-than--temporarily-impaired debt securities (2), (3) – (39) (39) – – – –
Net unrealized gains (losses) of other securities (76) 440 364 (1,068) 57 (1,011) 68Unrealized foreign currency translation gains (losses), net of hedging
activities (1,374) 45 (1,329) (802) 45 (757) (3,211)Gains (losses) on derivatives designated as cash flow hedges (325) (56) (381) (443) (86) (529) 20Additional pension obligation – (956) (956) – (523) (523) (541)Accumulated other comprehensive income (loss), net of income taxes $ (1,716) $ (646) $ (2,362) $ (2,358) $ (462) $ (2,820) $ (3,664)
(1) Transition adjustment differences consist of: (i) $(104) million related to the reclassification, as of November 1, 2008, of certain securities from available-for-sale to loans in accordance withthe CICA’s amendments to Section 3855 (refer to Note 1); (ii) $(18) million related to the adoption of the fair value option standard in Topic 825-10 (FAS 159); refer to the section, Applicationof the fair value option, below; (iii) $(3) million related to the implementation of measurement date requirements in Topic 715 (FAS 158); refer to the section, Pensions and other post-employment benefits, below; and (iv) $45 million in 2008 related to the adoption of CICA Section 1530, Comprehensive Income, on November 1, 2006.
(2) For the debt securities that we do not intend to sell or it is more likely than not that we will not be required to sell before recovery of the amortized costs, the credit related portion of theunrealized loss was recognized in income and the non-credit related portion in OCI under U.S. GAAP.
(3) Transitional adjustment upon adoption of Topic 320 (FSP FAS 115-2 and FAS 124-2) as at May 1, 2009 was a net unrealized loss of $225 million after taxes. Refer to the section, Other-than-temporary impairment of securities, below.
Consolidated Statements of Comprehensive Income2009 2008 2007
Canadian GAAP Differences U.S. GAAP Canadian GAAP Differences U.S. GAAP U.S. GAAP
Net income $ 3,858 $ (125) $ 3,733 $ 4,555 $ (480) $ 4,075 $ 5,541Other comprehensive income, net of taxes
Net unrealized gains (losses) on available-for-salesecurities, net of reclassification adjustments:Unrealized gains (losses) of other-than-temporarily
impaired debt securities (1) – 186 186 – – – –Net unrealized gains (losses) of other securities (2) 992 383 1,375 (1,003) (76) (1,079) (123)
Unrealized foreign currency translation (losses) gains (2,973) 2 (2,971) 5,080 46 5,126 (3,014)Reclassification of losses (gains) on foreign currency
translation to income 2 (2) – (3) 3 – (1)Net foreign currency translation gains (losses) from
hedging activities 2,399 – 2,399 (2,672) – (2,672) 1,804Net gains (losses) on derivatives designated as cash
flow hedges 156 29 185 (603) – (603) 81Reclassification of (gains) losses on derivatives
designated as cash flow hedges to income (38) 1 (37) 49 5 54 26Additional pension obligation – (433) (433) – 18 18 50
Total comprehensive income $ 4,396 $ 41 $ 4,437 $ 5,403 $ (484) $ 4,919 $ 4,364
Income taxes (recovery) deducted from the above items:Net unrealized gains (losses) on available-for-sale
securities (3) $ 495 $ 243 $ 738 (577) $ 64 $ (513) $ (48)Net foreign currency translation gains (losses) from
hedging activities 1,102 – 1,102 (1,361) – (1,361) 911Net gains (losses) on derivatives designated as cash
flow hedges 69 13 82 (304) – (304) 43Reclassification of (gains) losses on derivatives
designated as cash flow hedges to income (17) 1 (16) 23 3 26 13Additional pension obligation – (199) (199) – 9 9 27
Total income taxes (recovery) $ 1,649 $ 58 $ 1,707 $ (2,219) $ 76 $ (2,143) $ 946
(1) Represents unrealized gains and losses of other-than-temporarily impaired debt securities since May 1, 2009, the adoption date of Topic 320 (FSP FAS 115-2 and FAS 124-2); refer to thesection, Other-than-temporary impairment of securities, below.
(2) The difference includes $26 million related to the reclassification, as of November 1, 2008, of certain securities from available-for-sale to loans in accordance with the CICA’s amendments toSection 3855. Refer to Note 1.
(3) The difference includes $15 million related to the reclassification, as of November 1, 2008, of certain securities from available-for-sale to loans in accordance with the CICA’s amendments toSection 3855. Refer to Note 1.
Consolidated Financial Statements Royal Bank of Canada: Annual Report 2009 131
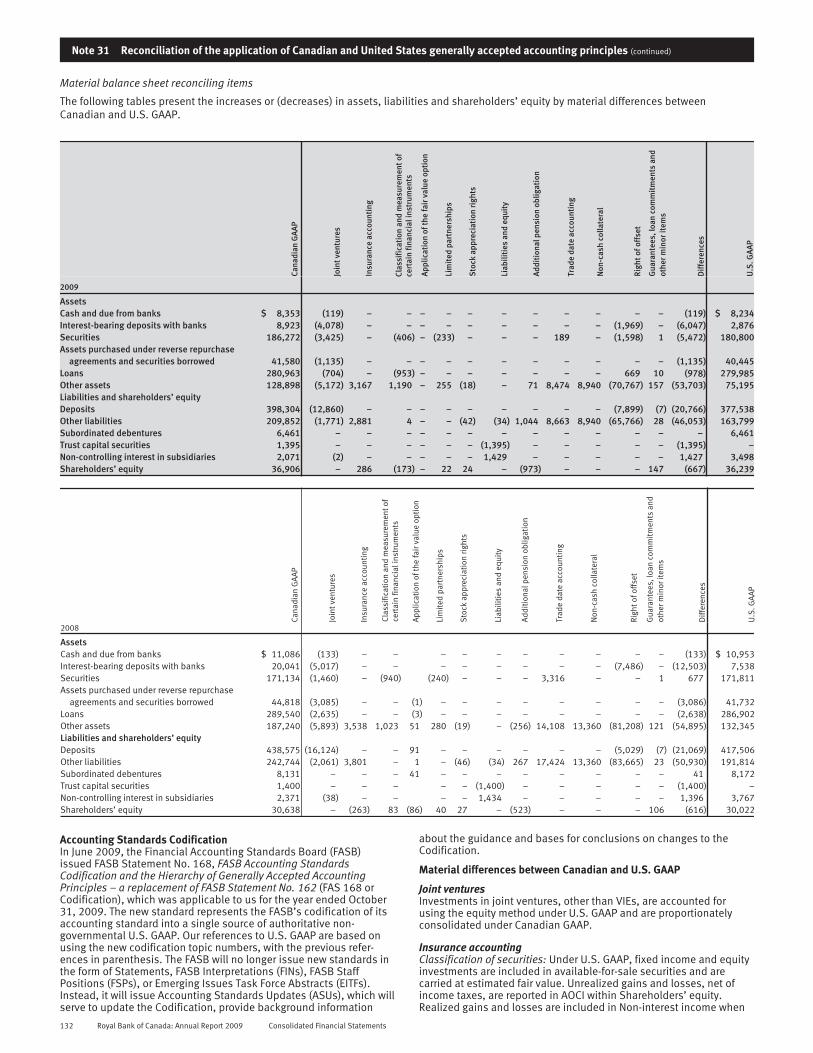
Note 31 Reconciliation of the application of Canadian and United States generally accepted accounting principles (continued)
Material balance sheet reconciling items
The following tables present the increases or (decreases) in assets, liabilities and shareholders’ equity by material differences betweenCanadian and U.S. GAAP.
Accounting Standards CodificationIn June 2009, the Financial Accounting Standards Board (FASB)issued FASB Statement No. 168, FASB Accounting StandardsCodification and the Hierarchy of Generally Accepted AccountingPrinciples – a replacement of FASB Statement No. 162 (FAS 168 orCodification), which was applicable to us for the year ended October31, 2009. The new standard represents the FASB’s codification of itsaccounting standard into a single source of authoritative non-governmental U.S. GAAP. Our references to U.S. GAAP are based onusing the new codification topic numbers, with the previous refer-ences in parenthesis. The FASB will no longer issue new standards inthe form of Statements, FASB Interpretations (FINs), FASB StaffPositions (FSPs), or Emerging Issues Task Force Abstracts (EITFs).Instead, it will issue Accounting Standards Updates (ASUs), which willserve to update the Codification, provide background information
about the guidance and bases for conclusions on changes to theCodification.
Material differences between Canadian and U.S. GAAP
Joint venturesInvestments in joint ventures, other than VIEs, are accounted forusing the equity method under U.S. GAAP and are proportionatelyconsolidated under Canadian GAAP.
Insurance accountingClassification of securities: Under U.S. GAAP, fixed income and equityinvestments are included in available-for-sale securities and arecarried at estimated fair value. Unrealized gains and losses, net ofincome taxes, are reported in AOCI within Shareholders’ equity.Realized gains and losses are included in Non-interest income when
132 Royal Bank of Canada: Annual Report 2009 Consolidated Financial Statements
realized. Under Canadian GAAP fixed income and equity investments areclassified as available-for-sale securities except for those supporting thepolicy benefit liabilities of life and health insurance contracts and aportion of property and casualty contracts which are designated as held-for-trading using the fair value option. Available-for-sale and held-for-trading securities are carried at fair value, however, the unrealized gainsand losses for available-for-sale securities are reported in AOCI, net oftaxes, whereas held-for-trading investments, which are designated usingthe fair value option, are reported in income. Refer to “Application of thefair value option” below.
Insurance claims and policy benefit liabilities: Under U.S. GAAP,liabilities for life insurance contracts, except universal life andinvestment-type contracts, are determined using the net levelpremium method, which includes assumptions for mortality,morbidity, policy lapses, surrenders, investment yields, policydividends and direct operating expenses. These assumptions are notrevised unless it is determined that existing deferred acquisitioncosts cannot be recovered. For universal life and investment-typecontracts, liabilities represent policyholder account balances andinclude a net level premium reserve for some contracts. The accountbalances represent an accumulation of gross deposits received pluscredited interest less withdrawals, expenses and mortality charges.Underlying reserve assumptions of these contracts are subject toreview at least annually. Property and casualty claim liabilitiesrepresent the estimated amounts required to settle all unpaid claims,and are recorded on an undiscounted basis. Under Canadian GAAP,liabilities for life insurance contracts are determined using the CALM,which incorporates assumptions for mortality, morbidity, policylapses, surrenders, investment yields, policy dividends andmaintenance expenses. To recognize the uncertainty in the assump-tions underlying the calculation of the liabilities, a margin for adversedeviations is added to each assumption. These assumptions arereviewed at least annually and updated in response to actualexperience and market conditions. Property and casualty claimliabilities represent the estimated amounts required to settle allunpaid claims, and are recorded on a discounted basis.
Insurance revenue: Under U.S. GAAP, amounts received for universallife and other investment-type contracts are not included as revenue,but are reported as deposits to policyholders’ account balances inInsurance claims and policy benefit liabilities. Revenue from thesecontracts are limited to amounts assessed against policyholders’account balances for mortality, policy administration and surrendercharges, and is included in Non-interest income when earned.Payments upon maturity or surrender are reflected as reductions inthe Insurance claims and policy benefit liabilities. Under CanadianGAAP, premiums for universal life and other investment-typecontracts are recorded as Non-interest income, and changes in theliabilities for future policy benefits are recorded in Insurance policyholder benefits, claims and acquisition expense.
Policy acquisition costs: Under U.S. GAAP, acquisition costs aredeferred in Other assets. The amortization method of the acquisitioncosts is dependent on the product to which the costs relate. For long-duration contracts, they are amortized in proportion to premiumrevenue. For universal life and investment-type contracts,amortization is based on a constant percentage of estimated grossprofits. Under Canadian GAAP, the costs of acquiring new lifeinsurance and annuity business are implicitly recognized as areduction in Insurance claims and policy benefit liabilities.
Value of business acquired: Under U.S. GAAP, the value of businessacquired (VOBA) is determined at the acquisition date and recordedas an asset. The VOBA asset is amortized and charged to incomeusing the same methodologies used for policy acquisition costamortization but reflects premiums or profit margins after the date ofacquisition only. Under Canadian GAAP, the value of life insurance in-force policies acquired in a business combination is implicitlyrecognized as a reduction in policy benefit liabilities.
Reinsurance: Under U.S. GAAP, reinsurance recoverables are recordedas an asset on our Consolidated Balance Sheets while underCanadian GAAP, reinsurance recoverables of life insurance business
related to the risks ceded to other insurance or reinsurancecompanies are recorded as an offset to Insurance claims and policybenefit liabilities.
Separate accounts: Separate accounts are recognized on ourConsolidated Balance Sheets under U.S. GAAP. Under Canadian GAAP,assets and liabilities of separate accounts (known as segregated fundsin Canada) are not recognized on our Consolidated Balance Sheets.
Classification and measurement of certain financial instrumentsDifferences in presentation on the balance sheet: Certain investmentsin private equities measured at cost are included in Other assetsunder U.S. GAAP and presented under Securities under CanadianGAAP. In addition, certain MBS, where management intends to sellthem in the near term, are classified as available-for-sale under U.S.GAAP and as held-for-trading under Canadian GAAP.
Differences in reclassification of securities: As described in Note 3,pursuant to the CICA’s amendments to sections 3855, 3861 and3862, we reclassified certain securities from held-for-trading toavailable-for-sale as of August 1, 2008 under Canadian GAAP. Forpurposes of our U.S. GAAP results, these were reclassified on October1, 2008. Excluded from reclassification for U.S. GAAP purposes wereU.S. Municipal guaranteed investment contracts and U.S. MBSbecause the entities which hold those securities are prohibited fromclassifying securities as available-for-sale.
Under Canadian GAAP, as of November 1, 2008, certain held-for-trading and available-for-sale securities were reclassified to loans,and certain loans were reclassified to held-for-trading. Refer to Note 1for details. Such reclassifications are not permitted under U.S. GAAP.
Differences in measurement of other-than-temporary impairmentlosses for available-for-sale debt securities: Under U.S. GAAP, theunrealized loss of an available-for-sale debt security is an other-than-temporary impairment when: (i) the entity has the intent to sell thesecurity; (ii) it is more likely than not that the entity will be required tosell the security before recovery of the amortized cost; or (iii) theentity does not expect to recover the entire amortized cost of thesecurity (credit loss) even though it will not sell the security. If one ofthe first two conditions is met, the full amount of the unrealized lossin AOCI should be recognized in income. If these two conditions arenot met but the entity has incurred a credit loss on the security, thecredit loss and the non-credit related loss are recognized in incomeand OCI, respectively. Under Canadian GAAP, if an impairment on anavailable-for-sale security is deemed to be other-than-temporary, thetotal unrealized losses are recognized in income.
Under Canadian GAAP, an impairment loss on an available-for-saledebt security is reversed if, in a subsequent period, the fair value ofthe instrument increases and the increase can be objectively relatedto an event occurring after the loss was recognized. Under U.S. GAAP,reversal of impairment losses is not permitted for available-for-saledebt securities.
Application of the fair value optionBetween November 1, 2006 and November 1, 2008, U.S. GAAP onlyallowed the following financial instruments to be measured at fairvalue with changes in fair value to be recognized in net income: (i)any hybrid financial instrument that contains an embedded derivativethat requires bifurcation at its fair value, and (ii) servicing rights.Effective November 1, 2008, U.S. GAAP was revised to permit anentity to report additional financial assets and liabilities at fair valuepursuant to Topic 825-10, Financial Instruments (Topic 825-10) (FASBStatement No. 159, The Fair Value Option for Financial Assets andLiabilities). As of November 1, 2006, Canadian GAAP permitted anyfinancial instrument to be designated as held-for-trading on its initialrecognition (fair value option) (subject to certain restrictions imposedby OSFI), provided the fair value of the instrument is reliablymeasurable. Our GAAP difference arises primarily due to ourapplication of the fair value option to: (i) our investments supportingthe policy benefit liabilities on life and health insurance contractsissued by our insurance operations under Canadian GAAP but not U.S.GAAP, and (ii) certain U.S. residential mortgages under U.S. GAAP andnot Canadian GAAP.
Consolidated Financial Statements Royal Bank of Canada: Annual Report 2009 133
Note 31 Reconciliation of the application of Canadian and United States generally accepted accounting principles (continued)
Limited partnershipsUnder U.S. GAAP, the equity method is used to account for invest-ments in limited partnerships that are non-VIEs or unconsolidatedVIEs, if we own at least 3% of the total ownership interest. UnderCanadian GAAP, we use the equity method for these investments, ifwe have the ability to exercise significant influence, generallyindicated by an ownership interest of 20% or more.
Stock appreciation rights (SARs)Between November 29, 1999, and June 5, 2001, options grantedunder the employee stock option plan were accompanied by tandemSARs, whereby participants could choose to exercise a SAR instead ofthe corresponding option. In such cases, the participants wouldreceive a cash payment equal to the difference between the closingprice of our common shares on the day immediately preceding theday of exercise and the exercise price of the option. Under U.S. GAAP,compensation expense would be measured using estimates based onpast experience of participants exercising SARs rather than thecorresponding options. On November 1, 2005, we adopted guidanceunder Topic 718, Compensation – Stock Compensation (Topic 718)(FASB Statement No. 123 (revised 2004), Share-Based Payment, andits related FSPs) which requires that the compensation expenseassociated with these awards be measured assuming that allparticipants will exercise SARs. Under the transition guidelines of theguidance, the requirements of Topic 718 are applicable to awardsgranted after the adoption. Since these SARs were awarded prior toadoption of the guidance, they continue to be accounted for underthe previous accounting guidance. Under Canadian GAAP, for stockoptions granted with SARs, a liability is recorded for the potentialcash payments to participants and compensation expense ismeasured assuming that all participants will exercise SARs.
Liabilities and equityUnder U.S. GAAP, shares issued with conversion or conditionalredemption features are classified as equity. Shares that aremandatorily redeemable, requiring the issuer to redeem theinstruments upon a specified date or upon an event that is certain tooccur are classified as liabilities. Under Canadian GAAP, financialinstruments that can be settled by a variable number of our commonshares upon their conversion by the holder are classified asliabilities. As a result, certain of our preferred shares and RBC TruCSare classified as liabilities under Canadian GAAP. Dividends and yielddistributions on these instruments are included in Interest expense inour Consolidated Statements of Income.
Pension and other post-employment benefitsTopic 715, Compensation – Retirement Benefits (Topic 715) (FASBStatement No. 158, Employers’ Accounting for Defined BenefitPension and Other Post-retirement Plans – an amendment of FASBStatements No. 87, 88, 106 and 132(R)) requires an entity to:(i) recognize the funded status of a benefit plan on the balance sheet,and (ii) recognize in OCI the existing unrecognized net actuarial gainsand losses, prior service costs and credits, and net transitional assetsor obligations. We are also required to measure defined benefit planassets and obligations as at the year-end date. We adopted theserequirements in 2009 and the impact is disclosed in the Pensions andother post-employment benefits section presented later in this note.
Canadian GAAP does not have the same requirements as Topic 715.For a defined benefit plan, the plan assets and the benefit obligationsmay be measured as of a date not more than three months prior tothe year-end. We measure our benefit obligations and pension planassets as at September 30 each year.
Trade date accountingFor securities transactions, under U.S. GAAP, trade date basis ofaccounting is used for both our Consolidated Balance Sheets and ourConsolidated Statements of Income. Under Canadian GAAPsettlement date basis of accounting is used for our ConsolidatedBalance Sheets whereas trade date basis of accounting is used forour Consolidated Statements of Income.
Non-cash collateralUnder U.S. GAAP, non-cash collateral received in securities lendingtransactions is recorded on our Consolidated Balance Sheets as anasset and a corresponding obligation to return it is recorded as aliability, if we have the ability to sell or repledge it whereas underCanadian GAAP, it is not recognized on our Consolidated BalanceSheets.
Right of offsetWhen financial assets and liabilities are subject to a legallyenforceable right of offset and we intend to settle these assets andliabilities with the same party either on a net basis or simultaneously,the financial assets and liabilities may be presented on a net basisunder U.S. GAAP and Canadian GAAP. As a result of recentamendments to U.S. GAAP, an entity is permitted to report on a netbasis the fair value of its derivative contracts and related cashcollateral with a counterparty with whom it has a master nettingagreement, regardless of whether there is intent to settle on a netbasis; however, this is not permitted under Canadian GAAP. Refer toSignificant accounting changes – Offsetting of amounts related tocertain contracts, later in this note for additional details on thisamendment. In addition, the netting criteria may be applied to atri-party transaction under Canadian GAAP.
Deferred unrealized gains or losses at inceptionAn unrealized gain or loss at inception for financial instruments is thedifference between the transaction price and its fair value on thetrade date. U.S. GAAP eliminates the deferral of unrealized gains orlosses at inception on certain derivative instruments whose fair valueis measured using unobservable market inputs. Under CanadianGAAP, these unrealized gains or losses at inception are deferred.
Derivative instruments and hedging activities – non-derivativehedging instrumentCertain foreign currency-denominated available-for-sale assets havebeen hedged against foreign currency-denominated deposits. In orderto qualify for hedge accounting under U.S. GAAP, the hedginginstrument should be a derivative, unless it is a hedge of a foreignexchange exposure of a net investment in a self-sustaining foreignoperation or it relates to unrecognized firm commitments. Accord-ingly, the change in fair value of the available-for-sale assets,including the foreign exchange gain or loss, is recognized in AOCI,whereas the change in translation gain or loss on the foreigncurrency-denominated deposits is recorded in income, resulting in amismatch. Under Canadian GAAP, a non-derivative hedginginstrument can be used to hedge any foreign currency risk exposure.
Two-class method of calculating earnings per shareWhen calculating earnings per share under U.S. GAAP, we arerequired to give effect to securities or other instruments or contractsthat entitle their holders to participate in undistributed earnings whensuch entitlement is nondiscretionary and objectively determinable.Canadian GAAP does not have such a requirement.
Cumulative translation adjustmentUnder U.S. GAAP, foreign currency translation gains and lossesrelating to our self-sustaining foreign operations that have beenaccumulated in AOCI can be recognized in income only when theforeign operation has been substantially or fully liquidated. UnderCanadian GAAP these gains and losses can be recognized in incomewhen there is a reduction in the net investment of our foreignoperations which may be even due to dividend distribution.
Loans held-for-saleUnder U.S. GAAP, loans held-for-sale are recorded at the lower of costor fair value. Under Canadian GAAP loans held-for-sale in the nearterm are measured at fair value.
134 Royal Bank of Canada: Annual Report 2009 Consolidated Financial Statements

Restricted net assetsCertain of our subsidiaries and joint ventures are subject to regulatoryrequirements of the jurisdictions in which they operate. When thesesubsidiaries and joint ventures are subject to such requirements, theymay be restricted from transferring to us our share of their assets inthe form of cash dividends, loans or advances. At October 31, 2009,restricted net assets of these subsidiaries were $15.5 billion (2008 –$16.3 billion).
Pensions and other post-employment benefitsThe following information on our defined benefit plans is in additionto that disclosed in Note 20.
In 2009, we changed our measurement date from September 30to October 31 as described in the section, Material differencesbetween Canadian and U.S. GAAP earlier in this note. The impact toRetained Earnings and AOCI, net of taxes, of adopting thismeasurement date requirement are presented in the following table:
2009Balance at the beginning of the year
Before adoptingmeasurementrequirements
in Topic715-20 Adjustments
After adoptingmeasurement
requirements inTopic 715-20
Retained earnings $ – $ (14) $ (14)
Accumulated other comprehensive loss $ 523 $ 3 $ 526
The funded status and discount rate using the new measurement date as at October 31, 2009 are as follows:
2009Pension
plansOther post-
employment plans Total
Other assetsPrepaid pension benefit cost $ 6,268 $ 25 $ 6,293
Other liabilitiesAccrued pension and other post-employment benefit expense 6,810 1,340 8,150
Funded status – excess of benefit obligation over plan assets $ (542) $ (1,315) $ (1,857)
Weighted average assumptions to calculate benefit obligationDiscount rate 6.30% 6.32%
The under-funded status of the pension plans and other post-employment plans of $542 million and $1,315 million (2008 – $355million and $1,272 million), respectively, is recognized on our
Consolidated Balance Sheet in Other liabilities. The accumulatedbenefit obligations for the pension plans were $6,451 million as atOctober 31, 2009 (2008 – $5,757 million).
The pre-tax amounts included in AOCI are as follows:
2009 2008
Pensionplans
Other post-employment
plans TotalPension
plans
Other post-employment
plans Total
Net actuarial loss $ 1,436 $ 221 $ 1,657 $ 761 $ 267 $ 1,028Prior service cost (benefit) 42 (258) (216) 62 (283) (221)Transitional (asset) obligation (6) 1 (5) (8) 1 (7)
Accumulated other comprehensive income (1) $ 1,472 $ (36) $ 1,436 $ 815 $ (15) $ 800
(1) Amount recognized in AOCI, net of tax, is $959 million (2008 – $523 million).
The estimated net actuarial loss and prior service cost for the pensionplans that will be amortized from AOCI, on a pre-tax basis, intopension expense during 2010 are $131 million and $17 million,respectively, and pension expense will be reduced by $2 millionrelating to amortization of transitional assets. The estimated netactuarial loss and transitional obligation for Other post-employmentplans that will be amortized from AOCI, on a pre-tax basis, intopension expense during 2010 are $10 million and $nil, respectively,and pension expense will be reduced by $23 million relating to theamortization of prior service benefit.
SecuritiesThe following table presents the duration of the unrealized losses onour available-for-sale securities. Refer to Note 3 for the reasons whythese securities are considered to be not other-than-temporarilyimpaired as at October 31, 2009. The gross unrealized losses of theavailable-for-sale securities under U.S. GAAP are higher than thoseunder Canadian GAAP as disclosed in Note 3, primarily becausecertain of these securities were designated as held-for-trading usingthe fair value option and also due to the reclassification of certainavailable-for-sale securities to loans under Canadian GAAP.
Consolidated Financial Statements Royal Bank of Canada: Annual Report 2009 135

Note 31 Reconciliation of the application of Canadian and United States generally accepted accounting principles (continued)
Fair value and unrealized losses position for available-for-sale securities2009
Less than 12 months 12 months or more Total
Fair valueUnrealized
losses Fair valueUnrealized
losses Fair valueUnrealized
losses
Canadian government debtFederal $ 1,213 $ 8 $ – $ – $ 1,213 $ 8Provincial and municipal 148 4 93 2 241 6
U.S. state, municipal and agencies debt 162 1 487 27 649 28Other OECD government debt 503 2 74 2 577 4Mortgage-backed securities (1) 496 118 2,113 379 2,609 497Asset-backed securities
CDOs – – 205 24 205 24Non-CDO Securities 724 15 275 68 999 83
Corporate debt and other debt 1,382 42 1,887 305 3,269 347Equities 59 40 97 23 156 63Loan substitute securities – – – – – –
$ 4,687 $ 230 $ 5,231 $ 830 $ 9,918 $ 1,060
(1) The majority of the MBS are residential. Fair value and unrealized losses of commercial MBS for less than 12 months are $nil and $nil, respectively and for 12 months or more are $197million and $23 million, respectively.
2008Less than 12 months 12 months or more Total
Fair valueUnrealized
losses Fair valueUnrealized
losses Fair valueUnrealized
losses
Canadian government debtFederal $ 958 $ 11 $ – $ – $ 958 $ 11Provincial and municipal 883 72 26 5 909 77
U.S. state, municipal and agencies debt 5,715 259 335 41 6,049 300Other OECD government debt 132 3 21 4 153 7Mortgage-backed securities (1) 2,265 363 1,270 443 3,535 806Asset-backed securities
CDOs – – 246 82 246 82Non-CDO securities 3,546 294 155 26 3,701 320
Corporate debt and other debt 4,762 494 1,369 382 6,131 876Equities 994 216 347 161 1,341 377Loan substitute securities – – 191 29 191 29
$ 19,255 $ 1,712 $ 3,960 $ 1,173 $ 23,214 $ 2,885
(1) The majority of the MBS are residential. Fair value and unrealized losses of commercial MBS for less than 12 months are $103 million and $3 million, respectively and for 12 months or moreare $109 million and $11 million, respectively.
Average assets, U.S. GAAP2009 2008 2007
Average assets
% of totalaverage
assets Average assets
% of totalaverage
assets Average assets
% of totalaverage
assets
Canada $ 377,572 61% $ 369,378 60% $ 334,729 60%United States 147,697 24% 147,196 24% 139,556 25%Other International 90,276 15% 98,162 16% 86,409 15%
$ 615,545 100% $ 614,736 100% $ 560,694 100%
136 Royal Bank of Canada: Annual Report 2009 Consolidated Financial Statements

Income taxesUnder Topic 740, Income Taxes (Topic 740) (FIN No. 48, Accountingfor Uncertainty in Income Taxes, an interpretation of FASB StatementNo. 109), income tax benefits are recognized and measured based ona two-step model: (i) a tax position must be more-likely-than-not ofbeing sustained where “more-likely- than-not” means a likelihood ofmore than 50%, and (ii) the benefit is measured as the dollar amountof the position that is more-likely-than-not of being realized uponultimate settlement with a taxing authority. The difference betweenthe tax benefit recognized in accordance with this guidance and thetax benefit claimed on a tax return is referred to as an unrecognizedtax benefit (UTB).
A reconciliation of the change in the UTB balance (excluding anyrelated accrual for interest) from October 31, 2008 to October 31,2009 is as follows:
Reconciliation of the Change in Unrecognized Tax BenefitsBalance, October 31, 2008 $ 858Add: Increases related to positions taken during prior years 34Add: Increases related to positions taken during the current year 185Add: Positions acquired or assumed in business combinations 14Less: Expiration of statute of limitations (38)Less: Settlements (20)Less: Foreign exchange and other (15)Less: Decreases related to positions taken during prior years (11)
Balance, October 31, 2009 $1,007
As at October 31, 2009 and 2008, the balances of our UTBs,excluding any related accrual for interest, were $1,007 million and$858 million, respectively, of which $988 million and $827 million,respectively, if recognized, would affect our effective tax rate. It isdifficult to project how unrecognized tax benefits will change over thenext 12 months.
Under Topic 740, we continue our policy of accruing incometax-related interest and penalties within income tax expense. As atOctober 31, 2009 and 2008, our accrual for interest and penaltiesthat relate to income taxes, net of payments on deposit to taxingauthorities, were $40 million and $23 million, respectively. There wasa net increase of $17 million in the accrual for interest and penaltiesduring the year ended October 31, 2009.
RBC and its subsidiaries are subject to Canadian federal andprovincial income tax, U.S. federal, state and local income tax, andincome tax in other foreign jurisdictions. The following are the majortax jurisdictions in which RBC and its subsidiaries operate and theearliest tax year subject to examination: Canada – 2005, UnitedStates – 2003 and United Kingdom – 2008.
Significant accounting changes
Framework on fair value measurementTopic 820, Fair Value Measurements and Disclosures (Topic 820)(FASB Statement No. 157, Fair Value Measurements and relatedpronouncements), became effective for us on November 1, 2008except for certain non-financial assets and non-financial liabilitieswhich will be effective on November 1, 2009.
Topic 820 defines fair value as the price that would be receivedto sell an asset or paid to transfer a liability in an orderly transactionbetween market participants at the measurement date. Topic 820requires an entity to maximize the use of observable inputs andminimize the use of unobservable inputs to measure the fair values ofits assets and liabilities and requires an entity to include the impactof its own credit risk in measuring derivatives and other liabilitiesmeasured at fair value. It also eliminates the deferral of unrealizedgains or losses at inception on certain derivative instruments whosefair value is measured using unobservable market inputs andprecludes the use of block discounts that were previously applied tolarge holdings of securities traded in an active market. On adoption,any unrealized gains or losses at inception and adjustments for blockdiscounts, if any, would be recognized as a transition adjustment inretained earnings.
Topic 820 prescribes a three-level fair value hierarchy fordisclosure purposes based on the transparency of the inputs used tomeasure the fair values of assets and liabilities. Specific guidanceunder Topic 820 (FSP FAS 157-4, Determining Fair Value When theVolume and Level of Activity for the Asset or Liability Have SignificantlyDecreased and Identifying Transactions That Are Not Orderly), issuedon April 9, 2009 by the FASB and effective for us on May 1, 2009,provides additional factors to consider while measuring fair valuewhen there has been significant decrease in the level of marketactivity for an asset or a liability and to determine whether quotedprices are associated with transactions that are not considered to beorderly. It also expands the disclosure requirements of the fair valueof financial instruments. Additional guidance under Topic 820 (ASU2009-05, Measuring Fair Value Liabilities), issued in August 2009,specifies the valuation techniques that are required to be applied tomeasure fair value when a quoted price in an active market of anidentical liability is not available.
Refer to Note 2 for the fair value hierarchy and the reconciliationof Level 3 financial instruments under Canadian GAAP. Balances offinancial instruments in the U.S. GAAP fair value hierarchy differ fromthose of Canadian GAAP primarily due to non-cash collateral, trade-date accounting, election of the fair value option under CanadianGAAP for investments supporting the policy benefit liabilities on lifeand health insurance contracts as opposed to available-for-saleclassification under U.S. GAAP, and joint ventures accounting. Referto the Material balance sheet reconciling items table for the amountsof these reconciling differences.
With the adoption of Topic 820, deferral of inception gains andlosses previously required under U.S. GAAP (EITF 02-3, IssuesInvolved in Accounting for Derivative Contracts Held for TradingPurposes and Contracts Involved in Energy Trading and RiskManagement Activities) is no longer required. Valuation adjustmentsfor unrealized gains or losses at inception, recognized in accordancewith the previous guidance, were reclassified into other valuationadjustment categories. The reclassification had no impact on theoverall amount of valuation adjustments. The remaining balance of$38 million, net of taxes, relating to the allowance for unrealizedgains or losses at inception has been recognized as a transitionadjustment as an increase to our opening retained earnings underU.S. GAAP.
Consolidated Financial Statements Royal Bank of Canada: Annual Report 2009 137

Note 31 Reconciliation of the application of Canadian and United States generally accepted accounting principles (continued)
Fair value option for financial assets and liabilitiesOn February 15, 2007, the FASB issued guidance under Topic 825-10.This guidance, which gives an entity the option to report selectedfinancial assets and liabilities at fair value and establishes newdisclosure requirements for assets and liabilities to which the fairvalue option is applied, became effective for us on November 1,2008. The difference between the carrying amount and the fair valueof the eligible items for which the fair value option was elected as atNovember 1, 2008 was included in opening retained earnings as acumulative-effect adjustment which was an increase of $81 millionafter taxes.
Our accounting policy on electing the fair value option isdescribed in Note 1 and in the ‘Material differences betweenCanadian and U.S. GAAP’ section of this note. The following tablepresents, as at October 31, 2009, the categories of financial assetsand liabilities elected for fair value option in accordance withguidance under Topic 815-15-25, Derivatives and Hedging –Embedded Derivatives (FASB Statement No. 155, Accounting forCertain Hybrid Financial Instruments – an amendment of FASBStatements No. 133 and 140 ) and Topic 825-10, as well as thedifference between the aggregate fair value and the aggregateremaining contractual maturity amount for loans and long-term debtfor which the fair value option has been elected under thesestandards:
2009
Aggregatefair value
carryingamount
Contractualmaturityamount
Fair valueover (under)contractual
maturityamount
Financial assetsInterest-bearing deposits with banks $ 2,773 $ 2,773 $ –Securities – Trading 1,718 n/a n/aAssets purchased under reverse
repurchase agreements andsecurities borrowed 18,911 18,914 (3)
Loans – Retail 214 214 –Loans – Wholesale 2,818 2,934 (116)
Performing loans 2,441 2,557 (116)90 days or more past due but not
impaired 377 377 –Financial liabilities
DepositsPersonal $ 2,605 $ 2,605 $ –Business and government 40,335 40,167 168Bank 10,880 10,880 –
Obligations related to assets soldunder repurchase agreements andsecurities loaned 21,628 21,626 2
Other liabilities 240 240 –Subordinated debentures 110 120 (10)
The unrealized losses of these assets and liabilities recognized inincome for the year ended October 31, 2009 was $443 million. Theamount of changes in fair value attributable to changes in credit riskfor loans and receivables and attributable to our credit spreads for ourfinancial liabilities, and the methodology to determine these amountsare disclosed in Note 2. Changes in fair value since November 1, 2008attributable to changes in our credit spreads increased the fair value ofour term deposit liabilities by $550 million. This increase is primarilydue to the reduction in our credit spreads for both Canadian and U.S.denominated term deposit liabilities as the credit market conditionsimproved. Changes in fair value in this period attributable to changesin credit risk or our credit spreads on Loans – Wholesale andSubordinated debentures, respectively, were not material.
Interest income and expense of these debt securities and loansare measured based on their interest rates and are reported in Netinterest income.
Derivatives and hedging activitiesOn March 19, 2008, the FASB issued guidance under Topic 815,Derivatives and Hedging (Topic 815) (FASB Statement No. 161,Disclosures about Derivative Instruments and Hedging Activities – anamendment of FASB Statement No. 133). This guidance requires anentity to disclose how and why it uses derivatives, how it accounts forderivatives and any related hedged item, and how derivatives andhedged items affect the entity’s financial position, performance andcash flows. The guidance, which was effective for us on February 1,2009, did not change the accounting for derivatives and hedgeditems, and therefore, our adoption of this standard did not affect ourconsolidated financial position or results of operations. Refer toNotes 1 and 7 for more information regarding our use of derivativeinstruments and hedging activities.
Fair value of derivatives by major types of productsThe following table presents the fair values of the derivatives andnon-derivative financial instruments categorized by their hedgingrelationships, as well as derivatives that are not designated inhedging relationships.
2009Designated as hedginginstruments in hedging
relationships
Cash flowhedges
Fairvalue
hedges
Netinvestment
hedges
Not designatedin a hedging
relationship (1)
AssetsDerivative financial
instrumentsInterest rate contracts $ 1,130 $ 2,107 $ – $ 50,732Foreign exchange contracts – – 139 25,598Credit derivatives – – – 5,320Other contracts – – – 7,359
Total $ 1,130 $ 2,107 $ 139 $ 89,009Liabilities
Derivative financialinstrumentsInterest rate contracts $ 1,493 $ 82 $ – $ 46,551Foreign exchange contracts – – 327 23,832Credit derivatives – – – 4,418Other contracts – – – 7,844
Total $ 1,493 $ 82 $ 327 $ 82,645Non-derivative financial
instruments $ – $ – $ 5,233 $ n.a.
(1) Derivative liabilities include stable value contracts on $257 million of bank-owned lifeinsurance policies and $3 million of 401(k) plans.
n.a. not applicable
138 Royal Bank of Canada: Annual Report 2009 Consolidated Financial Statements

Hedging activities by major types of products2009
Net gains(losses)
includedin Non-
interestincome
Net gains(losses)
includedin
Netinterestincome
After-taxunrealized
gains(losses)
includedin OCI
Fair value hedgesIneffective portion
Interest rate contracts $ 9 $ n.a. $ n.a.Cash flow hedgesIneffective portion
Interest rate contracts 9 n.a. n.a.Effective portion
Interest rate contracts n.a. n.a. 185Reclassified to income during
the period (1)Interest rate contracts n.a. 53 n.a.
Net investment hedgesForeign currency losses n.a. n.a. (2,971)Gains from hedges
Foreign exchange contracts n.a. n.a. 1,982Non-derivative financial instruments n.a. n.a. 417
$ 18 $ 53 $ (387)
(1) After-tax gains of $37 million were reclassified from AOCI to income for the year endedOctober 31, 2009.
n.a. not applicable
Revenue from trading and selected non-trading financial instruments2009
Non-interest incomeInterest rate and credit $ 1,789Equities 169Foreign exchange and commodities (1) 641
Total $ 2,599
(1) Includes precious metals.
Contingent featuresCertain derivative instruments contain provisions that link ourcollateral posting requirements to our credit ratings from the majorcredit rating agencies. If our credit ratings were to fall, certaincounterparties to the derivative instruments could request immediatepayment or demand immediate and ongoing overnightcollateralization on net derivative liability positions. The aggregatenet fair value of all derivative instruments with collateral postingrequirements that are in a net liability position on October 31, 2009,is $10.5 billion for which we have posted collateral of $6.4 billion inthe normal course of business. If our credit ratings had beendowngraded to BBB on October 31, 2009, we would have beenrequired to post an additional $2.2 billion of collateral to thecounterparties of these contracts. If our credit ratings were to fallbelow BBB, we do not expect that the additional collateral that wewould be required to post would be material.
Credit Derivatives and guaranteesOn September 12, 2008, the FASB issued guidance under Topic 815(FSP FAS 133-1 and FIN 45-4, Disclosures about Credit Derivatives andCertain Guarantees: An Amendment of FASB Statement No. 133 andFASB Interpretation No. 45; and Clarification of the Effective Date ofFASB Statement No. 161). This guidance amends previous guidanceunder this topic by requiring more information about the potentialadverse effects of changes in credit risk on the financial position,financial performance and cash flows of the sellers of creditderivatives, including credit derivatives embedded in hybridinstruments. The guidance also amends Topic 460, Guarantees (FIN45, Guarantor’s Accounting and Disclosure Requirements forGuarantees, Including Indirect Guarantees of Indebtedness to Others),to require additional disclosure about the current status of thepayment/performance risk of a guarantee. The above specificguidance under Topic 815, which was effective for us November 1,2008, amends disclosure requirements for credit derivatives andcertain guarantees, and therefore, it had no impact on ourconsolidated financial position or results of operations.
Events or circumstances that would require seller to perform underthe credit derivativeCredit derivatives are over-the-counter contracts that transfer creditrisk related to an underlying financial instrument (referenced asset)from one counterparty to another. Credit derivatives provideprotection against the decline in value of the referenced asset as aresult of specified credit events such as default or bankruptcy.
Credit derivative instruments soldCredit derivative instruments for which we are the seller of creditprotection are summarized in the table below. These instrumentshave been classified as investment and non-investment grade basedon the credit quality of the underlying referenced asset within thecredit derivative. For most credit derivatives, the notional valuerepresents the maximum amount payable by us. However, we do notexclusively monitor our exposure to credit derivatives based onnotional value because this measure does not take into considerationthe probability of occurrence. As such, the notional value is not areliable indicator of our exposure to these contracts.
Credit derivatives – protection sold by ratings/maturity profile2009
Maximum Payout / Notional Fair value
Within 1 year 1 to 5 years Over 5 years Total Positive Negative
Credit default swaps (1)
Investment grade (2) $ 6,380 $ 19,864 $ 5,338 $ 31,582 $ 227 $ 1,105Non-investment grade (2) 1,668 6,880 1,489 10,037 74 1,377Non-rated 707 7,279 532 8,518 33 368
$ 8,755 $ 34,023 $ 7,359 $ 50,137 $ 334 $ 2,850
Credit default basketsNot rated (3) $ 1,161 $ 4,538 $ 2,543 $ 8,242 $ – $ 1,074
Total (4) $ 9,916 $ 38,561 $ 9,902 $ 58,379 $ 334 $ 3,924
(1) Credit default swaps include total return swaps which are nominal to the entire portfolio.(2) Credit ratings of AAA, AA, A and BBB represent investment grade ratings and ratings of BB or lower represent non-investment grade ratings. These credit ratings largely reflect those assigned by
external rating agencies and represent the payment or performance risk of the underlying security or referenced asset. Where external ratings were not available, our internal ratings were used.(3) Credit default baskets are similar to credit default swaps except that the underlying referenced financial instrument is a group of assets instead of a single asset; consequently, ratings have
not been assigned because the underlying asset(s) cannot be reasonably rated.(4) At October 31, 2009, the notional value and net carrying value of credit protection sold in which we held purchased protection with identical underlying assets was $48.7 billion and
$2.5 billion.
Consolidated Financial Statements Royal Bank of Canada: Annual Report 2009 139

Note 31 Reconciliation of the application of Canadian and United States generally accepted accounting principles (continued)
GuaranteesThe following table summarizes significant guarantees we have provided to third parties by investment grade and non-investment grade.
2009Maximum potential amount
of future payments
Carryingamount
Investmentgrade (1)
Non-investment
grade (1)Not
rated Total
Credit derivatives and written put options (2) $ 7,508 $ 3,813 $ 8,399 $ 19,720 $ 1,049Backstop liquidity facilities 23,806 1,176 – 24,982 66Stable value products 21,777 – – 21,777 260Financial standby letters of credit and performance guarantees (3) 11,236 6,778 68 18,082 96Credit enhancements 3,240 – – 3,240 45Mortgage loans sold with recourse 1,103 – – 1,103 –
(1) Credit ratings of AAA, AA, A and BBB represent investment grade ratings and ratings of BB or lower represent non- investment grade ratings. These credit ratings largely reflect those assigned byexternal rating agencies and represent the payment or performance risk of the underlying security or referenced asset. Where external ratings were not available, our internal ratings were used.
(2) Ratings could not be assigned to credit default baskets of $1.9 billion and written put options of $6.5 billion.(3) Ratings could not be assigned to financial standby letters of credit and performance guarantees with a maximum potential amount of future payments of $68 million as the rating of the
underlying entity for these guarantees is not available at this time.
Securitizations and VIEsOn December 11, 2008, the FASB amended disclosure guidance underTopic 860, Transfers and Servicing (Topic 860) and Topic 810,Consolidation (Topic 810) (FSP FAS 140-4 and FIN 46(R)-8, Disclosuresby Public Entities about Transfer of Financial Assets and Interests inVariable Interest Entities), which amends previous disclosurerequirements of FASB Statement No. 140, Accounting for Transfers andServicing of Financial Assets and Extinguishments of Liabilities byrequiring public entities to provide additional disclosures related totheir continuing involvement with transferred financial assets and therelated risk retained as well as any contractual or non-contractualsupport provided and any future financial support to the specialpurpose entities (SPEs). It also amends previous disclosure require-ments of FIN 46 (revised December 2003), Consolidation of VariableInterest Entities, to require public enterprises, including sponsors thathave a variable interest in a variable interest entity, to provideadditional disclosures about their involvement with variable interestentities. The new disclosures requirements were effective for us onNovember 1, 2008, and had no impact on our consolidated financialposition or results of operations.
SecuritizationsOur securitization activities by major product type, our continuinginvolvement with the transferred asset and the related risk retainedare described in Note 5.
The following table presents the total assets of the QSPE used forcredit card securitizations and the classification of assets andliabilities recorded on our Consolidated Balance Sheets associatedwith our transactions with QSPE and SPEs. Refer to Note 5 foradditional information.
2009Interest in securitizations
Credit cardsCommercial and
residential mortgages
Total assets of QSPE (1) $ 3,923 $ n.a.
On-balance sheet assetsSecurities – Trading and
Available-for-sale $ 1,014 $ 1,479Loans – Retail and Wholesale 6 –Derivatives – 203Total $ 1,020 $ 1,682On balance sheet liabilitiesDerivatives $ 6 $ 673Total $ 6 $ 673(1) Represents the remaining principal balance of assets held by QSPE using the most
current information available.n.a. not applicable.
VIEsWe perform qualitative, and in certain cases, quantitative, analyses todetermine whether we are the Primary Beneficiary of a VIE based onthe facts and circumstances and our interests in the VIE. We may alsohold significant variable interests in VIEs, and while we do notconsolidate these VIEs, we have recorded on our ConsolidatedBalance Sheets assets and liabilities arising from our transactionsand involvement with these VIEs. This information is set forth in thetable below. In addition, Topic 810 requires disclosures for VIEs thatwe sponsor and in which we hold variable interests. In determiningwhether we are a sponsor of a VIE, we consider both qualitative andquantitative factors, including the purpose and nature of the VIE, ourcontinuing involvement in the VIE and whether we hold subordinatedinterests in the VIE. This table also includes VIEs for which we aresponsors of and hold a variable interest in, even if not significant.
140 Royal Bank of Canada: Annual Report 2009 Consolidated Financial Statements
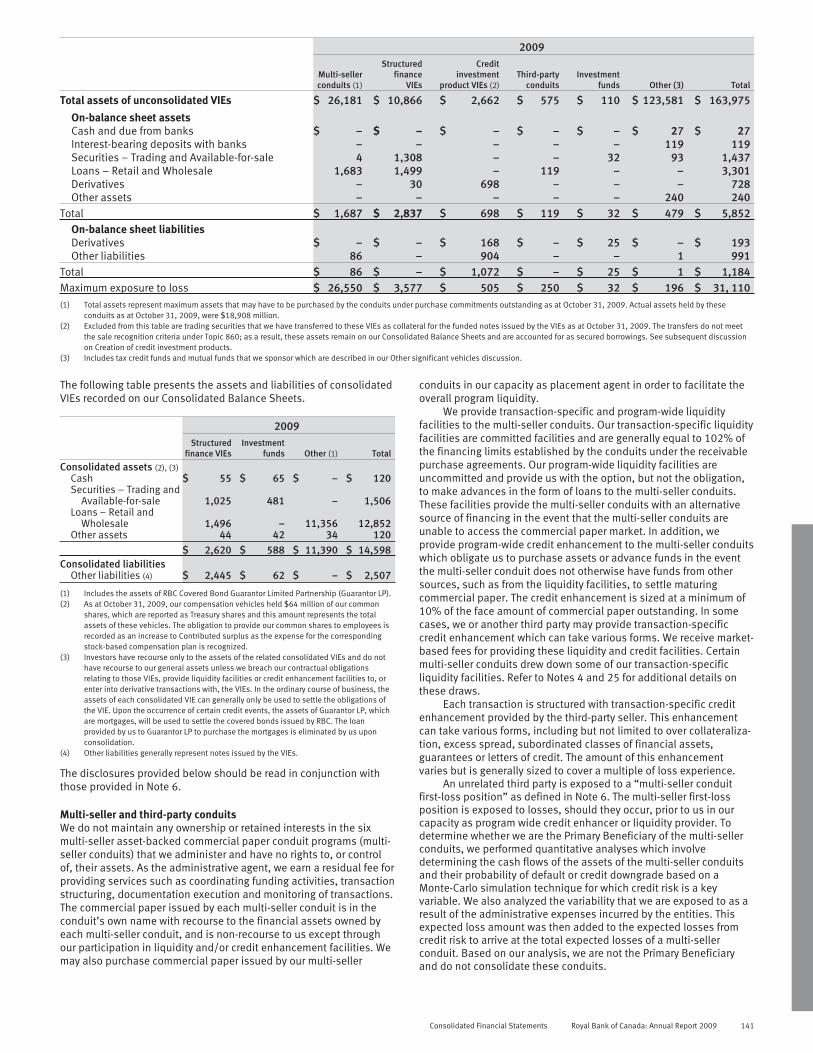
2009
Multi-sellerconduits (1)
Structuredfinance
VIEs
Creditinvestment
product VIEs (2)Third-party
conduitsInvestment
funds Other (3) Total
Total assets of unconsolidated VIEs $ 26,181 $ 10,866 $ 2,662 $ 575 $ 110 $ 123,581 $ 163,975
On-balance sheet assetsCash and due from banks $ – $ – $ – $ – $ – $ 27 $ 27Interest-bearing deposits with banks – – – – – 119 119Securities – Trading and Available-for-sale 4 1,308 – – 32 93 1,437Loans – Retail and Wholesale 1,683 1,499 – 119 – – 3,301Derivatives – 30 698 – – – 728Other assets – – – – – 240 240
Total $ 1,687 $ 2,837 $ 698 $ 119 $ 32 $ 479 $ 5,852On-balance sheet liabilitiesDerivatives $ – $ – $ 168 $ – $ 25 $ – $ 193Other liabilities 86 – 904 – – 1 991
Total $ 86 $ – $ 1,072 $ – $ 25 $ 1 $ 1,184Maximum exposure to loss $ 26,550 $ 3,577 $ 505 $ 250 $ 32 $ 196 $ 31, 110(1) Total assets represent maximum assets that may have to be purchased by the conduits under purchase commitments outstanding as at October 31, 2009. Actual assets held by these
conduits as at October 31, 2009, were $18,908 million.(2) Excluded from this table are trading securities that we have transferred to these VIEs as collateral for the funded notes issued by the VIEs as at October 31, 2009. The transfers do not meet
the sale recognition criteria under Topic 860; as a result, these assets remain on our Consolidated Balance Sheets and are accounted for as secured borrowings. See subsequent discussionon Creation of credit investment products.
(3) Includes tax credit funds and mutual funds that we sponsor which are described in our Other significant vehicles discussion.
The following table presents the assets and liabilities of consolidatedVIEs recorded on our Consolidated Balance Sheets.
2009Structured
finance VIEsInvestment
funds Other (1) Total
Consolidated assets (2), (3)Cash $ 55 $ 65 $ – $ 120Securities – Trading and
Available-for-sale 1,025 481 – 1,506Loans – Retail and
Wholesale 1,496 – 11,356 12,852Other assets 44 42 34 120
$ 2,620 $ 588 $ 11,390 $ 14,598Consolidated liabilities
Other liabilities (4) $ 2,445 $ 62 $ – $ 2,507
(1) Includes the assets of RBC Covered Bond Guarantor Limited Partnership (Guarantor LP).(2) As at October 31, 2009, our compensation vehicles held $64 million of our common
shares, which are reported as Treasury shares and this amount represents the totalassets of these vehicles. The obligation to provide our common shares to employees isrecorded as an increase to Contributed surplus as the expense for the correspondingstock-based compensation plan is recognized.
(3) Investors have recourse only to the assets of the related consolidated VIEs and do nothave recourse to our general assets unless we breach our contractual obligationsrelating to those VIEs, provide liquidity facilities or credit enhancement facilities to, orenter into derivative transactions with, the VIEs. In the ordinary course of business, theassets of each consolidated VIE can generally only be used to settle the obligations ofthe VIE. Upon the occurrence of certain credit events, the assets of Guarantor LP, whichare mortgages, will be used to settle the covered bonds issued by RBC. The loanprovided by us to Guarantor LP to purchase the mortgages is eliminated by us uponconsolidation.
(4) Other liabilities generally represent notes issued by the VIEs.
The disclosures provided below should be read in conjunction withthose provided in Note 6.
Multi-seller and third-party conduitsWe do not maintain any ownership or retained interests in the sixmulti-seller asset-backed commercial paper conduit programs (multi-seller conduits) that we administer and have no rights to, or controlof, their assets. As the administrative agent, we earn a residual fee forproviding services such as coordinating funding activities, transactionstructuring, documentation execution and monitoring of transactions.The commercial paper issued by each multi-seller conduit is in theconduit’s own name with recourse to the financial assets owned byeach multi-seller conduit, and is non-recourse to us except throughour participation in liquidity and/or credit enhancement facilities. Wemay also purchase commercial paper issued by our multi-seller
conduits in our capacity as placement agent in order to facilitate theoverall program liquidity.
We provide transaction-specific and program-wide liquidityfacilities to the multi-seller conduits. Our transaction-specific liquidityfacilities are committed facilities and are generally equal to 102% ofthe financing limits established by the conduits under the receivablepurchase agreements. Our program-wide liquidity facilities areuncommitted and provide us with the option, but not the obligation,to make advances in the form of loans to the multi-seller conduits.These facilities provide the multi-seller conduits with an alternativesource of financing in the event that the multi-seller conduits areunable to access the commercial paper market. In addition, weprovide program-wide credit enhancement to the multi-seller conduitswhich obligate us to purchase assets or advance funds in the eventthe multi-seller conduit does not otherwise have funds from othersources, such as from the liquidity facilities, to settle maturingcommercial paper. The credit enhancement is sized at a minimum of10% of the face amount of commercial paper outstanding. In somecases, we or another third party may provide transaction-specificcredit enhancement which can take various forms. We receive market-based fees for providing these liquidity and credit facilities. Certainmulti-seller conduits drew down some of our transaction-specificliquidity facilities. Refer to Notes 4 and 25 for additional details onthese draws.
Each transaction is structured with transaction-specific creditenhancement provided by the third-party seller. This enhancementcan take various forms, including but not limited to over collateraliza-tion, excess spread, subordinated classes of financial assets,guarantees or letters of credit. The amount of this enhancementvaries but is generally sized to cover a multiple of loss experience.
An unrelated third party is exposed to a “multi-seller conduitfirst-loss position” as defined in Note 6. The multi-seller first-lossposition is exposed to losses, should they occur, prior to us in ourcapacity as program wide credit enhancer or liquidity provider. Todetermine whether we are the Primary Beneficiary of the multi-sellerconduits, we performed quantitative analyses which involvedetermining the cash flows of the assets of the multi-seller conduitsand their probability of default or credit downgrade based on aMonte-Carlo simulation technique for which credit risk is a keyvariable. We also analyzed the variability that we are exposed to as aresult of the administrative expenses incurred by the entities. Thisexpected loss amount was then added to the expected losses fromcredit risk to arrive at the total expected losses of a multi-sellerconduit. Based on our analysis, we are not the Primary Beneficiaryand do not consolidate these conduits.
Consolidated Financial Statements Royal Bank of Canada: Annual Report 2009 141

Note 31 Reconciliation of the application of Canadian and United States generally accepted accounting principles (continued)
We hold significant variable interest in third-party asset-backedsecurity conduits (third-party conduits) primarily through providingbackstop liquidity facilities. We, as well as other financial institutionsare obligated to provide funding under these facilities if these thirdparty conduits have insufficient funding to settle outstandingcommercial paper. Our liquidity support facilities do not expose us tothe majority of the expected losses; therefore, we do not consolidatethese conduits.
Structured finance VIEsWe purchased U.S. ARS from U.S. ARS VIEs. We also sell ARS into ARSTOB programs. In certain cases, we used expected loss analyses todetermine whether we are the Primary Beneficiary of U.S. ARS VIEsand in ARS TOBs when it is not qualitatively apparent. The expectedloss calculations consider the credit rating of assets, recovery rateand corporate ratings as inputs to project various cash flow and creditloss scenarios. In the case of U.S. ARS VIEs, the expected lossanalyses are based on the credit risk on the portion of the debt that isnot government guaranteed. We also take into consideration basisrisk through projecting the interest rates of various indices. Using allof these inputs, we calculate the variability of excess spread cashflows, and determine whether we are exposed to the majority of thevariability based on our note holdings in the U.S. ARS VIEs, or theletters of credit and liquidity facilities in the case of ARS TOBprograms.
We sold ARS to an unaffiliated and unconsolidated VIE at fairmarket value. The purchase of the ARS by this entity was financed bya loan from us, and the loan is secured by various assets of the entity.Our loan is exposed to credit losses of the ARS, but is mitigated byhigh credit quality of the ARS. The entity also enters in derivativetransactions for which we may be a guarantor of the obligations of theVIE. Our credit risk exposure to the VIE as a result of the guarantees isnot significant because they are secured by cash collateral and thederivatives are subject to daily margining requirements. We servevarious administrative roles for the VIE, including the remarketingagent for the ARS, and receive a fee commensurate with the serviceswe provide. The counterparties to the interest rate derivatives areexposed to the majority of the VIE’s variability; as a result, we do notconsolidate this entity.
Creation of credit investment productsIn certain instances, we invest in the funded and unfunded notesissued by the credit investment product VIEs. We may transfer ourassets to the VIEs as collateral for the funded notes with an obligationto buy these assets back in the future. The investors of the fundednotes are not exposed to the credit or market risks of the collateralassets as we are required to repurchase the assets at their par value,but we mitigate substantially all of the credit and market risks of thecollateral as we have the ability to substitute the collateral. Theunfunded notes are in a senior position to the funded notes. Theinvestors of these funded and unfunded notes are exposed to creditrisk as a result of the credit protection provided by the VIEs, subject totheir level of seniority. In our role of derivative counterparty to theVIEs, we also assume the associated counterparty credit risk of theVIEs. Currently, we act as sole arranger and swap provider for certainVIEs and, in most cases, act as the paying and issuing agent as well.Other independent third parties fulfill the remainder of the functionsrequired for such a product.
Investment fundsInvestment funds are generally financed through investments madeby us or other third party investors. We also act as custodian oradministrator for several funds. Our investments in certain funds mayexpose us to the market risk of the underlying investments. We mayalso be exposed to counterparty risk due to the equity derivativetransactions.
Other significant vehiclesWe created certain funds to pass through tax credits received fromunderlying low-income housing or historic rehabilitation real estateprojects to third parties (tax credit funds). We are sponsors of the taxcredit funds as a result of our responsibility to manage the assets,arrange the financing, and perform the administrative duties of thesetax credit funds. We are also sponsors of our mutual funds as a resultof our ability to influence the investment decisions of the mutualfunds and our continuing involvement in the administration of thesefunds.
Offsetting of amounts related to certain contractsOn April 30, 2007, the FASB issued guidance FSP FIN 39-1,Amendment of FASB Interpretation No. 39 which amended certainaspects of Topic 210-20, Balance Sheet – Offsetting and Topic 815,Derivatives and Hedging (FIN 39, Offsetting of Amounts Related toCertain Contracts). These amendments to permit a reporting entity tooffset the fair value of derivative instruments and the right to reclaimcash collateral (a receivable) or the obligation to return cashcollateral (a payable) against the fair value of derivative instrumentsexecuted with the same counterparty under the same master nettingagreement, regardless of whether there is an intention to settle on anet basis. We adopted the guidance on November 1, 2008, and haveoffset fair value amounts on our U.S. GAAP Consolidated Balance
Sheets pursuant to this guidance as follows, including thecomparative periods presented: as at October 31, 2009, the fair valueamounts of derivative instruments that have been netted againstderivative assets and derivative liabilities was $62.9 billion(October 31, 2008 – $76.2 billion); as at October 31, 2009, the cashcollateral applied against derivative assets and derivative liabilitieswas $7.9 billion and $3.5 billion, respectively (October 31, 2008 –$5.0 billion and $7.5 billion, respectively); as at October 31, 2009,we held $9.1 billion (October 31, 2008 – $6.3 billion) of collateral onderivative positions, of which $7.3 billion (October 31, 2008 –$4.7 billion) could be applied against credit risk.
Amendment to impairment guidance of EITF Issue No. 99-20On January 12, 2009, the FASB amended the impairment guidance inTopic 325-40, Investments – Other – Beneficial Interests in SecuritizedFinancial Assets (FSP EITF 99-20-1, Amendments to the ImpairmentGuidance of EITF Issue No. 99-20 which amends EITF 99-20, Recog-nition of Interest income and Impairment on Purchased and RetainedBeneficial Interests That Continue to Be Held by a Transferor inSecuritized Financial Assets) in order to more closely align theimpairment model with that of Topic 320-10, Investments – Debt and
Equity Securities (FASB Statement No. 115, Accounting for certainInvestments in Debt and Equity Securities). In particular, theamendments require management to assess whether it is probablethat there has been an adverse change in the estimated cash flowsfor certain beneficial interest in securitized financial assets ratherthan using market participants assumptions when determining thefuture cash flows. The amendments became effective for us onNovember 1, 2008 and the impact of adopting it is not material to ourconsolidated financial position or results of operations.
142 Royal Bank of Canada: Annual Report 2009 Consolidated Financial Statements

Income tax benefits of dividends on share-based payment awardsIn June 2007, the FASB ratified the consensus reached by the EITF onTopic 718-740, Compensation – Stock Compensation – Income Taxes(EITF 06-11, Accounting for Income Tax Benefits of Dividends onShare-Based Payment Awards), regarding realized tax benefits ondividend payments related to certain shared-based paymentarrangements which can be treated as deductible compensationexpense for income tax purposes. Under this guidance, a realized taxbenefit from dividends or dividend equivalents that are charged toretained earnings and paid to employees for equity-classifiednon-vested equity shares, non-vested equity share units, and
outstanding share options should be recognized as an increase toadditional paid-in capital (APIC). Those tax benefits are consideredexcess tax benefits under Topic 718. The EITF also reached a finalconsensus that if an entity's estimate of forfeitures increases(resulting in compensation expense), the amount of associated taxbenefits that are reclassified from APIC to the income statementshould be limited to the entity's pool of excess tax benefits. Thisguidance became effective for us on November 1, 2008, and theimpact of adopting it is not material to our consolidated financialposition or results of operations.
Other-than-temporary impairment of securitiesOn April 9, 2009, the FASB issued guidance under Topic 320, Investments– Debt and Equity Securities (Topic 320) (FSP FAS 115-2 and FAS 124-2,Recognition and Presentation of Other-than-Temporary Impairments),which amends the impairment assessment guidance and recognitionprinciples of other-than-temporary impairment for debt securities andenhances the presentation and disclosure requirements for debt as wellas equity securities. In accordance with this guidance, the unrealized lossof an available-for-sale debt security is an other-than-temporaryimpairment when: (i) the entity has the intent to sell the security; (ii) it ismore likely than not that the entity will be required to sell the securitybefore recovery of the amortized cost; or (iii) the entity does not expect torecover the entire amortized cost of the security (credit loss) even thoughit will not sell the security. If one of the first two conditions is met, the fullamount of the unrealized loss in AOCI should be recognized in income. Ifthese two conditions are not met but the entity has incurred a credit losson the security, the credit loss and the non-credit related loss arerecognized in income and OCI, respectively. This guidance becameeffective for us on May 1, 2009. Upon adoption of the standard, ouropening Retained earnings increased and Accumulated other compre-hensive income decreased by $225 million after taxes.
Other-than-temporary impairment losses of available-for-sale debtsecurities
2009Credit related losses for securities which we do not intend to
sell or more-likely-than-not will not be required to sell $ 102Total losses for securities which we intend to sell or more-
likely-than-not will be required to sell 165Total write-downs of debt securities recognized in income $ 267Add: Non-credit related losses of debt securities recognized
in OCI (before income taxes) (1) 21Total realized and unrealized other-than-temporary
impairment losses (2) $ 288
(1) The balance presented excludes $519 million of gross unrealized gains recorded in OCIrelated to the securities which fair values have recovered above the amortized costssince the initial write-downs.
(2) Represents total write-down and non-credit related losses of other-than-temporarilyimpaired debt securities recognized in income and OCI since May 1, 2009, our adoptiondate of Topic 320.
Cumulative other-than-temporary impairment credit losses ofavailable-for-sale debt securities
2009Credit losses of other-than-temporarily impaired debt
securities upon the adoption of Topic 320 (FSP FAS115-2 and 124-2) as at May 1, 2009 $ 322
Credit losses recognized in income on debt securities notpreviously impaired 64
Credit losses recognized in income on debt securitiesthat have previously been impaired 38
Reductions related to securities that we intend to or it ismore likely than not that we will be required to sellbefore recovery of amortized costs (19)
Reductions due to securities sold or maturedduring the period (4)
Balance at end of the year $ 401
Refer to Note 3 for the methodology and significant inputs used todetermine credit losses.
Subsequent eventsIn May, 2009, the FASB issued guidance under Topic 855-10,Subsequent Events (Topic 855-10) (FASB Statement No. 165,Subsequent Events) which is effective for our October 31, 2009 yearend. Topic 855-10 requires disclosure of the date through which anentity
has evaluated subsequent events and the basis for that date. Wehave evaluated subsequent events up to and including December 3,2009, which is the date that our Board of Directors approved our2009 Annual Consolidated Financial Statements.
Future accounting changesWe are currently assessing the impact of adopting the new accountingstandards described below on our consolidated financial positionand results of operations.
Business combinationsIn December 2007, the FASB replaced the guidance on Topic 805,Business Combinations (FASB Statement No. 141 (revised 2007),
Business Combinations), which replaces FASB Statement No. 141,Business Combinations). The new guidance, which will be effective forus on November 1, 2009, retains the fundamental requirements inoriginal guidance, being the requirement to use the acquisitionmethod of accounting for all business combinations and the identi-fication of an acquirer for each business combination. Significantchanges by the revisions are as follows:• More assets acquired and liabilities assumed to be measured at
fair value as of the acquisition date;
Consolidated Financial Statements Royal Bank of Canada: Annual Report 2009 143
Note 31 Reconciliation of the application of Canadian and United States generally accepted accounting principles (continued)
• All acquisition-related costs must be expensed; and• Non-controlling interest in subsidiaries initially to be measured
at fair value and classified as a separate component of equity.
Accounting for Assets acquired and liabilities assumed in a businesscombination that arise from contingenciesIn April 2009, the FASB issued guidance under Topic 805-20,Business Combinations – Identifiable Assets and Liabilities and AnyNoncontrolling Interest (FSP No. 141 (R)-1, Accounting for assetsacquired and liabilities assumed in a business combination that arisefrom contingencies), which will be effective for us on November 1,2009. This guidance requires an acquirer to measure assets acquiredand liabilities assumed in a business combination that arise fromcontingencies at their acquisition-date fair value if they can bedetermined. If fair value cannot be determined, then the recognitioncriteria and guidance of Topic 450, Contingencies (FASB StatementNo. 5, Accounting for Contingencies) and Topic 450-20, Contingencies– Loss Contingencies (FIN 14, Reasonable Estimation of the Amount ofa Loss, an interpretation of FASB Statement No. 5) apply. Followinginitial recognition, a company shall develop a systematic and rationalbasis for subsequent measurement of liabilities, depending on theirnature.
Non-controlling interestIn December 2007, the FASB issued guidance under Topic 810,Consolidation (FASB Statement No. 160, Non-controlling Interests inConsolidated Financial Statements – an amendment of ARB No. 51),which will be effective for us on November 1, 2009. Significantrequirements include:• Ownership interests in subsidiaries held by parties other than
the parent must be presented separately from the parent’sequity;
• The amount of consolidated net income attributable to theparent and to the non-controlling interest must be clearlyidentified and presented on the consolidated statement ofincome;
• After control is obtained, a change in ownership interests thatdoes not result in a loss of control should be accounted for as anequity transaction; and
• A change in ownership of a consolidated subsidiary that resultsin a loss of control and deconsolidation will trigger recognition ofa gain or loss and any retained non-controlling equity investmentin the former subsidiary will be initially measured at fair value.
Convertible debt instrumentsIn May 2008, the FASB issued guidance under Topic 470-20, Debtwith Conversion and Other Options (FSP APB 14-1, Accounting forConvertible Debt Instruments That May Be Settled in Cash uponConversion (Including Partial Cash Settlement)). This guidanceclarifies that issuers of convertible debt instruments shouldseparately account for the liability and equity components in order toproperly reflect the entity’s borrowing rate that would be applied to anonconvertible debt instrument. The guidance will be effective for uson November 1, 2009.
Accounting for Transfers of Financial Assets and Repurchase FinancingTransactionsIn February, 2008, the FASB issued guidance under Topic 860 (FSPFAS 140-3, Accounting for Transfers of Financial Assets andRepurchase Financing Transactions), which will be effective for us onNovember 1, 2009. This guidance requires that an initial transfer of afinancial asset and a repurchase financing that was entered intocontemporaneously with, or in contemplation of, the initial transfer beevaluated together as a linked transaction unless certain criteria aremet.
Determining Whether an Instrument (or Embedded Feature) is Indexedto an Entity’s Own StockIn June 2008, the FASB issued guidance under Topic 815-40,Derivatives and Hedging – Contracts in Entity’s Own Equity (EITF 07-5,Determining Whether an Instrument (or Embedded Feature) is Indexedto an Entity’s Own Stock), which will be effective for us onNovember 1, 2009. This guidance establishes a two-step process forevaluating whether equity-linked financial instruments andembedded features are indexed to a company’s own stock forpurposes of determining whether the derivative scope exception inTopic 815, Derivatives and Hedging should be applied.
Accounting for Financial Guarantee Insurance ContractsIn May 2008, the FASB issued guidance under Topic 944, FinancialServices – Insurance (FASB Statement No. 163, Accounting forFinancial Guarantee Insurance Contracts – an interpretation of FASBStatement No. 60), which will be effective for us on November 1, 2009.The guidance requires an insurance enterprise to recognize a claimliability prior to an event of default when there is evidence that creditdeterioration has occurred in an insured financial obligation, andclarifies the recognition and measurement of premium revenue andclaim liabilities. It also requires expanded disclosures.
Accounting for an Instrument (or an Embedded Feature) with aSettlement Amount Based on the Stock of an Entity’s ConsolidatedSubsidiaryIn November 2008, the FASB issued guidance under Topic 815(EITF 08-8, Accounting for an Instrument (or an Embedded Feature)with a Settlement Amount that is Based on the Stock of an Entity’sConsolidated Subsidiary), which will be effective for us onNovember 1, 2009. The guidance clarifies whether a financialinstrument for which the payoff to the counterparty is based in wholeor in part on the stock of an entity’s consolidated subsidiary, isindexed to the reporting entity’s own stock, and therefore should notbe precluded from qualifying for the derivatives scope exception.
Equity Method Investment AccountingIn November 2008, the FASB issued guidance under Topic 323,Investments – Equity Method and Joint Ventures (EITF 08-6, EquityMethod Investment Accounting Considerations) which will be effectivefor us on November 1, 2009. The guidance clarifies the accounting forcertain transactions and impairment considerations involving equitymethod investments.
Maintenance Deposits under Lease ArrangementsIn June 2008, the FASB issued guidance under Topic 840, Leases(EITF 08-3, Accounting by Lessees for Maintenance Deposits underLease Arrangements) which will be effective for us on November 1,2009. Guidance is provided on whether a lessee should account formaintenance deposits as a deposit or as contingent rental expense.
Participating SecuritiesIn June 2008, the FASB issued guidance under Topic 260, Earningsper Share (FSP EITF 03-6-1, Determining Whether Instruments Grantedin Share-Based Payment Transactions are Participating Securities)which will be effective for us on November 1, 2009. The guidancedefines unvested share-based payment awards that containnon-forfeitable rights to dividends as participating securities thatshould be included in computing earnings per share using thetwo-class method.
Determining the Useful Life of Intangible AssetsIn April 2008, the FASB issued guidance under Topic 350, Intangibles– Goodwill and Other (FSP FAS 142-3, Determination of the Useful Lifeof Intangible Assets) which will be effective for us on November 1,2009. The guidance amends the factors that should be considered indeveloping renewal or extension assumptions used to determine theuseful life of recognized intangible assets.
144 Royal Bank of Canada: Annual Report 2009 Consolidated Financial Statements

Measuring Liabilities at Fair ValueIn August 2009, the FASB issued ASU 2009-5, Fair Value Measurementsand Disclosures (Topic 820)—Measuring Liabilities at Fair Value, whichwill be effective for us on November 1, 2009. The guidance specifies themethods to be used to fair value a liability where a quoted price in anactive market for an identical liability is unavailable and clarifies that thefair value of a liability can be measured in relation to the quoted price ofthe liability when it trades as an asset in an active market, withoutadjusting the price for restrictions that prevent the sale of the liability.
Investments in Certain Entities that Calculate Net Asset Value PerShareIn September 2009, the FASB issued ASU 2009-12, Fair ValueMeasurements and Disclosures (Topic 820)—Investments in CertainEntities that Calculate Net Asset Value Per Share (or its Equivalent)which will be effective for us on November 1, 2009. This updateprovides guidance on measuring the fair value of certain alternative
investments, and permits entities to use net asset value as a practicalexpedient to measure the fair value of its investments in certaininvestment funds. Additional disclosures are also required regardingthe nature and risk of such investments.
Other changesThe FASB issued guidance under Topic 715 (FSP FAS 132(R)-1,Employers’ Disclosures about Postretirement Benefit Plan Assets)which will be effective for us on October 31, 2010. In addition, thefollowing guidance issued by the FASB will be effective for us onNovember 1, 2010: FASB Statement No. 166, Accounting for Transfersof Financial Assets – an amendment of FASB Statement No. 140, FASBStatement No. 167, Amendments to FASB Interpretation No. 46(R),ASU 2009-15, Accounting for Own-Share Lending Arrangements inContemplation of Convertible Debt Issuance or Other Financing, andASU 2009-13, Multiple-Deliverable Revenue Arrangements.
Note 32 Parent company information
The following table presents information regarding the legal entity of Royal Bank of Canada with its subsidiaries presented on an equityaccounted basis.
Condensed Balance SheetsAs at October 31 2009 2008
AssetsCash and due from banks $ 3,397 $ 3,649Interest-bearing deposits with banks 3,350 11,497Securities 93,441 93,981Investments in bank subsidiaries and associated corporations 27,882 27,661Investments in other subsidiaries and associated corporations 21,153 21,786Assets purchased under reverse repurchase agreements 5,519 5,619Loans, net of allowances for loan losses 225,595 218,449Net balances due from bank subsidiaries 2,690 16,778Net balances due from other subsidiaries 1,718 1,232Other assets 106,737 156,701
$ 491,482 $ 557,353
Liabilities and shareholders’ equityDeposits $ 318,996 $ 351,286Other liabilities 129,120 167,448
448,116 518,734
Subordinated debentures 6,460 7,981Shareholders’ equity 36,906 30,638
$ 491,482 $ 557,353
Condensed Statements of IncomeFor the year ended October 31 2009 2008 2007
Interest income (1) $ 13,824 $ 18,615 $ 17,563Interest expense 6,280 11,302 12,940
Net interest income 7,544 7,313 4,623Non-interest income (2) 4,276 3,882 4,408
Total revenue 11,820 11,195 9,031
Provision for credit losses 2,125 1,116 702Non-interest expense 6,477 5,372 5,905
Income before income taxes 3,218 4,707 2,424Income taxes 180 1,257 454
Net income before equity in undistributed income of subsidiaries 3,038 3,450 1,970Equity in undistributed income of subsidiaries 820 1,105 3,522
Net income $ 3,858 $ 4,555 $ 5,492
(1) Includes dividend income from investments in subsidiaries and associated corporations of $18 million, $415 million and $420 million for 2009, 2008 and 2007, respectively.(2) Includes loss from associated corporations of $7 million for 2009 and income of $4 million and $4 million for 2008 and 2007, respectively.
Consolidated Financial Statements Royal Bank of Canada: Annual Report 2009 145

Note 32 Parent company information (continued)
Condensed Statements of Cash Flows
For the year ended October 31 2009 2008 2007
Cash flows from operating activitiesNet income $ 3,858 $ 4,555 $ 5,492Adjustments to determine net cash from operating activities:
Change in undistributed earnings of subsidiaries (820) (1,105) (3,522)Other operating activities, net 10,795 (5,091) 9,741
Net cash from (used in) operating activities 13,833 (1,641) 11,711
Cash flows from investing activitiesChange in interest-bearing deposits with banks 8,147 (6,343) (2,234)Change in loans, net of loan securitizations (33,651) (44,567) (43,229)Proceeds from loan securitizations 21,494 9,480 8,117Proceeds from sale of available-for-sale securities 9,143 5,221 2,438Proceeds from maturity of available-for-sale securities 7,239 6,060 4,891Purchase of available-for-sale securities (13,346) (11,743) (6,739)Net acquisitions of premises and equipment (439) (616) (481)Change in assets purchased under reverse repurchase agreements and securities borrowed 100 4,990 (1,388)Change in cash invested in subsidiaries 497 (6,055) (2,101)Change in net funding provided to subsidiaries 13,236 9,436 8,062
Net cash from (used in) investing activities 12,420 (34,137) (32,664)
Cash flows from financing activitiesChange in deposits (32,290) 45,163 20,225Issue of subordinated debentures – 2,000 87Repayment of subordinated debentures (1,659) (500) (989)Issue of preferred shares 2,150 613 1,150Redemption of preferred shares for cancellation – (300) (150)Issuance costs (77) (11) (23)Issue of common shares 2,439 149 155Purchase of common shares for cancellation – (55) (646)Sale of treasury shares 72 74 208Purchase of treasury shares (60) (76) (133)Dividends paid (2,744) (2,688) (2,278)Change in obligations related to assets sold under repurchase agreements and securities loaned 2,649 3,541 (553)Change in obligations related to securities sold short 3,015 (11,475) 3,968
Net cash (used in) from financing activities (26,505) 36,435 21,021
Net change in cash and due from banks (252) 657 68Cash and due from banks at beginning of year 3,649 2,992 2,924
Cash and due from banks at end of year $ 3,397 $ 3,649 $ 2,992
Supplemental disclosure of cash flow informationAmount of interest paid in year $ 7,565 $ 11,524 $ 13,061Amount of income taxes (recovered) paid in year $ (947)$ 1,052 $ (165)
Note 33 Subsequent Event
As discussed in Note 25, Royal Bank of Canada and certain relatedentities were defendants in a class action brought by the Regents ofthe University of California which was consolidated with the leadaction entitled Newby v Enron Corp., which was the mainconsolidated purported Enron shareholder class action. This class
action against Royal Bank of Canada and certain related entities wasdismissed with prejudice on December 2, 2009. We are evaluatingthe $60 million (US$50 million) provision that we had established inlight of this development for possible adjustment in the first quarterof 2010.
146 Royal Bank of Canada: Annual Report 2009 Consolidated Financial Statements

Glossary
AcceptancesA bill of exchange or negotiable instrument drawnby the borrower for payment at maturity andaccepted by a bank. The acceptance constitutes aguarantee of payment by the bank and can betraded in the money market. The bank earns a“stamping fee” for providing this guarantee.
Allowance for credit lossesThe amount deemed adequate by managementto absorb identified credit losses as well aslosses that have been incurred but are not yetidentifiable as at the balance sheet date.
Alt-A assetsA term used in the U.S. to describe assets(mainly mortgages) with a borrower risk profilebetween the prime and subprime catego-rizations. Categorization of assets as Alt-A (asopposed to prime) varies, such as limitedverification or documentation of borrowers’income or a limited credit history.
Asset-backed securities (ABS)Securities created through the securitization ofa pool of assets, for example auto loans orcredit card loans.
Assets-to-capital multipleTotal assets plus specified off balance sheetitems, as defined by OSFI, divided by totalregulatory capital.
Assets under administration (AUA)Assets administered by us, which are benefi-cially owned by clients, as at October 31,unless otherwise noted. Services provided inrespect of assets under administration are ofan administrative nature, includingsafekeeping, collecting investment income,settling purchase and sale transactions, andrecord keeping.
Assets under management (AUM)Assets managed by us, which are beneficiallyowned by clients, as at October 31, unlessotherwise noted. Services provided in respectof assets under management include theselection of investments and the provision ofinvestment advice. We have assets undermanagement that are also administered by usand included in assets under administration.
Auction rate securities (ARS)Securities issued through variable interestentity (VIE) trusts that hold long-term assetsfunded with long-term debt, with an interestrate reset every week to 35 days via auctionsmanaged by participating financial institutions.
Bank-owned life insurance contracts (BOLI)Our U.S. Insurance and Pension solutionsbusiness provides banks with BOLI stable valueagreements (“wraps”) which insure the lifeinsurance policy’s cash surrender value frommarket fluctuations on the underlyinginvestments, thereby guaranteeing a minimumtax-exempt return to the counterparty.
Basis point (bp)One one-hundredth of a percentage point(.01%).
Canadian GAAPCanadian generally accepted accountingprinciples.
Capital adequacyThe level of capital that is sufficient to underpinrisk and accommodate potential unexpectedincreases in risk within specified regulatorytargets while maintaining our business plans.This includes risks for which minimum regulatorycapital requirements may not be specified.
Capital positionQuantifies the extent to which illiquid assets arefunded by non-core liabilities and represents aformula-based measure of both comparativeand directional structural liquidity risk.
Cash capital positionQuantifies the extent to which illiquid (longterm) assets are funded by short-term liabilitiesand represents a formula-based measure ofboth comparative and directional structuralliquidity risk.
CollateralAssets pledged as security for a loan or otherobligation. Collateral can take many forms,such as cash, highly rated securities, property,inventory, equipment, receivables.
Collateralized debt obligation (CDO)An investment grade security that is backed bya pool of bonds, loans and/or any other type ofdebt instrument.
Collateralized loan obligation (CLO)Securities which are backed by a pool ofcommercial or personal loans, structured sothat there are several classes of bondholderswith varying maturities, called tranches.
Commercial mortgage-backed securities(CMBS)Securities created through the securitization ofcommercial mortgages.
Commitments to extend creditUnutilized amount of credit facilities available toclients either in the form of loans, bankers’acceptances and other on-balance sheetfinancing, or through off-balance sheet productssuch as guarantees and letters of credit.
Covered bondsFull recourse on-balance sheet obligationsissued by banks and credit institutions that arealso fully collateralized by assets over whichinvestors enjoy a priority claim in the event ofan issuer’s insolvency.
Credit default swaps (CDS)A derivative contract that provides thepurchaser with a one-time payment should thereferenced entity/entities default (or a similartriggering event occur).
DerivativeA contract between two parties, which requireslittle or no initial investment and wherepayments between the parties are dependentupon the movements in price of an underlyinginstrument, index or financial rate. The notionalamount of the derivative is the contract amountused as a reference point to calculate thepayments to be exchanged between the twoparties, and the notional amount itself isgenerally not exchanged by the parties.
Dividend payout ratioCommon dividends as a percentage of netincome after preferred share dividends.
Dividend yieldDividends per common share divided by theaverage of the high and low share prices in therelevant period.
Documentary and commercial letters of creditWritten undertakings by a bank on behalf of itsclient (typically an importer), authorizing a thirdparty (typically an exporter) to draw drafts onthe bank up to a stipulated amount underspecific terms and conditions. Such under-takings are established for the purpose offacilitating international trade.
Earnings per share (EPS), basicCalculated as net income less preferred sharedividends divided by the average number ofshares outstanding.
Earnings per share (EPS), dilutedCalculated as net income less preferred sharedividends divided by the average number ofshares outstanding adjusted for the dilutiveeffects of stock options and other convertiblesecurities.
Economic CapitalAn estimate of the amount of equity capitalrequired to underpin risks. It is calculated byestimating the level of capital that is necessaryto support our various businesses, given theirrisks, consistent with our desired solvencystandard and credit ratings.
Embedded valueEmbedded value is a measure of theshareholder value embedded in the balancesheet of our Insurance segment, excluding anyvalue associated from future new sales. Thechange in embedded value between reportingperiods is used by management as a measureof the value created by the operations duringthe year. The value of in-force business is thepresent value of future expected earnings on in-force business less the present value of capitalrequired to support in-force business.
Fair valueThe amount of consideration that would beagreed upon in an arm’s length transactionbetween knowledgeable, willing parties whoare under no compulsion to act.
Fair value adjustments on certain RBC debtdesignated as held-for-tradingThe change in fair value of deposit liabilitiesand subordinated debentures designated asheld-for-trading, largely as a result of thewidening/(tightening) of our credit spreads, isdefined as fair value adjustments on RBC debtdesignated as held-for-trading.
Gross adjusted assets (GAA)GAA are used in the calculation of theAssets-to-capital multiple. They represent ourtotal assets including specified off-balancesheet items and net of prescribed deductions.
Guarantees and letters of creditPrimarily represent irrevocable assurances thata bank will make payments in the event that itsclient cannot meet its financial obligations tothird parties.
HedgeA risk management technique used to insulatefinancial results from market, interest rate orforeign currency exchange risk (exposure)
Glossary Royal Bank of Canada: Annual Report 2009 147

arising from normal banking operations. Theelimination or reduction of such exposure isaccomplished by establishing offsettingpositions.
Hedge fundsA type of investment fund, marketed to wealthyindividuals and institutions, that is subject tolimited regulation and restrictions on itsinvestments compared to retail mutual funds,and that often utilize aggressive strategiessuch as selling short, leverage, programtrading, swaps, arbitrage and derivatives.
Impaired loansLoans are classified as impaired when there hasbeen a deterioration of credit quality to the extentthat management no longer has reasonableassurance of timely collection of the full amountof principal and interest in accordance with thecontractual terms of the loan agreement. Creditcard balances are not classified as impaired asthey are directly written off after payments are180 days past due.
Innovative capital instrumentsInnovative capital instruments are capitalinstruments issued by Special Purpose Entities(SPEs), whose primary purpose is to raisecapital.
Master netting agreementAn agreement between us and a counterpartydesigned to reduce the credit risk of multiplederivative transactions through the creation ofa legal right of offset of exposure in the event ofa default.
Monoline insurerInsurance companies that specialize infinancial guaranty insurance products,predominantly for the municipal bond marketin the U.S. and structured finance products,such as CDOs.
Net interest incomeThe difference between what is earned onassets such as loans and securities and what ispaid on liabilities such as deposits andsubordinated debentures.
Net interest margin (average assets)Net interest income as a percentage of totalaverage assets.
Net interest margin (average earning assets)Net interest income as a percentage of totalaverage earning assets.
Normal course issuer bid (NCIB)A program for the repurchase of our ownshares, for cancellation, through a stockexchange that is subject to the various rules ofthe relevant stock exchange and securitiescommission.
Off-balance sheet financial instrumentsA variety of arrangements offered to clients,which include credit derivatives, written putoptions, backstop liquidity facilities, stablevalue products, financial standby letters ofcredit, performance guarantees, creditenhancements, mortgage loans sold withrecourse, commitments to extend credit,securities lending, documentary andcommercial letters of credit, note issuancesand revolving underwriting facilities, securitieslending indemnifications and otherindemnifications.
Office of the Superintendent of FinancialInstitutions Canada (OSFI)The primary regulator of federally charteredfinancial institutions and federallyadministered pension plans in Canada. OSFI’smission is to safeguard policyholders,depositors and pension plan members fromundue loss.
OptionsA contract or a provision of a contract that givesone party (the option holder) the right, but notthe obligation, to perform a specified trans-action with another party (the option issuer oroption writer) according to specified terms.
Provision for credit lossesThe amount charged to income necessary tobring the allowance for credit losses, includingspecific and general to a level determinedappropriate by management.
Repurchase agreementsInvolve the sale of securities for cash at a nearvalue date and the simultaneous repurchase ofthe securities for value at a later date.
Residential mortgage-backed securities(RMBS)Securities created through the securitization ofresidential mortgage loans.
Return on common equity (ROE)Net income less preferred share dividends,expressed as a percentage of average commonequity.
Reverse repurchase agreementsInvolve the purchase of securities for cash at anear value date and the simultaneous sale ofthe securities for value at a later date.
RiskFinancial institutions face a number of differentrisks that expose them to possible lossesincluding credit risk, market risk, operationalrisk, liquidity and funding risk, reputation risk,regulatory and legal risk, insurance risk,strategic risk, competitive risk and systemicrisk.
Risk-adjusted assets (RAA) – Basel IIUsed in the calculation of risk-based capitalratios as defined by guidelines issued by OSFIbased on Basel II, effective November 1, 2007.
Securities lendingTransactions in which the owner of a securityagrees to lend it under the terms of aprearranged contract to a borrower for a fee.The borrower must collateralize the securityloan at all times. There are two types ofsecurities lending arrangements: lending withand without credit or market riskindemnification.
Securities sold shortA transaction in which the seller sells securitiesand then borrows the securities in order todeliver them to the purchaser upon settlement.At a later date, the seller buys identicalsecurities in the market to replace theborrowed securities.
SecuritizationThe process by which various financial assetsare packaged into newly issued securitiesbacked by these assets.
Special purpose entities (SPEs)SPEs are principally used to securitize financialand other assets in order to obtain access tofunding, to mitigate credit risk and to managecapital.
Standardized ApproachRisk weights prescribed by OSFI are used tocalculate risk-weighted assets for the credit riskexposures.
Structured investment vehiclesManaged investment vehicle that holds mainlyhighly rated asset-backed securities and fundsitself using the short-term commercial papermarket as well as the medium-term note (MTN)market.
Subprime loansSubprime lending is the practice of makingloans to borrowers who do not qualify for thebest market interest rates because of theirdeficient credit history. Subprime lendingcarries more risk for lenders due to thecombination of higher interest rates for theborrowers, poorer credit histories, and adversefinancial situations usually associated withsubprime applicants.
Super senior tranches of structured credittransactionsRepresents the most senior class of commercialpaper or notes that are issued in structuredcredit transactions. These financial instrumentsbenefit from the subordination of all othersecurities, issued by structured credit vehicles.
Survival horizonMeasures the length of time over which RBCwould have sufficient funds to repay itsmaturing liabilities and finance off-balancesheet commitments if access to wholesaleunsecured funding suddenly becameunavailable and liquid assets, excluding anyportion of mortgages and loans, weremonetized.
Synthetic securitizationThe transfer of risks relating to selectedelements of our financial assets to unaffiliatedthird parties through the use of certain financialinstruments such as credit default swaps andguarantees.
Taxable equivalent basis (teb)Income from certain specified tax advantagedsources is increased to a level that would makeit comparable to income from taxable sources.There is an offsetting adjustment in the taxprovision, thereby generating the sameafter-tax net income.
Tier 1 capital and Tier 1 capital ratioTier 1 capital consists of more permanentcomponents of capital, is free of mandatoryfixed charges against earnings and has asubordinate legal position to the rights ofdepositors and other creditors of the financialinstitution. The Tier 1 capital ratio is calculatedby dividing the adjusted net Tier 1 capital byrisk-adjusted assets.
Tier 2 capitalTier 2 capital is composed of supplementarycapital instruments that contribute to theoverall strength of a financial institution as agoing concern.
Total capitalTotal capital is defined as the total of net Tier 1and Tier 2 capital.
TrancheA security class created by a process used instructured finance whereby the risks andreturns associated with a pool of assets ispackaged into several classes of securities
148 Royal Bank of Canada: Annual Report 2009 Glossary

offering different risk and return profiles fromthose of the underlying asset pool.
U.S. GAAPU.S. generally accepted accounting principles.
Value-at-Risk (VaR)A generally accepted risk-measurementconcept that uses statistical models based on
historical information to estimate within a givenlevel of confidence the maximum loss in marketvalue we would experience in our tradingportfolio from an adverse one-day movement inmarket rates and prices.
Variable interest entity (VIE)An entity which either does not have sufficientequity at risk to finance its activities without
additional subordinated financial support, orwhere the holders of the equity at risk lack thecharacteristics of a controlling financialinterest.
Glossary Royal Bank of Canada: Annual Report 2009 149

Directors and executive officers
Directors
W. Geoffrey Beattie (2001)Toronto, OntarioPresident and Chief ExecutiveOfficerThe Woodbridge CompanyLimitedDeputy ChairmanThomson Reuters Corporation
Douglas T. Elix, A.O. (2000)Ridgefield, ConnecticutCorporate Director
John T. Ferguson, F.C.A. (1990)Edmonton, AlbertaChairman and Chief ExecutiveOfficerPrinceton Developments Ltd.Princeton Ventures Ltd.
The Hon. Paule Gauthier,P.C., O.C., O.Q., Q.C. (1991)Quebec, QuebecSenior PartnerStein Monast L.L.P.
Timothy J. Hearn (2006)Calgary, AlbertaChairmanHearn & Associates
Alice D. Laberge (2005)Vancouver, British ColumbiaCorporate Director
Jacques Lamarre, O.C. (2003)Montreal, QuebecCorporate Director
Brandt C. Louie, O.B.C., F.C.A.(2001)West Vancouver,British ColumbiaChairman and Chief ExecutiveOfficerH.Y. Louie Co. LimitedChairmanLondon Drugs Limited
Michael H. McCain (2005)Toronto, OntarioPresident and Chief ExecutiveOfficerMaple Leaf Foods, Inc.
Gordon M. Nixon (2001)Toronto, OntarioPresident and Chief ExecutiveOfficerRoyal Bank of Canada
David P. O'Brien, O.C. (1996)Calgary, AlbertaChairman of the BoardRoyal Bank of CanadaChairman of the BoardEnCana Corporation
J. Pedro Reinhard (2000)Key Biscayne, FloridaPresidentReinhard & Associates
Edward Sonshine (2008)Toronto, OntarioPresident and Chief ExecutiveOfficerRioCan Real EstateInvestment Trust
Kathleen P. Taylor (2001)Toronto, OntarioPresident and Chief OperatingOfficerFour Seasons Hotels andResorts
Victor L. Young, O.C. (1991)St. John's, Newfoundland andLabradorCorporate Director
The date appearing after the name of each
director indicates the year in which the
individual became a director.
Group Executive
Morten N. FriisChief Risk Officer
Janice R. FukakusaChief Administrative Officer andChief Financial Officer
M. George LewisGroup HeadWealth Management
A. Douglas McGregorCo-Group HeadCapital Markets
David I. McKayGroup HeadCanadian Banking
Gordon M. NixonPresident andChief Executive Officer
Mark A. StandishCo-Group HeadCapital Markets
Barbara G. StymiestGroup HeadStrategy, Treasury andCorporate Services
W. James WestlakeGroup HeadInternational Banking andInsurance
150 Royal Bank of Canada: Annual Report 2009 Directors and executive officers
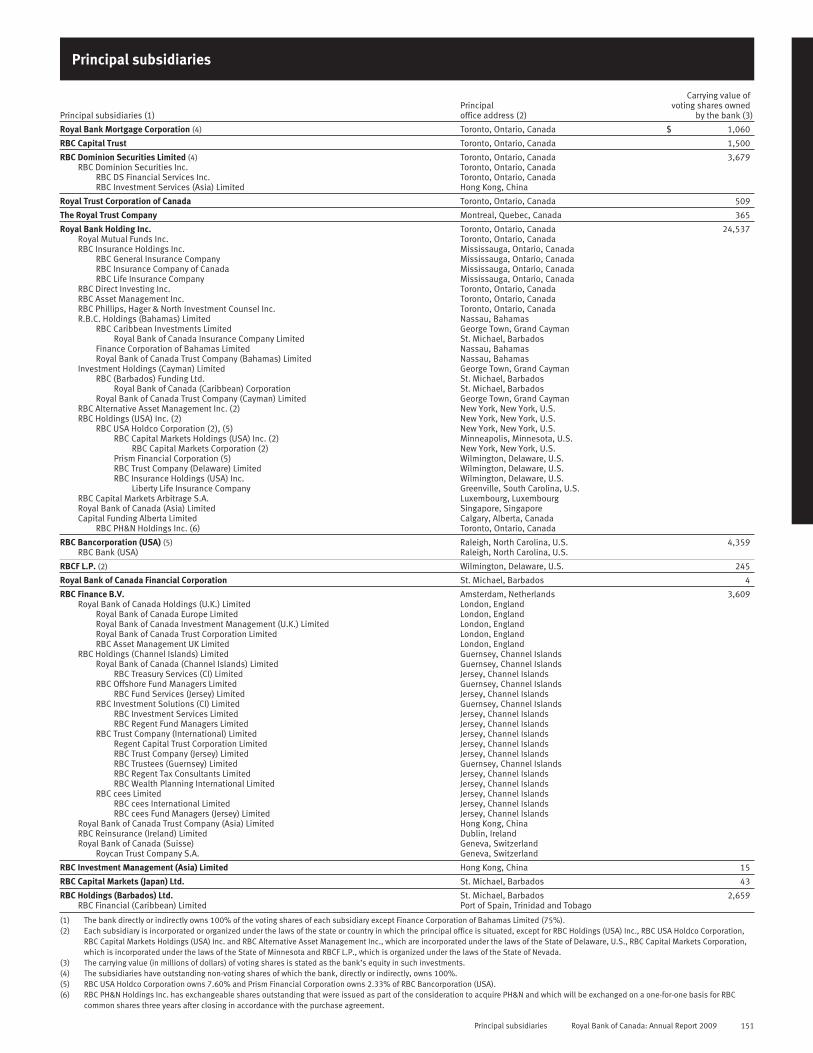
Principal subsidiaries
Principal subsidiaries (1)Principaloffice address (2)
Carrying value ofvoting shares owned
by the bank (3)
Royal Bank Mortgage Corporation (4) Toronto, Ontario, Canada $ 1,060
RBC Capital Trust Toronto, Ontario, Canada 1,500
RBC Dominion Securities Limited (4) Toronto, Ontario, Canada 3,679RBC Dominion Securities Inc. Toronto, Ontario, Canada
RBC DS Financial Services Inc. Toronto, Ontario, CanadaRBC Investment Services (Asia) Limited Hong Kong, China
Royal Trust Corporation of Canada Toronto, Ontario, Canada 509
The Royal Trust Company Montreal, Quebec, Canada 365
Royal Bank Holding Inc. Toronto, Ontario, Canada 24,537Royal Mutual Funds Inc. Toronto, Ontario, CanadaRBC Insurance Holdings Inc. Mississauga, Ontario, Canada
RBC General Insurance Company Mississauga, Ontario, CanadaRBC Insurance Company of Canada Mississauga, Ontario, CanadaRBC Life Insurance Company Mississauga, Ontario, Canada
RBC Direct Investing Inc. Toronto, Ontario, CanadaRBC Asset Management Inc. Toronto, Ontario, CanadaRBC Phillips, Hager & North Investment Counsel Inc. Toronto, Ontario, CanadaR.B.C. Holdings (Bahamas) Limited Nassau, Bahamas
RBC Caribbean Investments Limited George Town, Grand CaymanRoyal Bank of Canada Insurance Company Limited St. Michael, Barbados
Finance Corporation of Bahamas Limited Nassau, BahamasRoyal Bank of Canada Trust Company (Bahamas) Limited Nassau, Bahamas
Investment Holdings (Cayman) Limited George Town, Grand CaymanRBC (Barbados) Funding Ltd. St. Michael, Barbados
Royal Bank of Canada (Caribbean) Corporation St. Michael, BarbadosRoyal Bank of Canada Trust Company (Cayman) Limited George Town, Grand Cayman
RBC Alternative Asset Management Inc. (2) New York, New York, U.S.RBC Holdings (USA) Inc. (2) New York, New York, U.S.
RBC USA Holdco Corporation (2), (5) New York, New York, U.S.RBC Capital Markets Holdings (USA) Inc. (2) Minneapolis, Minnesota, U.S.
RBC Capital Markets Corporation (2) New York, New York, U.S.Prism Financial Corporation (5) Wilmington, Delaware, U.S.RBC Trust Company (Delaware) Limited Wilmington, Delaware, U.S.RBC Insurance Holdings (USA) Inc. Wilmington, Delaware, U.S.
Liberty Life Insurance Company Greenville, South Carolina, U.S.RBC Capital Markets Arbitrage S.A. Luxembourg, LuxembourgRoyal Bank of Canada (Asia) Limited Singapore, SingaporeCapital Funding Alberta Limited Calgary, Alberta, Canada
RBC PH&N Holdings Inc. (6) Toronto, Ontario, Canada
RBC Bancorporation (USA) (5) Raleigh, North Carolina, U.S. 4,359RBC Bank (USA) Raleigh, North Carolina, U.S.
RBCF L.P. (2) Wilmington, Delaware, U.S. 245
Royal Bank of Canada Financial Corporation St. Michael, Barbados 4
RBC Finance B.V. Amsterdam, Netherlands 3,609Royal Bank of Canada Holdings (U.K.) Limited London, England
Royal Bank of Canada Europe Limited London, EnglandRoyal Bank of Canada Investment Management (U.K.) Limited London, EnglandRoyal Bank of Canada Trust Corporation Limited London, EnglandRBC Asset Management UK Limited London, England
RBC Holdings (Channel Islands) Limited Guernsey, Channel IslandsRoyal Bank of Canada (Channel Islands) Limited Guernsey, Channel Islands
RBC Treasury Services (CI) Limited Jersey, Channel IslandsRBC Offshore Fund Managers Limited Guernsey, Channel Islands
RBC Fund Services (Jersey) Limited Jersey, Channel IslandsRBC Investment Solutions (CI) Limited Guernsey, Channel Islands
RBC Investment Services Limited Jersey, Channel IslandsRBC Regent Fund Managers Limited Jersey, Channel Islands
RBC Trust Company (International) Limited Jersey, Channel IslandsRegent Capital Trust Corporation Limited Jersey, Channel IslandsRBC Trust Company (Jersey) Limited Jersey, Channel IslandsRBC Trustees (Guernsey) Limited Guernsey, Channel IslandsRBC Regent Tax Consultants Limited Jersey, Channel IslandsRBC Wealth Planning International Limited Jersey, Channel Islands
RBC cees Limited Jersey, Channel IslandsRBC cees International Limited Jersey, Channel IslandsRBC cees Fund Managers (Jersey) Limited Jersey, Channel Islands
Royal Bank of Canada Trust Company (Asia) Limited Hong Kong, ChinaRBC Reinsurance (Ireland) Limited Dublin, IrelandRoyal Bank of Canada (Suisse) Geneva, Switzerland
Roycan Trust Company S.A. Geneva, Switzerland
RBC Investment Management (Asia) Limited Hong Kong, China 15
RBC Capital Markets (Japan) Ltd. St. Michael, Barbados 43
RBC Holdings (Barbados) Ltd. St. Michael, Barbados 2,659RBC Financial (Caribbean) Limited Port of Spain, Trinidad and Tobago
(1) The bank directly or indirectly owns 100% of the voting shares of each subsidiary except Finance Corporation of Bahamas Limited (75%).(2) Each subsidiary is incorporated or organized under the laws of the state or country in which the principal office is situated, except for RBC Holdings (USA) Inc., RBC USA Holdco Corporation,
RBC Capital Markets Holdings (USA) Inc. and RBC Alternative Asset Management Inc., which are incorporated under the laws of the State of Delaware, U.S., RBC Capital Markets Corporation,which is incorporated under the laws of the State of Minnesota and RBCF L.P., which is organized under the laws of the State of Nevada.
(3) The carrying value (in millions of dollars) of voting shares is stated as the bank’s equity in such investments.(4) The subsidiaries have outstanding non-voting shares of which the bank, directly or indirectly, owns 100%.(5) RBC USA Holdco Corporation owns 7.60% and Prism Financial Corporation owns 2.33% of RBC Bancorporation (USA).(6) RBC PH&N Holdings Inc. has exchangeable shares outstanding that were issued as part of the consideration to acquire PH&N and which will be exchanged on a one-for-one basis for RBC
common shares three years after closing in accordance with the purchase agreement.
Principal subsidiaries Royal Bank of Canada: Annual Report 2009 151

Shareholder information
Corporate headquartersStreet address:Royal Bank of Canada200 Bay StreetToronto, Ontario M5J 2J5CanadaTel: 416-974-5151Fax: 416-955-7800
Mailing address:P.O. Box 1Royal Bank PlazaToronto, Ontario M5J 2J5Canada
website: rbc.com
Transfer Agent and RegistrarMain Agent:Computershare Trust Company ofCanada1500 University StreetSuite 700Montreal, Quebec H3A 3S8CanadaTel: 1-866-586-7635 (Canadaand the U.S.)or 514-982-7555 (International)Fax: 514-982-7580website: computershare.com\rbc
Co-Transfer Agent (U.S.):Computershare TrustCompany, N.A.250 Royall StreetCanton, Massachusetts 02021U.S.
Co-Transfer Agent (UnitedKingdom):Computershare Investor ServicesPLCSecurities Services – RegistrarsP.O. Box 82, The Pavilions,Bridgwater Road,Bristol BS99 7NHU.K.
Stock exchange listings(Symbol: RY)
Common shares are listed on:Canada – Toronto StockExchange (TSX)U.S. – New York StockExchange (NYSE)Switzerland – SwissExchange (SIX)
All preferred shares are listed onthe TSX.
Valuation Day priceFor Canadian capital gains taxpurposes, the Valuation Day(December 22, 1971) cost basefor our common shares is $7.38per share. This amount has beenadjusted to reflect thetwo-for-one share split of March1981 and the two-for-one sharesplit of February 1990. Theone-for-one share dividends paidin October 2000 and April 2006did not affect the Valuation Dayvalue for our common shares.
Shareholder contactsFor dividend information, changein share registration or address,lost stock certificates, tax forms,estate transfers or dividendreinvestment, please contact:Computershare Trust Company ofCanada100 University Avenue, 9th FloorToronto, Ontario M5J 2Y1CanadaTel: 1-866-586-7635 (Canadaand the U.S.) or 514-982-7555(International)Fax: 1-888-453-0330 (Canadaand the U.S.) or 416-263-9394(International)e-mail:[email protected]
For other shareholder inquiries,please contact:Shareholder RelationsRoyal Bank of Canada200 Bay Street9th Floor, South TowerToronto, Ontario M5J 2J5CanadaTel: 416-955-7806Fax: 416-974-3535
For financial informationinquiries, please contact:Investor RelationsRoyal Bank of Canada200 Bay Street4th Floor, North TowerToronto, Ontario M5J 2W7CanadaTel: 416-955-7802Fax: 416-955-7800or visit our website atrbc.com/investorrelations
Direct deposit serviceShareholders in Canada and theU.S. may have their RBC commonshare dividends depositeddirectly to their bank account byelectronic funds transfer. Toarrange for this service, pleasecontact our Transfer Agent andRegistrar, Computershare TrustCompany of Canada.
Eligible dividend designationFor purposes of the enhanceddividend tax credit rulescontained in the Income Tax Act(Canada) and any correspondingprovincial and territorial taxlegislation, all dividends (anddeemed dividends) paid by us toCanadian residents on ourcommon and preferred sharesafter December 31, 2005, aredesignated as “eligibledividends.” Unless statedotherwise, all dividends (anddeemed dividends) paid by ushereafter are designated as“eligible dividends” for thepurposes of such rules.
Common share repurchasesWe are engaged in a NormalCourse Issuer Bid (NCIB) throughthe facilities of the TSX. Duringthe one-year period commencingNovember 1, 2009, we mayrepurchase for cancellation, up to20 million common shares in theopen market at market prices. Wedetermine the amount and timingof the purchases under the NCIB,subject to prior consultation withthe Office of the Superintendentof Financial Institutions Canada(OSFI).
A copy of our Notice of Intentionto file a NCIB may be obtained,without charge, by contacting ourCorporate Secretary at ourToronto mailing address.
2010 Annual MeetingThe Annual Meeting of CommonShareholders will be held onWednesday, March 3, 2010 at9:00 a.m. (Eastern StandardTime) at the Metro TorontoConvention Centre, NorthBuilding, 255 Front Street West,Toronto, Ontario, Canada.
2010 Quarterly earnings releasedatesFirst quarter March 3Second quarter May 27Third quarter August 26Fourth quarter December 3
Dividend dates for 2010Subject to approval by the Board of Directors
Ex-dividenddates
Recorddates
Paymentdates
Common and preferredshares series W, AA, AB, AC,AD, AE, AF, AG, AH, AJ,AL, AN, AP, AR, AT, AV and AX
January 22April 20July 22October 22
January 26April 22July 26October 26
February 24May 21August 24November 24
GovernanceA summary of the significant ways in which corporate governancepractices followed by RBC differ from corporate governance practicesrequired to be followed by U.S. domestic companies under the NewYork Stock Exchange listing standards is available on our website atrbc.com/governance.
EQUAL EMPLOYMENT OPPORTUNITY: As required by our Code of Conduct, which applies to all Royal Bank of Canada companies and applies equally to employees, we are committed to providingequal opportunity in all dealings with employees, clients, suppliers and others. In the U.S., our subsidiaries are committed to providing Equal Employment Opportunity in compliance with relevantU.S. federal legislation and regulations (EEO rules) to all employees and applicants for employment. Consistent with this commitment, all employment decisions of our U.S. subsidiaries are basedupon skill and performance without regard to race, colour, national origin or ancestry, religion, age, disability, gender, sexual orientation, status as a veteran or any other factors or characteristicsprotected by law. Our U.S. subsidiaries are Equal Opportunity Employers and comply with U.S. federal, state and municipal employment laws, including regulations applicable to federal contractors.Disclosure in our 2009 Annual Report to Shareholders about our U.S. subsidiaries’ Equal Employment Opportunity practices is required pursuant to EEO rules.
Information contained in or otherwise accessible through the websites mentioned in this report to shareholders does not form a part of this report. All references to websites are inactive textualreferences and are for your information only.
Trademarks used in this report include the LION & GLOBE Symbol, ROYAL BANK OF CANADA, RBC, RBC CAPITAL TRUST, RBC DIRECT INVESTING, RBC INTERNATIONAL REMITTANCE, RBC REWARDS, RBCSUBORDINATED NOTES TRUST, RBC TSNs, RBC TruCS and RBC WEALTH MANAGEMENT which are trademarks of Royal Bank of Canada used by Royal Bank of Canada and/or by its subsidiaries underlicense. All other trademarks mentioned in this report, which are not the property of Royal Bank of Canada, are owned by their respective holders. RBC Dexia IS and affiliated Dexia companies arelicensed users of the RBC trademark.
152 Royal Bank of Canada: Annual Report 2009 Shareholder Information

®Registered trademark of Royal Bank of Canada.