route 6 safety traffic flow study - cape … · cape cod com mission 3225 main street p.o. box 226...
TRANSCRIPT

CAPE COD COMMISSION 3225 MAIN STREET
P.O. BOX 226 BARNSTABLE, MA 02630
(508) 362-3828 Fax (508) 362-3136
ROUTE 6 SAFETY & TRAFFIC FLOW STUDY
EASTHAM • WELLFLEET • TRURO • PROVINCETOWN
Cape Cod Commission Transportation Staff • March 2004 Prepared in Cooperation with the Executive Office of Transportation and Construction,
the Massachusetts Highway Department, and the U.S. Department of Transportation, Federal Highway Administration


Table of Contents
EXECUTIVE SUMMARY .......................................................................................................................... 5 1. INTRODUCTION................................................................................................................... 9
1.1 PROJECT GOALS ........................................................................................................................... 9 1.2 STUDY AREA................................................................................................................................ 9
1.2.1 Population .............................................................................................................................. 9 1.2.2 Regional Policy Plan and Local Comprehensive Plans ....................................................... 12 1.2.3 Travel and Transportation Alternatives ............................................................................... 13
1.3 STUDY CRITERIA........................................................................................................................ 14 1.3.1 Traffic Flow .......................................................................................................................... 14 1.3.2 Safety .................................................................................................................................... 15
2. EXISTING CONDITIONS .................................................................................................. 17 2.1 TRAFFIC VOLUMES..................................................................................................................... 17 2.2 TRAVEL TIMES ........................................................................................................................... 18 2.3 CRASH HISTORY......................................................................................................................... 19
2.3.1 Detailed Analysis of Accident Reports.................................................................................. 27 2.3.2 Intersection Safety ................................................................................................................ 29 2.3.3 Examination of 1st Tier Priority Intersections ...................................................................... 30
2.4 COMMUNITY IMPACTS ............................................................................................................... 35 2.5 NATIONAL SEASHORE VISITATION............................................................................................. 35 2.6 SIGNAL WARRANT ANALYSIS .................................................................................................... 36 2.7 PEDESTRIAN ENVIRONMENT ...................................................................................................... 37
3. ALTERNATIVES ANALYSIS ............................................................................................ 39 3.1 CURRENTLY PLANNED IMPROVEMENTS ..................................................................................... 39 3.2 TRAFFIC FLOW MODELING......................................................................................................... 39 3.3 ALTERNATIVE A – MULTIPLE INTERSECTION IMPROVEMENTS................................................... 43 3.4 ALTERNATIVE B – MULTIPLE INTERSECTION IMPROVEMENTS PLUS SIGNALIZING GOVERNOR
PRENCE ROAD ......................................................................................................................... 46 3.5 ALTERNATIVE C – MULTIPLE INTERSECTION IMPROVEMENTS PLUS ONE LANE/TURNING LANES
IN SOUTH EASTHAM ................................................................................................................. 46 3.6 ALTERNATIVE D –CENTER BARRIER.......................................................................................... 47 3.7 INTELLIGENT TRANSPORTATION SYSTEMS................................................................................. 48 3.8 PUBLIC TRANSIT ........................................................................................................................ 49 3.9 ROUTE 6 BYPASS........................................................................................................................ 49 3.10 ONE LANE ROUTE 6 ................................................................................................................... 50
4. COMPARISON & EVALUATION..................................................................................... 51 4.1 TRAFFIC FLOW ........................................................................................................................... 51 4.2 SAFETY IMPROVEMENT .............................................................................................................. 55 4.3 COSTS ........................................................................................................................................ 55 4.4 EVALUATION MATRIX................................................................................................................ 56
5. CONCLUSIONS & RECOMMENDATIONS ................................................................... 57 5.1 THE 3 E’S: EDUCATION, ENFORCEMENT, AND ENGINEERING..................................................... 57
5.1.1 Education.............................................................................................................................. 57 5.1.2 Enforcement.......................................................................................................................... 57 5.1.3 Engineering .......................................................................................................................... 58
5.2 RECOMMENDATIONS FOR SELECTED INTERSECTIONS & ROTARY .............................................. 58 5.2.1 Samoset Road: Eastham - [priority intersection] ............................................................... 58 5.2.2 Massasoit Road: Eastham .................................................................................................... 58 5.2.3 Brackett Road: Eastham - [priority intersection]............................................................... 58
Route 6 Outer Cape Traffic Flow & Safety Study Page 1

5.2.4 Main Street: Wellfleet - [priority intersection]................................................................... 59 5.2.5 Conwell Street: Provincetown - [priority intersection] ...................................................... 59 5.2.6 Governor Prence Road: Eastham......................................................................................... 59 5.2.7 West Road: Wellfleet............................................................................................................. 59 5.2.8 Orleans Rotary: Orleans/Eastham ....................................................................................... 60
5.3 LONG TERM ROADWAY CONFIGURATION .................................................................................. 62 5.4 LOCAL COMPREHENSIVE PLANS (LCP’S) AND REGIONAL POLICY PLAN ................................... 63
5.4.1 Land Use Recommendations................................................................................................. 63 5.4.2 Land Use-Related Transportation Recommendations: Route 6 Corridor ............................ 63 5.4.3 Transportation/Development Review Policies...................................................................... 64 5.4.4 Access Management ............................................................................................................. 64
5.5 ACCESS MANAGEMENT PROGRAM............................................................................................. 64 5.6 RECOMMENDATIONS RELATED TO OLDER DRIVERS .................................................................. 65 5.7 INTELLIGENT TRANSPORTATION SYSTEMS (ITS) ....................................................................... 66 5.8 PUBLIC TRANSPORTATION ......................................................................................................... 66
5.8.1 Orleans to Provincetown Transit Service ............................................................................. 66 5.8.2 “Attractions” Shuttles .......................................................................................................... 67 5.8.3 Local Transportation Centers............................................................................................... 68 5.8.4 Roadway & Intersection Improvements................................................................................ 68
5.9 ACTION PLAN............................................................................................................................. 68 APPENDICES:
A: Study Area Map and Land Use Maps
B: Summary of Detailed Safety Studies (National)
C: Summary of Detailed Route 6 Accident Reports
D: Route 6 Intersection Crash History
E: MassHighway Crash Worksheets
F: CCC Route 6 Automatic Traffic Recorder Data
G: CCC Route 6 Turning Movement Count Data Raw counts from CCC Database
H: Signal Warrant Detail
I: Level of Service Discussion
J: Route 6 Intersection Turning Movements and Level of Service Synchro Base Model Output-HCM Signalized and Unsignalized Intersection Capacity Analysis Reports
K: SimTraffic Intersection Performance Reports
L: SimTraffic Network and Corridor Performance Reports (Including network section breakout)
M: Project Cost Assumptions
Route 6 Outer Cape Traffic Flow & Safety Study Page 2
List of Figures
Figure 1 – Study Area ................................................................................................................... 11 Figure 2 – Population and Route 6 Traffic .................................................................................... 12 Figure 3 – Existing Average Daily and Summer Daily Traffic..................................................... 18 Figure 4 – Crash Severity by Town............................................................................................... 21 Figure 5 – Crashes by Type........................................................................................................... 22 Figure 6 – Crashes by Time of Day............................................................................................... 23 Figure 7 – Crashes by Time of Year ............................................................................................. 24 Figure 8 – Crashes by Day of Week.............................................................................................. 25 Figure 9 – Crashes by Lighting Condition .................................................................................... 26 Figure 10 – Crashes by Weather Condition................................................................................... 27 Figure 11 – View from Conwell Street looking north across Route 6 .......................................... 31 Figure 12 – View north along Route 6 at the Main Street (Wellfleet) Intersection ...................... 32 Figure 13 – View along Route 6 southeast toward the Brackett Road Intersection ...................... 33 Figure 14 – View along Route 6 north toward Samoset Road intersection................................... 34 Figure 15 – Annual Visitation to Cape Cod National Seashore .................................................... 35 Figure 16 – Utility Pole in Sidewalk and Overgrown Vegetation................................................. 37 Figure 17 – Growth Factor Equation............................................................................................. 41 Figure 18 – Flow Chart of Alternatives......................................................................................... 42 Figure 19 – Alternative A: Intersection Improvements................................................................ 45 Figure 20 – Alternative C: One Lane Section with Turning Lanes.............................................. 46 Figure 21 – Alternative D: Center Barrier Turning Areas............................................................ 47 Figure 22 – Total Network and Route 6 Mainline Delay .............................................................. 51 Figure 23 – Route 6 Mainline Delay by Section ........................................................................... 52 Figure 24 – Recommended Rotary Entrance Signage................................................................... 60 Figure 25 – Example of Diagrammatic Rotary Signage................................................................ 61 Figure 26 – Improved Signing and Lane Marking at Rock Harbor Road / Orleans Rotary.......... 62
List of Tables
Table 1 – Total Population Changes 1980-2000 ........................................................................... 10 Table 2 – Route 6 Weekday Traffic Volumes............................................................................... 17 Table 3 – Network Travel Time .................................................................................................... 18 Table 4 – Network Section Travel Time ....................................................................................... 19 Table 5 – Route 6 Crash Rates 1999 ............................................................................................. 19 Table 6 – Selected Route 6 Intersection Crash Rates .................................................................... 20 Table 7 – Detailed Accident Report Summary.............................................................................. 28 Table 8 – Priority Intersections ..................................................................................................... 30 Table 9 – Signal Warrant Analysis Summary ............................................................................... 36 Table 10 – Base Year Traffic Performance ................................................................................... 41 Table 11 – Base & Future Traffic Performance ............................................................................ 42 Table 12 – Summary of Traffic Delay for Alternatives at Intersections ....................................... 54 Table 13 - Evaluation Matrix ........................................................................................................ 56 Table 14 - Summary of Recommendations ................................................................................... 70
Route 6 Outer Cape Traffic Flow & Safety Study Page 3

Route 6 Outer Cape Traffic Flow & Safety Study Page 4

Executive Summary Route 6 in the Outer Cape towns of Eastham, Wellfleet, Truro, and Provincetown stretches 27-miles and services over 30,000 vehicles per summer day. This stretch of highway has some of the highest crash rates on Cape Cod as well as severe traffic congestion problems. Traffic Flow, Crashes, and Growth An examination of existing and historic data shows traffic volumes within the four towns grew at an average annual rate of 1.05% between 1991 and 2001. The Route 6 crash rate for the whole of Cape Cod was 0.79 crashes per million vehicle miles traveled on average from 1991-1998 while Route 6 in Eastham had one of the highest crash rates on Cape Cod at 2.17 crashes per million miles of vehicle travel. Heavy and growing traffic volumes coupled with the existing high crash rates for the corridor make the search for and implementation of solutions a high priority, especially in Eastham. Total year round population for Eastham, Wellfleet, and Truro grew 20.6% between the 1990 and 2000 Censuses, rising to 10,289 in 2000, while Provincetown’s year-round population decreased 3.7% to 3,431. The census ranked Eastham and Wellfleet as the 10th and 13th oldest towns in the state with median ages of 47.6 and 47.0. The percentages of population over 65 in the Outer Cape towns are Eastham 26.00%, Wellfleet 21.70%, Truro 17.00%, and Provincetown 17.8% compared to a statewide average of 13.50%. Of special interest is seasonal housing on the Outer Cape. Based on the 2000 Census figures for occupied versus vacant housing in April 2000, approximately 60% of the housing units on the Outer Cape are likely to be seasonal housing. This estimate, coupled with the large number of hotels in the area, results in a significant population density increase in the summer. The current summer population is estimated to be 98,000 which results in densities close to 3,600 people per square mile (on land outside of the Cape Cod National Seashore) and is expected to reach over 4,100 per square mile at build-out. Based on trends in traffic growth and total delay, traffic delay on Route 6 in Eastham (from the Orleans Rotary to just over the Wellfleet town line at West Road) is expected to increase 81 percent by the year 2010 if nothing is done to the existing roadway and the trend of population and traffic growth continues. The section of the Route 6 corridor from Brackett Road north to the Wellfleet town line is expected to see the highest increase in delay: from current delay of about 23 seconds to about 51 seconds per vehicle, or about a 122% increase. This forecast, based on simulation of the corridor, formed a baseline for comparing the congestion impacts of corridor alternatives. Alternative Testing As a precursor to alternative testing, existing plans being pursued by MassHighway to improve several intersections were examined. These include sight distance improvements, pedestrian and handicap accommodations, updated signal timing/phasing,
Route 6 Outer Cape Traffic Flow & Safety Study Page 5
and updated signals and poles at five locations on Route 6: Governor Prence Road, Samoset Road, Nauset Road, Brackett Road, and Marconi Beach Road. These improvements may be completed by summer of 2004. Using Federal Highway Administration publications relating to safer roadways, identification of traffic flow problem areas via computer simulation, and public input regarding suggested improvements, several alternatives were identified and analyzed. Each alternative was compared to existing conditions to determine its effect, positive or negative, on improving traffic flow and safety along the Route 6 corridor. Four alternatives were tested using Synchro and SimTraffic traffic operations software. These alternatives included intersection improvements such as turning lanes, adding traffic signals, and signal upgrades; changing roadway cross sections such as one through lane with turn pockets; and creating a center barrier for the entire length of Route 6 in Eastham. Below is a complete list of the alternatives modeled using the traffic operations software.
2001 Base: Existing conditions model 2010 Base: Future year traffic conditions model with no roadway changes 2010 A: Intersection Improvements • Route 6 at Orleans Rotary – stripe 2 lanes entering westbound (approx. 150’) • Route 6 at Samoset Road – new northbound left turn lane on Route 6 • Route 6 at Depot Road – no northbound left turns allowed onto Depot Road from Route 6 • Route 6 at Massasoit Road – new northbound left turn lane on Route 6 • Route 6 at Brackett Road – new southbound left turn lane on Route 6 • Route 6 at Brackett Road – new westbound left turn lane on Brackett Road 2010 B: Intersection Improvements plus signalize Governor Prence Road Includes all improvements listed in 2010A plus signalization of Route 6 and Gov. Prence
Road 2010 C: One Lane section in south Eastham Involves allowing one through lane northbound and southbound and the creation of turning
pockets at key locations from the Rotary to the Eastham post Office area. The layout will likely fit within the existing pavement area
2010 D: Center Barrier • Involves a continuous center barrier allowing left turns at key areas only • Included a sensitivity test with 20% less traffic and the continuous center barrier
The above alternatives were tested with the traffic operations software to determine their effects on traffic flow while the impacts on safety were analyzed using typical improvement rates from similar improvements documented in the Federal Highway Administrations’ Access Management for Streets and Highways (1982).
Route 6 Outer Cape Traffic Flow & Safety Study Page 6

Conclusions Alternative B’s performance was the most notable. This alternative may produce a 25 percent reduction in delay and is also estimated to reduce crashes by as much as 4.9 per year. This improvement scheme would involve minor land takings and have a potential cost of as much as $800,000 and is therefore considered a long-term option. Other improvements can be done in the short and medium term to improve traffic flow and safety. All of these options are presented in the table on the following page. The traffic flow and safety problems on Route 6 in the four towns of the Outer Cape need to be addressed. Implementation of these recommendations would provide congestion relief and a greater degree of safety for motorists.
Route 6 Outer Cape Traffic Flow & Safety Study Page 7

Summary of Recommendations
Location
Improvement/ Description
Time Frame
Benefit
Cost $1,000
Area-wide Education: Information campaigns including media and signage to encourage safe driving and alternate mode use
Short Term & Continuing
Safety & Mobility
N/A
Route 6 Corridor Enforcement: Highly visible enforcement of speed limits, red light running, etc.
Short Term & Continuing
Safety N/A
Area-wide and in adjacent areas
Intelligent Transportation Systems: Dissemination of traffic flow, parking, and safety information in real-time via Highway Advisory Radio, Variable Message Signs, and Internet
Short Term & Continuing
Safety & Mobility
N/A
Route 6 corridor – Orleans to Provincetown
Orleans to Provincetown Transit Service: connecting to National Seashore, beaches, etc.
Short Term & Continuing
Mobility 273 to 546
Route 6 and other corridors – Hyannis to Provincetown
“Attractions” Shuttles: Provide ride-sharing service for Provincetown excursions, National Seashore, other attractions
Short Term & Continuing
Mobility N/A
Rt 6 Intersections: Samoset, Brackett, Main, Conwell, Gov. Prence
Various improvements including upgrades to lane markings, signal heads, access management, pedestrian phases and crosswalks. See section 5.2 for more detail.
Medium Term
Safety & Traffic Flow
N/A
Eastham/Orleans Rotary
Improvements to rotary signage and pavement markings at the Rock Harbor Rd entrance
Medium Term
Safety N/A
Route 6 Corridor Access Management: Increase frontage requirements, provide incentives to share access, increase land conservation, and enforce “No Access” line in Truro/Provincetown
Medium Term
Safety & Traffic Flow
N/A
Area-wide Older Drivers’ Recommendations: incorporate protected left-turn phases, frequent restriping and street cleaning, larger signs, improved and consistent lighting
Medium Term
Safety N/A
Route 6 Corridor Provide bus turnouts and shelters at strategic locations (to compliment local services and destinations)
Medium Term
Mobility N/A
Route 6 – Eastham/Orleans Rotary to Eastham post office
Lanes for left turning vehicles plus single through travel lane. Signalization at Gov. Prence Rd
Long Term Safety & Traffic Flow
567 to 1,717
Provincetown, Orleans
Local Transportation Centers: Construction of facilities near MacMillan Wharf and downtown Orleans to provide connections with local and express bus service, information kiosks, etc.
Long Term Mobility N/A
Route 6 Outer Cape Traffic Flow & Safety Study Page 8

1. Introduction U.S. Route 6 in the towns of Eastham, Wellfleet, Truro, and Provincetown (the “four towns” referred to in this document) is a 27-mile stretch of State Highway servicing, at some locations, well over 30,000 vehicles per summer day. The highway includes some of the highest and most serious crash rates on Cape Cod as well as some severe traffic congestion problems. The Cape Cod Commission was assigned the task of developing recommendations to improve safety and traffic flow as part of the Commission’s transportation planning contract with the Massachusetts Highway Department (which has jurisdiction for the highway.)
1.1 Project Goals Based on comments received at public meetings, state directives, and transportation planning goals identified in the Cape Cod Regional Transportation Plan, the goals of this study were as follows:
• Identify specific locations that experience high crash rates or crash frequency • Develop recommendations that, if implemented, would reduce crash rates and
frequency • Identify specific locations that experience high levels of traffic congestion • Develop recommendations that, if implemented, would help ease traffic
congestion
1.2 Study Area 1.2.1 Population
The most significant result of the 2000 Census was growth. Population in the Cape Cod region grew 19.1% between 1990 and 2000 to 222,230 people contrasted with a Statewide growth of 5.5%. Cape Cod is the 3rd fastest growing region behind the Islands of Nantucket and Martha’s Vineyard which also contribute to the traffic volumes on Cape Cod. Twelve of the 20 oldest communities in the state are located in the region with Orleans and Chatham as the oldest of the 351 communities in the Commonwealth (median ages of 55.5 and 53.9 respectively.) Eastham and Wellfleet are close behind, ranking 10th and 13th in the state with median ages of 47.6 and 47.0. The percentage of population over 65 in the Outer Cape towns are: Eastham 26.0%, Wellfleet 21.7%, Truro 17.0%, and Provincetown 17.8% compared to a statewide average of 13.5%. Significant growth occurred in the outer Cape towns over the last few decades. This growth has continued in the period between 1990 and 2000 with the exception of Provincetown, which saw little growth from 1980 to 1990 and a slight decline from 1990-2000. See Table 1 for more information.
Route 6 Outer Cape Traffic Flow & Safety Study Page 9

Table 1 – Total Population Changes 1980-2000
Year
Eastham
Wellfleet
Truro
Provincetown
Four Outer Cape Towns -
Total Population
Population 1980 3,472 2,209 1,486 3,536 10,703 1990 4,462 2,493 1,573 3,561 12,089 2000 5,453 2,749 2,087 3,431 13,720
Changes by 1970-1980 69.9% 26.7% 20.4% 21.5% 15.8% Decade 1980-1990 28.5% 12.9% 5.9% 0.7% 13.0%
1990-2000 22.2% 10.3% 32.7% -3.7% 13.5% According to the Cape Cod Commission’s Geographic Information System department, the Outer Cape is an area of 66.4 square miles of which approximately 60% is protected as the Cape Cod National Seashore. The population lives on approximately 27.2 square miles of land outside of the national seashore, resulting in a density of approximately 505 year round residents/square mile. However, since 60% of the housing in the Outer Cape towns is estimated to be seasonal and since there are a large number of hotels in the area, the density increases significantly in the summer. The estimated total summer population for the Outer Cape is approximately 98,000 people which yields a density of approximately 3,600 people per square mile. The total summer population is expected to reach over 4,100 per square mile at “build-out,” a density similar to more urban areas. Several studies and plans have been developed that included analysis and policies for Outer Cape future land use. These include the 1996 Outer Cape Capacity Study, the Local Comprehensive Plans prepared by the Outer Cape towns, the Cape Cod Commission’s Regional Policy Plan, and a recent build-out analysis for the entire Cape. This study focuses it efforts on the Route 6 corridor, and its major intersections, in Eastham, Wellfleet, Truro and Provincetown. Traffic flow and safety on parallel or intersecting roads is of concern but is not considered in the same level of detail as the Route 6 corridor. The corridor is shown in red on the study area map in Figure 1 and also in detailed maps available in the appendix. Build-out scenarios developed in the Outer Cape Capacity Study include a scenario where the existing ratio of seasonal to year round housing continues and a scenario where 50% of the seasonal housing is converted to year round. The most recent build-out analysis for the Cape expects build-out to occur around 2025 and it is likely that the Outer Cape towns will achieve build-out earlier. Current and future land use maps are located in the appendix which show the drastic increase in residential land use and the shift from low-density residential development to higher densities expected at build out. The Outer Cape year round population at build-out is expected to be 17,470 to 27,860 and the summer population is expected to be 112,310 to 113,580, depending on the assumed conversion of seasonal housing stock. Figure 2 shows the changes in population and Route 6 Average Daily Traffic from 1990 through 1999.
Route 6 Outer Cape Traffic Flow & Safety Study Page 10

Figure 1 – Study Area (Detailed study area map in appendix)
Route 6 Outer Cape Traffic Flow & Safety Study Page 11

0
2,000
4,000
6,000
8,000
10,000
12,000
14,000
16,000Po
pula
tion:
Eas
tham
, Wel
lflee
t, Tr
uro
and
Prov
ince
tow
n
0
5,000
10,000
15,000
20,000
25,000
30,000
35,000
Rou
te 6
Ann
ual A
vera
ge D
aily
Tra
ffic
Population 12,127 12,154 12,259 12,421 12,621 12,821 12,983 13,130 13,333 13,597
Rt 6 ADT 24,591 25,762 24,733 25,360 27,246 26,502 24,888 26,177
1990 1991 1992 1993 1994 1995 1996 1997 1998 1999
NA NA
Figure 2 – Population and Route 6 Traffic Sources: CCC Population Figures for Eastham, Wellfleet, Truro, and Provincetown. CCC Summer Traffic
Counts for Route 6 at Eastham/Wellfleet town line
1.2.2 Regional Policy Plan and Local Comprehensive Plans
The Cape Cod Regional Policy Plan (2002) includes three transportation goals:
1) “To maintain an acceptable level of safety on all roads on Cape Cod for all users” 2) “To reduce and/or offset the expected increase in motor vehicle trips on public
roadways and to reduce dependency on automobiles” 3) “To maintain travel times and Level of Service on regional roads and intersections
and to ensure that all road and intersection construction or modification is consistent with community character, historic, or scenic resources”
Developments of Regional Impact (generally commercial construction/conversion of 10,000 Square Feet or more or housing developments of 30 units or more) are required to
Route 6 Outer Cape Traffic Flow & Safety Study Page 12

meet these goals by complying with 33 Minimum Performance Standards. Some of these requirements have been recognized by the towns in their Local Comprehensive Plans (LCPs) and implemented for projects not under DRI review. These and related LCP strategies make up the basis for several recommendations as presented in section 5.2 of this report. For a complete review of RPP policies and standards, please see RPP section 4.1.2, available from the Commission or on the Internet at:
www.capecodcommission.org/RPP
1.2.3 Travel and Transportation Alternatives
Route 6 is the main—and in some areas the only—route traveling the spine of the Outer Cape. Milepost 0.0 is “located” in Provincetown (the other end of Route 6 is in California), in the vicinity of Herring Cove Beach at the intersection of Route 6A. Naturally, all Route 6 travel in Provincetown has either an origin or a destination (or both) in town. Moving south, Route 6 carries more and more through traffic, with the largest share, for the purposes of this study, in Eastham (serving local travel as well as the other three towns on the Outer Cape). In general, congestion is seasonal occurring between June and August with weekday peak hour traffic volumes of over 2,700 vehicles observed on Route 6 in Eastham. Weekend volumes are estimated to be approximately 30% higher than the weekday volumes. The corridor’s major discrete traffic generators are also seasonal in nature and include the National Seashore and Provincetown attractions such as the whale watch cruises. Traffic volumes within the four towns grew at an average annual growth rate of 1.05% per year for the 1991 through 2001 period. Due to geographic aspects of the Outer Cape, roadway and routing alternatives to Route 6 are limited. In some areas of Wellfleet and Truro Route 6 is the only north-south route and in other areas of the Outer Cape, alternative north-south routes traverse rural residential areas. Other transportation alternatives in the area include:
• Regional air service between Provincetown airport and Boston • Ferry service at MacMillan Wharf in Provincetown to and from Boston and
Plymouth • The Provincetown Shuttle—providing public transportation between Truro and
Provincetown, including MacMillan Warf • Plymouth and Brockton—privately operated inter-regional bus service between
Boston (including Logan Airport) and Provincetown; makes a number of stops in the study area including Dutra’s Store in North Truro where a connection with the Provincetown Shuttle can be made
• The Cape Cod Rail Trail multiuse recreational path originates in Dennis and parallels Route 6 in the study area from the Eastham/Orleans town line to LeCount Hollow Road in Wellfleet (approximately 8 miles)—The bike route (State Bicycle Route 1 also known as the Claire Saltonstall bikeway) then
Route 6 Outer Cape Traffic Flow & Safety Study Page 13

continues along side roads and bike path segments to North Truro and Provincetown where it follows Route 6A into Provincetown
1.3 Study Criteria Traffic flow and safety were the two criteria used to evaluate the existing conditions and suggested alternatives along the Route 6 corridor. Improving traffic flow and safety are the major goals of this study and evaluating the impacts on both was paramount in determining viable solutions along the corridor. Recommended improvements also include elements from the FHWA Older Driver Highway Design Handbook in recognition of the older driving population on Cape Cod. This approach was recommended in the Cape Cod 2000 Regional Transportation Plan and includes consideration of improved illumination, signage, and pavement delineation. The following sub sections include discussions on methodologies to evaluate traffic flow and crash studies, as well as analytical potential and limitations of local Cape Cod crash data.
1.3.1 Traffic Flow
Numerous traffic counts conducted by Automatic Traffic Recorder (ATR) and turning movement counts collected manually were undertaken by Commission staff in recent years. ATRs are traffic sensors (rubber hoses stretched across the roadway) and recorders (battery-operated computers) that record hourly traffic volumes on road links usually over a period of 48 hours or more. Turning movement counts record the number of vehicles turning left, turning right, or continuing straight from each of the approaching roads at intersections. The turning movement count is the basic input in determining an intersection’s performance – known as “Level of Service” or “LOS” (see discussion in the appendix). Turning movement counts conducted for this study were limited to two hours during peak traffic periods due to budgetary and time constraints. Extensive (more than eight hours of observation) turning movement counts are needed to determine if a particular location meets defined traffic signal “warrants” for signal installation. For this study, the peak hour traffic counts were used for one of the warrants. By relating peak hour information with nearby ATR data, turning movements were factored to more hours which provided data for additional signal warrant analysis. (See section 2.6) Traffic operations can be evaluated in many different ways. For analysis in this study, a transportation operations analysis software package, Synchro/SimTraffic was used to help describe the existing conditions and forecast the effects of future growth and alternatives. These techniques are discussed in detail in Chapter 3.
Route 6 Outer Cape Traffic Flow & Safety Study Page 14

1.3.2 Safety
A corridor-wide crash analysis was undertaken for this study using the latest available three years’ (1998-2000) of crash data. Results are presented in section 2.3. This study has also used results of several previous efforts which analyzed crash data in the area. The first previous effort was a detailed analysis of individual 1994-1996 police department reports in Eastham, Wellfleet, and Truro. It included crash diagrams for Route 6 intersections which are presented in the appendix. From this effort, specific types of crashes were more thoroughly examined and are discussed in section 2.3.1. The second previous effort, using 1991-1998 state crash records, identified intersections and roadway segments that experience significant crash rates, as discussed in section 2.3.2.
Massachusetts & Cape Cod Data Periodically, the Massachusetts Highway Department (MHD) receives crash records from the Registry of Motor Vehicles. Annually, MHD transmits records for Cape Cod towns (usually in mid-Summer) to the CCC. It is customary to analyze records from the most recent three years to identify hazardous locations and safety problems. For this study, records from the years 1998-2000 were used to determine the average number of crashes for a variety of scenarios. The state’s crash records include information for each crash including:
• Date & Hour of the Day • Severity (e.g., Fatality, Injury, Property Damage Only) • Type (e.g., Rear-End, Angle) • Environmental Characteristics (Lighting, Road Surface Conditions, Weather….) • Street Name (& crossing street for intersection crashes)
The severity information is especially important for assessing the degree of hazard. The state-approved and nationally established concept of “Equivalent Property Damage Only” (EPDO) points was used in this study. By assigning a value of 1 to Property Damage Only crashes, a value of 5 to Injury crashes, and a value of 10 to Fatality crashes, the EPDO system allows total crashes to be evaluated in a single statistic. Street name information is not standardized in the MHD records, it may include spelling errors, and cross street locations are only sometimes included. Consequently, some of the recorded Route 6 crashes may have occurred at specific intersections (as opposed to crashes unrelated to an intersection). However, only crashes that could be identified to occur at specific intersections were used for the intersection analysis.
Route 6 Outer Cape Traffic Flow & Safety Study Page 15

Route 6 Outer Cape Traffic Flow & Safety Study Page 16

2. Existing Conditions The following sections present information on traffic volumes, crash history, and other items important to documenting the existing traffic and safety conditions on Route 6 in the four Outer Cape towns.
2.1 Traffic Volumes The Cape Cod Commission has been maintaining a database of traffic counts that covers the entire Cape Cod Region for over 18 years. Throughout those years, 106 Automatic Traffic Counts (ATR’s) have been taken along Route 6 on the Outer Cape. Of those counts, 15 were taken in the last three years (see appendix of ATR’s). In addition to the ATR counts, over 25 turning movement counts (TMCs) were taken at specific intersections along the Route 6 corridor in the summer of 2001 (see appendix of TMCs). The turning movement counts were taken in 2-hour intervals from 4:00 to 6:00 PM and were the basis for the traffic flow model (covered in Section 3.2) of the Eastham section of the corridor. Typical Route 6 traffic volumes within each town are presented in Table 1 and Figures 3&4. Observed traffic volumes decrease the further out the cape the counts are taken as the roadway serves fewer and fewer trip generators. Traffic volumes are highest in Eastham at an annual average of 26,000 vehicles per day. Many of these motorists are traveling to or from one of the three remaining towns, given that Route 6 is the main route on the Outer Cape. In Provincetown, where traffic levels are at an annual average of 14,000 vehicles per day, “through traffic” does not exist since these motorists have either an origin or destination in Provincetown.
Table 2 – Route 6 Weekday Traffic Volumes
Town Existing Annual Average Daily Traffic (1999)
Existing Summer Average Daily Traffic (2000)
Eastham 26,000 33,000 Wellfleet 19,000 27,000
Truro 17,000 20,500 Provincetown 14,000 19,000
*Above volumes represent an average of multiple count stations within each town Source: Cape Cod Commission traffic counting program
Route 6 Outer Cape Traffic Flow & Safety Study Page 17

Route 6 Seasonal Traffic Variation
0
5,000
10,000
15,000
20,000
25,000
30,000
35,000
Eastham Wellfleet Truro Provincetown
Year Round 1999 Average Daily Traffic Summer 2000 Average Daily Traffic
Source: Cape Cod Commission traffic counting program Figure 3 – Existing Average Daily and Summer Daily Traffic
2.2 Travel Times During the data collection effort for this study, a GPS unit was used to record travel times for the corridor, once on Tuesday July 24th 2001 and once on Wednesday July 25th 2001. The July 24th travel time run was prior to the peak hour and the July 25th run was recorded during the peak hour (4-5 PM). The data collector traveled the corridor using a standard car-following technique. The GPS recorded time and position from the Orleans Rotary to the Eastham-Wellfleet town line and back. The travel time results in the table below show the start time of each trip and corresponding travel time.
Table 3 – Network Travel Time
Tuesday July 24, 2001 Wednesday July 25, 2001
Direction of Travel NB SB NB SB
Start Time 2:27 PM 2:41 PM 4:45 PM 4:58 PM
Travel Time (min) 9.97 11.25 10.12 9.53
Average Speed 42 40 35 39
The Route 6 corridor was broken into three sections that were used in the traffic operations analysis. The first section is from the Orleans Rotary to Samoset Road, the second from Samoset Road to Brackett Road, and the third from Brackett Road north to the Wellfleet town line. Travel time and speed was broken out by corridor section for both northbound and southbound travel directions. During both northbound runs, the average speed for section two dropped below 35 mph, illustrating some of the delay
Route 6 Outer Cape Traffic Flow & Safety Study Page 18

associated with the Nauset Road signal and queue and possibly some delay related to the Brackett Road signal. During the southbound run on July 24th, the average speed in section two dropped below 35 mph. The results from the two travel time runs by section are given in Table 3.
Table 4 – Network Section Travel Time
Tuesday July 24, 2001 Wednesday July 25, 2001 Corridor Section: Average Free Flow Speed NB SB NB SB
Section One Rotary to Samoset Rd 39.6 40.4 40.5 38.9
Section Two Samoset Rd to Brackett Rd 30.2 32.3 31.6 37.3
Section Three Brackett Rd to Wellfleet TL 42.1 25.1 35.1 38.2
2.3 Crash History This section reviews detailed crash rates and crash records for the four Outer Cape towns. For a given intersection or corridor, crash rates are calculated by dividing the average annual number of crashes by the number of vehicles using the facility. For presentation purposes, crash rates are typically scaled to “per million vehicles” and are further adjusted to account for mileage of roadway and severity of crashes. The Route 6 crash rate for the whole of Cape Cod in 1999 was 0.79 crashes per million vehicle miles traveled. In contrast, The Route 6 crash rate in Eastham was 2.17 crashes per million miles of vehicle travel, much higher than the other three towns in the study as shown in Table 4.
Table 5 – Route 6 Crash Rates 1999 Town Rte. 6 Miles Average Annual
Daily Traffic (1999)
Annual Crashes (1999)
Crashes per million miles traveled
Eastham 6.12 26,000 126 2.17 Wellfleet 8.56 19,000 42 0.71 Truro 9.93 17,000 25 0.41 Provincetown 3.8 14,000 9 0.46
Source: Cape Cod Crash & Traffic Data, MassHighway, 1999 data Intersection crash rates were calculated using worksheets supplied by MassHighway and are provided in the appendix. The methodology used in calculating intersection crash rates requires adjustment for annual traffic and makes use of crash records that can be attributed to specific intersections. The table below summarizes crash rates at the nine key Route 6 intersections in Eastham:
Route 6 Outer Cape Traffic Flow & Safety Study Page 19

Table 6 – Selected Route 6 Intersection Crash Rates* Intersection
Crash Rate* State Average*
District Average*
Brackett Road 0.411 0.87 0.89 Governor Prence Rd 0.189 0.66 0.67 Kingsbury Beach Rd 0.109 0.66 0.67 Massasoit Road 0.134 0.66 0.67 McKoy Rd 0.109 0.66 0.67 Oak Road 0.220 0.66 0.67 Salt Pond Road (Visitor Center) 0.282 0.87 0.89 Samoset Road 0.347 0.87 0.89 Wampum Road/ Nauset Road N 0.280 0.87 0.89 *Per million vehicles entering the intersection The calculated crash rates for Eastham’s Route 6 intersections are below the MassHighway District and state averages. However, due to the previously discussed limitations of the state crash records, it is possible that all crashes at specific intersections have not been identified and consequently the crash rates may actually be higher. A variety of detailed crash information is provided in the following charts which are based on 1998-2000 Crash records from the Massachusetts Registry of Motor Vehicles (RMV). In several of the following figures, the bars showing the number of crashes include separate shaded areas for Eastham and the other three towns. It may be useful to evaluate crashes at a more detailed level, such as the “sections” being used to present traffic flow information, but the limitations of the RMV records make this impractical. Most of the crash records identified along the Route 6 corridor in Eastham (and all towns on Cape Cod for that matter) lack sufficient detail to identify the corresponding section where the crashes occurred.
Route 6 Outer Cape Traffic Flow & Safety Study Page 20

0
20
40
60
80
100
120
140
Eastham (w/ Rotary) W ellfleet Truro ProvincetownType of Crash
Num
ber o
f Cra
shes
per
Yea
r
Property Damage* Injury Fatality
Source: Cape Cod Crash Data, Mass Highway, 1998-2000 data* includes Hit and Run crashes
Figure 4 – Crash Severity by Town The figure above shows the average number of Route 6 crashes per year in each of the four Outer Cape towns. For each town, crash severity is shown in green (PDO - property damage only), yellow (injury), or red (fatality). Eastham experienced 71 PDO, 54 injury, and 1 fatality crash per year on average for a total of 126 crashes per year on average. Wellfleet, Truro, and Provincetown experienced 42, 25, and 9 Route 6 crashes per year on average, respectively. This data implies towns which serve as throughways for other towns and/or have more curb cuts on Route 6 (especially Eastham) experience substantially higher crash frequencies.
Route 6 Outer Cape Traffic Flow & Safety Study Page 21

0
10
20
30
40
50
60
70
80
90
100
Rear End Angle HeadOn Unknown
Type of Crash
Num
ber o
f Cra
shes
per
Yea
rEastham (w/ Rotary) Other Towns
Source: Cape Cod Crash Data, Mass Highway, 1998-2000 data
Figure 5 – Crashes by Type
The figure above shows the average number of Route 6 crashes per year in each of four crash types. The lower portion of each bar shows the Eastham crashes. Rear end crashes were the most common crash type recorded on Route 6 in the Outer Cape region from 1998 to 2000. There were 67 in Eastham and 27 in other towns for a total of 94 recorded “Rear End” crashes on average per year. The implications of these data may be that many of the vehicles engaged in left-turn maneuvers are either creating conflicts for following vehicles (resulting in Rear End crashes) or are directly involved (Angle crashes).
Route 6 Outer Cape Traffic Flow & Safety Study Page 22

0
10
20
30
40
50
60
70
80
90
3AM to 7AM 7AM to 11AM 11AM to 3PM 3PM to 7PM 7PM to 11PM 11PM to 3AM
Time of Day
Num
ber o
f Cra
shes
per
Yea
rEastham (w/ Rotary) Other Towns
Source: Cape Cod Crash Data, Mass Highway, 1998-2000 data
Figure 6 – Crashes by Time of Day
The figure above shows the number of Route 6 crashes on average per year in each of six daily time periods. The lower portion of each bar shows the Eastham crashes. The 11 a.m. – 3 p.m. period contains the largest number of crashes: 46 in Eastham and 31 in other towns for a total of 77 recorded in the Outer Cape on average per year. According to volume counts conducted for this study, the 11 AM to 3 PM time period is the busiest time of day. The implication of these data is the busiest time of day experiences the highest frequencies of crashes.
Route 6 Outer Cape Traffic Flow & Safety Study Page 23

0
10
20
30
40
50
60
70
80
90
Jan - Feb Mar - Apr May - Jun Jul - Aug Sep - Oct Nov - Dec
Num
ber o
f Cra
shes
per
Yea
rEastham (w/ Rotary) Other Towns
Source: Cape Cod Crash Data, Mass Highway, 1998-2000 data
Figure 7 – Crashes by Time of Year
The figure above shows the number of Route 6 crashes on average per year in each of six yearly time periods. The lower portion of each bar shows the Eastham crashes. The combined months of July and August are host to the highest number of crashes: 44 in Eastham and 32 in other towns for a total of 76 crashes per year on average for the Outer Cape towns. According to permanent traffic count stations on the Cape (but outside of the study area), the months of July and August are the busiest. The implication of these data is that the months with the heaviest travel experience the greatest frequency of crashes. Summer months are highest, with the “shoulder season” months showing frequencies well above the remaining months.
Route 6 Outer Cape Traffic Flow & Safety Study Page 24
0
5
10
15
20
25
30
35
40
Mon Tue Wed Thu Fri Sat Sun
Num
ber o
f Cra
shes
per
Yea
rEastham (w/ Rotary) Other Towns
Source: Cape Cod Crash Data, Mass Highway, 1998-2000 data
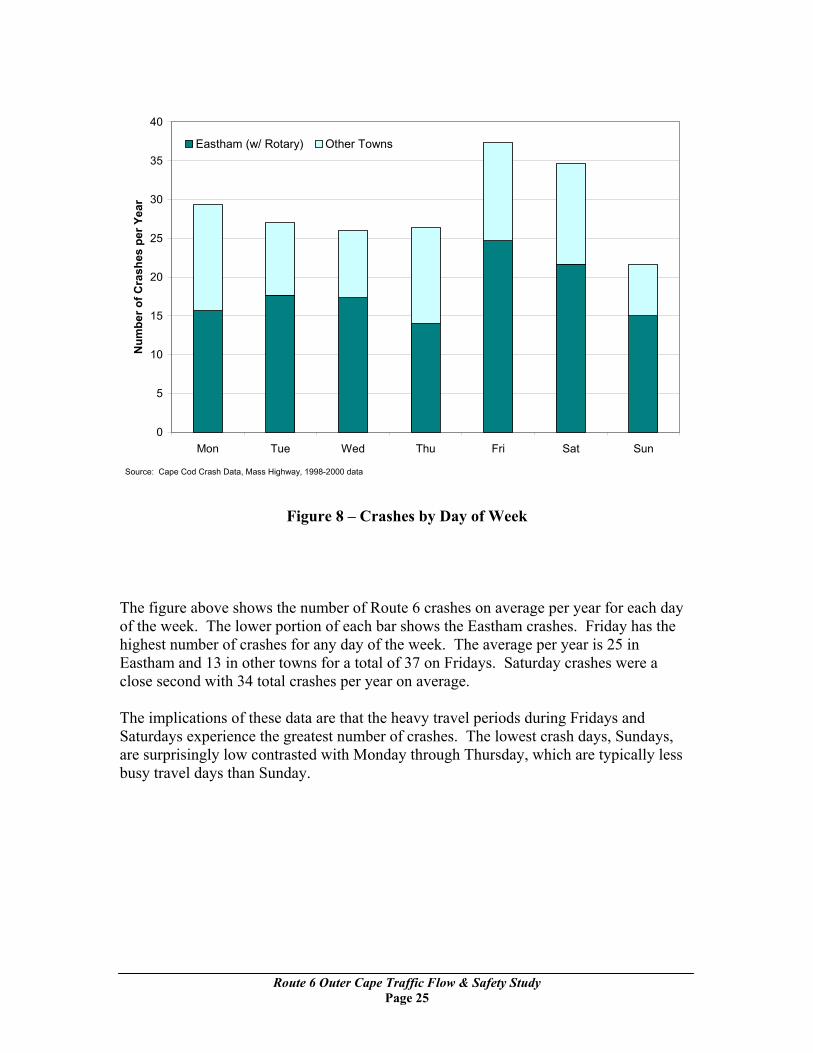
Figure 8 – Crashes by Day of Week
The figure above shows the number of Route 6 crashes on average per year for each day of the week. The lower portion of each bar shows the Eastham crashes. Friday has the highest number of crashes for any day of the week. The average per year is 25 in Eastham and 13 in other towns for a total of 37 on Fridays. Saturday crashes were a close second with 34 total crashes per year on average. The implications of these data are that the heavy travel periods during Fridays and Saturdays experience the greatest number of crashes. The lowest crash days, Sundays, are surprisingly low contrasted with Monday through Thursday, which are typically less busy travel days than Sunday.
Route 6 Outer Cape Traffic Flow & Safety Study Page 25

0
20
40
60
80
100
120
140
160
180
Dark - Road Lit Dark - Road Unlit Daylight Dawn or Dusk Unknown
Lighting
Num
ber o
f Cra
shes
per
Yea
rEastham (w/ Rotary) Other Towns
Source: Cape Cod Crash Data, Mass Highway, 1998-2000 data
Figure 9 – Crashes by Lighting Condition
The figure above shows the number of Route 6 crashes on average per year for various lighting conditions. The lower portion of each bar shows the Eastham crashes. During “Daylight” periods the largest number of crashes were observed. There were an average per year of 104 in Eastham and 57 in the other towns for a total of 161 during “Daylight” lighting conditions. The implication of these data is that the highest frequency of crashes occurs during seasonal peak travel times—the summer—when traffic levels are higher and daylight hours are longer; and during daylight peak travel times—11 AM to 3 PM.
Route 6 Outer Cape Traffic Flow & Safety Study Page 26

0
25
50
75
100
125
150
Rain Snow Clear Cloudy Foggy UnknownWeather
Num
ber o
f Cra
shes
per
Yea
rEastham (w/ Rotary) Other Towns
Source: Cape Cod Crash Data, Mass Highway, 1998-2000 data
Figure 10 – Crashes by Weather Condition
The figure above shows the number of Route 6 crashes on average per year for various weather conditions. The lower portion of each bar shows the Eastham crashes. There were on average 79 crashes per year on average in Eastham and 52 in other towns’ for a total of 131 for the most commonly recorded condition: “Clear.”
2.3.1 Detailed Analysis of Accident Reports
The Commission has been investigating safety problems on Route 6 for various traffic studies over a period of several years. In 1997, a detailed analysis of accident reports was undertaken in the towns of Eastham, Wellfleet, and Truro covering 1994-1996. Since Eastham had a very high accident frequency, the second—more detailed—part of the study focused only on Eastham. Commission technicians viewed individual accident reports, one by one, and cataloged the information for further analysis. Despite the age of the analysis, the general pattern of types of crashes is assumed to be applicable for Eastham, since there have not been any major changes in roadway geometry. Efforts to include more up-to-date data would be worthwhile in order to ascertain the effects of factors such as changes in pass-through traffic and increases in year-round population (see discussion in section 1.3.2).
Route 6 Outer Cape Traffic Flow & Safety Study Page 27

A detailed summary of these crashes is available for review in the appendix. From these reports, percentages of crash types are presented in the following table:
Table 7 – Detailed Accident Report Summary
Detailed Accident Report Analysis
Route 6 – Eastham 1994-1996 Reports
Source: Eastham Police Department
Accident Type Observed Percent of Identifiable
Rear End 80 67% Right Angle 19 16%
Left Turn 6 5% Other 14 12%
Total Identifiable 119 100% Un-Identifiable 32
Total 151
The types of crashes are discussed in the following sections as how they relate to this study: Rear End Crashes
This type of crash can be due to a number of factors but is primarily caused by vehicles stopped in the travel lane waiting to make a left turn, waiting behind a left turning vehicle, waiting for a stoplight, or during slower stop-and-go travel periods. Right turning vehicles generally do not cause much delay to following vehicles and non-turning vehicles only impede following vehicles while stopping at signals or during slower travel periods. Consequently, the vehicles stopped for left turns and the vehicles which may be stopped behind them is a primary cause of Rear End crashes. If it were possible to eliminate all left turns, it is reasonable to assume that Rear End crashes would be reduced significantly. Right Angle Crashes
This type of crash occurs between crossing traffic and mainline traffic (e.g., a northbound Route 6 vehicle strikes or is struck by a vehicle entering from a side street). Some of the minor street vehicles involved in this type of crash may be attempting to turn right or to cross Route 6. However, the traffic data show that the crossing movements are a small fraction of all turning movements, and right turning vehicles are unlikely to meet at the right angle specified for this type of crash (a separate listing for “Right Turn” crashes is typical). Consequently, most of this type of crash is probably caused by left turning
Route 6 Outer Cape Traffic Flow & Safety Study Page 28

vehicles. If it were possible to eliminate all left turns, it is reasonable to assume that Right Angle crashes would be reduced. Left Turn Crashes
As the name implies, this type of crash occurs while one or more vehicles are making left turns. Crashes tend to be more serious (similar to Right Angle) than other crash types since vehicle occupants are more vulnerable in side-impact collisions. Strategies that eliminate or protect left turns would likely eliminate almost all Left Turn crashes. Other Crashes
This category includes crashes between opposing flows of traffic such as “Head On” and “Side Swipe,” as well as other types of crashes. Some of the strategies being considered in this study may help to reduce these types of crashes.
2.3.2 Intersection Safety
When this study was originally being formulated, an extensive Commission effort was made to review the entire database of crashes in the four towns in order to identify priority crash locations. This effort made use of 1991-1998 data. While it covers a longer and earlier period than used in other sections of this report, it is expected that the general traffic patterns and crashes are consistent, and it is assumed to be a useful tool in analyzing crash patterns. A complete intersection-by-intersection listing is available in the appendix. For each intersection, the numbers of Property Damage Only, Injury, and Fatality crashes are listed. Also included are the number of persons injured and the number of fatalities. The next step was to analyze severity information to determine each intersection’s total Equivalent Property Damage Only (EPDO) score. As mentioned earlier, the EPDO score is determined by assigning a value of 1 to Property Damage Only crashes, a value of 5 to Injury crashes, and a value of 10 to Fatality crashes. Scores for all of the intersections with recorded crashes are presented in the appendix as well. For purposes of prioritizing locations, several “Tiers” have been established: 1st Tier intersections rated 60 or more EPDO points and are considered the highest priority. 2nd Tier intersections rated between 40 and 60 EPDO points, 3rd Tier rated between 30 and 40 EPDO points, and 4th Tier intersections rated between 20 and 30 EPDO points. These tiers are intended to help focus the study. The table on the following page presents the results of the grouping process. The typical type of crash (e.g., angle, rear end, etc.) is also presented; where no Typical Crash Type is noted, a significant pattern could not be recognized from the accident data.
Route 6 Outer Cape Traffic Flow & Safety Study Page 29

Table 8 – Priority Intersections
Road Intersection Route 6 Typical Crash Type Provincetown Conwell Street 1st Tier Angle Snail Road 2nd Tier Angle, Rear End Shank Painter Road 3rd Tier Truro Arrowhead Road 4th Tier SB Rt. 6 Rear End Wellfleet Main Street 1st Tier NB Rt 6 Rear End, NB Rt 6/WB Main Wellfleet Drive In 2nd Tier EB Rear End Marconi Beach Road 3rd Tier NB Rt 6 Rear End Village Lane 3rd Tier Rear End Old Truro Road 3rd Tier Eastham Brackett Road 1st Tier NB/SB Rt 6 Rear End Samoset Road 1st Tier NB/SB Rt 6 Rear End, SB Rt 6/EB Samoset Salt Pond Road 2nd Tier NB/SB Rt 6 Rear End Oak Road 2nd Tier NB/SB Rt 6 Rear End Governor Prence Road 2nd Tier Orleans Rotary 3rd Tier NB/SB Rt 6 Rear End Nauset Road 3rd Tier SB Rt 6 Rear End McKoy Road 4th Tier NB Rt 6 Rear End Massasoit Road 4th Tier NB Rt 6 Rear End Kingsbury Beach Road 4th Tier S/E Angle Note: NB = Northbound, SB = Southbound, EB = Eastbound, WB = Westbound 1st Tier intersections—60 or more EPDO points 2nd Tier intersections—between 40 and 60 EPDO points 3rd Tier intersections—between 30 and 40 EPDO points 4th Tier intersections—between 20 and 30 EPDO points
2.3.3 Examination of 1st Tier Priority Intersections
The following sections include discussions of problems at the “1st Tier” Intersections described in the previous section.
Route 6 Outer Cape Traffic Flow & Safety Study Page 30

Stop Line: badly worn Figure 11 – View from Conwell Street looking north across Route 6
Conwell Street/Race Point Road (Provincetown) @ Route 6
The Conwell Street intersection with Route 6 is the main signalized intersection in Provincetown, and is the first traffic signal northbound travelers encounter since the Lawrence Street/School Street signal in Wellfleet. (There are no traffic signals in Truro.) Conwell Street, the southern leg of the intersection, serves as a major access street to the downtown area of Provincetown. Race Point Road, the northern leg of the intersection, provides visitors access to the National Seashore’s Province Lands Visitors Center and Race Point beach. Consequently, it is a very busy intersection including many bicycle and pedestrian movements as well as vehicular movements. Both Route 6 approaches consist of three lanes: left-turn and two through lanes. Conwell Street and Race Point Road each consist of a single approach lane: left-turn/through. All four approaches have island separated right turn slip lanes under yield control. Some of the potential inadequacies, issues, and other observations include at the Conwell Street intersection include: • High-speed mainline Route 6 (especially westbound) traffic is required to stop.
Motorists may have trouble evaluating signal status (these signals are of an older, smaller design than those in other areas), and then decelerating properly from highway speeds.
• Worn pavement markings (stop lines) on minor street approaches • The mainline left turn lanes should be studied and may need to be lengthened. The
Route 6 westbound left turn lane is about 315 feet, approximately 190 feet short of the MHD 1997 Design Manual recommended left turn lane length on a four lane highway. The Route 6 eastbound left turn lane is about 250 feet, approximately 195 feet short of the recommended standard. This situation may be contributing to rear-end crashes at the intersection.
Route 6 Outer Cape Traffic Flow & Safety Study Page 31

Driver making left from through lane
Obscured fog line Figure 12 – View north along Route 6 at the Main Street (Wellfleet) Intersection
Main Street (Wellfleet) & Route 6 The intersection of Route 6 and Main Street in Wellfleet is a three-way intersection with Main Street serving as the main access to downtown Wellfleet from Route 6. This intersection is in close proximity to a small office/retail complex on the east side (opposite Main Street). Due to the large left-turning volume for northbound Route 6, a dedicated left turn lane has been provided. Route 6 is mostly one lane in each direction in Wellfleet. However, it expands to two lanes in each direction near the Main Street intersection (and at the Marconi Road intersection) to provide additional intersection capacity. The Route 6 northbound approach consists of three lanes: left-turn only, through, and through/right-turn. Route 6 southbound consists of a left-turn/through and a through/right-turn lane. The Main Street approach consists of a left-turn lane and a separate right turn lane. Potential inadequacies, issues, and other observations include: • Indication of pedestrian activity with no provision of sidewalks, cross walks or
pedestrian phase. • Northbound and southbound Route 6 through lanes (two lanes each direction) allow
for many vehicles to pass through the light during the green phase but also allow for vehicle passing (in either lane) while traversing the intersection, often accelerating for position before the roadway returns to one travel lane.
• The northbound left turn lane should be studied and may need to be lengthened. The left turn lane is about 235 feet, approximately 275 feet short of the MHD 1997 Design Manual recommended left turn lane length on a four lane highway. This situation may be contributing to rear-end crashes at the intersection.
Route 6 Outer Cape Traffic Flow & Safety Study Page 32

No designated turn lanes Driveway close to intersection
Figure 13 – View along Route 6 southeast toward the Brackett Road Intersection
Brackett Road & Route 6
The intersection of Route 6 and Brackett Road is located in a busy commercial area of North Eastham. Adjacent to and along both north and south approaches there are numerous businesses’ access drives. In addition, Brackett Road serves as the main route to Nauset Light Beach in the Cape Cod National Seashore while also providing access to Eastham’s industrial area and abutting residential areas. While no markings are present, current lane usage in both directions on Route 6 consists of a left-turn/through lane and a through/right-turn lane. Both Brackett Road (on the east side) and Old County Road (on the west side) consist of single approach lanes: left-turn/through/right-turn. Potential inadequacies and other observations include: • Worn pavement markings (stop lines) on minor street approaches • Driveway close to intersection • Left turning traffic blocks through travel for the northbound and particularly the
southbound Route 6 traffic • No turning markings • Signal heads are small
Route 6 Outer Cape Traffic Flow & Safety Study Page 33

No designated turn lanes
Utility pole in sidewalk
i
Figure 14 – View along Route 6 north towar Samoset Road & Route 6
The intersection of Samoset Road and Route 6 is a thlocated in the middle of Eastham adjacent to the Winintersection, located on Route 6, are the Town Hall, Fis the first signalized intersection that motorists encou6 in Eastham. Route 6 northbound consists of two approach lanes: l6 southbound contains a through lane and a through/r(eastbound) consists of one wide general purpose lanone left turn and one right turn lane. Potential inadeqinclude: • Left turning vehicles (Route 6 northbound) block• Driveway access close to intersection including T• Undefined curb cut on south side of Samoset Roa
Route 6 Outer Cape Traffic Flow Page 34
Driveway close to
ntersection
d Samoset Road intersectionree-way signalized intersection dmill Green. Adjacent to the ire Station, and Police Station. This nter traveling northbound on Route
eft-turn/through and through. Route ight-turn lane. Samoset Road e that is often used as two lanes—uacies and other observations
through traffic own Hall and town athletic fields d
& Safety Study

2.4 Community Impacts Changes to the roadway system to reduce traffic congestion or improve safety may have numerous impacts on the community. While not necessarily quantifiable, these may be important enough to require a qualitative analysis. The following issues are explored for each of the alternatives being evaluated: • Pavement Increase: Certain alternatives may involve additional turning lanes or new
road links • Land Taking: Widening may require taking a portion of land near intersections or
roadways • Rerouting: Certain alternatives may require motorists to travel greater distances to
access certain locations • Pavement Reduction: In some limited cases, travel lanes may be eliminated allowing
for other public uses such as landscaping
2.5 National Seashore Visitation The Cape Cod National Seashore is home to some of Cape Cod’s most visited beach, scenic, historic, and recreational destinations. The Seashore experienced about 4.4 million visitations in 2001. The chart in the following figure shows that there has been a decline in recent years from a high of 5.5 million visitations in 1991. Visitations include counts of visitors at many sites throughout the seashore. Each visitor may account for more than one visitation if he/she visits more than one site.
Total Visits (Millions) - Cape Cod National Seashore
5.55.1 5.2 5.3 5.2
4.94.6 4.8 4.9
4.6 4.4
0
1
2
3
4
5
6
7
1991 1992 1993 1994 1995 1996 1997 1998 1999 2000 2001
Figure 15 – Annual Visitation to Cape Cod National Seashore
Route 6 Outer Cape Traffic Flow & Safety Study Page 35

2.6 SAs mentioned earlier, two hour turning movements were collected and the peak hour was used to review one of the signal warrant’s (Warrant 3) applicability to several locations in the study. By relating peak hour information with nearby ATR data, turning movements were factored to more hours which provided data for additional signal warrant analysis (Warrant 1 and Warrant 2). The table below shows a summary of the signal warrant analysis. Detailed information is included in the Appendix.
Table 9 – Signal Warrant Analysis Summary
Roadway Intersections with Route 6
Meets MUTCD Warrant 1 – Eight Hour
Meets MUTCD Warrant 2 – Four Hour
Meets MUTCD Warrant 3 – Peak Hour *
ignal Warrant Analysis
South Eastham Street No No No
Hay Road No No No
Governor Prence Road** No No No
Depot Road No No No
Old State Road No No No
Kingsbury Beach Road No No No
Old Orchard Road No No No
Great Pond Road No No No
McKoy Road No No No
Massasoit Road Yes Yes Yes
Railroad Avenue No No No
Aspinet Road Yes No No
Wellfleet Drive-In No No No
Springbrook Road No No No
West Road No No No
Hemenway Road No No No
Hoffman Lane No No No * Note that this warrant “…shall be applied only in unusual cases. Such cases include, but are not limited to, office complexes, manufacturing plants, industrial complexes, or high-occupancy vehicle facilities that attract or discharge large numbers of vehicles over a short time” and may not be currently applicable.
** Governor Prence Road is recommended to be signalized based on the 1988 study “Route 6 and Governor Prence Road” (by Bayside Engineering Associates for the Massachusetts Department of Public Works). Traffic which currently accesses Route 6 from South Eastham Street and Hay Road would likely use a safer, access-controlled signal at Governor Prence Road instead. With this consolidation, the Governor Prence Road and Route 6 intersection would meet Warrants 1 and 2.
Route 6 Outer Cape Traffic Flow & Safety Study Page 36

Ba n inet Road and Massasoit Road may both qualify to be signalized, as well as the recommended signalization of Governor Prence Road.
s.
sed o the above information, Asp
2.7 Pedestrian Environment Sidewalks and pedestrian crossings are nonexistent in many areas along Route 6. Other problems include lack of snow removal from sidewalks, overhanging vegetation, unusedcurb cuts crossing sidewalks, and obstacles in sidewalks such as signs and utility pole
ee figure below as an example. S
Figure 16 – Utility Pole in Sidewalk and Overgrown Vegetation (West side of Route 6, south of Settler’s Trace in Eastham)
Route 6 Outer Cape Traffic Flow & Safety Study Page 37

Route 6 Outer Cape Traffic Flow & Safety Study Page 38

Route 6 Outer Cape Traffic Flow & Safety Study Page 39
each intersection were then determined and coded into the model network, resulting in an afternoon peak hour model. The network building process also included coding the lane
3. Alternatives Analysis
3.1 Currently Planned Improvements There are current MassHighway plans for improvements at five intersections. These improvements are detailed in a 1997 MassHighway report prepared by Vollmer Associates. Proposed improvements for Route 6 intersections include: • Governor Prence Road: Vegetation removal and re-grading to improve sight distance
on southeast quadrant; install pedestrian wheelchair ramps on northwest quadrant; install crosswalk and stop line on eastbound approach
• Samoset Road: Install new actuation system and update signal timing/phasing including a northbound leading left turn phase; modify Eastham Town Hall entrance drive.
• Nauset Road/Salt Pond Road: Install pedestrian signal heads on west side quadrants; replace existing 8” signal heads with 12” signal heads on Route 6 approaches. Note: CCC Field Observations indicate that sight distance should be improved for the southbound approach of Route 6 north of the intersection.
• Brackett Road/Old County Road: relocate existing signal pole and install signal heads, pedestrian head, and button on northeast quadrant; Install 8’ signal pole and pedestrian head and button on southeast quadrant; install pedestrian heads and buttons on west side quadrants; inspect and replace controller cabinet as necessary.
• Marconi Beach Road: Install 20’ mast arm, signal heads and pedestrian head and button on northeast quadrant; on west side: install pedestrian head and button, replace & service signal head, and install second mast arm and signal heads.
Collectively, the improvements listed above are intended to improve safety for motorists and pedestrians using these intersections. The improvements may be completed by summer of 2004.
3.2 Traffic Flow Modeling The detailed approach used for modeling roadway alternatives is described here. Synchro-SimTraffic, a traffic operations software package from Trafficware, was chosen as the program to analyze operations along the Route 6 corridor. The operations model covered the study area from the Orleans Rotary to just north of West Road in Wellfleet. The first step in the alternative analysis was to develop a baseline which represents future conditions without improvements. To accomplish this, two-hour turning movement counts (broken into 15-minute intervals) were taken at 25 major intersections along the Eastham and South Wellfleet sections of the corridor. Turning movement counts were collected for each 15-minute period from 4 p.m. to 6 p.m. Peak hour traffic volumes for
geometry and corridor speed as well as entering the present signal phasing schemes provided by Mass Highway.
addition to the major intersections, Commission staff determined that there was a need for driveway or curb-cut-related turning traffic along the corridor to be represented in the ba de antify this, the numbers of curb cuts
number trips were assigned to each parcel using the Institute of Transportation
ngineers’ trip generation rates by land use and local knowledge of specific parcels. for each curb cut. These
rmflow r intersections, the Orleans
ide
p
aggana the
n
thesigagg
Theana of these MOEs
the level of service analysis. Level of Service (LOS) is one way to quantify the relative
signalized and un-signalized, is the delay (in seconds) each vehicle ex nce adway or intersection becomes more congested, delay inc es creases. Delay is also available as an MOE or an
fter processing, certain measures of effectiveness (MOEs) were extracted for each
In
se mo l and all alternatives. In order to qubetween the major intersections were counted. Each curb cut was assigned its corresponding land use code from the Town of Eastham parcel database. Next, aof peak hourEThis process provided estimated peak hour turning volumescu b cut turning movements and general locations were then added to the model to give a
ore accurate representation of the effect turning vehicles have on the main line traffic . This resulted in a network that included the 25 majo
Rotary, and two curb cut locations (one for western side curb cuts and one for eastscurb cuts) between each intersection.
A rimary feature of the Trafficware traffic operations analysis package is a capacity-based analysis with detailed levels of service for individual lane groups and also
regate levels of service for entire intersections. In addition to the pure capacity lysis functions of Synchro, a traffic micro-simulation can be created directly from
Sy chro model in a companion software module called SimTraffic. The SimTraffic simulation model generates traffic according to the entered estimated traffic volumes,
n simulates each vehicle as it moves through the network—shifting lanes, stopping for nals, making turns, and ultimately exiting the network. Output includes detailed and regate information on travel time and delay along the modeled corridor.
re are many different “measures of effectiveness” or MOEs that are available to the lyst when using traffic analysis software packages. The most common
iscongestion of a facility by giving it a grade of A-F (A being best and F being worst—see the appendix for more information). The key factor in determining the LOS for an intersection, both
perie s. For example, as the roreas and the level of service de
output to measure network performance and is used later in this report to compare alternatives. (Letter grade LOS information is not reported in this study, but is directly related to vehicle delay estimates.) Aalternative and compared. Specifically, the Commission compared a number of MOEs including total delay (in hours), delay per vehicle (in seconds), total travel time (in hours), and average speed. These MOEs were compared in three different ways. First “Network Total” MOEs were compiled for the entire model network including all curb cuts, side streets, and every link and node represented in the model network. Next “Intersection Total” MOEs were compiled by extracting all the delay at all the
Route 6 Outer Cape Traffic Flow & Safety Study Page 40

approaches of all intersections represented in the model network. This group did notinclude curb cuts and rotary li
nks. (A complete list of the intersections analyzed can be
und in the appendix.) Finally three different “Corridor Section” MOEs were also
s do an
e
. the performance of each network and to account
r random fluctuations in traffic patterns.
ovide a
(seconds) (Mph)
foanalyzed. The first corridor section is from the Rotary north to Samoset Road, the second from Samoset Road to Bracket Road, and the third from Bracket Road to the end of the model network located north of West Road in Wellfleet. The corridor section MOEnot include the impacts from rotary links, side streets, or the curb cuts, yet offerinsight to the impacts of alternatives on the mainline itself. Three randomly generated simulations for each Synchro model were produced using SimTraffic. Traffic is allocated to the entrances of the network based on a distributionover the time length of the simulation. A random number seed can be entered that changes the distribution of traffic entering the network (but maintains total hourly volumcounts) as well as other random events in the simulation. Using three different randomnumber seeds, the base year and each alternative was simulated in SimTraffic three timesThe results were averaged to quantify fo Simulation results for the base year 2001 existing conditions “Network Totals” prstarting point:
Table 10 – Base Year Traffic Performance
Total Delay (hours)
Delay / Vehicle Total Travel
Time (hours) Average Speed
2001 Base Year Network 335 146 812 25
*Note: delay/travel time/speed is for all vehicles in the entire network Once the base model was complete, the next step in alternatives testing was to creatrun a future year condition. The growth rate for the corridor was determined by summarizing historic Automatic Traffic Recorder data from CCC and MassHighway traffic counting programs from 1991 to 2001. This growth rate assumes past annual growth of 1.05% per year will continue for the next 9 years. The figure below showgrowth factor equation.
e and
s the
lumes. impacts
on traffic and delay. Again, three simulations were performed and the results averaged
Growth Factor = (1+.0105)9 = 1.098
Figure 17 – Growth Factor Equation
Future volumes were estimated by applying this factor to the existing Base Year voUsing the estimated future volumes, the same process was used to evaluate the
Route 6 Outer Cape Traffic Flow & Safety Study Page 41

and extracted. Average delay per vehicle along the corridor increased, almost doublin(80%), with consequential travel time increases of 37% and average system speeds dropping 4 mph. This 2010 base year model provides the condition from which alternatives were developed and tested.
Table 11 – Base & Future Traffic Performance
g
below presents the alternatives described in the sections to follow:
Figure 18 – Flow Chart of Alternatives
Total Delay Delay / Travel Time Average Speed
*Note: delay/travel time/speed is for all vehicles in the entire network
(hours) Vehicle (seconds) (hours) (mph)
2001 Base Year Network 335 146 812 25
2010 Base Year Network 604 247 1112 21
The flow chart
Base
A: Intersection Improvements
B: Intersection Improvemen
C: Intersection D: Center
Barrier
F Nuture – “ o Build”
D: Center
ts plus Gov. Prence
Signal
Improvements plus One lane in south Eastham Sensitiv
Barrier < 20%
ity Test
Route 6 Outer Cape Traffic Flow & Safety Study Page 42

3.3 Alternative A – Multiple Intersection Improvements After analyzing the performance of the future year traffic volumes on the existing ronetwork, certain intersection improvements were bundled together to form alternaSome of these intersection improvement
ad tive A.
s were recommended locally through the public meeting process and others were developed after viewing the effects of the future traffic volumes on the exis ments below: • Route 6 @ Orleans Rotary – stripe 2 lanes entering westbound (approx. 150’) • Route 6 @ Samoset orth t turn e • Route @ Depot Roa rthbou s allow Depot Ro• asoit Road – new northbound left turn lane on Route 6 • kett Roa ew southbo eft turn lane on Route 6 • kett Road – new westbound left turn lane on Brackett Road
Orleans Rotary. A ort section of westbound Route 6 was widened from one to two lanes as the roadway
pproaches the rotary. This 2-lane section gives vehicles the ability to take better
Route 6 and Samoset Road The next intersection improvement consi s at Samoset Road which is a signalized intersection. The intersection had a large number of northbound left-turning vehicles: an average of 106 summer-weekday-peak-hour left turns in 2001. As mentioned in Currently Planned Improvements, signa recommended for this location which include incorporation of a leading left turn phase. The proposed alternative compliments the recommended signal upgrade by adding a designated left turn lane and a protected, rather than leading, phase for the northbound left. The Highway Capacity M exclusive left turn lane where fully protected left-turn phasing is provided or where 100 or more peak hour vehicles are expected to make a left turn. Also, the MassHighway Design Manual indicates an exclusive left turn lane is justified where accident experience, existing traffic operations, and engineering judgment indicate a significant hazard or capacity problem. Given the left turn volume, acciden gestion tion, an eis justif f way c prov till tested ld al f the through traffic by the route 6 nort rall s urn at the s Route 6 and Depot Road Also for this alternative nto Depot road, the next intersection immediately north of Samoset Road. This is to prevent blocking northbound through traffic. Drivers seeking to make a left turn onto Depot Road would
ave the benefit of a protected left turn signal and turning lane at Samoset Road. Because of this, the northbound left-turning vehicles (13 during the peak hour) assigned
ting road network. They include the list of improve
Road – new nd – no no
bound lefnd left turn
lane on Routed onto
6 6 ad
Route 6 @ MassRoute 6 @ Brac d – n und lRoute 6 @ Brac
Orleans Rotary he first network improvement considered was on Route 6 at the T
shaadvantage of available gaps in the rotary traffic.
dered wa
l phasing changes have been
anual recommends an
t experience, and conied. Although right o
. The improvement wouhbound lefts and an ove
problems at this locaonstraints exist here, the im
low for less blocking oafer and protected left t
xclusive left turn lane ement was s
ignal.
, no left turns were allowed from Route 6 o
h
Route 6 Outer Cape Traffic Flow & Safety Study Page 43

to int ersection northbound
ehicles on average made this turn in the summer peak hour of 2001. This volume in the ause
t turn storage y 0 or
lusive left
g he left accident experience at this location, an exclusive left turn lane is
oset that seeks to turn left onto Brackett Road
6 vehicles in the 2001 summer peak hour) was given a designated turning lane and Capacity Manual recommends exclusive left turn lanes
endix.
turn o Depot Road were reassigned to the Samoset Road intleft turn movement. Route 6 and Massasoit Road Continuing north, the next improvement is the addition of a left turn storage lane for northbound left turns at the intersection of Route 6 and Massasoit Road. About 143 vfuture grows to 157 vehicles. In the 2010 simulation, this movement was noted to csignificant blocking of Route 6 northbound traffic and the addition of a leflane was also recommended strongly by local Eastham boards. Also, the Highwa
are 10Capacity Manual recommends exclusive left turn lanes where the left turns xcmore vehicles per hour. The MassHighway Design Manual indicates an e
turn lane is justified where accident experience, existing traffic operations, and n ineering judgment indicate a significant hazard or capacity problem. Given te
turn volume and justified. Route 6 and Brackett Road Finally, Alternative A includes modifications at Brackett Road. Much like the Sam
oad alterations, the southbound Route 6 traffic R(7signal phase. The Highway where fully protected left-turn phasing is provided. Also, the MassHighway Design Manual indicates an exclusive left turn lane is justified where accident experience, existing traffic operations, and engineering judgment indicate a significant hazard or capacity problem. Given the signal phasing, accident experience, and congestionproblems at this location, an exclusive left turn lane is justified. In addition to this, two approach lanes were coded for Brackett Road: one designated as a left turning lane andthe other as a shared right turn and through lane. Right of way constraints exist but theaddition of left turn storage at both of these locations allows for safe storage of theturning vehicles and greater flow of traffic through the intersection due to less blocking. A significant amount of delay and blocking was observed at this location in the future base year simulation and the improvements were made in order to identify benefits to intersection performance and the network performance. After coding all of the above changes, this alternative network underwent three iterations of traffic simulation, each with a different random number seed as explained earlier. Then results (MOEs) were extracted, averaged, and are presented in Chapter 4. A more
etailed analysis of the intersection level effects can also be found in the appd
Route 6 Outer Cape Traffic Flow & Safety Study Page 44

Rd
ute 6
ans Rotary Route 6 and Samoset Road
tt Road
6
OrleansRotary
New Rotary Entrance Lane
Route 6 SBNew Rotary Entrance Lane
Route 6 NB New Left Turn LaneNo Left Turn Allowed at Depot Rd
No Lefts Allowed
Depot Rd
Samosett Rd
Route 6
Rt 6 and Orle
New LT Lane
Massasoit Rd
Ro
New Lanes
Brackett Rd
Rou
te 6
New LT LaneRoute 6 SB New Left Turn LaneBrackett Rd WB New Left Turn Lane
Route 6 and Massasoit RoadRoute 6 NB New Left Turn Lane
Figure 19 – Alternative A: Intersection Improvements
Route 6 and Bracke
McKoy
Route 6 Outer Cape Traffic Flow & Safety Study Page 45

3.4 Alternative B – Multiple Intersection Improvements plus Signalizing Governor Prence Road
The second alternative simply builds on Alternative A, described in the previous section, by adding a traffic signal to the Governor Prence Road intersection on Route 6. The signal was added and set up as an actuated uncoordinated traffic signal which was then optimized with Synchro to produce the most appropriate phasing plan. Alternative B was simulated and the results extracted for analysis. The signal produced some additional delay per vehicle, at the intersection, based on traffic delay associated with the light. The results can be seen in Chapter 4 and details are given in the appendix.
3.5 Alternative C – Multiple Intersection Improvements plus One Lane/Turning Lanes in south Eastham
Alternative C, also an offshoot from Alternative A, makes one significant change to the network: reducing the through lanes of Route 6 in south Eastham to one through lane with protected left hand turning lanes and right turn lanes at intersections and curb cut locations. This roadway concept was supported heavily at initial local discussions. Figure 20 – Alternative C: One Lane Section with Turning Lanes
This one-lane concept would run from the Orleans Rotary to just north of Hoffman Lane—in the area with the service stations and the Eastham Post Office, south of Samoset Road. Through traffic would have one travel lane in each direction and opposing left turn lanes would be added to remove all left turners on Route 6, both northbound and southbound, from the mainline through road. Right turning lanes would also be added at intersections allowing a deceleration space for the northbound and southbound right-turning motorists wishing to exit the roadway. Although this alternative does not determine the exact design of such a cross section, the concept allows for the modeling of its effects on traffic. (This alternative does not include a traffic signal at Governor Prence road.)
One Through Lane
Right TurningLanes
Left Turning
Lanes
Rout
e 6
S. Eastham St.
One Lane Route 6 in south Eastham
Route 6 Outer Cape Traffic Flow & Safety Study Page 46

3.6 Alternative D –Center Barrier Alternative D, or the Center Barrier concept, deviated farthest from the existing co ns locall arrier was modeled to test this policy. This alternative
Figure 21 – Alternative D: Center Barrier Turning Areas
In order to apply this concept, designated turning areas were identified and developed in order to allow the redirection of traffic necessary to reach particular destinations. A total
nditio . The concept of allowing no left turns along the corridor was supportedy and an artificial center b
includes allowing no left turns from the Orleans Rotary all the way into Wellfleet at the West Road intersection.
Governor Prence Road Turn Area
Salt Pond Road Turn Area
ckett Road RWest Road
Bra ailroad Ave
Route 6 Outer Cape Traffic Flow & Safety Study Page 47

of des handle this function. From south to north ad, and
ut
nals in Eastham would remain. This center barrier, allowing left turns only at the four signalized intersections in Eastham, creates a complex traffic
away from or eing considered fo otorists to
elters in the case of a weather emergency.
five ignated turn areas were set up tothey are the Orleans Rotary, Governor Prence Road, Salt Pond Road, Brackett Rothe West Road area in Wellfleet. The rotary already acts as a turn around location bother locations need signals and road links to operate effectively. A signal would be added at Route 6 and Governor Prence Road, the Samoset Road signal would be removed, and all other sig
flow scenario. igure 21 s o redirect itself at the designat uthbound traffic wanting to access areas on the eastern side of the corridor would be rerouted via the white traffic flow arrows. In contrast, northbound traffic seeking to access the western side of the corridor would be rerouted via the red traffic flow arrows. Traffic can, of course, also reverse direction at the rotary at the southern end of the corridor. This complex redirection of travel along the corridor produced some extended trips and higher volumes of traffic due to the rerouting. In comparing the traffic volumes at three locations, the redirection and extended trips increased traffic as much as 20 percent. The longer trip lengths and inability to make left turns may deter some of the current traffic that uses the corridor. As an exercise in testing the sensitivity of the network, a hypothetical scenario was developed. Assuming that travelers “learn” to avoid unnecessary rerouting and plan trips efficiently, and that land use adapts to the change in accessibility, a sensitivity test of the Center Barrier with a 20 percent traffic reduction was conducted to test the effects on delay and travel time.
telligent Transportation Systems ransportation System (ITS) applicatio a wide ra ptions to
improve transportation. Currently the National Seashore is developing access strategies that include ITS components. These components propose variable message signs and local advisory radio. The planning for this system has involved the Massachusetts Highway Department and has included discussions that could lead to a Cape-wide ITS. The National Seashore program could begin as early as 2005. A pilot program, which placed a variable message sign at the Salt Pond Visitors Center during the summer of 2002, was very successful. Provincetown has also used variable message signs successfully during major events to advise motorists of parking availability and street closures. This alternative includes supplementing the National Seashore information systems to provide motorists advanced notice of traffic conditions and alternatives such as public transportation. Such systems would also be used for incident management to route traffic
The schematics in fed turning areas. So
how how travel was allowed t
3.7 InIntelligent T ns include nge of o
around accidents, construction, and road closures. ITS is also br emergency management. For example, ITS could help direct m
sh
Route 6 Outer Cape Traffic Flow & Safety Study Page 48

ITS recommendations and further discussion are provided in Chapter 5. No modeling of the effect of ITS on traffic was conducted.
3.8 Public Transit In June of 2002 the Cape Cod Five-Year Public Transportation Plan was published withthree recommendations significant to the Rte. 6 corridor in the Outer Cape. These included the development of service between Orleans and Provincetown, local transportation centers in Orleans and Provincetown, and the establishment of shuttlesserve Outer Cape attractions (such as whale watch cruises) from the mid and upper CapeThe shuttles would use existing parking facilities underutilized in the summer season and on weekends to allow remote parkin
to .
g and a convenient point to board shuttle buses. The oncept of joint ticketing was also recommended to allow one ticket to serve for
d for uld be a
r
d
ll of Holmes Road (a street parallel to Route 6) and new roadway sections north of :
t a oute 6
ents and the speed reduced to mimic a local traffic scenario.
s. In
ation. Therefore, its effects on traffic flow nd circulation were never quantified.
ctransportation and attractions. Several other recommendations were made including bicycle improvements and improvements to the water transportation system that could have some impact on the Outer Cape transportation system. Improved public transit would reduce the neeautomobile travel, increase personal mobility for the non-driving public, and wokey component to be promoted by Intelligent Transportation Systems. Public Transit recommendations are presented in Chapter 5. No modeling of the effect of transit on traffic was conducted.
3.9 Route 6 Bypass One alternative examined early in the study development was a new Bypass roadway foRoute 6 in the vicinity of Brackett Road. This concept was generated from local input and was initially analyzed as a potential roadway scheme. This new roadway was codeas the main through roadway between Old Orchard Road and a conceptual new intersection location north of Oak Road. Crossing Brackett Road, the bypass would use aBrackett Road. As part of this roadway scheme, two new traffic signals would be addedone at the Old Orchard Road/Route 6 Bypass intersection and one north of Oak Road anew northern intersection of the Bypass and Route 6. The remaining section of R(parallel to the new Bypass link) would be retained for local access to existing developm This concept was the only alternative that involved a large new roadway scheme. Afterdeveloping and displaying a preliminary model in Eastham, it was not subjected to further examination due to the substantial impacts to the community, large land taking requirements, and uncertainties regarding land use controls and driveway relocationaddition to these constraints, the public opinion that supported the generation of this alternative was also responsible for its elimina
Route 6 Outer Cape Traffic Flow & Safety Study Page 49
3.10 One Lane Route 6 Another alternative that received some preliminary analysis was a one-lane alternative for the re through the town of Eastham (similar to alternative C). This
ations icts in the
nd do not generate as much turning traffic. Consequently, is one lane concept was incorporated into Alternative C in the area where benefits were
enti Route 6 corridor alternative was set up to test one through lane per direction (both northbound and southbound) with protected left-turn pockets at major intersections and curb cut localong the corridor. Preliminary analysis of this alternative revealed many conflBrackett Road and Eastham Post Office areas due to high left-turning volumes along those sections of the corridor. In those situations the one through lane slowed traffic significantly and extensive blocking was observed. It was because of the resulting queues and delay that the alternative was not pursued further. In contrast, the roadway scheme seemed to have some merit in south Eastham where the curb cuts are more residential, less concentrated, athrealized and then subject to the full analysis using the traffic simulation method.
Route 6 Outer Cape Traffic Flow & Safety Study Page 50

4. Comparison & Evaluation After simulation of all of the alternatives, it was necessary to bring results together to analyze and compare the relative impacts on traffic flow and safety. Results were compiled in three ways: network totals, Route 6 mainline (section) totals, and interstotals.
4.1 Traffic Flow The entire network (modeled road network) includes the Route 6 corridor mainline, all side streets, and their intersection approaches from the Orleans/Eastham Rotary to
ection
West oad in Wellfleet. The chart below shows the total delay (in hours) for both the entire
network and the Route 6 mainline for alternatives compared to the baseline forecast.
R
Total Delay of All Vehicles (hrs)
0
200
400
600
800
1,000
1,200
1,400
2010 A 2010 B 2010 C 2010 D
Route 6 Mainline Network Total
2010 BaseNetwork Total
2010 BaseRoute 6Mainline
Figure 22 – Total Network and Route 6 Mainline Delay Some data highlights are:
• Alternative A has a 50.4 percent reduction in the amount of corridor delay and an 18 percent reduction in total network delay when compared to the 2010 base network.
• Alternative B offers roughly the same amount of savings along the corridor (49
percent) but a slightly increased savings in overall network delay (25 percent).
Route 6 Outer Cape Traffic Flow & Safety Study Page 51

• Alternative C, which includes the one lane section in south Eastham coupled with the intersection improvements from Alternative A, offers both a network delay
vings, very similar to both alternative A and B.
due
back to get to their destinations. The theoretical sensitivity analysis of Alternative D where traffic is reduced 20% showed similar Route 6 mainline performance as alt but better results for the network total.
aking the concept of mainline analysis a step further, the Route 6 mainline was split up into three sections for further analysis. The three sections are listed below and accompanied by their results:
savings and a corridor delay sa
• Alternative D, the center barrier, stands out as failing to reduce delay, likelyto the increased travel cause by driver’s needing to change directions and double-
ernatives A-C A complete listing of the percent improvement or degradation along the corridor and on the network as a whole is shown for all alternatives in the appendix. T
Total Delay of All Vehicles (hrs)
0
100
200
300
400
500
600
2001 Base 2010 Base 2010 A 2010 B 2010 C 2010 D
Route 6 Section 1: Orleans Rotary to Samoset RoadRoute 6 Section 2: Samoset Road to Brackett RoadRoute 6 Section 3: Brackett Road to just north of West Road
Figure 23 – Route 6 Mainline Delay by Section
• The chart above indicates Section 1 of the corridor, the southern most section of
ost
of
Route 6 in Eastham, experiences the most delay in all alternative cases except the center barrier alternative D. This is expected, since this section handles the mtraffic.
• The over 100% increase in Section 3 delay from the base year to 2010 indicates
this section will be impacted the most by future traffic if nothing is done. Most
Route 6 Outer Cape Traffic Flow & Safety Study Page 52

the delay increase along this corridor section is attributable to the expected 158 percent increase in total delay at the Brackett Road intersection. In Alternativesand B, the addition of capacity at this location significantly reduces this delay.
A
Total inpresent each approach roadway
f each intersection and does not include curb cuts, side streets, and some mainline links.
• “Total Delay,” expressed in hours, is the sum of all delay of all vehicles at all
• “Delay/Vehicle,” expressed in seconds, is the average delay per vehicle during the study hour at all intersection approaches.
• “Travel Time,” expressed in hours, is the total amount of time, including delay
time, all vehicles spend traveling through the intersections during the study hour.
• “Average Speed,” expressed in miles per hour, is the average speed of all vehicles through all of the intersections in the network during the study hour.
Table 12, although a summation of all intersections, provides a starting point for looking at the impacts at individual intersections in the network. Tables of delay, time, and speed at all individual major intersections for all alternatives tested are available in the appendix.
• In Alternative D, the center barrier corresponds with a break down in section 2 of
the corridor.
tersection traffic flow performance generated by the various alternatives is ed in Table 12. It is a summary of traffic performance on
oThe terms are:
study intersections along the Route 6 corridor from South Eastham Street in Eastham to West Road in Wellfleet during the study hour.
Route 6 Outer Cape Traffic Flow & Safety Study Page 53

Table 12 – Summary of Traffic Delay for Alternatives at Intersections sections Total
Delay Delay/Vehicle
(seconds) Travel Time
(hours) Average
Speed (mph) All Inter
(hours) 200
1 BASE SE (Future No-b
96 170 25 70
2010 BA uild) A: INTERSECTION IMPROVEMENTS
B: INTERSECTION IMPROVEMENTS
+ SIGNAL OV. PRENCE G
C: I EIMP VLANE IN
NT RSECTION RO EMENTS + ONE
SO. EASTHAM
ER BARRIER D: CENT E: C T
EN ER BARRIER <20%
*No d Some h
increase in travel time
cast.
• Alternative B (adding areduces overall intersecand by 49 percent over
• Alternative C reduces d
travel time savings.
• The center barrier alter2010 base. This increadesignated turning areatraffic volumes to rise bcoupled with the projecdoubles. With no left tto increase but this doetravel time of 53 percen
te: elay/travel time/speed is
ighlights of the analysi
• In 2010 if nothing wereat all intersections) is p
• When the signal impro
percent reduction in totfore
Route 6
159
89
and a 12 perc
traffic light tion delay by
the 2010 Bas
elay over the
native (Alternse is largely ds and reversey roughly 20ted future yeurns alloweds not offset tht.
for all vehicle
s are as follow
done (i.e., Frojected to in
vements bundal intersectio
Outer Cape TrPa
206
115
124
373
ent reduction in
to the bundled an additional e.
2010 base by
ative D) increaue to drivers f direction to re percent. Whear volume, the on the corridore increased de
s in all intersecti
s:
uture No Buildcrease by 115 p
led in Alternatn delay over th
affic Flow & Safege 54
267
190
197
407
the average sp
package of Alte3 percent over A
44 percent with
ses delay 89 porced to loop arach their destinn this volume idelay per vehic, the average splay resulting in
ons in the netwo
), modeled delaercent, causing
ive A are introde Future No Bu
ty Study
22
86
122
197
2581
2523
17
300102
137
196
2557 percent eed.
ario is
rnative A), lternative A
a 26 percent
ercent over the ound ation causing ncrease is le almost eed is expected
an increased
rk
y per vehicle ( a
uced, a 46 ild scen

• r tterns and choo to 6 to t ility to
make left turns along the Eastham s mentioned above, Alternative D shows Route 6 traffic may increase by roughly 20 percent due to necessary re-
ing. Combining Al tive D w 20 percent less base traffic to represent a shift in driving patterns, shows a 36 percent reduction in delay when compared to
d a d percent ease in average speed. However, it is hether assumption of a 20 percent traffic reduction is reas nable.
he alternat es shows each offers different benefits and different costs e, and speed. The tables and charts in this section offer some
erformance of the future year traffic and the conceptual alternatives. rmation and perform reports ar uded in th ppendix. not the y measur hich the rnatives were evaluated.
mpacts on the commun d safety a cussed in ollowing ections.
4.2 Safety Improvement
ement for Streets and Highways (1982) ussions on various vehicular access
ea e Data us
olume y have milar characteristics to two of the FHWA guide’s techniques:
“TechnTechn Install alternating left-turn lane”
A r lexperie corrido d to result in an annual reduction of 8.1 rashes per mile. Technique D-3 is predicted to result in an annual reduction of 5.1
cras sdiscuss
4.3 Costs f ay construavailabconditi ork (drainaand estfurther. n below in Table 13.
If a center barrier (Alternative D) is built, a number of drivers may alter theitravel pa se not use the Route corridor due heir inab
section. A
rout
the Future No Buil nuncertain w
o
The testing of all tin terms of delay, travel timresults on the p
iv
Additional detailed infoHowever, traffic flow isEach alternative has is
terna ith
a 14 incr
ance e on w
e inclse alte
e A onl
ity an s dis the f
To help quantify the benefits of various safety treatments, Federal Highway Administration’s (FHWA) guide Access Manag
as consulted. The FHWA guide includes discwtr tm nts and predictions of “Accident Reduction.”
ed by the guide include the number of driveways per mile, highway traffic , and driveway traffic volume. Alternatives being considered in this studv
si
ique A-1: Install median barrier with no direct left-turn access” ique D-3: “
esu t of the crash analyses performed for the study shows Route 6 in Eastham
nces about 21 crashes per mile annually. Based on the parameters of the Route 6r in Eastham, Technique A-1 is predicte
che per installation. Safety improvement is included in the evaluation matrix
ed in the next section.
Costs or the alternatives were estimated based on a summary of costs for highwction projects in Massachusetts. Where Massachusetts cost data were not le, data supplied by California DOT was utilized and adjusted to reflect local ons. The cost data was adjusted to account for traffic control, supplemental wge and utilities), and contingencies. These cost items would be further defined imated more precisely if the alternatives and design elements are developed The cost summary is give
Route 6 Outer Cape Traffic Flow & Safety Study Page 55

4.4 The folflow, sa
Alter
(hours) Crash
t $1,000’s
Evaluation Matrix lowing table presents a comprehensive evaluation of major issue areas: traffic fety, community impacts, and cost.
Table 13 - Evaluation Matrix native Total
Delay Predicted Annual
Pavement Increase?
Pavement Decrease?
Land Taking?
Re-Routing?
Cos
Reduction Future No Build 604 A: Multiple Intersection Improvements
496 4.6 Possible Possible Minor 417
B: Multiple Intersection Improvements + Signal Gov.
455 4.9 Possible Possible Minor 717
rence P
C: One Lan nin
475 45.4 Possible Potential Possible Minor-moderate
567-1,717 e/Tur g
Lanes D: Center Barrier 1143 48.6 Likely Likely Major 9,000 E: Center Barrier <20%
249* 48.6 Likely Likely Major 9,000
(*assumes a 20 percent reduction in traffic volumes)
Route 6 Outer Cape Traffic Flow & Safety Study Page 56

5. Conclusions & Recommendations The following sections include a summary of recommendations that range from minor/non-structural to majo
5.1 The 3 E uca for n ri
to tr flow an safety are most successful and sustainable when all ngredien e prese These are discussed in the following sect
Education
mpaigns are important in helping motorists understand how to use the fely. Such a campaign would use media outlets, roadway signage, and other
nity outreach efforts to deliver the message that people using Route 6 need to be s, obey traf ws, an ve de .
in infor n targ fferent sers at d t sta trave
e-Trip
r changes in the roadway system.
’s: Ed tion, En cement, a d Enginee ng
Improvements affic dthree “E” i
ts ar nt. ions:
5.1.1
Information caroadway sacommucautiou
fic la d dri fensively
Messages could clude matio eting di u ifferen ges of l: • Pr : Newspaper, magazine, internet, and other sources could give an overview of
ions, and route planning; best times to travel; and alternative modes of transportation.
• En-Route
travel on the corridor for speed limits, turn restrict
: Variable message signs and highway advisory radio could help travelers decide among a choice of destinations (e.g., different National Seashore beaches may have full parking lots), and remind travelers of safety issues such as negotiating a rotary.
• Along the Corridor: Signage to support safe & efficient travel regarding speed limits, directions to destinations, etc.
A number of improvements that could be quickly implemented include installation of new signs, replacement of existing signs with larger signs where appropriate, and pavement markings. MassHighway, as the responsible agency, should consult with the towns of the Outer Cape to provide better signs for schools and beaches. In addition, a sign inventory may be needed as a follow up to this study by identifying excess signage or insufficient signage along the corridor. Additional recommendations on signage and information systems are presented in several of the following sections.
5.1.2 Enforcement
The Eastham Police Department and the Massachusetts State Police have dedicated significant time and cost in reducing hazardous driving behaviors. Visible enforcement of speeding and traffic control laws is designed to increase motorist awareness. Continuing and increased efforts in enforcement will help to prevent future safety problems and crashes. The Eastham Police have indicated the number of crashes along
Route 6 Outer Cape Traffic Flow & Safety Study Page 57

Route 6 in 2001 was lower than in previous years. This type of enforcement effort could afety along the corridor.
s mentioned earlier, MassHighway has plans in place for improvements at five tersections along Route 6. These improvements are engineered to improve safety for
mo ts 2004. Many of the ther recommendations listed in this Chapter involve engineering solutions. Engineering
ity list are also included. Also cluded in this section are improvements to the Orleans Rotary and its intersection with
In sp
•
• northbound exclusive left turn lane
t
support of MassHighway’s scheduled improvements, or to be included in later efforts at this intersection, the following suggestions are offered based on the issues identified in
be pursued in other towns to help improve the s
5.1.3 Engineering
Ain
toris and pedestrians and may be completed by the summer of oimprovements to eliminate traffic conflicts, remove turning traffic from through lanes,and eliminated bottlenecks would help to reduce traffic delay and vehicle emissions as
ell as improve safety for the motoring public. w
5.2 Recommendations for Selected Intersections & Rotary This section contains suggestions to improve safety and traffic flow at Route 6 “priority intersections” (discussed in Chapter 2) and other intersections. General safety improvements that are relevant to all tiers of the priorinRock Harbor Road.
5.2.1 Samoset Road: Eastham - [priority intersection]
upport of MassHighway’s scheduled improvements, or to be included in later im rovements at this intersection, the following suggestions are offered based on the issues identified in Chapter 2:
Implement access management (move town hall curb cut to southernmost point of the parcel)
• Extend curbing on Samoset Road (south side) from Route 6 to the west for 30 feet Study and consider installing a
5.2.2 Massasoit Road: Eastham
For later improvements at this intersections, study and install a northbound exclusive lefturn lane to reduce rear-end crashes and to reduce traffic congestion cause by northboundvehicles awaiting southbound gaps to make left turns.
5.2.3 Brackett Road: Eastham - [priority intersection]
In
Chapter 2: • Repaint Stop Line on Brackett Road approach • Replace signal heads with larger units for improved visibility • Add pedestrian phase and signal • Study and consider installing a southbound exclusive left turn lane
Route 6 Outer Cape Traffic Flow & Safety Study Page 58

• Study and consider installing a westbound exclusive left turn lane
5.2.4 Main Street: Wellfleet - [priority intersection]
The following suggestions are offered based on the issues identified in Chapter 2:
5.2.5 Conwell Street: Provincetown - [priority intersection]
The following suggestions are offered based on the issues identified in Chapter 2: •
5.2.6 Governor Prence Road: Eastham
Signasetts
s via Gov. Prence Road Extension and left turn at new signal
• W fe traffic flow (per 1988 study)
summer weekend traffic accessing the Fort Hill CCNS area. The Vollmer study also did not account for traffic which currently avoids this intersection due to safety and congestion issues.
• Is r Highway dated 6/8/1998
s location and further review is justified. Traffic ted to West Road
for access to Route 6 northbound.
• Add pedestrian crosswalks, phase, and signal • Replace signal heads with larger units for improved visibility • Shorten right lane at Route 6 northbound approach to match length used for
southbound approach • Study and lengthen northbound Route 6 left turn lane to meet MHD criteria
Replace signal heads with larger units for improved visibility • Repaint stop lines on minor street approaches • Provide “Red Signal Ahead” warning for Route 6 approach from Truro • Study and lengthen Route 6 left turn lanes to meet MHD criteria
lization is recommended. Reasons include: • The 1988 Study: “Route 6 and Governor Prence Road” prepared for Massachu
Department of Public Works by Bayside Engineering Associates • Safety concerns • Would allow pedestrians & cyclists to safely cross Route 6 (Cape Cod Rail Trail is
approximately 1/2 mile to the west) • Would improve access to the heavily visited Fort Hill (CCNS) area
ays • Would create gaps in traffic stream for nearby roadways and drivew Would allow northbound vehicles to reverse direction via right turn•
ould include turn restrictions for sa• 1997 Vollmer study recommends a detailed study and functional design report of the
intersection to verify that the intersection meets MUTCD warrants for a traffic signal. Specifically, the Vollmer study did not include peak
suppo ted by Cape Cod National Seashore (letters to Massand 12/4/2001)
• Is supported and called for by the public
5.2.7 West Road: Wellfleet
Signalization may be necessary at thiexiting Wellfleet Drive-In/Theater/Flea Market complex would be direc
Route 6 Outer Cape Traffic Flow & Safety Study Page 59
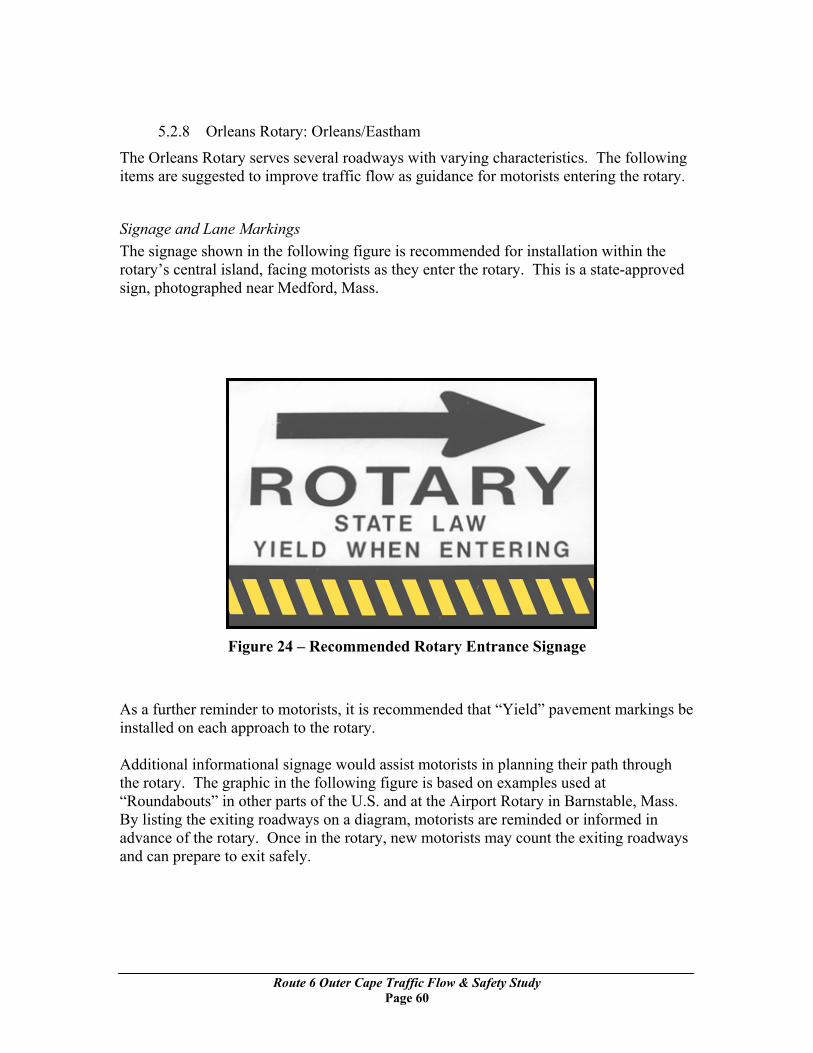
5.2.8 Orleans Rotary: Orleans/Eastham
The Orleans acteristics. The following otary.
The signage shown in the following figure is recommended for installation within the pproved
ign, photographed near Medford, Mass.
ins Adthe
By listing the exiting roadways on a diagram, motorists are reminded or informed in motorists may count the exiting roadways
nd can prepare to exit safely.
Rotary serves several roadways with varying charitems are suggested to improve traffic flow as guidance for motorists entering the r
Signage and Lane Markings
rotary’s central island, facing motorists as they enter the rotary. This is a state-as
Figure 24 – Recommended Rotary Entrance Signage
As a further reminder to motorists, it is recommended that “Yield” pavement markings be
talled on each approach to the rotary.
ditional informational signage would assist motorists in planning their path through rotary. The graphic in the following figure is based on examples used at
“Roundabouts” in other parts of the U.S. and at the Airport Rotary in Barnstable, Mass.
advance of the rotary. Once in the rotary, newa
Route 6 Outer Cape Traffic Flow & Safety Study Page 60
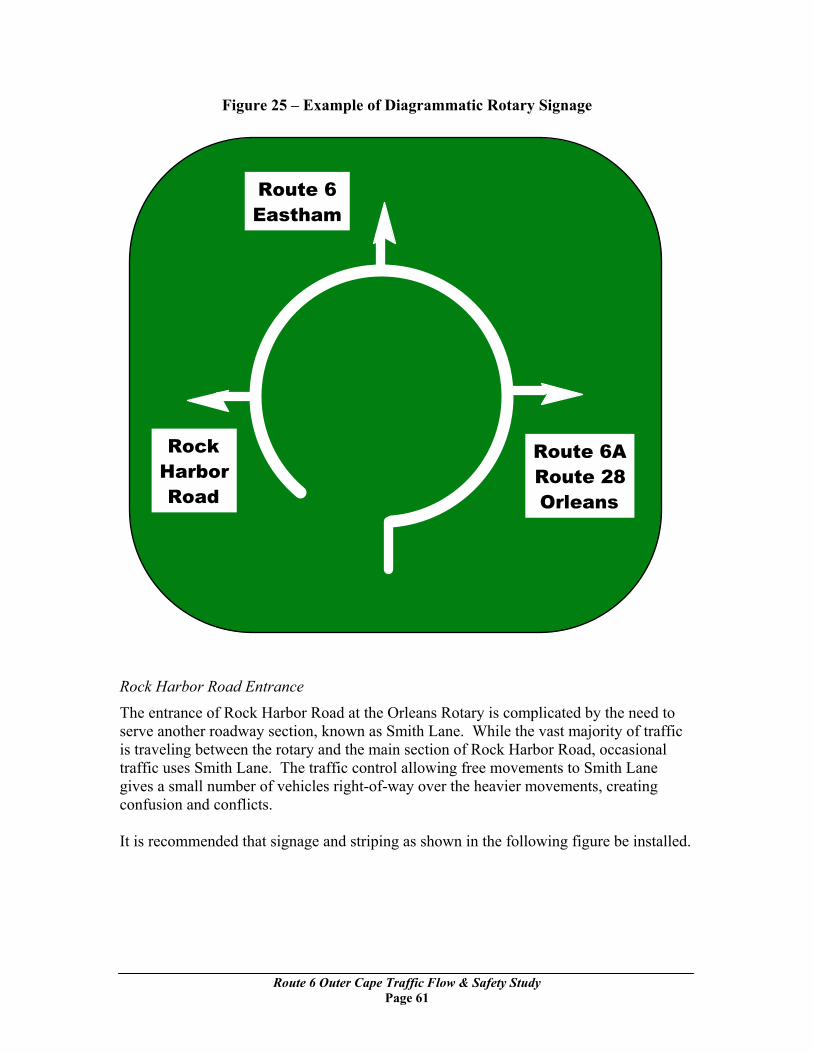
Route 6 Eastham
Route 6A Route 28 Orleans
Rock Harbor Road
Figure 25 – Example of Diagrammatic Rotary Signage
ock Harbor Road Entrance
Smith Lane. While the vast majority of traffic traveling between the rotary and the main section of Rock Harbor Road, occasional
reating
R
The entrance of Rock Harbor Road at the Orleans Rotary is complicated by the need to serve another roadway section, known asistraffic uses Smith Lane. The traffic control allowing free movements to Smith Lane gives a small number of vehicles right-of-way over the heavier movements, cconfusion and conflicts. It is recommended that signage and striping as shown in the following figure be installed.
Route 6 Outer Cape Traffic Flow & Safety Study Page 61

Route 6 Outer Cape Traffic Flow & Safety Study Page 62
Figure 26 – Improved Signing and Lane Marking at Rock Harbor Road / Orleans Rotary
Summary of Rotary Improvements • Stripe double yellow line from Rock Harbor Road to the Rotary
• Improve “Do Not Enter” signs on rotary at Rock Harbor Road Install “YIELD” marking on pavement entering rotary
s per design used in Medford, MA or other similar
adway Configuration lthough improvements to signage, ongoing enforcement of driver behavior, and
significant physical improvements may be needed in the long term. For example, Chapter 4 shows that a one-lane section in south Eastham may offer additional delay savings and may also reduces crashes. Although other considerations may affect the viability of this alternative, it demonstrates long term review of major roadway changes is warranted.
•• Improve Rotary Yield sign
nationally accepted signage • Consider adding entry flaring (which allows for two vehicles to enter during a gap in
the traffic stream) for the westbound approach of Route 6. A discussion of this concept is available in Roundabouts: An Information Guide (FHWA, June 2000).
5.3 Long Term RoAengineering improvements to key intersections may both improve safety and traffic flow,

5.4 Local Comprehensive Plans (LCP’s) and Regional Policy Plan The Local Comprehensive Plans for the four Outer Cape towns and the Regional Policy Plan developed for Cape Cod were reviewed to confirm that the improvement recommendations of this study are consistent with local and regional planning policies. Several common transportation policies were found that are consistent with the recommendations of this study. In addition to the transportation policies, common development and land use policies that reduce traffic impacts are listed below. It is recommended that these LCP policies be emphasized in future decisions by the Outer Cape towns to help preserve the capacity and improve the safety of the Route 6 corridor.
5.4.1 Land Use Recommendations
• The Outer Cape LCP’s encourage compact development such as cluster development and, where appropriate, mixed-use residential/commercial development. This type of development should be given preference by the towns in order to minimize further land consumption and to protect open space. Compact, mixed-use developments reduce the need for trips outside the development area and this study, in particular, supports policies such as these.
• The towns should amend zoning by-laws to add language on curb cut control. • The towns should amend zoning by-laws to establish a multi-category threshold that
would trigger special permit review of large traffic-generating commercial and mixed-use developments (if not subject Cape Cod Commission review).
• The towns should amend zoning by-l eate a definition of strip development
and make it a prohibited use in tables of regulations.
entives for shared uncture of two lots
ransportation Recommendations: Route 6 Corridor
at de
roperty tax revenue, new development
s to
ments and make recommendations for the accomplishment of these
aws to cr
• The towns should develop a zoning amendment that provides inc
access to developments by way of reduced side lot lines at the jsharing access and/or reduced parking requirements.
5.4.2 Land Use-Related T
• Development of access management by-laws; development of collector roads linking commercial developments with Route 6; additional left turn lanes along Route 6 locations where signalization may be needed in the future. This work should inclucost estimates and funding sources, such as pimpact fees, and state transportation funds.
• Transportation improvements for Route 6 should include incorporating changes to
reduce the number of conflicts with access, and adjusting land use in the Towneliminate the need for additional through lanes.
• The Towns should identify areas in need of curb cut reductions and/or access
improve
Route 6 Outer Cape Traffic Flow & Safety Study Page 63

reductions to the Massachusetts Highway Department. In addition, a Site Plan
Manual, adjacent to development or redevelopment as LOS C based on summer peak hour traffic volumes. Development or redevelopment should not degrade LOS below th l w this, the development or redevelopment
•
ents include maintaining historic footpaths, establishment of links to regional bicycle networks, and bikeways between existing
tions include plowing snow from sidewalks, brush and tree trimming, removal of unused
Acrg g roadway capacity which sults in continued economic viability of adjacent land development. The LCP's
recog e
e rroamenex
5.5 Access Management Program A nt wh ould include
Review process that addresses curb cut reductions and access control should be developed.
5.4.3 Transportation/Development Review Policies
• The transportation section of several LCP’s and the RPP define the future minimumperformance standard or Level of Service (LOS), as defined by the Highway Capacity
is leve and where existing LOS is beloshould maintain or improve the existing LOS.
Other policies in the LCP’s promote alternative transportation, and development of bicycle and pedestrian amenities. Specifically mentioned items to be provided by development are bus turnouts, taxi stands, park and ride lots, and related facilities. Bicycle and pedestrian improvem
subdivisions. • Sidewalks and pedestrian crossings are nonexistent in many areas of the corridor.
Development of pedestrian amenities as well as better maintenance and considerations for existing facilities must be considered. These considera
curb cuts, and maintaining obstacle free corridors (for example, locating signs and utility poles so they do not obstruct sidewalks).
5.4.4 Access Management
cess management is essential to many of the recommendations presented above. It anizes traffic movements to make better use of existino
renize th importance of consolidating driveways, limiting curb cuts, and shared
parking facilities and driveways. Additional measures include right turn only access and g ess, development of appropriate driveway and roadway spacing guidelines, collector
ds, regulation of maximum driveway widths, and controlled left hand turns via dians and signals. Access Management recommendations are discussed further in the t section.
n ongoing priority is to implement and continue to use principles of access managemeen reviewing land use decisions. This program w
• Frontage Requirements: increasing the minimum frontage required for propert
development, redevelopment, and subdivision along Route 6 would alleviate sy ome
Route 6 Outer Cape Traffic Flow & Safety Study Page 64

future safety concerns and may help to reduce the future intensity of traffic generation. Incentives to• Share Access: for adjacent parcels, combining and therefore reducing the number of driveways would improve safety. Financial incentives or partial relief of zoning requirements (e.g., smaller shared sideline setbacks, allowing increased lot co
• Land Conservationverage) should be considered.
: public acquisition and protection of parcels along Route 6 would
• eliminate these parcels’ future safety and traffic impacts. Limit Access: Enforce “No Access” line for property with frontage along sections of Route 6 in Truro and Provincetown
.6 Recommendations Related to Older Dri
5 vers relatively large and increasing percentage of Outer Cape drivers are 65 years of age
diffma Mocra age 80 and older drivers, more than 50% of fatal crashes occur at
tersections, compared with 24% or less for drivers up to age 50. Based on observation,
n on
pt.
The following suggestions are recommended as considerations for roadway
be
o be
in delineation through more frequent reapplication of lane/shoulder ma
Improve lighting level standards, in particular at intersections, while taking to
e
Aand older. Many of this steadily increasing proportion of drivers will experience
iculty in operating a motor vehicle as they age. This increasing difficulty will, in ny cases, overwhelm the wisdom gained from lifetime driving experience.
st Cape Cod intersections are at grade. Based on Federal Highway Administration sh statistics for
intypical at-grade intersection difficulties for older drivers include:
• Left Turns – older drivers often lack sufficient caution and have poor positiothe road during the turn.
• Stopping – older drivers often fail to stop, fail to make complete stops at stop signs, and have stops that were jerky or abru
improvements to address the elderly population. Many of these recommendations are from FHWA’s Older Driver Highway Design Handbook, January 1998, which should consulted for more details. The Handbook includes other recommendations and guidelines that should be considered in Cape roadway design; but their use should alstempered with maintaining the character of Cape Cod’s roadways:
• Incorporate protected left turn phases into signalized intersections—The protected“green arrow” left hand turn has been identified as an important improvement for older drivers.
• Maintarkings and street cleaning
• Improve signage standards to include larger lettering (some larger street signs have recently been installed on Route 6 in Eastham) •
into account community character and spill-over effects. Standards need include consistency of illumination as well as level of illumination. Nighttim
Route 6 Outer Cape Traffic Flow & Safety Study Page 65

driving is associated with a higher crash risk for all drivers. The effeaging
cts of on sight are particularly compounded during darkness.
5a
ITS alternative introduced in section 3.7. Proposed Route 6 variable message signs hould likely be located
• ions along Route 6 in the lower
that parking
availability would also be displayed. d
d by a system of motely accessed cameras and, at select locations, loop detectors to monitor traffic
volumethrough ip planning based on real-time traffic conditions. The ITS the National Seashore, and other omponents of a Cape-wide ITS would be operated by MassHighway. Initially, the ITS
er proposed
part of the Cape Cod ive-Year Public Transportation Plan discussed in Chapter 3.
5
The r f Orleans, along Rt. 6 past the National Seashore to Provincetown (and return). Con c , and the e is a significant market for residenespecially apublic meethe five Outer Cape towns are over 60 years of age. It was stated that local and express
• Give consideration to placing utilities underground and installing breakaway safety poles for lighting.
• Extend “all-red” clearance phases for signalized intersections
.7 Intelligent Transportation Systems (ITS) Tr veler information provided by variable message signs is recommended as part of the
s
East of exit 9 to advise eastbound motorists of conditCape and beyond as well as outline transportation alternatives including the mini transportation center currently being discussed for the Orleans area.
• North of the Orleans Rotary to advise northbound motorists of transit alternatives would include remote parking and beach shuttles. Roadway congestion and
• West of the Orleans Rotary to advise westbound motorists of roadway conditions ancongestion approaching and at the bridges.
Input for the traffic and parking conditions will need to be providere
s and speeds. This information would be available on the World Wide Web and SmarTraveler to allow tr
components proposed here, those proposed forcsystem would be operated locally. As the system expands and joins with othsystems, ITS functions would migrate to a Southeastern Massachusetts ITS control center.
5.8 Public Transportation Several recommendations have been developed for the study area asF
.8.1 Orleans to Provincetown Transit Service
O leans-Provincetown proposal is a bus route which will run from the center o
ne tions could include the National Seashore Salt Pond Visitor Center and beaches Provincetown-Truro Shuttle. Research suggests therts, tourists, and workers who need access to retail and commercial facilities
t either end of this route, but are presently under-served. Moreover, during tings in Eastham, it was noted over 40 percent of the year round residents of
Route 6 Outer Cape Traffic Flow & Safety Study Page 66

transit thro ty needs of re Currently, local routes are being proposed on a town-by-town basis to serve local attr i vity centers. These
utes are being designed with seasonal and year round needs in mind. They will be integrated with the larger regional routes such as the proposed Orleans to Provincetown rou d
ing ek and Sundays during the summer) and an 80-mile service per
und-trip. Estimates are given from a minimum of four round-trips to a maximum of
priv his rou
Esti
ughout the Outer Cape will be a necessary component in meeting the mobilisidents, especially the elderly.
act ons, seasonal housing, hotels, neighborhoods, schools, and actiro
te an the private intercity bus service. Orleans-Provincetown corridor cost estimates (given below) are based on 325 operatdays (service 6 days a weroeight round-trips per day. At the present time, it appears regulatory issues exist regarding
ate carrier operating rights along this corridor. The designation of an operator of tte is expected to be the subject of negotiation.
mated Services & Annual Costs: 4 Round-trips 6 Round-trips 8 Round-trips ans-Provincetown Corridor $273,078 Orle $409,617 $546,156
5.8.2 “Attractions” Shuttles
le-tions
ds rivers cruising the streets to find the very few non-metered spots adding to the
e a shuttle bus program operating from the Hyannis Transportation Center to the Barnstable Park and Ride, and ultimately to Provincetown that would also make int ould not eliminate Route 6 congestion, it would
To be i ative agreements between a privat viders, and Outer Cape
g facility,
Another proposal is to provide ride-sharing services that would be marketed to “whawatchers” heading for Provincetown excursions as well as to other Outer Cape attracsuch as the National Seashore. These potential customers generate thousands of vehicle miles of travel throughout Cape Cod. The cost of parking lots in Provincetown senddowntown traffic congestion. By creating a service that allows individuals to access reliable and timely service from major locations in the mid- and Outer-Cape starting in Hyannis to the various private whale-watching operations and other attractions, there should be a significant reduction in vehicle traffic. One such recommendation is to introduc
ermediate stops. Although this wrepresent an initial attempt in achieving a longer-term goal of moving people into higher occupancy vehicles.
effect ve, the program needs to operate on coopere bus company or the Cape Cod RTA, parking pro
attractions. The program will be most effective if joint ticketing can be implementedsuccessfully. As an example, an individual could park at a Hyannis area parkinboard a shuttle to one of the various whale-watching locations, and board a guide boat allon one ticket. This allows for connectivity throughout the program that benefits customers, businesses, and local residents who would have a less congested transportation system.
Route 6 Outer Cape Traffic Flow & Safety Study Page 67

5.8.3 Local Transportation Centers
he key to improving public transportationT is connecting existing services and ity to coordinating existing and proposed services. This process requires a physical facil
allow these coordinated connections to occur. The centers would be designed to support the public and private transportation services in the area and would have amenities such as information kiosks, shelter, restrooms, and bicycle storage facilities and, where appropriate, parking. Two areas in the Outer Cape are expected to require transportation centers to support public transportation. These facilities would be in addition to the recently completed Hyannis Transportation Center, and would be developed at a much smaller scale. The recommended facilities are to be located in the following areas: MacMillan Wharf: This facility would serve as a linkage between the expanding ferry ervice at the wharf, local transit service, express bs
seus service, and potential shuttle
rvices. The facility has promise to be developed as a joint private/public partnership , s i w ,
mosphe stratio .
Orlea
with the local chamber of commerce local businesse ncluding whale atch companiesand the National Oceanic and At ric Admini n (NOAA)
ns: Thi facility would provide s transfer options and connections between modes, and increase accessibility to the National Seashore and Provincetown. The connections
s lso
ity
ing
to support planned activity centers. The development of attractive onnections between planned local services and the more regional services such as the
er
fic flow and the four towns. All Short Term recommendations are carried
rward into the Medium Term and again to the Long Term. Likewise, recommendations from the Medium Term are carried forward to the Long Term. Each recommendation is
envisioned are between the existing Hyannis to Orleans Line, the proposed service between Provincetown and Orleans, and the proposed shuttle services to Outer Cape attractions.
5.8.4 Roadway & Intersection Improvements
In the design of intersections and roadway improvements, amenities such as bus turnoutand passenger waiting areas must be considered. Provision of such amenities should abe included in all new development and encouraged for existing businesses and activcenters, where appropriate. The locations of these improvements should be coordinated with the long range plannfor Outer Cape future transit service (currently underway) as well as with local comprehensive plans cPlymouth and Brockton service will be important in the success of transit for the OutCape.
5.9 Action Plan The following table presents a summary of recommendations to improve trafsafety along Route 6 info
Route 6 Outer Cape Traffic Flow & Safety Study Page 68

furthe o to affect the physical roadway and stribution
r catal gued according to its likelinessintersections; changes to public transit service; need for communications and diof information necessary for systems management; or planning initiatives within the region.
Route 6 Outer Cape Traffic Flow & Safety Study Page 69

Table 14 - Summary of Recommendations
Location
Improvement/ Description Time
Frame
Benefit Cost
$1,000Area-wide Education: Information campaigns
including media and signage to encourage safe driving and alternate mode use
Short Term & Continuing
Safety & Mobility
N/A
Route 6 Corridor Enforcement: Highly visible enforcement of speed limits, red light running, etc.
Short Term & Continuing
Safety N/A
Area-wide and in adjacent areas
Intelligent Transportation Systems: Dissemination of traffic flow, parking, and safety information in real-time via Highway Advisory Radio, Variable Message Signs, and Internet
Short Term & Continuing
Safety & Mobility
N/A
Route 6 corridor – Orleans to Provincetown
Orleans to Provincetown Transit Service: connecting to National Seashore, beaches, etc.
Short Term & Continuing
Mobility 273 to 546
Route 6 and other corridors – Hyannis to Provincetown
“Attractions” Shuttles: Provide ride-sharing service for Provincetown excursions, National Seashore, other attractions
Short Term & Continuing
Mobility N/A
Rt 6 Intersections: Samoset, Brackett, Main, Conwell, Gov. Prence
Various improvements including upgrades to lane markings, signal heads, access management, pedestrian phases and crosswalks. See section 5.2 for more detail.
Medium Term
Safety & Traffic Flow
N/A
Eastham/Orleans Rotary
Improvements to rotary signage and pavement markings at the Rock Harbor Rd entrance
Medium Term
Safety N/A
Route 6 Corridor Access Management: Increase frontage requirements, provide incentives to share access, increase land conservation, and enforce “No Access” line in Truro/Provincetown
Medium Term
Safety & Traffic Flow
N/A
Area-wide Older Drivers’ Recommendations: incorporate protected left-turn phases, frequent restriping and street cleaning, larger signs, improved and consistent lighting
Medium Term
Safety N/A
Route 6 Corridor Provide bus turnouts and shelters at strategic locations (to compliment local services and destinations)
Medium Term
Mobility N/A
Route 6 – Eastham/Orleans Rotary to Eastham post office
Lanes for left turning vehicles plus single through travel lane. Signalization at Gov. Prence Rd
Long Term Safety & Traffic Flow
567 to 1,717
Provincetown, Orleans
Local Transportation Centers: Construction of facilities near MacMillan Wharf and downtown Orleans to provide connections with local and express bus service, information kiosks, etc.
Long Term Mobility N/A
Route 6 Outer Cape Traffic Flow & Safety Study Page 70