round up - food and agriculture organization · round up since the october issue of the rmm, fao...
TRANSCRIPT
www.fao.org/economic/RMM [email protected]
VOLUME XX ISSUE No. 4
December 2017
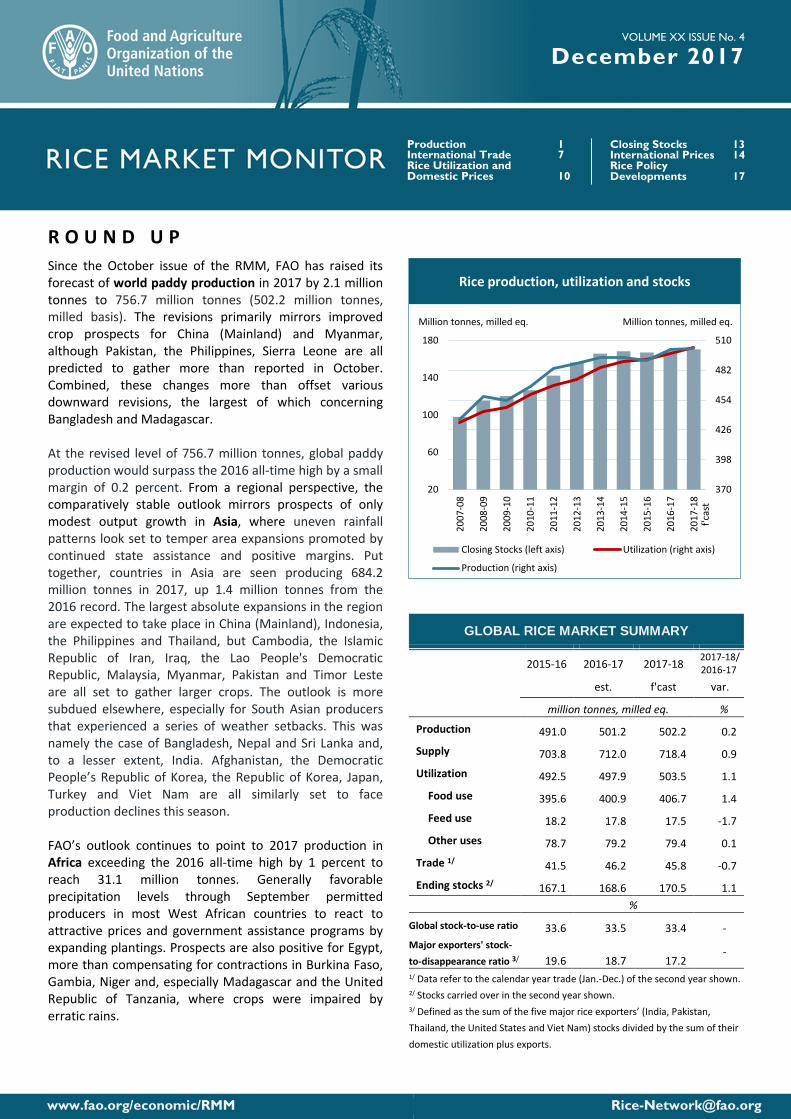
R O U N D U P Since the October issue of the RMM, FAO has raised its forecast of world paddy production in 2017 by 2.1 million tonnes to 756.7 million tonnes (502.2 million tonnes, milled basis). The revisions primarily mirrors improved crop prospects for China (Mainland) and Myanmar, although Pakistan, the Philippines, Sierra Leone are all predicted to gather more than reported in October. Combined, these changes more than offset various downward revisions, the largest of which concerning Bangladesh and Madagascar. At the revised level of 756.7 million tonnes, global paddy production would surpass the 2016 all-time high by a small margin of 0.2 percent. From a regional perspective, the comparatively stable outlook mirrors prospects of only modest output growth in Asia, where uneven rainfall patterns look set to temper area expansions promoted by continued state assistance and positive margins. Put together, countries in Asia are seen producing 684.2 million tonnes in 2017, up 1.4 million tonnes from the 2016 record. The largest absolute expansions in the region are expected to take place in China (Mainland), Indonesia, the Philippines and Thailand, but Cambodia, the Islamic Republic of Iran, Iraq, the Lao People's Democratic Republic, Malaysia, Myanmar, Pakistan and Timor Leste are all set to gather larger crops. The outlook is more subdued elsewhere, especially for South Asian producers that experienced a series of weather setbacks. This was namely the case of Bangladesh, Nepal and Sri Lanka and, to a lesser extent, India. Afghanistan, the Democratic People’s Republic of Korea, the Republic of Korea, Japan, Turkey and Viet Nam are all similarly set to face production declines this season. FAO’s outlook continues to point to 2017 production in Africa exceeding the 2016 all-time high by 1 percent to reach 31.1 million tonnes. Generally favorable precipitation levels through September permitted producers in most West African countries to react to attractive prices and government assistance programs by expanding plantings. Prospects are also positive for Egypt, more than compensating for contractions in Burkina Faso, Gambia, Niger and, especially Madagascar and the United Republic of Tanzania, where crops were impaired by erratic rains.
GLOBAL RICE MARKET SUMMARY
2015-16 2016-17 2017-18 2017-18/ 2016-17
est. f'cast var.
million tonnes, milled eq. %
Production 491.0 501.2 502.2 0.2
Supply 703.8 712.0 718.4 0.9
Utilization 492.5 497.9 503.5 1.1
Food use 395.6 400.9 406.7 1.4
Feed use 18.2 17.8 17.5 -1.7
Other uses 78.7 79.2 79.4 0.1
Trade 1/ 41.5 46.2 45.8 -0.7
Ending stocks 2/ 167.1 168.6 170.5 1.1 %
Global stock-to-use ratio 33.6 33.5 33.4 - Major exporters' stock-to-disappearance ratio 3/ 19.6 18.7 17.2
-
1/ Data refer to the calendar year trade (Jan.-Dec.) of the second year shown. 2/ Stocks carried over in the second year shown.
3/ Defined as the sum of the five major rice exporters’ (India, Pakistan, Thailand, the United States and Viet Nam) stocks divided by the sum of their domestic utilization plus exports.
Production 1 International Trade 7 Rice Utilization and Domestic Prices 10
Closing Stocks 13 International Prices 14 Rice Policy Developments 17
370
398
426
454
482
510
20
60
100
140
180
2007
-08
2008
-09
2009
-10
2010
-11
2011
-12
2012
-13
2013
-14
2014
-15
2015
-16
2016
-17
2017
-18
Closing Stocks (left axis) Utilization (right axis)
Production (right axis)
Million tonnes, milled eq.Million tonnes, milled eq.
f'cas
t
Rice production, utilization and stocks
FAO RICE MARKET MONITOR / DECEMBER 2017 PRODUCTION
Information update as of 12 December 2017
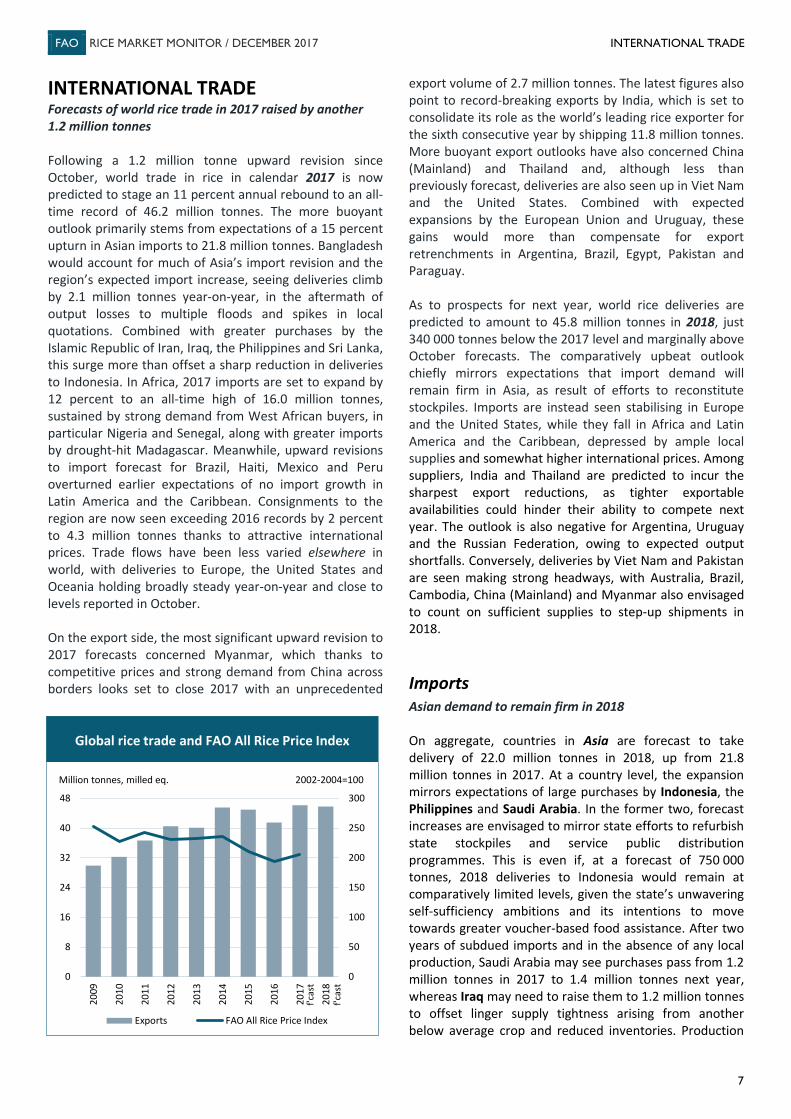
Paddy production in Latin America and the Caribbean is predicted to recover by 7 percent in 2017 to a new high of 28.4 million tonnes. Conducive growing conditions boosted yields to all-time records in South America, more than offsetting area retrenchments triggered by tight producer margins. Production recovered the most in Brazil, but Colombia, Guyana and Uruguay all gathered more, offsetting reductions in Argentina, Bolivia, Chile, Ecuador and Peru. In Central American and Caribbean, growth prospects were partly undermined by hurricane damages this season, although Haiti, Honduras, Mexico, the Dominican Republic and Panama may end the season with positive results. Elsewhere in the world, the latest figures confirm the negative outlook for the United States, where 2017 production is set to fall to its lowest since 1997, owing to competition with other crops and weather disruptions. In Europe, area cuts instigated by prospects of reduced margins are similarly set to depress production in the European Union and the Russian Federation, while ample and less costly water supplies for irrigation enabled 2017 output to stage a strong rebound in Australia. Following a 1.2 million tonne upward revision, world trade in rice in calendar 2017 is now expected to stage an 11 percent annual rebound to an all-time record of 46.2 million tonnes. The more buoyant outlook primarily stems from expectations of a strong upturn in Asian imports, sustained by a record pace of purchases by Bangladesh, along with greater imports by the Islamic Republic of Iran, Iraq, the Philippines and Sri Lanka. Attractive international prices are also set to raise deliveries to Africa and Latin America and the Caribbean to new heights, while imports hold broadly elsewhere in world. On the export side, the recovery in global demand is mainly expected to be met by larger shipments from India, Myanmar and Thailand, although significant export recoveries are also envisaged to concern China (Mainland) and Viet Nam. Combined with greater exports by the European Union, the United States and Uruguay, these gains would more than compensate for export retrenchments in Argentina, Brazil, Egypt, Pakistan and Paraguay. FAO’s forecast of world rice deliveries in 2018 now stands at 45.8 million tonnes, just 340 000 tonnes below the 2017 level and marginally above October forecasts. The comparatively upbeat outlook chiefly mirrors expectations that import demand will remain firm in Asia, owing to larger purchases by Indonesia, the Philippines and Saudi Arabia, in particular. Imports are instead seen stabilising in Europe and the United States, while they fall in Africa and Latin America and the Caribbean, deterred by ample local supplies and somewhat higher international prices. Among suppliers, India and Thailand are predicted to incur the sharpest export reductions in 2018, as tighter exportable availabilities could hinder their ability to compete next year. The outlook is also negative for Argentina, Uruguay
and the Russian Federation, in view of expected output shortfalls. Conversely, deliveries by Viet Nam and Pakistan are seen making strong headways next year, with Australia, Brazil, Cambodia, China (Mainland) and Myanmar also envisaged to count on sufficient supplies to step-up shipments in 2018. A total of 503.5 million tonnes (milled basis) of rice are forecast to be consumed around the world over the course of the 2017/18 season, up from 498.0 million tonnes in 2016/17. The 1 percent expansion is expected to be driven by higher food use, of around 406.7 million tonnes. On a per caput basis, this volume would put world consumption of rice as food at 53.9 kilos per person, up 0.2 kilos from 2016/17. Quantities destined to animal feed are projected to decline by 2 percent to 17.5 million tonnes, with another 79.4 million tonnes are used for seed, non-food industrial uses and post-harvest losses, unchanged from the previous season. Consistent with the improved outlook for 2017 global production, FAO has raised its forecast of world rice inventories at the close of 2017/18 marketing years by 1.4 million tonnes to 170.5 million tonnes (milled basis). This level would represent a 1.1 percent increase from the 2016/17 record volume, resulting in a largely stable world stocks-to-use ratio of 33.4 percent. Rice importing countries remain forecast to account for all of the projected growth in global rice inventories. This would be namely be the case of China (Mainland), although Bangladesh, the Islamic Republic of Iran, Nigeria and the Philippines are all similarly envisaged to end their respective marketing years with larger reserves. Stock expansions in these countries would more than compensate for drawdowns in the major rice exporters, driven by cuts in Thailand and the United States, and for stock reductions in the Republic of Korea, Madagascar and Sri Lanka. Although the last quarter of the year normally marks the onset of harvesting activities across major northern-hemisphere suppliers, international rice prices have continued to gain ground since October. This was reflected by the FAO All Rice Price Index (2002-2004=100), which passed from an October average of 216 points to 221 points in mid-December. Higher quality Indica and Japonica rice led the advance, rising by 3 percent, each, owing to stern import demand from South Asian and Far Eastern buyers, along with currency appreciations in some major rice exporters. Gains were in the order 2 percent for Aromatica supplies and of 1 percent for lower quality Indica rice, mirroring some downward pressure exerted in these segments by tepid buying interest and harvest progress. From an annual stance, these latest tendencies positioned the annual average FAO All Rice Price Index at 207 points, 7 percent higher than in 2016 and just short of its 2015 average of 211 points.
FAO RICE MARKET MONITOR / DECEMBER 2017 PRODUCTION
1
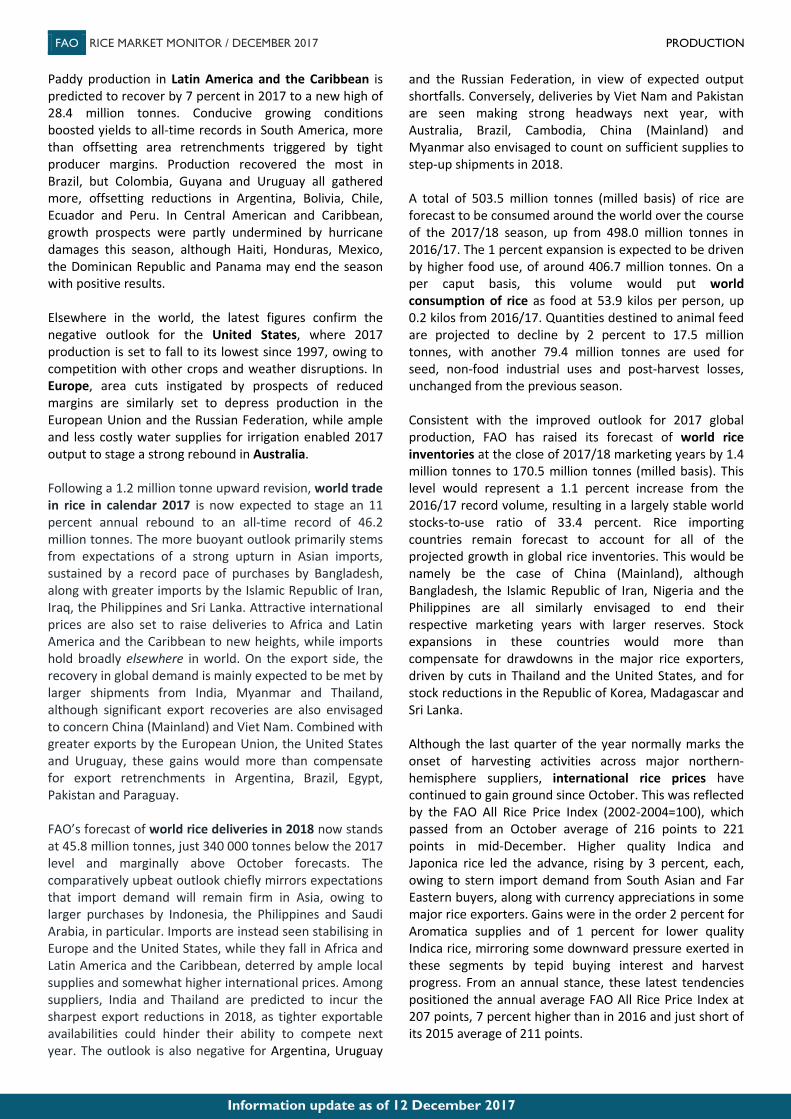
PRODUCTION Global production forecast upgraded by 2.1 million tonnes With harvests of main paddy crops drawing to a close in northern-hemisphere producers,1 FAO has raised its October forecast of world paddy production in 2017 by 2.1 million tonnes to 756.7 million tonnes (502.2 million tonnes, milled basis). At a country level, the upward adjustment primarily mirrors more buoyant prospects for China (Mainland), based on December assessments by the National Bureau of Statics, which showed higher plantings in the country and record yield outcomes. Next to China, the largest upward revision concerned Myanmar, given a generally normal unfolding of the 2017 main cropping cycle, along with expectations that attractive local prices will lead to more pronounced expansions in secondary crop acreage. Evidence of greater plantings and favourable yield outcomes also boosted the outlook for Pakistan, the Philippines and Sierra Leone. These changes more than offset various downward revisions, the largest of which concerning Bangladesh, as Government assessments of the country’s main (Boro) harvest pointed to larger than earlier anticipated damages to April flash floods. Production forecasts were also downgraded for Madagascar following the release of a FAO/WFP crop assessment indicating more significant crop losses incurred as a result of severe precipitation deficits and storm damages. In the case of Viet Nam, slight downward adjustments to yield expectations were mostly reflective of overly wet conditions during the last (winter) crop cycle. At the revised level of 756.7 million tonnes (502.2 million tonnes, milled basis), global paddy production would surpass the 2016 all-time high by a small margin of 0.2 percent. From a regional perspective, the forecast mirrors prospects of modest output gains in Asia, where uneven rainfall patterns look set to temper area expansions promoted by continued state assistance and positive margin. Record crops are anticipated gathered in Africa and Latin America and the Caribbean, while ample and less costly water supplies for irrigation also enabled 2017 production in Australia to stage a strong rebound. Instead, 2017 output is set to contract in the United States and
1 The 2017 rice production season normally includes rice from the main paddy crops whose harvests fall in 2017, to which rice from all subsequent secondary crops, if any, is added. In the case of northern hemisphere countries, this principle implies that production in 2017 comprises the main rice crop, which is usually collected in the latter part of the year, plus the volume obtained from the successive secondary crops, commonly harvested in the first half of 2018. In the case of southern hemisphere countries, production in 2017 normally comprises rice from the main paddy crops assembled in the first part of 2017, plus rice from the secondary crops, generally gathered in the latter part of 2017. This approach to assess rice production is applicable to any given season.
Europe, depressed by area retrenchments instigated by prospects of reduced margins.
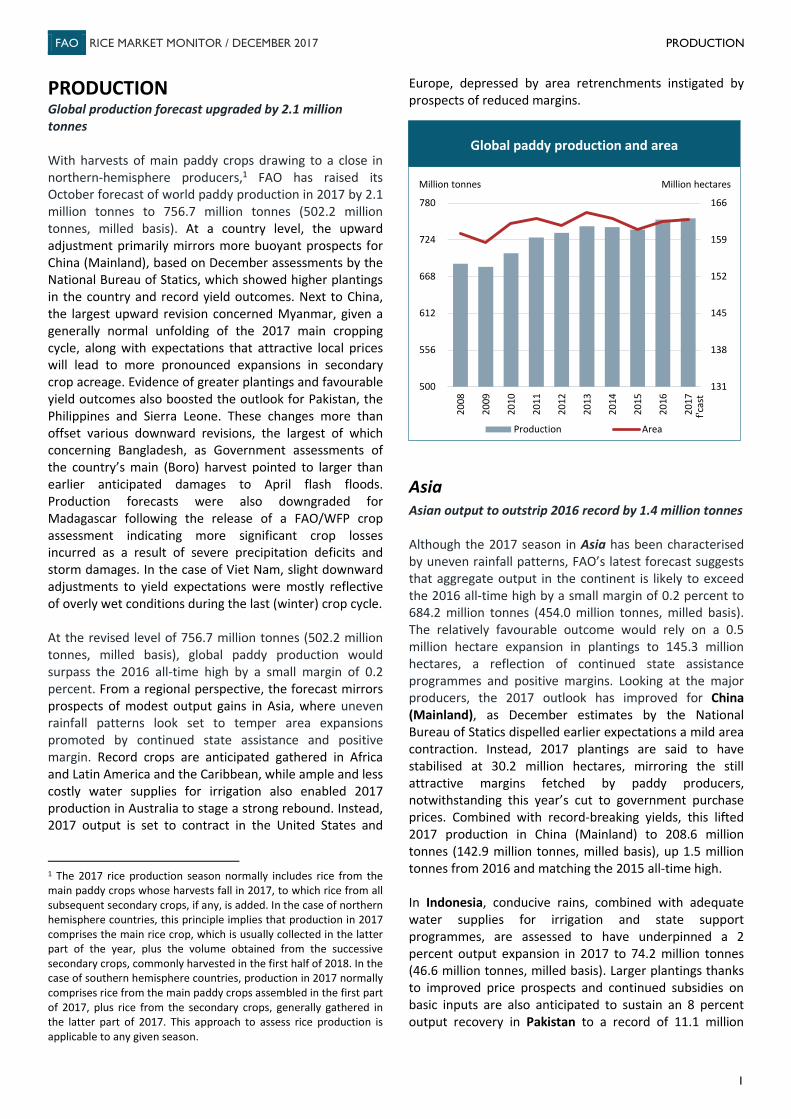
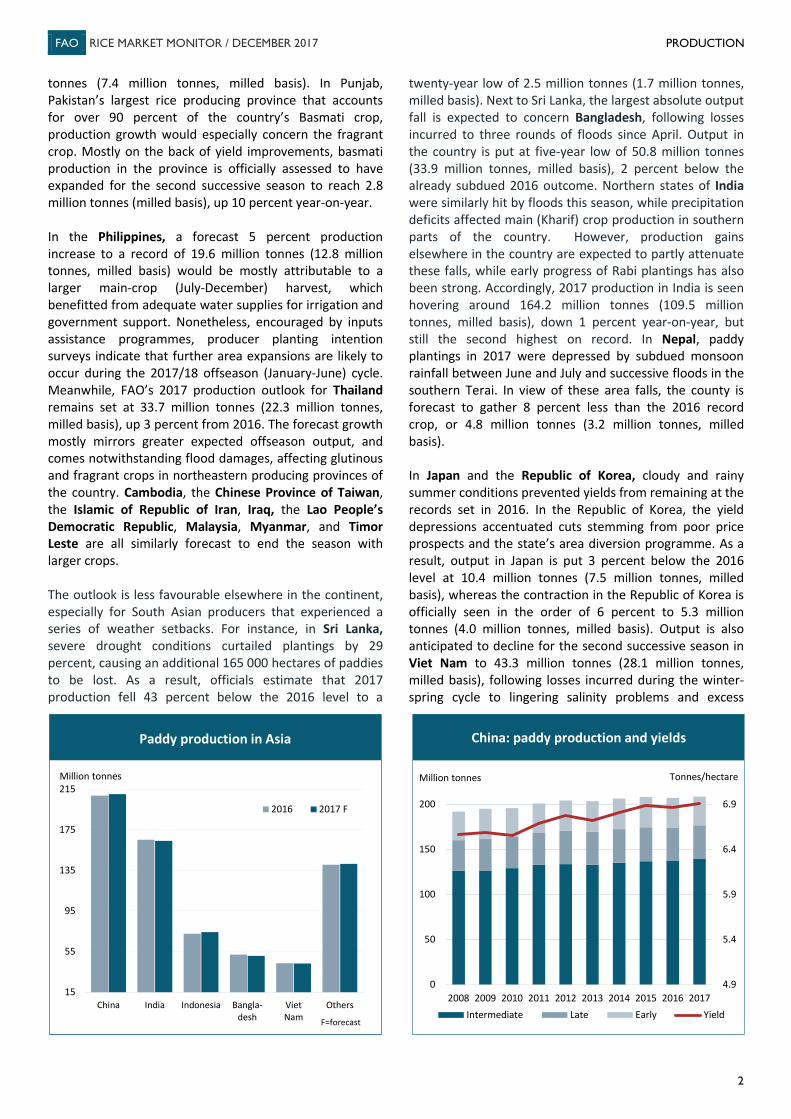
Asia Asian output to outstrip 2016 record by 1.4 million tonnes Although the 2017 season in Asia has been characterised by uneven rainfall patterns, FAO’s latest forecast suggests that aggregate output in the continent is likely to exceed the 2016 all-time high by a small margin of 0.2 percent to 684.2 million tonnes (454.0 million tonnes, milled basis). The relatively favourable outcome would rely on a 0.5 million hectare expansion in plantings to 145.3 million hectares, a reflection of continued state assistance programmes and positive margins. Looking at the major producers, the 2017 outlook has improved for China (Mainland), as December estimates by the National Bureau of Statics dispelled earlier expectations a mild area contraction. Instead, 2017 plantings are said to have stabilised at 30.2 million hectares, mirroring the still attractive margins fetched by paddy producers, notwithstanding this year’s cut to government purchase prices. Combined with record-breaking yields, this lifted 2017 production in China (Mainland) to 208.6 million tonnes (142.9 million tonnes, milled basis), up 1.5 million tonnes from 2016 and matching the 2015 all-time high. In Indonesia, conducive rains, combined with adequate water supplies for irrigation and state support programmes, are assessed to have underpinned a 2 percent output expansion in 2017 to 74.2 million tonnes (46.6 million tonnes, milled basis). Larger plantings thanks to improved price prospects and continued subsidies on basic inputs are also anticipated to sustain an 8 percent output recovery in Pakistan to a record of 11.1 million
131
138
145
152
159
166
500
556
612
668
724
780
2008
2009
2010
2011
2012
2013
2014
2015
2016
2017
Production Area
Production et superficie mondiales de riz paddy
Million tonnes
Global paddy production and area
Million hectares
f'cas
t
FAO RICE MARKET MONITOR / DECEMBER 2017 PRODUCTION
2
tonnes (7.4 million tonnes, milled basis). In Punjab, Pakistan’s largest rice producing province that accounts for over 90 percent of the country’s Basmati crop, production growth would especially concern the fragrant crop. Mostly on the back of yield improvements, basmati production in the province is officially assessed to have expanded for the second successive season to reach 2.8 million tonnes (milled basis), up 10 percent year-on-year. In the Philippines, a forecast 5 percent production increase to a record of 19.6 million tonnes (12.8 million tonnes, milled basis) would be mostly attributable to a larger main-crop (July-December) harvest, which benefitted from adequate water supplies for irrigation and government support. Nonetheless, encouraged by inputs assistance programmes, producer planting intention surveys indicate that further area expansions are likely to occur during the 2017/18 offseason (January-June) cycle. Meanwhile, FAO’s 2017 production outlook for Thailand remains set at 33.7 million tonnes (22.3 million tonnes, milled basis), up 3 percent from 2016. The forecast growth mostly mirrors greater expected offseason output, and comes notwithstanding flood damages, affecting glutinous and fragrant crops in northeastern producing provinces of the country. Cambodia, the Chinese Province of Taiwan, the Islamic of Republic of Iran, Iraq, the Lao People’s Democratic Republic, Malaysia, Myanmar, and Timor Leste are all similarly forecast to end the season with larger crops. The outlook is less favourable elsewhere in the continent, especially for South Asian producers that experienced a series of weather setbacks. For instance, in Sri Lanka, severe drought conditions curtailed plantings by 29 percent, causing an additional 165 000 hectares of paddies to be lost. As a result, officials estimate that 2017 production fell 43 percent below the 2016 level to a
twenty-year low of 2.5 million tonnes (1.7 million tonnes, milled basis). Next to Sri Lanka, the largest absolute output fall is expected to concern Bangladesh, following losses incurred to three rounds of floods since April. Output in the country is put at five-year low of 50.8 million tonnes (33.9 million tonnes, milled basis), 2 percent below the already subdued 2016 outcome. Northern states of India were similarly hit by floods this season, while precipitation deficits affected main (Kharif) crop production in southern parts of the country. However, production gains elsewhere in the country are expected to partly attenuate these falls, while early progress of Rabi plantings has also been strong. Accordingly, 2017 production in India is seen hovering around 164.2 million tonnes (109.5 million tonnes, milled basis), down 1 percent year-on-year, but still the second highest on record. In Nepal, paddy plantings in 2017 were depressed by subdued monsoon rainfall between June and July and successive floods in the southern Terai. In view of these area falls, the county is forecast to gather 8 percent less than the 2016 record crop, or 4.8 million tonnes (3.2 million tonnes, milled basis). In Japan and the Republic of Korea, cloudy and rainy summer conditions prevented yields from remaining at the records set in 2016. In the Republic of Korea, the yield depressions accentuated cuts stemming from poor price prospects and the state’s area diversion programme. As a result, output in Japan is put 3 percent below the 2016 level at 10.4 million tonnes (7.5 million tonnes, milled basis), whereas the contraction in the Republic of Korea is officially seen in the order of 6 percent to 5.3 million tonnes (4.0 million tonnes, milled basis). Output is also anticipated to decline for the second successive season in Viet Nam to 43.3 million tonnes (28.1 million tonnes, milled basis), following losses incurred during the winter-spring cycle to lingering salinity problems and excess
15
55
95
135
175
215
China India Indonesia Bangla-desh
VietNam
Others
2016 2017 F
Million tonnes
Paddy production in Asia
F=forecast
4.9
5.4
5.9
6.4
6.9
0
50
100
150
200
2008 2009 2010 2011 2012 2013 2014 2015 2016 2017Intermediate Late Early Yield
Million tonnes Tonnes/hectare
China: paddy production and yields
FAO RICE MARKET MONITOR / DECEMBER 2017 PRODUCTION
3
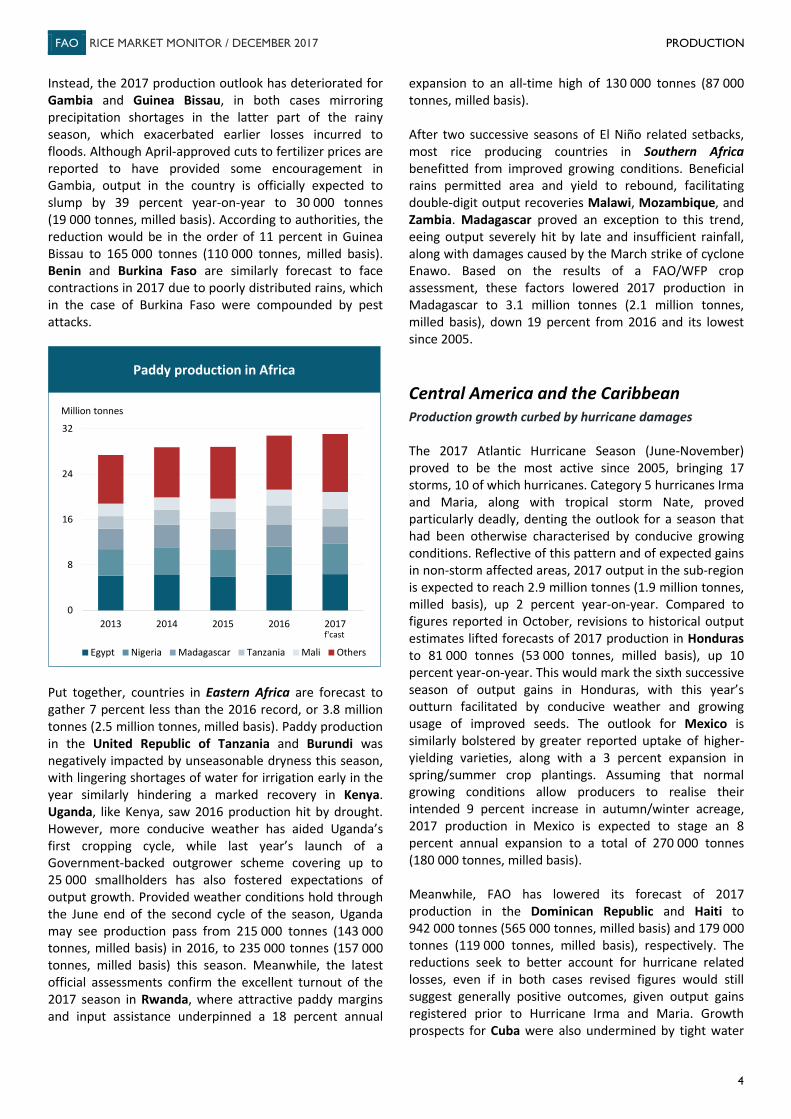
precipitation. Damages from successive storms and a shift away from rice cultivation are also set to depress winter output, more than offsetting yield-driven gains to the summer-autumn crop, which benefitted from more conducive weather. Production is also seen ending lower in Afghanistan, the Democratic People’s Republic of Korea and Turkey. Africa Larger crops in Guinea, Nigeria and Sierra Leone to drive a 1 percent expansion in African production Most countries in Africa have already collected their 2017 main crops or are in the process of doing so, with only a few producers now engaged in offseason cropping activities. FAO’s 2017 outlook for the continent continues to suggest that aggregate production will exceed the 2016 all-time high by 1 percent, reaching 31.1 million tonnes (20.3 million tonnes, milled basis). The projected growth mirrors expectations that weather induced shortfalls in Eastern and Southern Africa, namely in Madagascar and the United Republic of Tanzania, will be more than compensated by greater output in western parts of the continent. Prospects are also positive for the largest single African rice producer, Egypt. Despite attractive cotton prices and penalties for growers cultivating rice beyond Government-set ceilings, FAO puts the October-ended harvest in Egypt at 6.4 million tonnes (4.4 million tonnes, milled basis). This level would stand 80 000 tonnes above the 2016 estimate, largely the reflection of yield improvements and still attractive margins for rice cultivation.
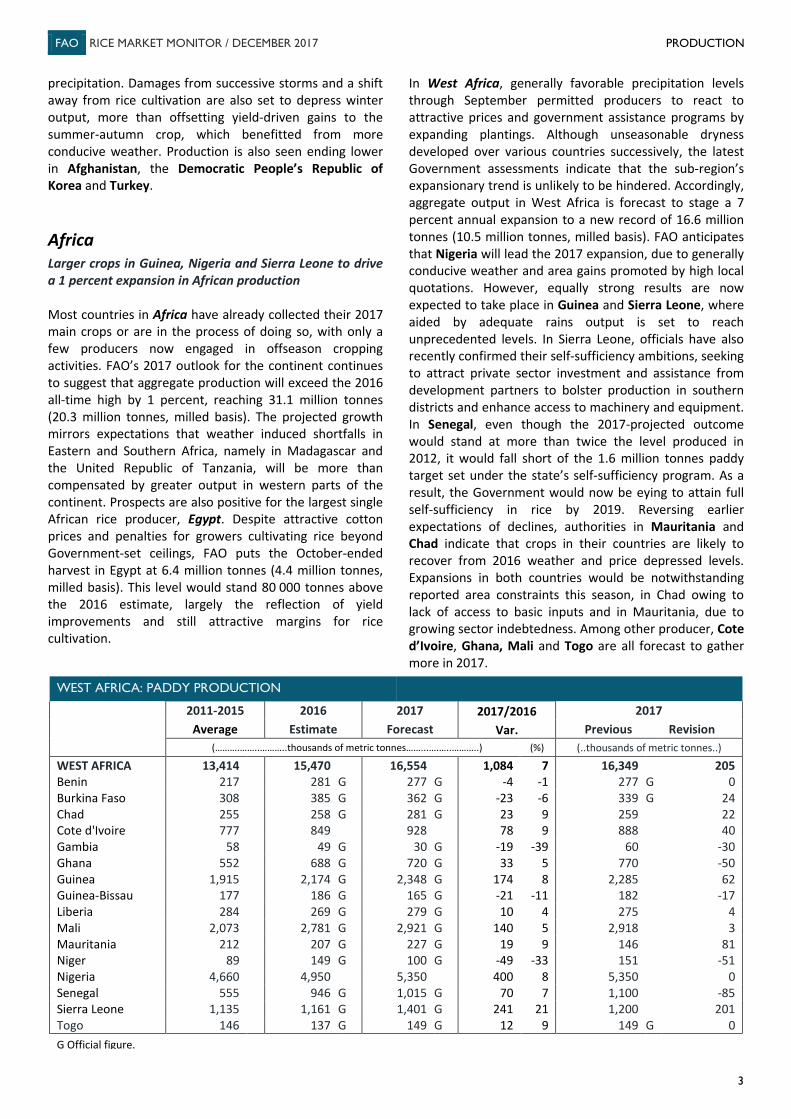
In West Africa, generally favorable precipitation levels through September permitted producers to react to attractive prices and government assistance programs by expanding plantings. Although unseasonable dryness developed over various countries successively, the latest Government assessments indicate that the sub-region’s expansionary trend is unlikely to be hindered. Accordingly, aggregate output in West Africa is forecast to stage a 7 percent annual expansion to a new record of 16.6 million tonnes (10.5 million tonnes, milled basis). FAO anticipates that Nigeria will lead the 2017 expansion, due to generally conducive weather and area gains promoted by high local quotations. However, equally strong results are now expected to take place in Guinea and Sierra Leone, where aided by adequate rains output is set to reach unprecedented levels. In Sierra Leone, officials have also recently confirmed their self-sufficiency ambitions, seeking to attract private sector investment and assistance from development partners to bolster production in southern districts and enhance access to machinery and equipment. In Senegal, even though the 2017-projected outcome would stand at more than twice the level produced in 2012, it would fall short of the 1.6 million tonnes paddy target set under the state’s self-sufficiency program. As a result, the Government would now be eying to attain full self-sufficiency in rice by 2019. Reversing earlier expectations of declines, authorities in Mauritania and Chad indicate that crops in their countries are likely to recover from 2016 weather and price depressed levels. Expansions in both countries would be notwithstanding reported area constraints this season, in Chad owing to lack of access to basic inputs and in Mauritania, due to growing sector indebtedness. Among other producer, Cote d’Ivoire, Ghana, Mali and Togo are all forecast to gather more in 2017.
WEST AFRICA: PADDY PRODUCTION
2011-2015 2016 2017 2017/2016 2017
Average Estimate Forecast Var. Previous Revision (……….……..………..thousands of metric tonnes……...….…..………..) (%) (..thousands of metric tonnes..)
WEST AFRICA 13,414 15,470 16,554 1,084 7 16,349 205 Benin 217 281 G 277 G -4 -1 277 G 0 Burkina Faso 308 385 G 362 G -23 -6 339 G 24 Chad 255 258 G 281 G 23 9 259 22 Cote d'Ivoire 777 849 928 78 9 888 40 Gambia 58 49 G 30 G -19 -39 60 -30 Ghana 552 688 G 720 G 33 5 770 -50 Guinea 1,915 2,174 G 2,348 G 174 8 2,285 62 Guinea-Bissau 177 186 G 165 G -21 -11 182 -17 Liberia 284 269 G 279 G 10 4 275 4 Mali 2,073 2,781 G 2,921 G 140 5 2,918 3 Mauritania 212 207 G 227 G 19 9 146 81 Niger 89 149 G 100 G -49 -33 151 -51 Nigeria 4,660 4,950 5,350 400 8 5,350 0 Senegal 555 946 G 1,015 G 70 7 1,100 -85 Sierra Leone 1,135 1,161 G 1,401 G 241 21 1,200 201 Togo 146 137 G 149 G 12 9 149 G 0 G Official figure.
FAO RICE MARKET MONITOR / DECEMBER 2017 PRODUCTION
4
Instead, the 2017 production outlook has deteriorated for Gambia and Guinea Bissau, in both cases mirroring precipitation shortages in the latter part of the rainy season, which exacerbated earlier losses incurred to floods. Although April-approved cuts to fertilizer prices are reported to have provided some encouragement in Gambia, output in the country is officially expected to slump by 39 percent year-on-year to 30 000 tonnes (19 000 tonnes, milled basis). According to authorities, the reduction would be in the order of 11 percent in Guinea Bissau to 165 000 tonnes (110 000 tonnes, milled basis). Benin and Burkina Faso are similarly forecast to face contractions in 2017 due to poorly distributed rains, which in the case of Burkina Faso were compounded by pest attacks.
Put together, countries in Eastern Africa are forecast to gather 7 percent less than the 2016 record, or 3.8 million tonnes (2.5 million tonnes, milled basis). Paddy production in the United Republic of Tanzania and Burundi was negatively impacted by unseasonable dryness this season, with lingering shortages of water for irrigation early in the year similarly hindering a marked recovery in Kenya. Uganda, like Kenya, saw 2016 production hit by drought. However, more conducive weather has aided Uganda’s first cropping cycle, while last year’s launch of a Government-backed outgrower scheme covering up to 25 000 smallholders has also fostered expectations of output growth. Provided weather conditions hold through the June end of the second cycle of the season, Uganda may see production pass from 215 000 tonnes (143 000 tonnes, milled basis) in 2016, to 235 000 tonnes (157 000 tonnes, milled basis) this season. Meanwhile, the latest official assessments confirm the excellent turnout of the 2017 season in Rwanda, where attractive paddy margins and input assistance underpinned a 18 percent annual
expansion to an all-time high of 130 000 tonnes (87 000 tonnes, milled basis). After two successive seasons of El Niño related setbacks, most rice producing countries in Southern Africa benefitted from improved growing conditions. Beneficial rains permitted area and yield to rebound, facilitating double-digit output recoveries Malawi, Mozambique, and Zambia. Madagascar proved an exception to this trend, eeing output severely hit by late and insufficient rainfall, along with damages caused by the March strike of cyclone Enawo. Based on the results of a FAO/WFP crop assessment, these factors lowered 2017 production in Madagascar to 3.1 million tonnes (2.1 million tonnes, milled basis), down 19 percent from 2016 and its lowest since 2005. Central America and the Caribbean Production growth curbed by hurricane damages The 2017 Atlantic Hurricane Season (June-November) proved to be the most active since 2005, bringing 17 storms, 10 of which hurricanes. Category 5 hurricanes Irma and Maria, along with tropical storm Nate, proved particularly deadly, denting the outlook for a season that had been otherwise characterised by conducive growing conditions. Reflective of this pattern and of expected gains in non-storm affected areas, 2017 output in the sub-region is expected to reach 2.9 million tonnes (1.9 million tonnes, milled basis), up 2 percent year-on-year. Compared to figures reported in October, revisions to historical output estimates lifted forecasts of 2017 production in Honduras to 81 000 tonnes (53 000 tonnes, milled basis), up 10 percent year-on-year. This would mark the sixth successive season of output gains in Honduras, with this year’s outturn facilitated by conducive weather and growing usage of improved seeds. The outlook for Mexico is similarly bolstered by greater reported uptake of higher-yielding varieties, along with a 3 percent expansion in spring/summer crop plantings. Assuming that normal growing conditions allow producers to realise their intended 9 percent increase in autumn/winter acreage, 2017 production in Mexico is expected to stage an 8 percent annual expansion to a total of 270 000 tonnes (180 000 tonnes, milled basis). Meanwhile, FAO has lowered its forecast of 2017 production in the Dominican Republic and Haiti to 942 000 tonnes (565 000 tonnes, milled basis) and 179 000 tonnes (119 000 tonnes, milled basis), respectively. The reductions seek to better account for hurricane related losses, even if in both cases revised figures would still suggest generally positive outcomes, given output gains registered prior to Hurricane Irma and Maria. Growth prospects for Cuba were also undermined by tight water
0
8
16
24
32
2013 2014 2015 2016 2017
Egypt Nigeria Madagascar Tanzania Mali Others
Million tonnes
f'cast
Paddy production in Africa
FAO RICE MARKET MONITOR / DECEMBER 2017 PRODUCTION
5
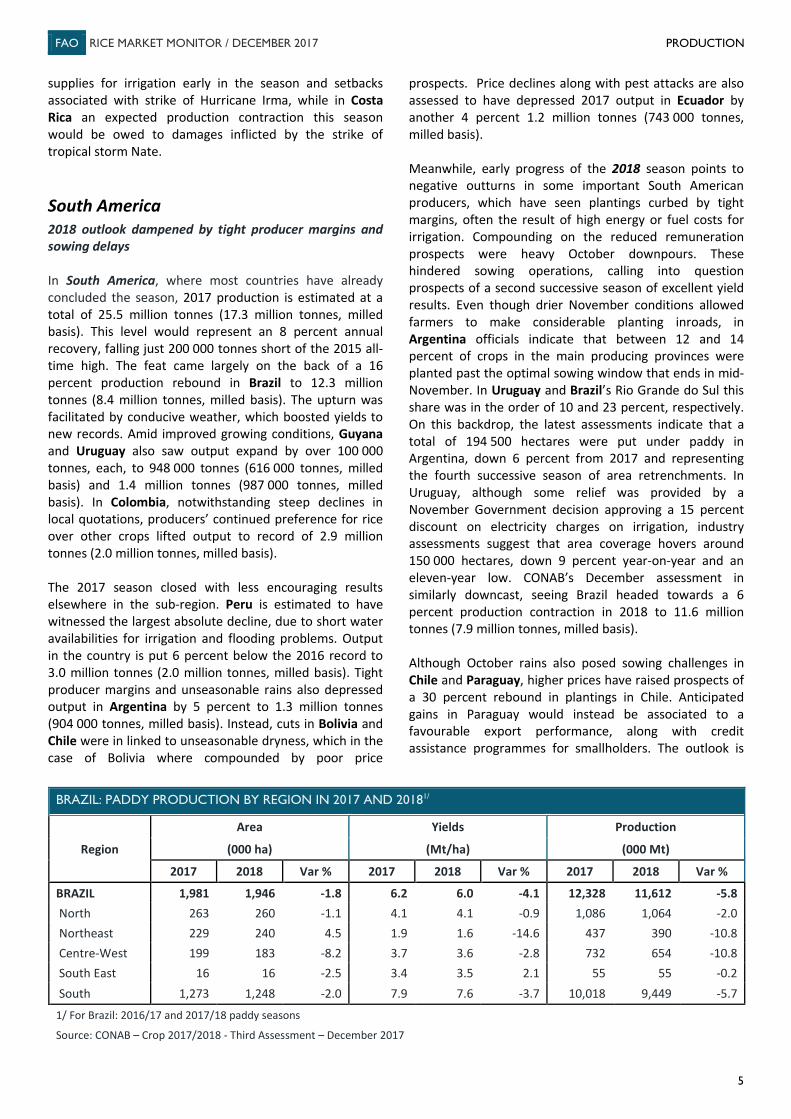
supplies for irrigation early in the season and setbacks associated with strike of Hurricane Irma, while in Costa Rica an expected production contraction this season would be owed to damages inflicted by the strike of tropical storm Nate. South America 2018 outlook dampened by tight producer margins and sowing delays In South America, where most countries have already concluded the season, 2017 production is estimated at a total of 25.5 million tonnes (17.3 million tonnes, milled basis). This level would represent an 8 percent annual recovery, falling just 200 000 tonnes short of the 2015 all-time high. The feat came largely on the back of a 16 percent production rebound in Brazil to 12.3 million tonnes (8.4 million tonnes, milled basis). The upturn was facilitated by conducive weather, which boosted yields to new records. Amid improved growing conditions, Guyana and Uruguay also saw output expand by over 100 000 tonnes, each, to 948 000 tonnes (616 000 tonnes, milled basis) and 1.4 million tonnes (987 000 tonnes, milled basis). In Colombia, notwithstanding steep declines in local quotations, producers’ continued preference for rice over other crops lifted output to record of 2.9 million tonnes (2.0 million tonnes, milled basis). The 2017 season closed with less encouraging results elsewhere in the sub-region. Peru is estimated to have witnessed the largest absolute decline, due to short water availabilities for irrigation and flooding problems. Output in the country is put 6 percent below the 2016 record to 3.0 million tonnes (2.0 million tonnes, milled basis). Tight producer margins and unseasonable rains also depressed output in Argentina by 5 percent to 1.3 million tonnes (904 000 tonnes, milled basis). Instead, cuts in Bolivia and Chile were in linked to unseasonable dryness, which in the case of Bolivia where compounded by poor price
prospects. Price declines along with pest attacks are also assessed to have depressed 2017 output in Ecuador by another 4 percent 1.2 million tonnes (743 000 tonnes, milled basis). Meanwhile, early progress of the 2018 season points to negative outturns in some important South American producers, which have seen plantings curbed by tight margins, often the result of high energy or fuel costs for irrigation. Compounding on the reduced remuneration prospects were heavy October downpours. These hindered sowing operations, calling into question prospects of a second successive season of excellent yield results. Even though drier November conditions allowed farmers to make considerable planting inroads, in Argentina officials indicate that between 12 and 14 percent of crops in the main producing provinces were planted past the optimal sowing window that ends in mid-November. In Uruguay and Brazil’s Rio Grande do Sul this share was in the order of 10 and 23 percent, respectively. On this backdrop, the latest assessments indicate that a total of 194 500 hectares were put under paddy in Argentina, down 6 percent from 2017 and representing the fourth successive season of area retrenchments. In Uruguay, although some relief was provided by a November Government decision approving a 15 percent discount on electricity charges on irrigation, industry assessments suggest that area coverage hovers around 150 000 hectares, down 9 percent year-on-year and an eleven-year low. CONAB’s December assessment in similarly downcast, seeing Brazil headed towards a 6 percent production contraction in 2018 to 11.6 million tonnes (7.9 million tonnes, milled basis). Although October rains also posed sowing challenges in Chile and Paraguay, higher prices have raised prospects of a 30 percent rebound in plantings in Chile. Anticipated gains in Paraguay would instead be associated to a favourable export performance, along with credit assistance programmes for smallholders. The outlook is
BRAZIL: PADDY PRODUCTION BY REGION IN 2017 AND 20181/
Region
Area Yields Production
(000 ha) (Mt/ha) (000 Mt)
2017 2018 Var % 2017 2018 Var % 2017 2018 Var %
BRAZIL 1,981 1,946 -1.8 6.2 6.0 -4.1 12,328 11,612 -5.8 North 263 260 -1.1 4.1 4.1 -0.9 1,086 1,064 -2.0 Northeast 229 240 4.5 1.9 1.6 -14.6 437 390 -10.8 Centre-West 199 183 -8.2 3.7 3.6 -2.8 732 654 -10.8 South East 16 16 -2.5 3.4 3.5 2.1 55 55 -0.2 South 1,273 1,248 -2.0 7.9 7.6 -3.7 10,018 9,449 -5.7
1/ For Brazil: 2016/17 and 2017/18 paddy seasons
Source: CONAB – Crop 2017/2018 - Third Assessment – December 2017

FAO RICE MARKET MONITOR / DECEMBER 2017 PRODUCTION
6
likewise positive for Bolivia, where beneficial rains and more attractive prices have aided sowing operations, giving rise to expectations of a strong production recovery in 2018.
North America, Europe and Oceania Negative prospects for the United States and Europe confirmed, as is output rebound in Australia In North America, the USDA’s outlook for 2017 production in the United States has changed little since last issue of the RMM. The October-ended harvest is pegged at 8.1 million tonnes (5.7 million tonnes, milled basis), down 20 percent from 2016 and the smallest crop gathered since 1997. The fall was mostly imputable to a 24 percent shortfall in long-grain output, as producers reacted to more attractive margins for competing crops by slashing plantings. Additional losses were triggered by April/May floods in southern producing states and by the August strike of Hurricane Harvey. Short/medium-grain output also retreated by 9 percent year-on-year, mostly owing to planting setbacks incurred in California as a result of overly wet conditions.
Less buoyant yield outcomes in the two largest producers of the European Union, Italy and Spain, have lowered October forecasts of aggregate output in the block by 70 000 tonnes to 3.0 million tonnes in 2017 (1.8 million tonnes, milled basis), down 3 percent year-on-year. In Italy, output is reported to have fallen 5 percent short of 2016 levels to an overall average volume of 1.5 million tonnes (906 000 tonnes, milled basis). The fall was yield-driven, although area also fell, as cuts to Japonica plantings were only partly compensated by a recovery in Indica acreage. In the case of Spain, officials now peg 2017 output at 840 000 tonnes (504 000 tonnes, milled basis), still 2 percent above the 2016 weather-depressed level, owing to productivity improvements. With the exception of France and Romania, all other EU rice producers are assessed to have gathered less in 2017. To a large extent, falls reflected area retrenchments induced by poor price prospects, although in the case of Portugal declines were imputable to water shortages and unseasonably warm conditions. Elsewhere in Europe, the 2017 outlook is also negative for the Russian Federation, at 1.0 million tonnes (676 000 tonnes, milled basis). The 6 percent annual fall mirrors area reductions driven by unattractive prices, although yield improvements are expected to mitigate the area reduction somewhat. In Oceania, dispelling earlier expectations of another area expansion, December assessments by ABARES indicate that 2018 plantings in Australia amounted to 80 000 hectares, down 2 percent from 2017. At that level, area coverage would still stand out at their second highest in five years, as water carry-overs ensured adequate water supplies for irrigation, adding to favourable weather conditions at planting time. Further encouragement was provided by recoveries in international Japonica quotations and industry calls to move towards greater cultivation of higher-valued specialty rices. The latter would be in order to avert competition with other remunerative crops, such as cotton. As a result, after staging a 195 percent annual rebound in 2017 to 809 000 tonnes (540 000 tonnes, milled basis), production in Australia is officially seen little changed in 2018, at 800 000 tonnes (534 000 tonnes, milled basis).
0
5
10
16
21
26
2013 2014 2015 2016 2017
Brazil Peru Colombia Argentina Uruguay Others
Million tonnes
f'cast
Paddy production in South America
USA: RICE PRODUCTION BY CLASS
Year 2013 2014 2015 2016 2017 2017/
2016 (...………..thousands of metric tonnes, milled basis …………..) Var %
ALL 6,117 7,106 6,133 7,117 5,664 -20 Long Grain 4,248 5,202 4,236 5,286 4,005 -24 Medium Grain 1,769 1,830 1,811 1,732 1,570 -9 Short Grain 101 74 86 100 88 -12 Source: National Agricultural Statistics Service (NASS), Agricultural Statistics Board, USDA.
FAO RICE MARKET MONITOR / DECEMBER 2017 INTERNATIONAL TRADE
7
INTERNATIONAL TRADE Forecasts of world rice trade in 2017 raised by another 1.2 million tonnes Following a 1.2 million tonne upward revision since October, world trade in rice in calendar 2017 is now predicted to stage an 11 percent annual rebound to an all-time record of 46.2 million tonnes. The more buoyant outlook primarily stems from expectations of a 15 percent upturn in Asian imports to 21.8 million tonnes. Bangladesh would account for much of Asia’s import revision and the region’s expected import increase, seeing deliveries climb by 2.1 million tonnes year-on-year, in the aftermath of output losses to multiple floods and spikes in local quotations. Combined with greater purchases by the Islamic Republic of Iran, Iraq, the Philippines and Sri Lanka, this surge more than offset a sharp reduction in deliveries to Indonesia. In Africa, 2017 imports are set to expand by 12 percent to an all-time high of 16.0 million tonnes, sustained by strong demand from West African buyers, in particular Nigeria and Senegal, along with greater imports by drought-hit Madagascar. Meanwhile, upward revisions to import forecast for Brazil, Haiti, Mexico and Peru overturned earlier expectations of no import growth in Latin America and the Caribbean. Consignments to the region are now seen exceeding 2016 records by 2 percent to 4.3 million tonnes thanks to attractive international prices. Trade flows have been less varied elsewhere in world, with deliveries to Europe, the United States and Oceania holding broadly steady year-on-year and close to levels reported in October. On the export side, the most significant upward revision to 2017 forecasts concerned Myanmar, which thanks to competitive prices and strong demand from China across borders looks set to close 2017 with an unprecedented
export volume of 2.7 million tonnes. The latest figures also point to record-breaking exports by India, which is set to consolidate its role as the world’s leading rice exporter for the sixth consecutive year by shipping 11.8 million tonnes. More buoyant export outlooks have also concerned China (Mainland) and Thailand and, although less than previously forecast, deliveries are also seen up in Viet Nam and the United States. Combined with expected expansions by the European Union and Uruguay, these gains would more than compensate for export retrenchments in Argentina, Brazil, Egypt, Pakistan and Paraguay. As to prospects for next year, world rice deliveries are predicted to amount to 45.8 million tonnes in 2018, just 340 000 tonnes below the 2017 level and marginally above October forecasts. The comparatively upbeat outlook chiefly mirrors expectations that import demand will remain firm in Asia, as result of efforts to reconstitute stockpiles. Imports are instead seen stabilising in Europe and the United States, while they fall in Africa and Latin America and the Caribbean, depressed by ample local supplies and somewhat higher international prices. Among suppliers, India and Thailand are predicted to incur the sharpest export reductions, as tighter exportable availabilities could hinder their ability to compete next year. The outlook is also negative for Argentina, Uruguay and the Russian Federation, owing to expected output shortfalls. Conversely, deliveries by Viet Nam and Pakistan are seen making strong headways, with Australia, Brazil, Cambodia, China (Mainland) and Myanmar also envisaged to count on sufficient supplies to step-up shipments in 2018. Imports Asian demand to remain firm in 2018 On aggregate, countries in Asia are forecast to take delivery of 22.0 million tonnes in 2018, up from 21.8 million tonnes in 2017. At a country level, the expansion mirrors expectations of large purchases by Indonesia, the Philippines and Saudi Arabia. In the former two, forecast increases are envisaged to mirror state efforts to refurbish state stockpiles and service public distribution programmes. This is even if, at a forecast of 750 000 tonnes, 2018 deliveries to Indonesia would remain at comparatively limited levels, given the state’s unwavering self-sufficiency ambitions and its intentions to move towards greater voucher-based food assistance. After two years of subdued imports and in the absence of any local production, Saudi Arabia may see purchases pass from 1.2 million tonnes in 2017 to 1.4 million tonnes next year, whereas Iraq may need to raise them to 1.2 million tonnes to offset linger supply tightness arising from another below average crop and reduced inventories. Production
0
50
100
150
200
250
300
0
8
16
24
32
40
48
2009
2010
2011
2012
2013
2014
2015
2016
2017
2018
Exports FAO All Rice Price Index
Global rice trade and FAO All Rice Price Index
2002-2004=100Million tonnes, milled eq.
f'cas
t
f'cas
t

FAO RICE MARKET MONITOR / DECEMBER 2017 INTERNATIONAL TRADE
8
shortfalls are likewise expected to encourage Afghanistan and Nepal to step-up imports over the course of 2018, with larger purchases also envisaged in the Republic of Korea, Malaysia and the United Arab Emirates. Combined, these would more than compensate for reductions in Bangladesh and Sri Lanka, where provided no major production setbacks are incurred next year, 2018 imports could ease to 1.4 million tonnes and 500 000 tonnes, respectively. In both cases, however, forecast levels would remain well over volumes normally purchased by both countries, given expectations of lingering supply tightness ahead of new-crop harvests in the second quarter of the year. Moreover, state stockpiles in Bangladesh were still reported to be below the 400 000 tonne mark in late November, compared to the 1.2 million tonnes held in this period between 2014 and 2015. The reduced levels were in spite of numerous supply deals reached in 2017, part of which are expected to be fulfilled over the course of 2018. Comparatively good harvests and a spate in 2017 imports are similarly expected to diminish 2018 purchases by the Islamic Republic of Iran and Turkey, with reductions in the former also stemming from intermittent bans on rice imports. In the case of Turkey, a forecast import volume of 280 000 tonnes would include state purchases conducted by the Turkish Grain Board (TMO), which received approval in July to import up to 100 000 tonnes of rice, free of duties, until 31 August 2018. In China (Mainland), the world’s largest single rice destination, 2018 purchases are seen holding steady at 5.8 million tonnes, amid continued large differentials between Chinese quotations and those of nearby origins. Meanwhile, the Chinese Government has left WTO mandated tariff rate quotas unchanged at 5.32 million tonnes for 2018. This volume is to be divided equally between Indica and Japonica varieties, with state-owned enterprises reserved a 50 percent share. After striking an all-time record of 16.0 million tonnes in 2017, deliveries to Africa are forecast to ease by 2 percent in 2018 to 15.6 million tonnes. The reduction primarily stems from lower expected deliveries to Senegal, Guinea, Mali and Sierra Leone. These would be largely the reflection of good local harvests in these countries, although somewhat higher international prices could also temper import demand over the year. Rice purchases are also forecast to return to more normal levels of around 20 000 tonnes in Egypt, as the renewal of an agreement between the Government and the local industry to supply rice for public distribution programs may negate the need to recur to imports next year. Traditionally a rice exporter, Egypt had seen high local quotations and setbacks in local Government procurement lead to imports of around 100 000 tonnes in 2016 and 2017. In the case of Kenya and Madagascar, forecast import reductions assume a normal unfolding of the 2018 season in both countries. This is
even if depleted inventories from drought-hit crops in 2017 may keep 2018 purchases at above-average levels of around 600 000 tonnes in Kenya, while Madagascar takes another 400 000 tonnes. By contrast, mirroring expectations that demand growth will continue to outstrip production gains, Nigeria is seen purchasing 300 000 tonnes more than in 2017, or 2.9 million tonnes. Due to prohibitive import duties and porous borders, the bulk of rice deliveries to Nigeria constitute unofficial inflows from neighboring countries with more lenient tariff regimes. The Nigerian Government has however recently announced that in its efforts to tackle smuggling, they would seek cooperation with Benin under the Badagry Agreement, a 2003 accord between the two countries on cross-border crimes. Burkina Faso, Cameroon, Gambia, Guinea Bissau, Mauritania, Niger and South Africa are all similarly forecast to purchase more in 2018.
Aggregate imports by Latin America and the Caribbean are predicted to pass from 4.3 million tonnes in 2017 to 4.0 million tonnes next year. The two largest destinations in the region, Brazil and Mexico, would account for much of the expected 6 percent contraction. In light of prospects of ample local availabilities from a good 2017 crops and record imports, Brazil is seen cutting 2018 purchases by 11 percent to 700 000 tonnes, while under similar circumstances Mexico lowers them by 9 percent to 680 000 tonnes. Cuba and Haiti are also envisaged to import less in 2018, largely offsetting gains in Bolivia, Chile, Costa Rica and Venezuela, where supplies would be needed to compensate for output shortfalls and to refurbish inventories. In the case of Peru, 2018 consignments are seen in the order of 270 000 tonnes, down 80 000 tonnes year-on-year, amid expected production recoveries. On the policy front, the Peruvian Government has also announced that it would exclude rice from the price band mechanism and instate an ad valorem
Far East
Others
0 5 9 14 182017 F 2018 F
Million tonnes, milled eq.
Rice imports by region
Lat. America & Car.
Near East Asia
Africa
F=forecast
FAO RICE MARKET MONITOR / DECEMBER 2017 INTERNATIONAL TRADE
9
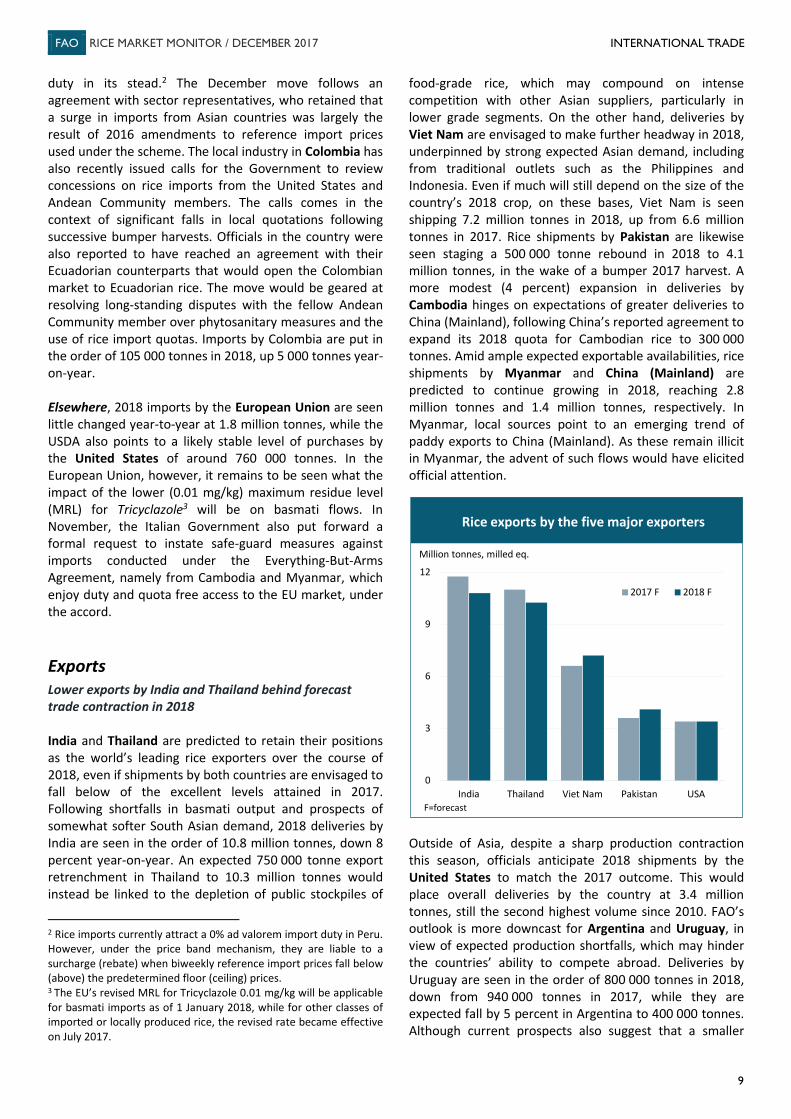
duty in its stead.2 The December move follows an agreement with sector representatives, who retained that a surge in imports from Asian countries was largely the result of 2016 amendments to reference import prices used under the scheme. The local industry in Colombia has also recently issued calls for the Government to review concessions on rice imports from the United States and Andean Community members. The calls comes in the context of significant falls in local quotations following successive bumper harvests. Officials in the country were also reported to have reached an agreement with their Ecuadorian counterparts that would open the Colombian market to Ecuadorian rice. The move would be geared at resolving long-standing disputes with the fellow Andean Community member over phytosanitary measures and the use of rice import quotas. Imports by Colombia are put in the order of 105 000 tonnes in 2018, up 5 000 tonnes year-on-year. Elsewhere, 2018 imports by the European Union are seen little changed year-to-year at 1.8 million tonnes, while the USDA also points to a likely stable level of purchases by the United States of around 760 000 tonnes. In the European Union, however, it remains to be seen what the impact of the lower (0.01 mg/kg) maximum residue level (MRL) for Tricyclazole3 will be on basmati flows. In November, the Italian Government also put forward a formal request to instate safe-guard measures against imports conducted under the Everything-But-Arms Agreement, namely from Cambodia and Myanmar, which enjoy duty and quota free access to the EU market, under the accord. Exports Lower exports by India and Thailand behind forecast trade contraction in 2018 India and Thailand are predicted to retain their positions as the world’s leading rice exporters over the course of 2018, even if shipments by both countries are envisaged to fall below of the excellent levels attained in 2017. Following shortfalls in basmati output and prospects of somewhat softer South Asian demand, 2018 deliveries by India are seen in the order of 10.8 million tonnes, down 8 percent year-on-year. An expected 750 000 tonne export retrenchment in Thailand to 10.3 million tonnes would instead be linked to the depletion of public stockpiles of
2 Rice imports currently attract a 0% ad valorem import duty in Peru. However, under the price band mechanism, they are liable to a surcharge (rebate) when biweekly reference import prices fall below (above) the predetermined floor (ceiling) prices. 3 The EU’s revised MRL for Tricyclazole 0.01 mg/kg will be applicable for basmati imports as of 1 January 2018, while for other classes of imported or locally produced rice, the revised rate became effective on July 2017.
food-grade rice, which may compound on intense competition with other Asian suppliers, particularly in lower grade segments. On the other hand, deliveries by Viet Nam are envisaged to make further headway in 2018, underpinned by strong expected Asian demand, including from traditional outlets such as the Philippines and Indonesia. Even if much will still depend on the size of the country’s 2018 crop, on these bases, Viet Nam is seen shipping 7.2 million tonnes in 2018, up from 6.6 million tonnes in 2017. Rice shipments by Pakistan are likewise seen staging a 500 000 tonne rebound in 2018 to 4.1 million tonnes, in the wake of a bumper 2017 harvest. A more modest (4 percent) expansion in deliveries by Cambodia hinges on expectations of greater deliveries to China (Mainland), following China’s reported agreement to expand its 2018 quota for Cambodian rice to 300 000 tonnes. Amid ample expected exportable availabilities, rice shipments by Myanmar and China (Mainland) are predicted to continue growing in 2018, reaching 2.8 million tonnes and 1.4 million tonnes, respectively. In Myanmar, local sources point to an emerging trend of paddy exports to China (Mainland). As these remain illicit in Myanmar, the advent of such flows would have elicited official attention.
Outside of Asia, despite a sharp production contraction this season, officials anticipate 2018 shipments by the United States to match the 2017 outcome. This would place overall deliveries by the country at 3.4 million tonnes, still the second highest volume since 2010. FAO’s outlook is more downcast for Argentina and Uruguay, in view of expected production shortfalls, which may hinder the countries’ ability to compete abroad. Deliveries by Uruguay are seen in the order of 800 000 tonnes in 2018, down from 940 000 tonnes in 2017, while they are expected fall by 5 percent in Argentina to 400 000 tonnes. Although current prospects also suggest that a smaller
0
3
6
9
12
India Thailand Viet Nam Pakistan USA
2017 F 2018 F
Million tonnes, milled eq.
Rice exports by the five major exporters
F=forecast

FAO RICE MARKET MONITOR / DECEMBER 2017 RICE UTILIZATION AND DOMESTIC PRICES
10
2018 crop is likely to be gathered in Brazil, ample inventories along with less intense competition with fellow South American suppliers could still enable the country to step-up shipments to around 720 000 tonnes next year. If confirmed, this volume would reposition Brazil as a net rice exporter, a position it lost in 2016, when an output shortfalls and a successive appreciation of the Real began to depress deliveries. The export outlook is similarly positive for Australia, Paraguay and Guyana, all of which should count on sufficient availabilities to export more in 2018. In the case of Guyana, expected gains would also reflect the country’s progress in diversifying its destination markets. Cuba, Mexico and Panama have all emerged as important destinations of Guyanese rice since 2016, compensating for sluggish deliveries to the European Union and, in particular, to Venezuela following the interruption of the PetroCaribe rice-for-oil barter agreement in late 2015.
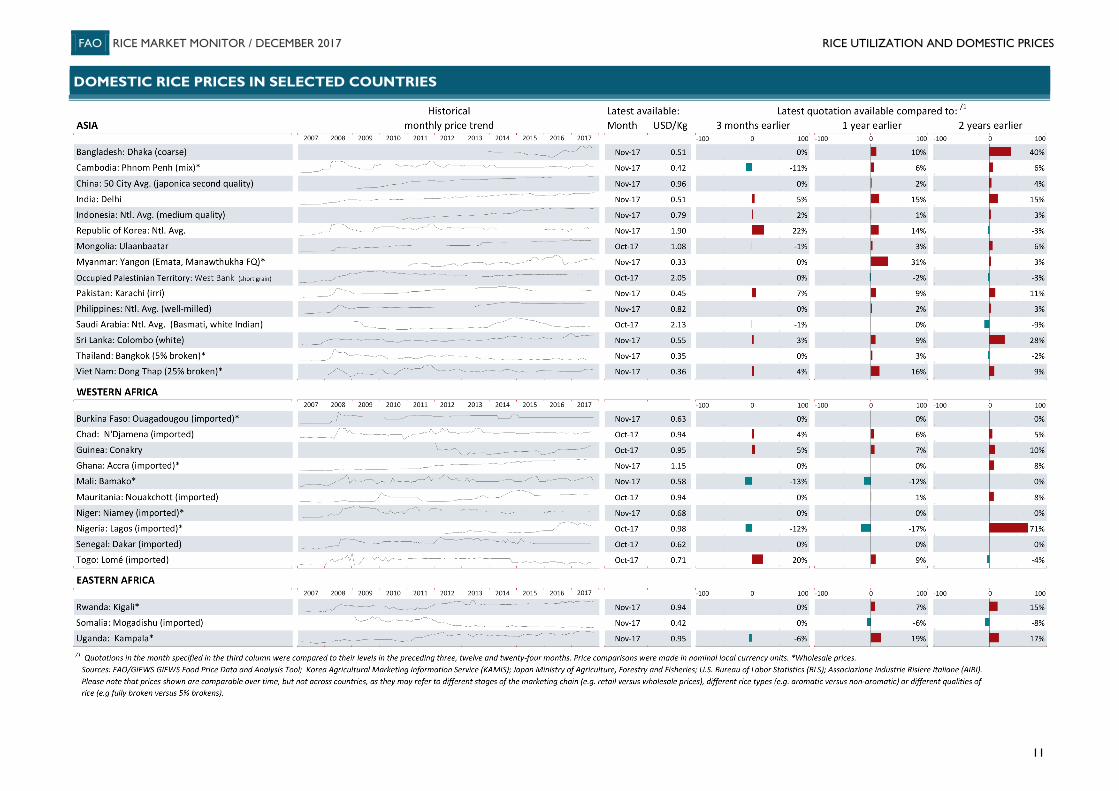
RICE UTILIZATION AND DOMESTIC PRICES Greater food consumption to drive a 1 percent increase in world rice use Forecasts of world rice utilisation in 2017/18 have undergone only minor adjustments since the October issue of the RMM, as somewhat higher than previously anticipated use forecasts for Bangladesh and Viet Nam were largely compensated by downward corrections for China (Mainland), India and Myanmar. Overall, 503.5 million tonnes (milled basis) are projected to be used over the course of the season, up from 497.9 million tonnes in 2016/17. Consumption of rice as food remains forecast to account for all of this increase, passing from 400.9 million tonnes in 2016/17 to 406.7 million tonnes this season. On a per caput basis, this volume would put world rice consumption as food at 53.9 kilos per person, up just 0.2 kilos from 2016/17. Quantities destined to animal feed are forecast to decline by 2 percent to 17.5 million tonnes in 2017/18, with another 79.4 million tonnes are used for seed, non-food industrial uses and post-harvest losses, unchanged from the previous season. Looking at retail/wholesale price developments, domestic quotations in Asia were steady to firmer during the fourth quarter of the year, when compared to their level three months earlier. The most notably exception to this trend was Cambodia, where domestic prices eased markedly, following the start of main-crop harvesting activities. Instead, quotations in the Republic of Korea accelerated their pace of recovery, reaching a 22-month high by November, following the completion of the smallest harvest since 1980. Although more moderately, prices also
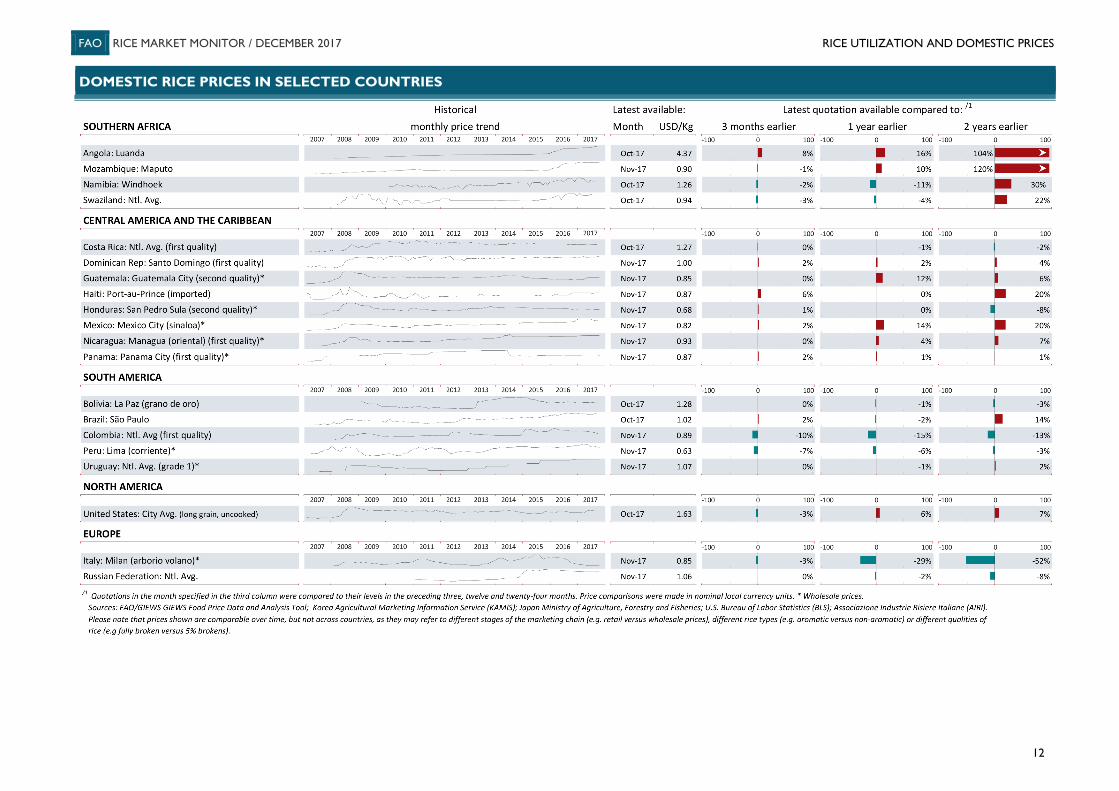
strengthened in India, where Government procurement got off to a strong start, in concert to a good pace of exports. Sales abroad also underpinned prices in Pakistan and Viet Nam, with storm-inflicted damages to the winter crop adding further price support in the latter. In Africa, domestic prices were higher in Angola and Togo, sustained by strong local demand, although seasonal tightness also underpinned gains in Chad and Guinea. Instead, the arrival of freshly harvested supplies weighed heavily on domestic quotations in Mali and Nigeria, with further pressure in the Nigeria exerted by greater import arrivals this year. Elsewhere in the world, domestic quotations were only moderately changed, with a few exceptions. In Haiti, prices returned to levels prevailing since late 2016, after a momentary August lapse triggered by ample imports and a stronger Gourde. Conversely, domestic quotations were notably weaker in Colombia, pressured by a bumper 2017 harvest, and in Peru owing to sizeable imports.
FAO RICE MARKET MONITOR / DECEMBER 2017 RICE UTILIZATION AND DOMESTIC PRICES
11
DOMESTIC RICE PRICES IN SELECTED COUNTRIES
FAO RICE MARKET MONITOR / DECEMBER 2017 RICE UTILIZATION AND DOMESTIC PRICES
12
DOMESTIC RICE PRICES IN SELECTED COUNTRIES
FAO RICE MARKET MONITOR / DECEMBER 2017 CLOSING STOCKS
13
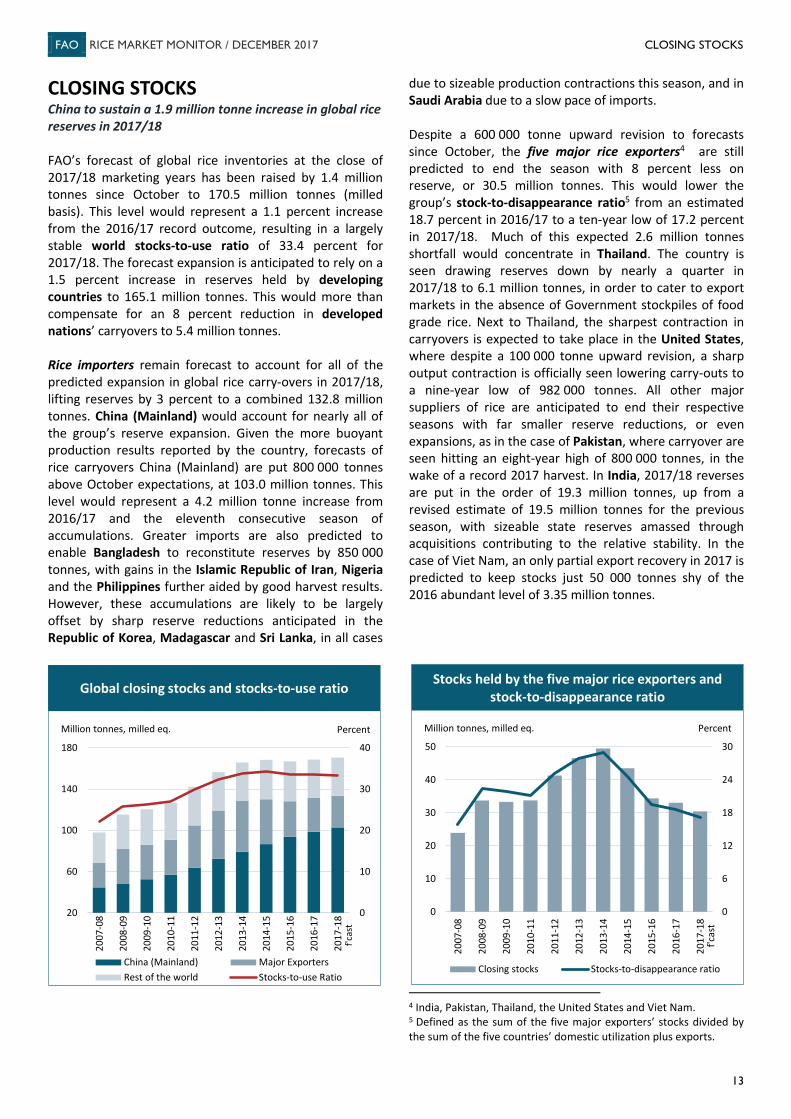
CLOSING STOCKS China to sustain a 1.9 million tonne increase in global rice reserves in 2017/18 FAO’s forecast of global rice inventories at the close of 2017/18 marketing years has been raised by 1.4 million tonnes since October to 170.5 million tonnes (milled basis). This level would represent a 1.1 percent increase from the 2016/17 record outcome, resulting in a largely stable world stocks-to-use ratio of 33.4 percent for 2017/18. The forecast expansion is anticipated to rely on a 1.5 percent increase in reserves held by developing countries to 165.1 million tonnes. This would more than compensate for an 8 percent reduction in developed nations’ carryovers to 5.4 million tonnes. Rice importers remain forecast to account for all of the predicted expansion in global rice carry-overs in 2017/18, lifting reserves by 3 percent to a combined 132.8 million tonnes. China (Mainland) would account for nearly all of the group’s reserve expansion. Given the more buoyant production results reported by the country, forecasts of rice carryovers China (Mainland) are put 800 000 tonnes above October expectations, at 103.0 million tonnes. This level would represent a 4.2 million tonne increase from 2016/17 and the eleventh consecutive season of accumulations. Greater imports are also predicted to enable Bangladesh to reconstitute reserves by 850 000 tonnes, with gains in the Islamic Republic of Iran, Nigeria and the Philippines further aided by good harvest results. However, these accumulations are likely to be largely offset by sharp reserve reductions anticipated in the Republic of Korea, Madagascar and Sri Lanka, in all cases
due to sizeable production contractions this season, and in Saudi Arabia due to a slow pace of imports. Despite a 600 000 tonne upward revision to forecasts since October, the five major rice exporters4 are still predicted to end the season with 8 percent less on reserve, or 30.5 million tonnes. This would lower the group’s stock-to-disappearance ratio5 from an estimated 18.7 percent in 2016/17 to a ten-year low of 17.2 percent in 2017/18. Much of this expected 2.6 million tonnes shortfall would concentrate in Thailand. The country is seen drawing reserves down by nearly a quarter in 2017/18 to 6.1 million tonnes, in order to cater to export markets in the absence of Government stockpiles of food grade rice. Next to Thailand, the sharpest contraction in carryovers is expected to take place in the United States, where despite a 100 000 tonne upward revision, a sharp output contraction is officially seen lowering carry-outs to a nine-year low of 982 000 tonnes. All other major suppliers of rice are anticipated to end their respective seasons with far smaller reserve reductions, or even expansions, as in the case of Pakistan, where carryover are seen hitting an eight-year high of 800 000 tonnes, in the wake of a record 2017 harvest. In India, 2017/18 reverses are put in the order of 19.3 million tonnes, up from a revised estimate of 19.5 million tonnes for the previous season, with sizeable state reserves amassed through acquisitions contributing to the relative stability. In the case of Viet Nam, an only partial export recovery in 2017 is predicted to keep stocks just 50 000 tonnes shy of the 2016 abundant level of 3.35 million tonnes.
4 India, Pakistan, Thailand, the United States and Viet Nam. 5 Defined as the sum of the five major exporters’ stocks divided by the sum of the five countries’ domestic utilization plus exports.
0
10
20
30
40
20
60
100
140
180
2007
-08
2008
-09
2009
-10
2010
-11
2011
-12
2012
-13
2013
-14
2014
-15
2015
-16
2016
-17
2017
-18
China (Mainland) Major ExportersRest of the world Stocks-to-use Ratio
Percent
f'cas
t
Global closing stocks and stocks-to-use ratio
Million tonnes, milled eq.
Global closing stocks and stocks-to-use ratio
0
6
12
18
24
30
0
10
20
30
40
50
2007
-08
2008
-09
2009
-10
2010
-11
2011
-12
2012
-13
2013
-14
2014
-15
2015
-16
2016
-17
2017
-18
Closing stocks Stocks-to-disappearance ratio
Million tonnes, milled eq. Percent
f'cas
t
Stocks held by the five major rice exporters and stock-to-disappearance ratio

FAO RICE MARKET MONITOR / DECEMBER 2017 INTERNATIONAL PRICES
14
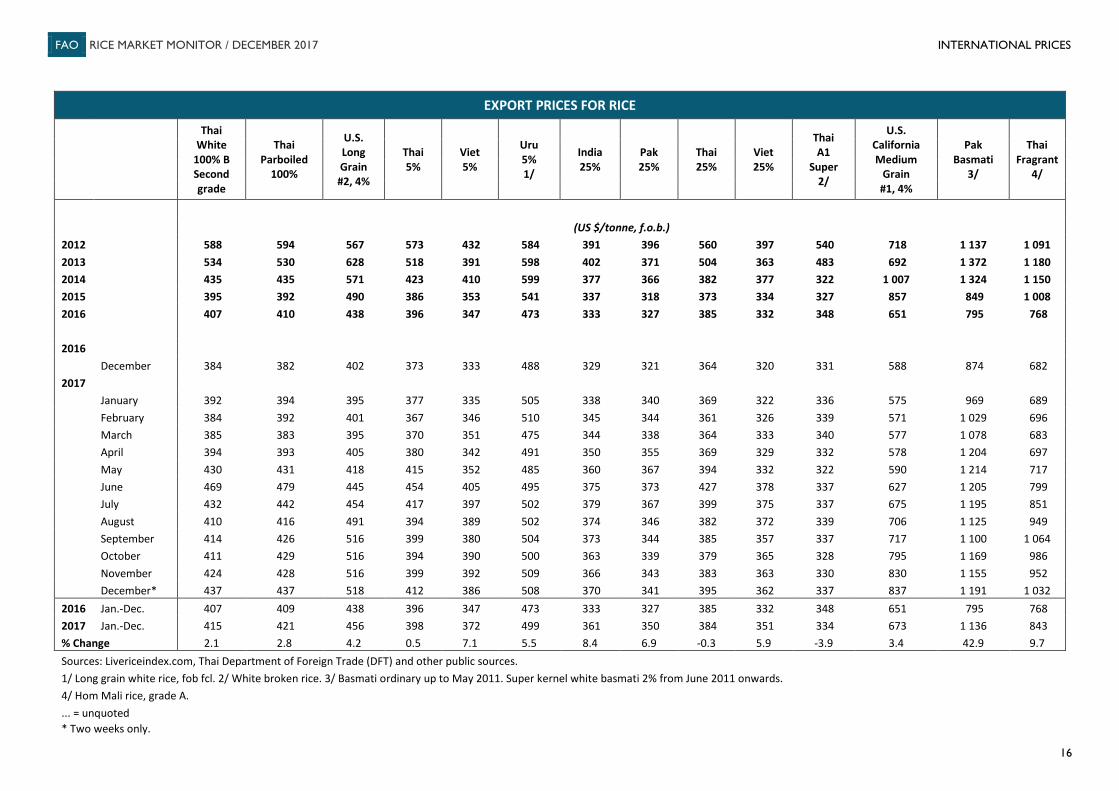
INTERNATIONAL PRICES International rice prices continue to inch up Although the last quarter of the year normally marks the onset of harvesting activities across major northern-hemisphere suppliers, international rice prices have continued to gain ground over the past two months. This was reflected by the FAO All Rice Price Index (2002-2004=100), which passed from an October average of 216 points to 221 points in mid-December.6 Higher quality Indica and Japonica rice led the advance, rising by 3 percent each, owing to stern import demand from South Asian and Far Eastern buyers and currency appreciations in some major rice exporters. Gains were in the order 2 percent for Aromatica supplies and of 1 percent for lower quality Indica rice, mirroring some downward pressure exerted in these segments by tepid buying interest and harvest progress. Looking at the major rice origins, export quotations have tended to strengthen in Thailand. Benchmark 100% B white rice was quoted at a six-month high of USD 437 per tonne in mid-December, up 6 percent from October levels. The increase coincided with a further strengthening of the Baht, which hit a 31-month high in late November, along with the launch of Government programmes seeking to stabilise prices by delaying the arrival of 12.5 million tonnes of paddy into the market. In the fragrant market, concerns over crop damages caused by floods provided additional support to quotations, more than offsetting downward pressure from subdued buying interest. In India, although a Rupee appreciation along with a fast pace of Government procurement were generally
6 All December 2017 values are based on price averages during the first two weeks only.
supportive of export quotations, competition with Thailand remained steadfast in the parboiled segment. Accordingly, Indian values of 25% broken white rice posted a 2 percent increase to USD 370 per tonne, while prices of IR64 5% parboiled rice eased by 2 percent to USD 400 per tonne. Sentiment was considerably firmer in the Indian fragrant market, where Pusa Basmati prices reacted to prospects lower fragrant output by reversing all losses incurred since June 2017. The quality was quoted at a mid-December value of USD 1350 per tonne, up 17 percent from October levels. In the United States, many of the factors that had underpinned price recoveries earlier in the year continued to be at play in the past few months, namely lower 2017 output and a series of import tenders by Japan and the Republic of Korea. A mid-November sale of 90 000 tonnes to Iraq, conducted under a memorandum of understanding first reached with the Government of Iraq in mid-2016, lent some more support prices in the long-grain segment. In Pakistan, sales to regular East African outlets have sustained a 1 percent recovery in Indica quotations since October. This is even if 25% brokens from the country continued to trade between USD 22-55 below values of competing origins, pressured by a sluggish export performance this year and new crop arrivals from an expected bumper 2017 harvest. Against the general tendency, export prices had a soft undertone in Viet Nam, mirroring a slowdown in trading activities since October. Still, crop losses incurred to successive storms tended to narrow decreases, maintaining 25% brokens about 1 percent short of October levels at USD 362 per tonne.
500
650
800
950
1100
1250
1400
Dec-15 Apr-16 Aug-16 Dec-16 Apr-17 Aug-17 Dec-17
Pakistan Basmati
India Pusa Basmati
Thai Fragrant 100% B
US 1/4% M.G.
USD per tonne
Export prices of higher quality Indica riceExport prices of Aromatic and Japonica rice
250
300
350
400
450
Dec-15 Apr-16 Aug-16 Dec-16 Apr-17 Aug-17 Dec-17
Thai 25% India 25%Viet 25% Pak 25%
USD per tonne
Export prices of 25% broken rice

FAO RICE MARKET MONITOR / DECEMBER 2017 INTERNATIONAL PRICES
15
From an annual stance, these tendencies positioned the annual average FAO All Rice Price Index at 207 points, 7 percent higher than in 2016 and just short of its 2015 average of 211 points. Price recoveries have been ubiquitous this year, but the strongest rebound concerned fragrant varieties (+34 percent), followed by lower quality Indica rice (+4 percent). In the higher quality Indica and Japonica segments, subdued trading activity early in the year tended to moderate gains to around 2 percent.
FAO Rice Price IndicesAll Japonica Aromatic
Higherquality
Lowerquality
2002-2004 = 1002013 233 219 226 230 2682014 235 207 201 266 2552015 211 184 184 263 1762016 194 180 187 228 153
2016 December 187 170 182 218 1562017 January 190 173 186 217 169
February 194 173 189 216 187March 195 171 189 216 193April 198 174 191 216 208May 202 181 193 218 209June 209 194 204 224 205July 210 188 204 231 208August 212 186 200 241 209September 212 188 197 238 215October 216 188 195 250 216November 219 191 196 256 213December* 221 193 197 257 221
2016 Jan.-Dec. 194 180 187 228 1532017 Jan.-Dec. 207 183 195 232 204% Change 6.7 1.7 4.2 1.8 33.6
Source: FAO
*Two weeks only.
Indica
N.B. - The FAO Rice Price Index is based on 16 rice export quotations. "Quality" isdefined by the percentage of broken kernels, with higher (lower) quality referringto rice with less (equal to or more) than 20 percent brokens. The Sub-Index forAromatic Rice follows movements in prices of Basmati and Fragrant rice.
70
120
170
220
270
320
1999 2001 2003 2005 2007 2009 2011 2013 2015 2017
Indica: Higher Quality
Indica: Lower Quality
Japonica
Aromatic
FAO Rice Price Indices
2002-2004=100
FAO RICE MARKET MONITOR / DECEMBER 2017 INTERNATIONAL PRICES
16
EXPORT PRICES FOR RICE
Thai White
100% B Second grade
Thai Parboiled
100%
U.S. Long Grain #2, 4%
Thai 5%
Viet 5%
Uru 5% 1/
India 25%
Pak 25%
Thai 25%
Viet 25%
Thai A1
Super 2/
U.S. California Medium
Grain #1, 4%
Pak Basmati
3/
Thai Fragrant
4/
(US $/tonne, f.o.b.) 2012
588 594 567 573 432 584 391 396 560 397 540 718 1 137 1 091
2013
534 530 628 518 391 598 402 371 504 363 483 692 1 372 1 180 2014
435 435 571 423 410 599 377 366 382 377 322 1 007 1 324 1 150
2015
395 392 490 386 353 541 337 318 373 334 327 857 849 1 008 2016
407 410 438 396 347 473 333 327 385 332 348 651 795 768
2016
December 384 382 402 373 333 488 329 321 364 320 331 588 874 682 2017
January 392 394 395 377 335 505 338 340 369 322 336 575 969 689 February 384 392 401 367 346 510 345 344 361 326 339 571 1 029 696 March 385 383 395 370 351 475 344 338 364 333 340 577 1 078 683 April 394 393 405 380 342 491 350 355 369 329 332 578 1 204 697 May 430 431 418 415 352 485 360 367 394 332 322 590 1 214 717 June 469 479 445 454 405 495 375 373 427 378 337 627 1 205 799 July 432 442 454 417 397 502 379 367 399 375 337 675 1 195 851 August 410 416 491 394 389 502 374 346 382 372 339 706 1 125 949 September 414 426 516 399 380 504 373 344 385 357 337 717 1 100 1 064 October 411 429 516 394 390 500 363 339 379 365 328 795 1 169 986 November 424 428 516 399 392 509 366 343 383 363 330 830 1 155 952 December* 437 437 518 412 386 508 370 341 395 362 337 837 1 191 1 032 2016 Jan.-Dec. 407 409 438 396 347 473 333 327 385 332 348 651 795 768 2017 Jan.-Dec. 415 421 456 398 372 499 361 350 384 351 334 673 1 136 843 % Change 2.1 2.8 4.2 0.5 7.1 5.5 8.4 6.9 -0.3 5.9 -3.9 3.4 42.9 9.7 Sources: Livericeindex.com, Thai Department of Foreign Trade (DFT) and other public sources.
1/ Long grain white rice, fob fcl. 2/ White broken rice. 3/ Basmati ordinary up to May 2011. Super kernel white basmati 2% from June 2011 onwards. 4/ Hom Mali rice, grade A.
... = unquoted * Two weeks only.
FAO RICE MARKET MONITOR / DECEMBER 2017 RICE POLICY DEVELOPMENTS
17
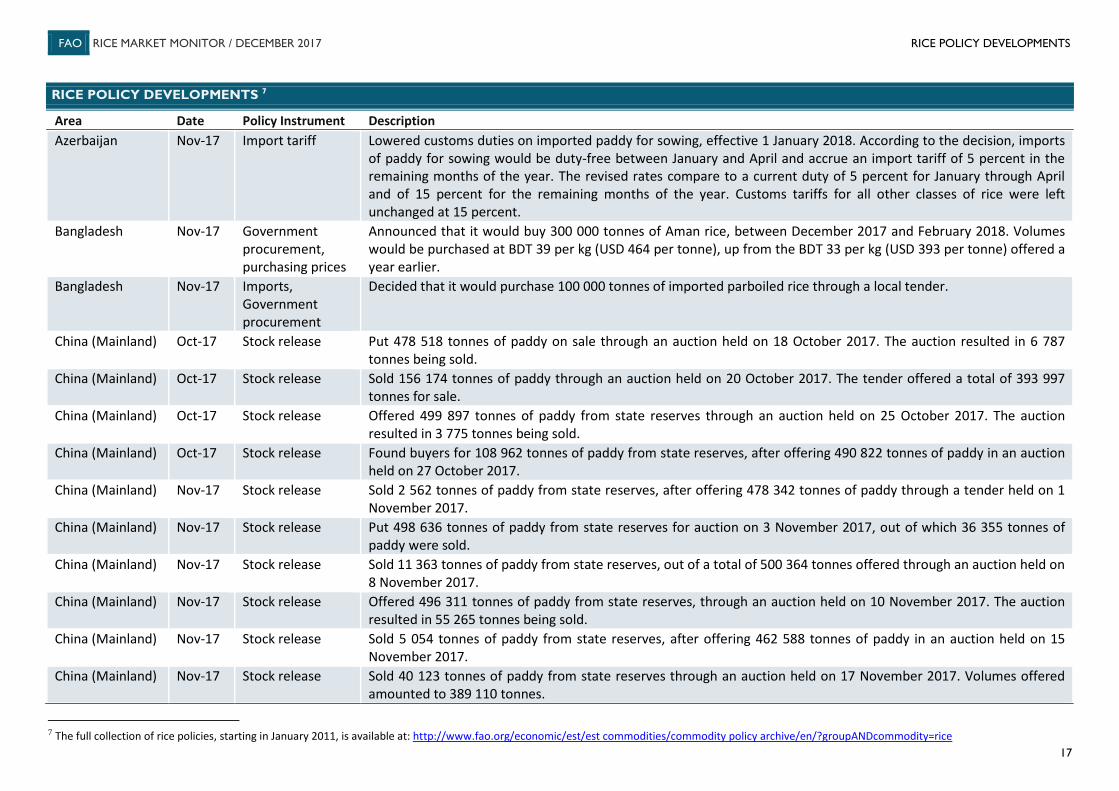
RICE POLICY DEVELOPMENTS 7
Area Date Policy Instrument Description Azerbaijan Nov-17 Import tariff Lowered customs duties on imported paddy for sowing, effective 1 January 2018. According to the decision, imports
of paddy for sowing would be duty-free between January and April and accrue an import tariff of 5 percent in the remaining months of the year. The revised rates compare to a current duty of 5 percent for January through April and of 15 percent for the remaining months of the year. Customs tariffs for all other classes of rice were left unchanged at 15 percent.
Bangladesh Nov-17 Government procurement, purchasing prices
Announced that it would buy 300 000 tonnes of Aman rice, between December 2017 and February 2018. Volumes would be purchased at BDT 39 per kg (USD 464 per tonne), up from the BDT 33 per kg (USD 393 per tonne) offered a year earlier.
Bangladesh Nov-17 Imports, Government procurement
Decided that it would purchase 100 000 tonnes of imported parboiled rice through a local tender.
China (Mainland) Oct-17 Stock release Put 478 518 tonnes of paddy on sale through an auction held on 18 October 2017. The auction resulted in 6 787 tonnes being sold.
China (Mainland) Oct-17 Stock release Sold 156 174 tonnes of paddy through an auction held on 20 October 2017. The tender offered a total of 393 997 tonnes for sale.
China (Mainland) Oct-17 Stock release Offered 499 897 tonnes of paddy from state reserves through an auction held on 25 October 2017. The auction resulted in 3 775 tonnes being sold.
China (Mainland) Oct-17 Stock release Found buyers for 108 962 tonnes of paddy from state reserves, after offering 490 822 tonnes of paddy in an auction held on 27 October 2017.
China (Mainland) Nov-17 Stock release Sold 2 562 tonnes of paddy from state reserves, after offering 478 342 tonnes of paddy through a tender held on 1 November 2017.
China (Mainland) Nov-17 Stock release Put 498 636 tonnes of paddy from state reserves for auction on 3 November 2017, out of which 36 355 tonnes of paddy were sold.
China (Mainland) Nov-17 Stock release Sold 11 363 tonnes of paddy from state reserves, out of a total of 500 364 tonnes offered through an auction held on 8 November 2017.
China (Mainland) Nov-17 Stock release Offered 496 311 tonnes of paddy from state reserves, through an auction held on 10 November 2017. The auction resulted in 55 265 tonnes being sold.
China (Mainland) Nov-17 Stock release Sold 5 054 tonnes of paddy from state reserves, after offering 462 588 tonnes of paddy in an auction held on 15 November 2017.
China (Mainland) Nov-17 Stock release Sold 40 123 tonnes of paddy from state reserves through an auction held on 17 November 2017. Volumes offered amounted to 389 110 tonnes.
7 The full collection of rice policies, starting in January 2011, is available at: http://www.fao.org/economic/est/est commodities/commodity policy archive/en/?groupANDcommodity=rice
FAO RICE MARKET MONITOR / DECEMBER 2017 RICE POLICY DEVELOPMENTS
18
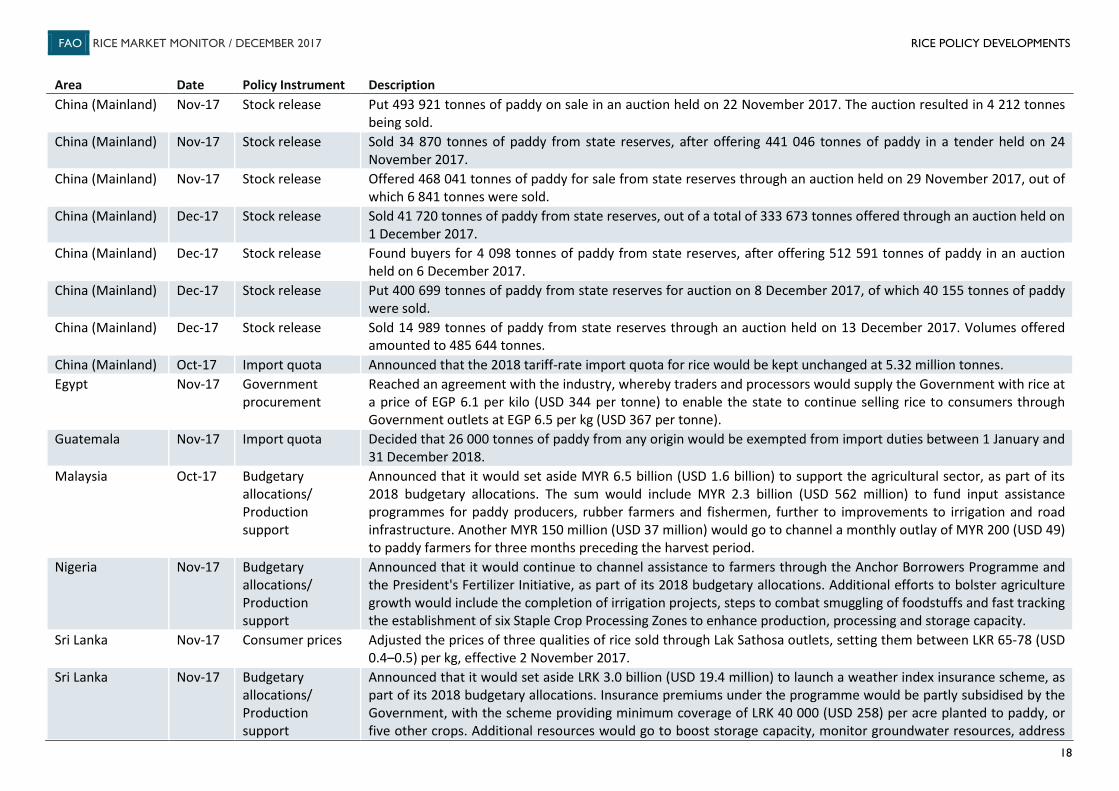
Area Date Policy Instrument Description China (Mainland) Nov-17 Stock release Put 493 921 tonnes of paddy on sale in an auction held on 22 November 2017. The auction resulted in 4 212 tonnes
being sold. China (Mainland) Nov-17 Stock release Sold 34 870 tonnes of paddy from state reserves, after offering 441 046 tonnes of paddy in a tender held on 24
November 2017. China (Mainland) Nov-17 Stock release Offered 468 041 tonnes of paddy for sale from state reserves through an auction held on 29 November 2017, out of
which 6 841 tonnes were sold. China (Mainland) Dec-17 Stock release Sold 41 720 tonnes of paddy from state reserves, out of a total of 333 673 tonnes offered through an auction held on
1 December 2017. China (Mainland) Dec-17 Stock release Found buyers for 4 098 tonnes of paddy from state reserves, after offering 512 591 tonnes of paddy in an auction
held on 6 December 2017. China (Mainland) Dec-17 Stock release Put 400 699 tonnes of paddy from state reserves for auction on 8 December 2017, of which 40 155 tonnes of paddy
were sold. China (Mainland) Dec-17 Stock release Sold 14 989 tonnes of paddy from state reserves through an auction held on 13 December 2017. Volumes offered
amounted to 485 644 tonnes. China (Mainland) Oct-17 Import quota Announced that the 2018 tariff-rate import quota for rice would be kept unchanged at 5.32 million tonnes. Egypt Nov-17 Government
procurement Reached an agreement with the industry, whereby traders and processors would supply the Government with rice at a price of EGP 6.1 per kilo (USD 344 per tonne) to enable the state to continue selling rice to consumers through Government outlets at EGP 6.5 per kg (USD 367 per tonne).
Guatemala Nov-17 Import quota Decided that 26 000 tonnes of paddy from any origin would be exempted from import duties between 1 January and 31 December 2018.
Malaysia Oct-17 Budgetary allocations/ Production support
Announced that it would set aside MYR 6.5 billion (USD 1.6 billion) to support the agricultural sector, as part of its 2018 budgetary allocations. The sum would include MYR 2.3 billion (USD 562 million) to fund input assistance programmes for paddy producers, rubber farmers and fishermen, further to improvements to irrigation and road infrastructure. Another MYR 150 million (USD 37 million) would go to channel a monthly outlay of MYR 200 (USD 49) to paddy farmers for three months preceding the harvest period.
Nigeria Nov-17 Budgetary allocations/ Production support
Announced that it would continue to channel assistance to farmers through the Anchor Borrowers Programme and the President's Fertilizer Initiative, as part of its 2018 budgetary allocations. Additional efforts to bolster agriculture growth would include the completion of irrigation projects, steps to combat smuggling of foodstuffs and fast tracking the establishment of six Staple Crop Processing Zones to enhance production, processing and storage capacity.
Sri Lanka Nov-17 Consumer prices Adjusted the prices of three qualities of rice sold through Lak Sathosa outlets, setting them between LKR 65-78 (USD 0.4–0.5) per kg, effective 2 November 2017.
Sri Lanka Nov-17 Budgetary allocations/ Production support
Announced that it would set aside LRK 3.0 billion (USD 19.4 million) to launch a weather index insurance scheme, as part of its 2018 budgetary allocations. Insurance premiums under the programme would be partly subsidised by the Government, with the scheme providing minimum coverage of LRK 40 000 (USD 258) per acre planted to paddy, or five other crops. Additional resources would go to boost storage capacity, monitor groundwater resources, address

FAO RICE MARKET MONITOR / DECEMBER 2017 RICE POLICY DEVELOPMENTS
19
Area Date Policy Instrument Description soil fertility problems and conserve water resources. Credit assistance for smallholders, processors and farmer organisations would also be provided under the Enterprise Sri Lanka Credit Scheme.
Sri Lanka Oct-17 Import tender Issued an international tender to import 150 000 tonnes of parboiled rice and 50 000 tonnes of white rice. Half of the total volume sought would need to be delivered by 30 November 2017 and the balance by 31 December 2017.
Thailand Oct-17 Stock release Announced that it would refrain from releasing supplies from Government inventories at harvest time in order to avoid pressuring local quotations. Subsequent statements by officials specified that auctions of state-owned rice would not resume until 2018.
Uruguay Nov-17 Production support
Approved a 15 percent discount on electricity tariffs for irrigation, valid from November 2017 until March 2018.
Venezuela Nov-17 Price controls Set ceilings on consumer prices for Type I rice at VEF 15 561 per kg, at VEF 13 709 per kg for Type II rice, and at VEF 12 537 per kg in the case of Type III rice.
Venezuela Nov-17 Support prices, price controls
Set producer prices for wet paddy at VEF 4 000 per kg. The move follows September discussions between sector representatives and Government entities, under the Law on Sovereign Supply and Agreed Prices (Plan 50) initiative that sets forth a new system to determine the prices of 50 necessities.
Zimbabwe Nov-17 Consumer prices As part of its efforts to stabilise domestic quotations, announced that prices of rice along with 15 other products deemed essential would be closely monitored and that recommended price levels for these goods would be disseminated to be public every fortnight. Essential commodities would also be prioritised in foreign exchange allocations in order to facilitate their import.
FAO RICE MARKET MONITOR / DECEMBER 2017 STATISTICAL TABLES
20
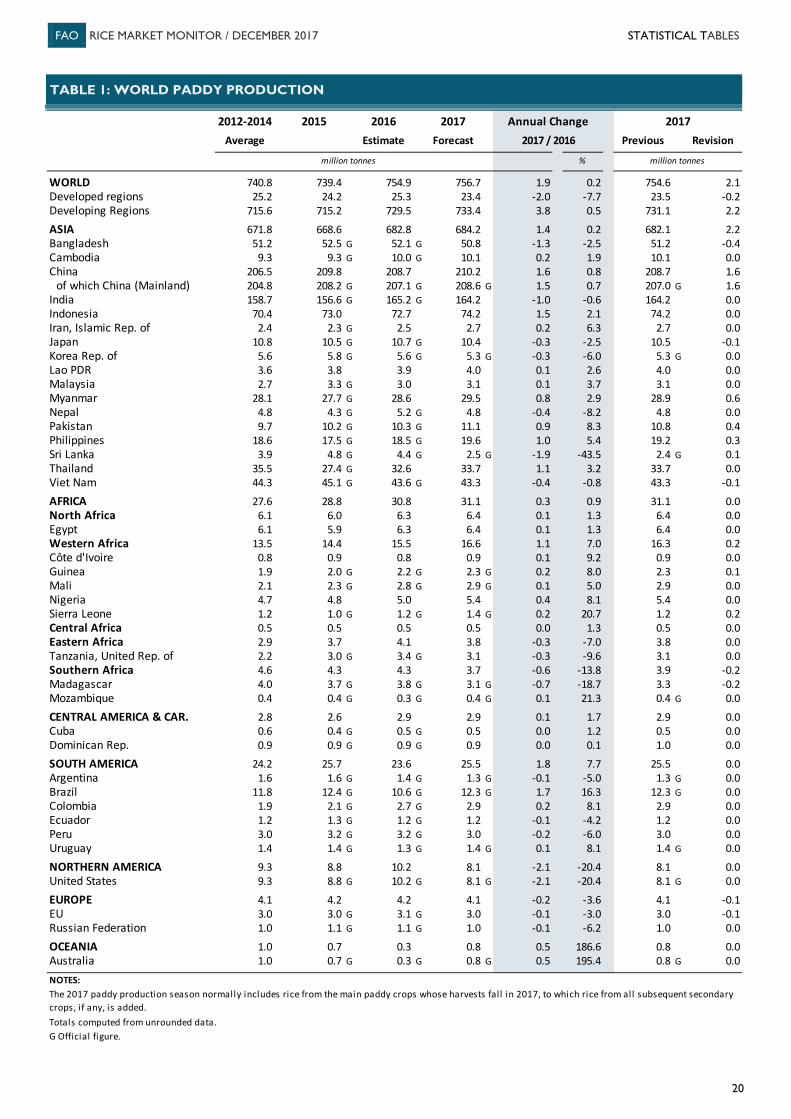
2012-2014 2015 2016 2017 Annual Change 2017Average Estimate Forecast 2017 / 2016 Previous Revision
million tonnes % million tonnes
WORLD 740.8 739.4 754.9 756.7 1.9 0.2 754.6 2.1Developed regions 25.2 24.2 25.3 23.4 -2.0 -7.7 23.5 -0.2Developing Regions 715.6 715.2 729.5 733.4 3.8 0.5 731.1 2.2
ASIA 671.8 668.6 682.8 684.2 1.4 0.2 682.1 2.2Bangladesh 51.2 52.5 G 52.1 G 50.8 -1.3 -2.5 51.2 -0.4Cambodia 9.3 9.3 G 10.0 G 10.1 0.2 1.9 10.1 0.0China 206.5 209.8 208.7 210.2 1.6 0.8 208.7 1.6
of which China (Mainland) 204.8 208.2 G 207.1 G 208.6 G 1.5 0.7 207.0 G 1.6India 158.7 156.6 G 165.2 G 164.2 -1.0 -0.6 164.2 0.0Indonesia 70.4 73.0 72.7 74.2 1.5 2.1 74.2 0.0Iran, Islamic Rep. of 2.4 2.3 G 2.5 2.7 0.2 6.3 2.7 0.0Japan 10.8 10.5 G 10.7 G 10.4 -0.3 -2.5 10.5 -0.1Korea Rep. of 5.6 5.8 G 5.6 G 5.3 G -0.3 -6.0 5.3 G 0.0Lao PDR 3.6 3.8 3.9 4.0 0.1 2.6 4.0 0.0Malaysia 2.7 3.3 G 3.0 3.1 0.1 3.7 3.1 0.0Myanmar 28.1 27.7 G 28.6 29.5 0.8 2.9 28.9 0.6Nepal 4.8 4.3 G 5.2 G 4.8 -0.4 -8.2 4.8 0.0Pakistan 9.7 10.2 G 10.3 G 11.1 0.9 8.3 10.8 0.4Philippines 18.6 17.5 G 18.5 G 19.6 1.0 5.4 19.2 0.3Sri Lanka 3.9 4.8 G 4.4 G 2.5 G -1.9 -43.5 2.4 G 0.1Thailand 35.5 27.4 G 32.6 33.7 1.1 3.2 33.7 0.0Viet Nam 44.3 45.1 G 43.6 G 43.3 -0.4 -0.8 43.3 -0.1
AFRICA 27.6 28.8 30.8 31.1 0.3 0.9 31.1 0.0North Africa 6.1 6.0 6.3 6.4 0.1 1.3 6.4 0.0Egypt 6.1 5.9 6.3 6.4 0.1 1.3 6.4 0.0Western Africa 13.5 14.4 15.5 16.6 1.1 7.0 16.3 0.2Côte d'Ivoire 0.8 0.9 0.8 0.9 0.1 9.2 0.9 0.0Guinea 1.9 2.0 G 2.2 G 2.3 G 0.2 8.0 2.3 0.1Mali 2.1 2.3 G 2.8 G 2.9 G 0.1 5.0 2.9 0.0Nigeria 4.7 4.8 5.0 5.4 0.4 8.1 5.4 0.0Sierra Leone 1.2 1.0 G 1.2 G 1.4 G 0.2 20.7 1.2 0.2Central Africa 0.5 0.5 0.5 0.5 0.0 1.3 0.5 0.0Eastern Africa 2.9 3.7 4.1 3.8 -0.3 -7.0 3.8 0.0Tanzania, United Rep. of 2.2 3.0 G 3.4 G 3.1 -0.3 -9.6 3.1 0.0Southern Africa 4.6 4.3 4.3 3.7 -0.6 -13.8 3.9 -0.2Madagascar 4.0 3.7 G 3.8 G 3.1 G -0.7 -18.7 3.3 -0.2Mozambique 0.4 0.4 G 0.3 G 0.4 G 0.1 21.3 0.4 G 0.0
CENTRAL AMERICA & CAR. 2.8 2.6 2.9 2.9 0.1 1.7 2.9 0.0Cuba 0.6 0.4 G 0.5 G 0.5 0.0 1.2 0.5 0.0Dominican Rep. 0.9 0.9 G 0.9 G 0.9 0.0 0.1 1.0 0.0
SOUTH AMERICA 24.2 25.7 23.6 25.5 1.8 7.7 25.5 0.0Argentina 1.6 1.6 G 1.4 G 1.3 G -0.1 -5.0 1.3 G 0.0Brazil 11.8 12.4 G 10.6 G 12.3 G 1.7 16.3 12.3 G 0.0Colombia 1.9 2.1 G 2.7 G 2.9 0.2 8.1 2.9 0.0Ecuador 1.2 1.3 G 1.2 G 1.2 -0.1 -4.2 1.2 0.0Peru 3.0 3.2 G 3.2 G 3.0 -0.2 -6.0 3.0 0.0Uruguay 1.4 1.4 G 1.3 G 1.4 G 0.1 8.1 1.4 G 0.0
NORTHERN AMERICA 9.3 8.8 10.2 8.1 -2.1 -20.4 8.1 0.0United States 9.3 8.8 G 10.2 G 8.1 G -2.1 -20.4 8.1 G 0.0
EUROPE 4.1 4.2 4.2 4.1 -0.2 -3.6 4.1 -0.1EU 3.0 3.0 G 3.1 G 3.0 -0.1 -3.0 3.0 -0.1Russian Federation 1.0 1.1 G 1.1 G 1.0 -0.1 -6.2 1.0 0.0
OCEANIA 1.0 0.7 0.3 0.8 0.5 186.6 0.8 0.0Australia 1.0 0.7 G 0.3 G 0.8 G 0.5 195.4 0.8 G 0.0
NOTES:
Totals computed from unrounded data.G Official figure.
The 2017 paddy production season normally includes rice from the main paddy crops whose harvests fall in 2017, to which rice from all subsequent secondary crops, if any, is added.
TABLE 1: WORLD PADDY PRODUCTION

FAO RICE MARKET MONITOR / DECEMBER 2017 STATISTICAL TABLES
21
2013-2015 2016 2017 2018 Annual Change 2018Average Estimate Forecast 2018 / 2017 Previous Revision
million tonnes, milled basis % million tonnes
WORLD 43.6 41.5 46.2 45.8 -0.4 -0.9 45.4 0.4Developed regions 4.2 4.4 4.5 4.5 0.0 -0.6 4.4 0.0Developing Regions 39.4 37.0 41.7 41.3 -0.4 -0.9 41.0 0.3
ASIA 21.6 18.9 21.8 22.0 0.2 1.1 21.9 0.2Bangladesh 0.9 0.1 G 2.2 1.4 -0.8 -35.5 1.1 0.4China 6.4 6.3 6.3 6.3 0.0 0.1 6.4 -0.1
of which China (Mainland) 5.9 5.9 5.8 5.8 0.0 0.0 5.9 -0.1Indonesia 0.9 1.3 0.4 0.8 0.4 87.5 0.8 0.0Iran, Islamic Rep. of 1.5 1.1 1.5 1.3 -0.2 -10.3 1.4 -0.1Iraq 1.1 0.9 1.1 1.2 0.1 8.2 1.2 0.0Japan 0.7 0.7 G 0.7 0.7 0.0 0.0 0.7 0.0Malaysia 1.0 0.8 G 0.9 0.9 0.1 5.9 1.0 -0.1Philippines 1.5 0.7 1.1 1.5 0.4 35.5 1.5 0.0Saudi Arabia 1.4 1.2 G 1.2 1.4 0.2 18.6 1.5 -0.1United Arab Emirates 0.7 0.8 0.8 0.8 0.1 6.7 0.8 0.0
AFRICA 14.4 14.3 16.0 15.6 -0.4 -2.2 15.6 0.1Côte d'Ivoire 1.3 1.4 1.5 1.5 0.0 0.7 1.5 0.0Nigeria 2.8 2.2 2.6 2.9 0.3 11.5 2.9 0.0Senegal 1.3 1.1 1.4 1.2 -0.2 -12.1 1.2 0.0South Africa 0.9 0.8 G 0.9 0.9 0.0 1.1 0.9 0.0
CENTRAL AMERICA & CAR. 2.1 2.4 2.4 2.3 -0.1 -5.4 2.3 0.0Cuba 0.4 0.5 G 0.5 0.5 0.0 -3.8 0.5 0.0Mexico 0.7 0.7 G 0.8 0.7 -0.1 -9.3 0.7 0.0
SOUTH AMERICA 1.6 1.8 1.8 1.7 -0.1 -7.8 1.7 0.0Brazil 0.6 0.7 G 0.8 0.7 -0.1 -11.4 0.7 0.0
NORTHERN AMERICA 1.1 1.2 1.2 1.2 0.0 -0.8 1.2 0.0United States 0.7 0.8 G 0.8 G 0.8 G 0.0 0.0 0.8 G 0.0
EUROPE 2.2 2.3 2.4 2.4 0.0 -0.2 2.4 0.0EU 1/ 1.6 1.8 G 1.8 1.8 0.0 -0.5 1.8 0.0Russian Federation 0.3 0.2 G 0.2 0.2 0.0 -4.2 0.2 0.0
OCEANIA 0.5 0.5 0.5 0.5 0.0 -0.9 0.5 0.0
NOTES:Totals computed from unrounded data.G Official figure.1/ Excluding EU intra-trade.
TABLE 2: WORLD RICE IMPORTS
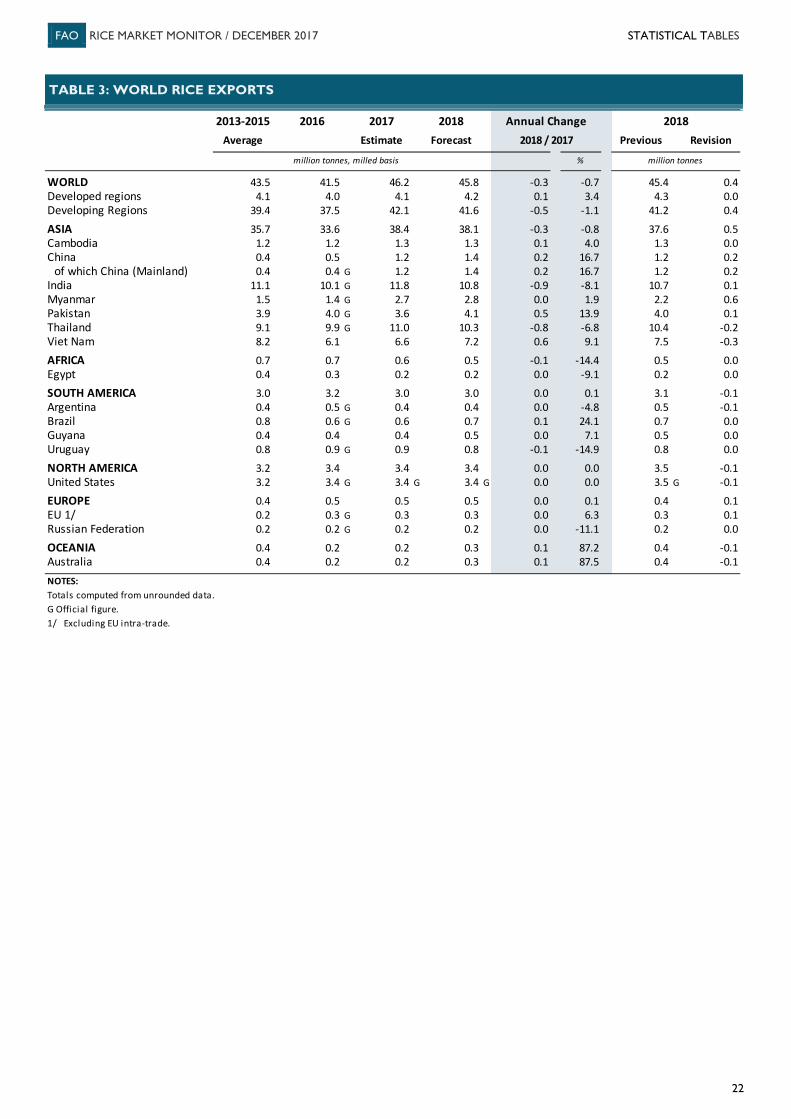
FAO RICE MARKET MONITOR / DECEMBER 2017 STATISTICAL TABLES
22
2013-2015 2016 2017 2018 Annual Change 2018Average Estimate Forecast 2018 / 2017 Previous Revision
million tonnes, milled basis % million tonnes
WORLD 43.5 41.5 46.2 45.8 -0.3 -0.7 45.4 0.4Developed regions 4.1 4.0 4.1 4.2 0.1 3.4 4.3 0.0Developing Regions 39.4 37.5 42.1 41.6 -0.5 -1.1 41.2 0.4
ASIA 35.7 33.6 38.4 38.1 -0.3 -0.8 37.6 0.5Cambodia 1.2 1.2 1.3 1.3 0.1 4.0 1.3 0.0China 0.4 0.5 1.2 1.4 0.2 16.7 1.2 0.2
of which China (Mainland) 0.4 0.4 G 1.2 1.4 0.2 16.7 1.2 0.2India 11.1 10.1 G 11.8 10.8 -0.9 -8.1 10.7 0.1Myanmar 1.5 1.4 G 2.7 2.8 0.0 1.9 2.2 0.6Pakistan 3.9 4.0 G 3.6 4.1 0.5 13.9 4.0 0.1Thailand 9.1 9.9 G 11.0 10.3 -0.8 -6.8 10.4 -0.2Viet Nam 8.2 6.1 6.6 7.2 0.6 9.1 7.5 -0.3
AFRICA 0.7 0.7 0.6 0.5 -0.1 -14.4 0.5 0.0Egypt 0.4 0.3 0.2 0.2 0.0 -9.1 0.2 0.0
SOUTH AMERICA 3.0 3.2 3.0 3.0 0.0 0.1 3.1 -0.1Argentina 0.4 0.5 G 0.4 0.4 0.0 -4.8 0.5 -0.1Brazil 0.8 0.6 G 0.6 0.7 0.1 24.1 0.7 0.0Guyana 0.4 0.4 0.4 0.5 0.0 7.1 0.5 0.0Uruguay 0.8 0.9 G 0.9 0.8 -0.1 -14.9 0.8 0.0
NORTH AMERICA 3.2 3.4 3.4 3.4 0.0 0.0 3.5 -0.1United States 3.2 3.4 G 3.4 G 3.4 G 0.0 0.0 3.5 G -0.1
EUROPE 0.4 0.5 0.5 0.5 0.0 0.1 0.4 0.1EU 1/ 0.2 0.3 G 0.3 0.3 0.0 6.3 0.3 0.1Russian Federation 0.2 0.2 G 0.2 0.2 0.0 -11.1 0.2 0.0
OCEANIA 0.4 0.2 0.2 0.3 0.1 87.2 0.4 -0.1Australia 0.4 0.2 0.2 0.3 0.1 87.5 0.4 -0.1
NOTES:Totals computed from unrounded data.G Official figure.1/ Excluding EU intra-trade.
TABLE 3: WORLD RICE EXPORTS

FAO RICE MARKET MONITOR / DECEMBER 2017 STATISTICAL TABLES
23
2013-2015 2016 2017 2018 Annual Change 2018Average Estimate Forecast 2018 / 2017 Previous Revision
million tonnes, milled basis % million tonnes
WORLD 163.6 167.1 168.6 170.5 1.9 1.1 169.2 1.4Developed regions 5.7 5.9 5.9 5.4 -0.5 -8.1 5.4 0.0Developing Regions 157.9 161.2 162.7 165.1 2.4 1.5 163.8 1.4
ASIA 154.2 157.1 158.8 161.0 2.2 1.4 159.7 1.3Bangladesh 6.8 7.0 6.0 6.9 0.9 14.2 6.9 -0.1Cambodia 1.6 1.6 1.7 1.8 0.1 6.4 1.8 0.0China 79.9 94.0 99.0 103.3 4.2 4.3 102.5 0.8
of which China (Mainland) 79.6 93.8 98.8 103.0 4.2 4.3 102.2 0.8India 24.2 18.9 19.5 19.3 -0.2 -0.9 19.0 0.3Indonesia 6.8 6.7 6.8 6.7 -0.1 -1.5 6.7 0.0Iran, Islamic Rep. of 0.7 0.6 0.6 0.6 0.0 3.3 0.5 0.2Japan 3.6 3.4 3.4 3.3 -0.1 -1.5 3.4 -0.1Korea Rep. of 1.2 1.6 1.5 1.0 -0.5 -32.0 1.0 0.0Lao PDR 0.3 0.5 0.6 0.6 0.0 5.5 0.6 0.0Malaysia 0.3 0.5 0.4 0.3 -0.1 -15.4 0.3 0.0Myanmar 3.0 2.8 2.3 2.5 0.1 4.7 2.4 0.1Nepal 0.4 0.3 0.5 0.4 -0.1 -15.2 0.4 0.0Pakistan 0.5 0.5 0.7 0.8 0.1 15.9 0.8 0.1Philippines 2.3 2.7 G 2.3 G 2.7 0.4 15.0 2.6 0.1Sri Lanka 0.3 0.8 0.6 0.3 -0.3 -55.2 0.3 0.0Thailand 17.8 10.7 8.1 6.1 -2.0 -24.7 6.0 0.1Viet Nam 2.9 2.8 3.4 3.3 -0.1 -1.5 3.3 0.1
AFRICA 4.9 4.5 4.7 4.6 -0.2 -3.7 4.6 -0.1Egypt 0.6 0.5 0.7 0.7 0.0 4.5 0.7 0.0Nigeria 0.9 0.7 0.4 0.5 0.1 30.0 0.5 0.0
CENTRAL AMERICA & CAR. 0.5 0.4 0.6 0.5 0.0 -4.7 0.6 0.0Dominican Rep. 0.1 0.0 0.1 0.1 0.0 -3.3 0.1 0.0
SOUTH AMERICA 2.0 2.4 1.9 2.3 0.4 18.5 2.3 0.0Argentina 0.1 0.4 0.3 0.2 -0.1 -28.0 0.1 0.0Brazil 0.9 0.7 G 0.3 G 0.9 0.6 200.4 0.9 0.0Ecuador 0.1 0.1 0.1 0.1 -0.1 -50.0 0.1 0.0Peru 0.4 0.4 0.4 0.4 0.0 -2.7 0.3 0.0
NORTHERN AMERICA 1.3 1.6 1.6 1.1 -0.5 -31.9 1.0 0.1United States 1.2 1.5 G 1.5 G 1.0 G -0.5 -32.8 0.9 G 0.1
EUROPE 0.7 0.8 0.8 0.8 0.0 -4.9 0.8 -0.1EU 0.5 0.5 G 0.6 0.6 0.0 -3.4 0.6 -0.1Russian Federation 0.1 0.1 0.1 0.1 0.0 -18.2 0.1 0.0
OCEANIA 0.2 0.3 0.2 0.3 0.1 52.4 0.3 0.0Australia 0.2 0.2 0.2 0.3 0.1 67.7 0.2 0.0
GOVERNMENT STOCKS
Bangladesh 0.9 1.0 G 0.5 G 0.8 0.3 67.3 0.8 0.0India 18.6 15.9 G 17.5 G 17.2 -0.3 -1.8 16.8 0.4Japan 1.5 1.5 1.5 1.5 0.0 -1.3 1.5 0.0Philippines 0.6 0.9 G 0.2 G 0.5 0.3 222.7 0.5 0.0
NOTES:Totals computed from unrounded data.G Official figure.1/ Data refer to carry-overs at the close of national marketing years ending in the year shown.
TABLE 4: END OF SEASON STOCKS 1/
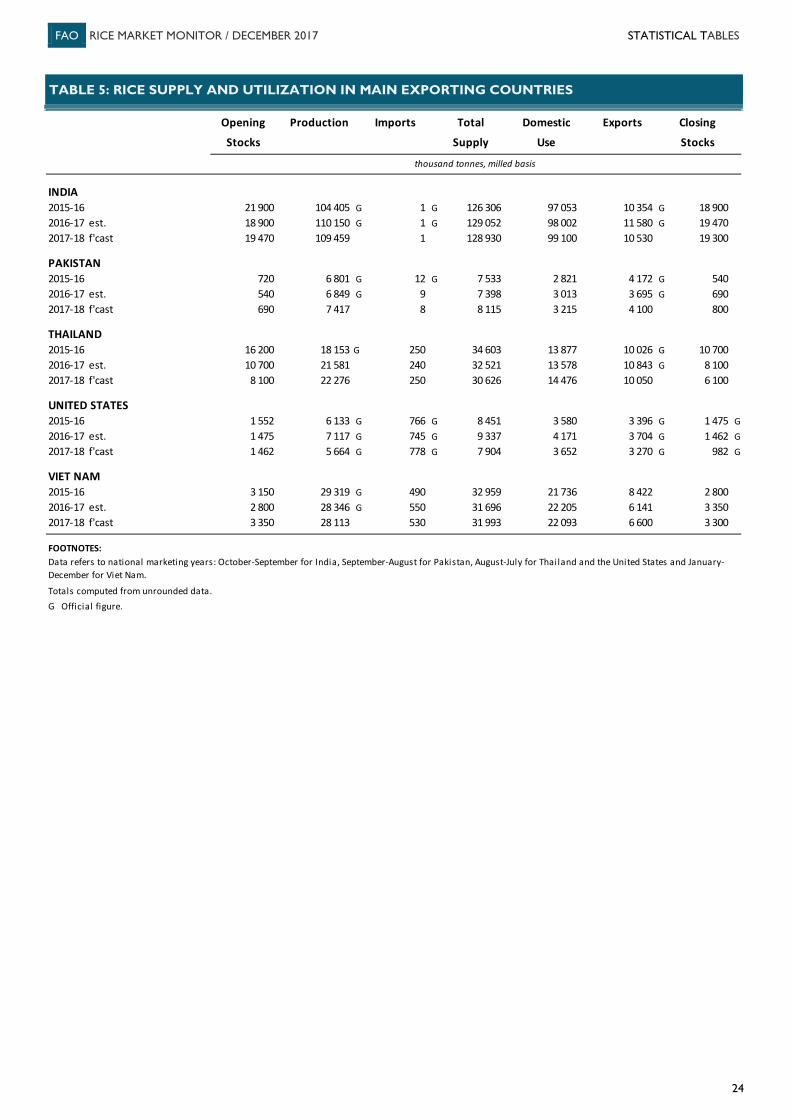
FAO RICE MARKET MONITOR / DECEMBER 2017 STATISTICAL TABLES
24
Opening Production Imports Total Domestic Exports Closing
Stocks Supply Use Stocks
thousand tonnes, milled basis
INDIA2015-16 21 900 104 405 G 1 G 126 306 97 053 10 354 G 18 9002016-17 est. 18 900 110 150 G 1 G 129 052 98 002 11 580 G 19 4702017-18 f'cast 19 470 109 459 1 128 930 99 100 10 530 19 300
PAKISTAN 2015-16 720 6 801 G 12 G 7 533 2 821 4 172 G 5402016-17 est. 540 6 849 G 9 7 398 3 013 3 695 G 6902017-18 f'cast 690 7 417 8 8 115 3 215 4 100 800
THAILAND2015-16 16 200 18 153 G 250 34 603 13 877 10 026 G 10 7002016-17 est. 10 700 21 581 240 32 521 13 578 10 843 G 8 1002017-18 f'cast 8 100 22 276 250 30 626 14 476 10 050 6 100
UNITED STATES2015-16 1 552 6 133 G 766 G 8 451 3 580 3 396 G 1 475 G2016-17 est. 1 475 7 117 G 745 G 9 337 4 171 3 704 G 1 462 G2017-18 f'cast 1 462 5 664 G 778 G 7 904 3 652 3 270 G 982 G
VIET NAM2015-16 3 150 29 319 G 490 32 959 21 736 8 422 2 8002016-17 est. 2 800 28 346 G 550 31 696 22 205 6 141 3 3502017-18 f'cast 3 350 28 113 530 31 993 22 093 6 600 3 300
FOOTNOTES:
Totals computed from unrounded data.G Official figure.
Data refers to national marketing years: October-September for India, September-August for Pakistan, August-July for Thailand and the United States and January-December for Viet Nam.
TABLE 5: RICE SUPPLY AND UTILIZATION IN MAIN EXPORTING COUNTRIES

5 7
The FAO Rice Market Monitor (RMM) provides an analysis of the most recent developments in the global rice market, including a short-term outlook. Current and previous issues of the RMM can be consulted at: http://www.fao.org/economic/RMM. Monthly updates of selected rice export prices are available on the FAO Rice Price Update at: http://www.fao.org/economic/RPU. A collection of major rice policy developments starting in January 2011 is available at: http://www.fao.org/economic/est/est-commodities/commodity-policy-archive/en/?groupANDcommodity=rice. To subscribe to the FAO Rice Price Update and the FAO Rice Market Monitor, please send an e-mail to [email protected] with "subscribe" in the subject line. Use of material subject to credit given to source: FAO Rice Market Monitor Trade and Markets Division Food and Agriculture Organization of the United Nations
I8317EN/1/12.17 © FAO, 2017