round table on tribal programming for unicef india country porgramme
TRANSCRIPT

Round table on programming for Tribal Areas
17th May 2016

Tribal Demography

Fast facts
705Scheduled Tribes
104million (2011)
8.6%of total population
90%live in Rural areas
0
350
700
1050
1400
1961 1971 1981 1991 2001 2011
1048468523830
1211
1029
839
665
548
439
India's population Tribal Population
75PVTGs
44million ST children
9.8%of child population
Delhi , Punjab , Haryana , Chandigarh , PuducherryStates/UTs with no ST population :

74%
of ST Population lives in West + Central India
By Geography
Source: Census 2011
8 15 23 30
10866Central West Northeast Rest of India
Number of States by Region
Chattisgarh Jharkhand
Odisha Madhya Pradesh
West Bengal Bihar
Gujarat Rajasthan
Maharashtra Goa
Daman & Diu Dadar & Nagar Haveli
% Population by Region
74%of ST Population lives in West +
Central India

By districts
0 175 350 525 700
90791342821540
0 0-1 % 1-5% 5-20% 20-50% 50+%
% of district population
90 districts out of 640 have more than 50% of the population as
tribals
Source: Census 2011
14% of all districts are predominantly
tribal
Who are the tribals ?

Lokur Committee , 1965
Indications of primitive traits
Distinctive Culture
Shyness of contact -with the community at large
Geographical Isolation
Backwardness
Source : Article 365 of the Constitution of India refers to Scheduled Tribes , # Essential characteristics -Lokur Committee 1965

Special development initiatives
1950 -74
1974 -79
Specific Measures to promote equal opportunities especially through provision of health & education
Special multipurpose development projects as supplements to community development projects in tribal areas
New approach of Tribal Sub Plans (TSPs)
Integrated Tribal Development Projects (ITDPs)
TSPs have separate budget heads in plan documents in proportion to ST population . This was done with an
objective to eliminate forms of exploitation and accelerate
development.
Focus on Welfare Focus on Development

Schedule V Areas - Central & Western regions
Administration of tribal areas in 9 states : •Andhra Pradesh , Chhattisgarh , Gujarat •Himachal Pradesh, Madhya Pradesh , Jharkhand •Maharashtra , Odisha, Rajasthan
Districts that come under Schedule V Areas , have significant ST population , though the State may or may not have significant ST population
Tribes Advisory Council (TACs) setup in 9 states + West Bengal and Tamil Nadu : • Advisory body •No legislative or law making powers
Schedule V grants extensive powers to the Governors • The well being of the tribal population depends on the initiatives of the governors
in these states

Legal Protection
Approve plans, programmes and projects for social and economic development
Mandatory Powers
Consultative Powers
Recommendatory Powers
Powers to be devolved by State Govts.
PESA - Panchayat Extension to Scheduled Areas ,1996 - recognises traditional & customary methods of Community management and confers enormous rights to the Gram Sabha to self-regulate and self-govern
On matters relating to the acquisition of land for developmental projects
For the grant of a prospecting license or mining lease for minor minerals
Enforce prohibition or regulate or restrict sale of any intoxicant , manage village markets, exercise control over money lending to STs,
exercise control over institutions and functionaries in the social sectors

Schedule VI
Ensures protection of tribal areas & interests in North Eastern India
Allows self-governance through constitutional institutions at the district or regional levels
Provides for the creation of Autonomous District & Regional Councils
Unlike in Schedule V , legislative ,educational and judicial powers are devolved to local bodies

STs are among the most deprived communities in India
Deprivation Classification Deprivations - STs V Rest
D1 Households with only one room, kuccha walls and kuccha roof
D2. No adult member in household between age 18 and 59
D3. Female headed household with no adult male member between 16 and 59
D4. Households with differently able member with no other able bodied adult member
D5. SC/ST Households
D6. Households with no literate adult above age 25 years
D7 Landless households deriving a major part of their income from manual labour
All STs
Households with at least 2 Deprivations
30 36
Households with at least 3 Deprivations
13 27
Households with at least 4 Deprivations
4 11
Households with at least 5 Deprivations
0.8 2.0
Households with at least 6 Deprivations
0.1 0.5
Households with all the 7 Deprivations
0.01 0.03
Source: SECC

Key features of Tribal Areas
Remote Location
Poor Connectivity & dispersed very small habitations
Low HDI
Relatively poor performance against Health, Education & Income indicators
Forest Area
Limited industrialisation , scope for Eco/heritage tourism

Plateauing of HDI in Tribal blocks - Maharashtra
0.3
0.6
0.9
1.2
Mumbai
PuneThaneNagpurKolhapurRaigarhSindhudurgNashikSataraSangliRatnagiriSolapurAurangabadW
ardhaJalgaonAkolaAhmednagarBhandaraChandrapurGondiyaAmravatiYavatmalBuldanaParbhaniBeedDhuleJalnaLaturNandedOsmanabadHingoliW
ashimGadchiroliNandurbar
0.70.746
4 out of 10 are Tribal Districts with lowest HDI value in both 2001 and 2011 – Nandurbar, Gadchiroli, Nanded, Dhule
HDI 2011

What are the challenges ?

Types of Challenges
Limited livelihood,Chronic health issues,Over exploitation of natural resources
Survival
Conflicts
Identity & Governance
Human Resource , Infrastructure & Institutions
Aspirational
Developmental Deficits
Preserving Cultural Heritage , Participation in all walks of life , Inadequate alternate vocational skills

Service provisioning in Tribal Areas is weak
Source: RSOC
SC ST OBC Others
Prenatal Care : Received 3 or more ANCs 59 56 61 73
Natal : Institutional delivery 76 70 79 84
Delivered by skilled health provider 79 73 82 86
% of children 12-23 months fully immunised 62 56 65 72
Girls (15-18) whose BMI <18.5 47 49 45 41
Household practicing open defecation 58 69 46 28

Levels of under-nutrition are worst among STs
Source: RSOC
SC ST OBC Others
Stunted (Height for Age below -2SD) 42 42 39 34
Severely stunted ( Height for Age below -3SD) 19 20 18 14
Wasted ( Weight for Height below -2SD) 16 19 15 14
Severely Wasted ( Weight for Height below -3SD) 5 5 4 4
Underweight ( Weight for Age below -2SD) 33 37 29 24
Severely Underweight ( Weight for Age below -3SD) 11 13 9 7
Percentage of children aged 0-59 months

Literacy Rates among STs is the lowest
Source: Census of India 2011
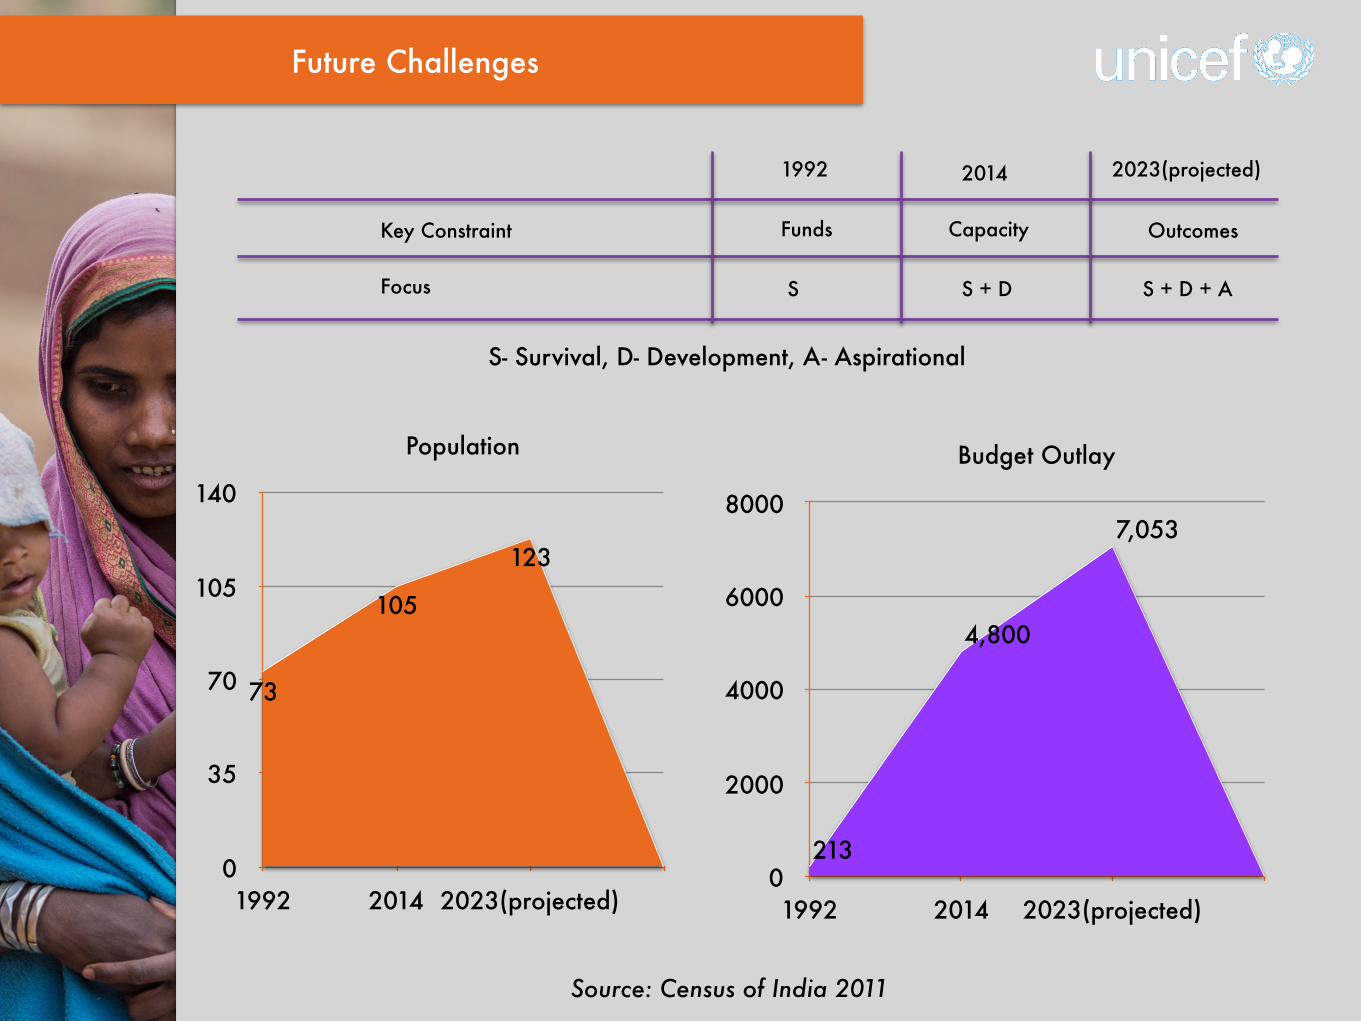
Future Challenges
Source: Census of India 2011
Population
0
35
70
105
140
1992 2014 2023(projected)
73
105
123
Budget Outlay
0
2000
4000
6000
8000
1992 2014 2023(projected)
213
4,800
7,053
1992 2014 2023(projected)
Key Constraint Funds Capacity Outcomes
Focus S S + D S + D + A
S- Survival, D- Development, A- Aspirational

What are the opportunities ?
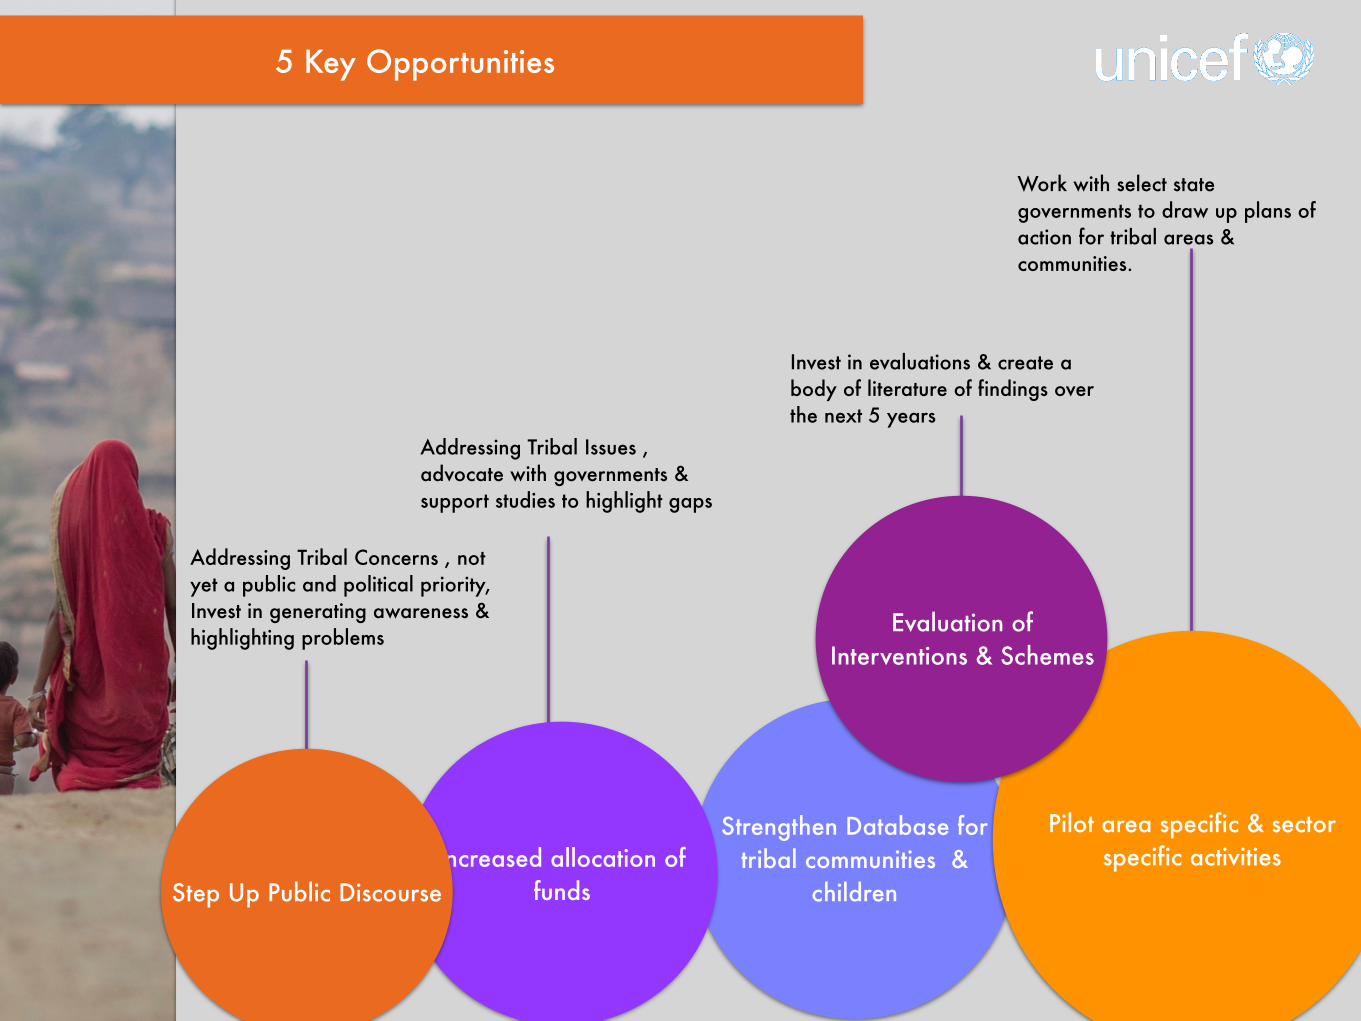
5 Key Opportunities
Strengthen Database for tribal communities &
children
Addressing Tribal Concerns , not yet a public and political priority, Invest in generating awareness & highlighting problems
Addressing Tribal Issues , advocate with governments & support studies to highlight gaps
Pilot area specific & sector specific activitiesIncreased allocation of
fundsStep Up Public Discourse
Evaluation of Interventions & Schemes
Invest in evaluations & create a body of literature of findings over the next 5 years
Work with select state governments to draw up plans of action for tribal areas & communities.

Current Stock Taking
CMAM , SABLA , WASH , ECCE ,
Gap-Analysis, Water-Resource Mapping, Tribal Missions, One Hot cooked meal,
GPDP, GR for 5% untied funds under TSP, PGC, Governor's Office, learning improvement in
conflict areas, mapping of mother tongue , mainstreaming of out of school children into schools ,
SSA, language progression , SOP for safety for wardens and teachers

UNICEF’s Roles
Advocacy
Knowledge Management
Capacity Building
Behaviour Change

Current Stock Taking khu-blei
#
# Thank You in the Khasi Language spoken in Meghalaya ,India