round rock isd - sharpschoolp5cdn5static.sharpschool.com/userfiles/servers/server_32715/file... ·...
TRANSCRIPT

Round Rock ISD
Board Budget Workshop
May 8, 2012

2012-13 BUDGET

Budget Development 2012-13
Narrative & Assumptions
May 8, 2012
General:
Certified Estimates of Property Values were received in late April. Estimates are 2.37% percent
greater than current values. This is 1.37% greater than previous estimates creating additional
property tax revenues of $2,436,906. Recalculation of state funding projects a decrease of
$2,283,626 as a result of the increase property tax collections. Overall, revenues are $153,280
greater than previously projected.
Expenditures:
Line 10: Salaries & Benefits
Salary adjustments of $6,697,855 were made based on the Board’s direction of
seeking salary increases of 3%. A reduction of $2.5 million in salaries was included
as an estimate of the level of salary increases that can be absorbed in the current
budget.
Line 13: Campus & Departments
Minor adjustments to a few department budgets were made based on previous
funding decisions and growth.
Other:
Line 17: As a placeholder, an amount was set aside for potential additional support for Stony
Point/Cedar Ridge High Schools. This is still being discussed as part of the Above Form A
Request process.
Line 18: As a placeholder, the calculation for potential additional funding for fine arts programs
at the campus level has been added.
Health Plan, Fine Arts Funding, Fine Arts Instruments:
This information is being brought forward based on previous Board requests.

Round Rock Independent School District2012-2013 Proposed Budget
Budget Development Worksheet
As of: May 8, 2012 April 12, 2012
REVENUE ESTIMATES:1 Current Tax Collections 64.82% 211,265,691 2,436,906 208,828,785
Taxable Values $20,834,578,385
Yield / Penny $2,031,401 Tax Rate / $100 1.040000
Estimated Collection % 98.9%
2 Delinquent tax collections 0.77% 2,500,000 2,500,000
3 Other Local Revenue 1.05% 3,425,000 3,425,000
4 State Revenue 27.64% 90,084,120 (2,283,626) 92,367,746
5 School Health And Related Services (SHARS) 0.48% 1,550,000 1,550,000
6 Federal Revenue 0.08% 270,000 270,000
7 Community School/Employee Program Revenue 0.25% 818,995 818,995
8 Teacher Retirement Revenue - On-Behalf 4.91% 16,000,000 16,000,000
9 Total Estimated Revenue 325,913,806 153,280 325,760,526
EXPENDITURE ESTIMATES:
Salaries & Benefits:
10 Salaries & Benefits 80.15% 270,186,769 (2,500,000) 272,686,769
Salary Increases/Adjustments 1.99% 6,697,855 6,697,855 0
11 Teacher Retirement System - On-Behalf Payment 4.75% 16,000,000 16,000,000
12 Total Salaries & Benefits 86.89% 292,884,624 4,197,855 288,686,769
Allocations:13 Allocations - Campuses & Departments (FORM A & for Elementaries - FORM N) 12.58% 42,400,270 37,018 42,363,252
14 Library Allocation 0.11% 360,064 360,064
15 Total Allocations 12.69% 42,760,334 37,018 42,723,316
Other Major Expenditures:16 Above Form A Requests 0.00% 0
17 Additional Support for Stony Point/Cedar Ridge 0.40% 1,349,369 1,349,369 0
18 Additional Fine Arts Funding (not including any instrument replacement) 0.03% 93,948 93,948 0
19 Total Other Major Expenditures 0.43% 1,443,317 0 0
20 Total Estimated Expenditures 337,088,275 4,234,873 331,410,085
21 Surplus/(Deficit) -3.31% (11,174,469) (4,081,593) (5,649,559)
Note> This does not take into consideration the use of fund balance.

Round Rock ISD
2012-2013 Basic Allocations-Campuses and Departments
Form A Basic Budget Budget Budget Allocation
Dept. Division & Form N Addition Reduction Adjust. Total %
All Schools 4,378,403 0 4,378,403 1.32%
Summer School 689,086 689,086 0.21%
701 Superintendent 40,255 40,255 0.01%
702 Board of Trustees 119,780 119,780 0.04%
703 Tax Office 2,227,654 2,227,654 0.67%
709 Textbooks/Delivery Systems 34,742 20,418 55,160 0.02%
726 Deputy Supt. - Business Admin. 43,553 43,553 0.01%
727 Payroll & Benefits 138,605 138,605 0.04%
728 Financial Services 305,773 305,773 0.09%
729 Purchasing 45,375 45,375 0.01%
729 Maint./Operations Repair & Replacement 200,000 200,000 0.06%
729 Furniture Repair & Replacement 100,000 100,000 0.03%
730 Internal Audit 55,178 55,178 0.02%
731 Safety & Risk Management 2,692,467 2,692,467 0.81%
734 Central Administration 85,397 85,397 0.03%
735 Legal Services 300,288 300,288 0.09%
735 JJAEP 500,000 500,000 0.15%
741 Information Services 1,963,990 1,963,990 0.59%
742 Human Resources 249,578 249,578 0.08%
745 Community Relations 96,830 96,830 0.03%
802 Community Schools 310,400 310,400 0.09%
803 Partnerships 24,881 24,881 0.01%
804 Performing Arts Center 157,891 157,891 0.05%
902 Fine Arts 129,062 129,062 0.04%
903 Video Services 72,637 72,637 0.02%
904 Beyond District Student Travel 185,000 185,000 0.06%
905 Asst. Supt. of Inst. Support 436,827 436,827 0.13%
906 Deputy Supt. - Instruction & Admin. 98,373 98,373 0.03%
907 Professional Development 97,000 97,000 0.03%
908 Assessment/Testing/Educ. Research 217,627 217,627 0.07%
909 Gifted and Advanced Academics 91,745 91,745 0.03%
912 Academies 40,864 40,864 0.01%
915 Student Support/CCR 1,207,941 1,207,941 0.36%
915 Academic Replacement Schedule 364,172 364,172 0.11%
916 Special Education/504/Dyslexia 574,730 5,400 580,130 0.18%
917 Student Diversity & Learning Prog. 463,925 463,925 0.14%
925 Health Services 28,055 28,055 0.01%
927 Athletics 1,468,809 1,468,809 0.44%
928 Curriculum 113,115 113,115 0.03%
933 School Imprv. & Acad. Interventions 349,489 349,489 0.11%
935 PE/Health 80,135 11,200 91,335 0.03%
938 Asst. Supt. Secondary Education 631,295 631,295 0.19%
939 Asst. Supt. Elementary Education 204,292 204,292 0.06%
940 Guidance & Counseling 36,860 36,860 0.01%
951 Operations & Facilities 17,289 17,289 0.01%
952 Transportation 2,005,522 2,005,522 0.61%
953 Maintenance 4,368,144 4,368,144 1.32%
954 Custodial Services 1,343,730 1,343,730 0.41%
955 Energy Management 135,796 135,796 0.04%
955 Electricity, Gas, Water & Wastewater 9,048,782 9,048,782 2.73%
956 Construction 224,612 224,612 0.07%
956 Portables 1,572,084 1,572,084 0.47%
957 Grant Development Initiatives 4,850 4,850 0.00%
960 Print Services 600,113 600,113 0.18%
960 Copiers 614,097 614,097 0.19%
961 Distribution Center 611,886 611,886 0.18%
970 Library/Media Services 164,268 164,268 0.05%
Departments 37,984,849 37,018 0 0 38,021,867 11.47%
Total Allocations 42,363,252 37,018 0 0 42,400,270 12.79%
Line 13

Round Rock ISD
2012-2013 Campus Allocations
Enrollment Form A Form A Form A Form N Campus
Campus Name Projections Basic Trips Total Totals
001 Round Rock HS 2,812 275,576 59,052 334,628 334,628
002 Round Rock Opp. 108 55,000 2,000 57,000 57,000
003 Westwood HS 2,593 254,114 54,453 308,567 308,567
004 McNeil HS 2,450 240,100 51,450 291,550 291,550
005 Goals 0 0 0 0 0
007 Stony Point HS 2,380 233,240 49,980 283,220 283,220
008 Cedar Ridge 2,979 291,942 62,559 354,501 354,501
011 Success 200 116,000 2,000 118,000 118,000
Sub-Total 13,522 1,465,972 281,494 1,747,466 0 1,747,466
041 C. D. Fulkes MS 741 56,316 5,187 61,503 61,503
042 Grisham MS 671 50,996 4,697 55,693 55,693
043 Chisholm Trail MS 1,073 81,548 7,511 89,059 89,059
044 Canyon Vista MS 1,259 95,684 8,813 104,497 104,497
045 Deerpark MS 990 75,240 6,930 82,170 82,170
046 Hopewell MS 854 64,904 5,978 70,882 70,882
047 Cedar Valley MS 1,241 94,316 8,687 103,003 103,003
051 Ridgeview MS 1,395 106,020 6,552 112,572 112,572
052 Walsh MS 1,227 93,252 8,589 101,841 101,841
053 Hernandez MS 936 71,136 6,552 77,688 77,688
Sub-Total 10,387 789,412 69,496 858,908 0 858,908
101 Berkman 545 34,880 3,815 38,695 5,000 43,695
105 Spicewood 696 44,544 4,872 49,416 5,000 54,416
106 Voigt 721 46,144 5,047 51,191 5,000 56,191
107** Deep Wood 425 30,000 2,975 32,975 5,000 37,975
108** Forest North 392 30,000 2,744 32,744 5,000 37,744
109 Anderson Mill 545 34,880 3,843 38,723 5,000 43,723
110 Caraway 701 44,864 4,907 49,771 5,000 54,771
111 Robertson 549 35,136 3,843 38,979 5,000 43,979
113** Purple Sage 290 30,000 2,030 32,030 5,000 37,030
114 Brushy Creek 801 51,264 5,607 56,871 5,000 61,871
115 Wells Branch 899 57,536 6,293 63,829 5,000 68,829
116 Laurel Mountain 727 46,528 5,089 51,617 5,000 56,617
117 Pond Springs 661 42,304 4,627 46,931 5,000 51,931
118 Bluebonnet 703 44,992 4,921 49,913 5,000 54,913
119 Double File Trail 663 42,432 4,641 47,073 5,000 52,073
120 Live Oak 542 34,688 5,838 40,526 5,000 45,526
121 Gattis 764 48,896 5,348 54,244 5,000 59,244
122 Old Town 834 53,376 5,838 59,214 5,000 64,214
123 Fern Bluff 804 51,456 5,628 57,084 5,000 62,084
124 Jollyville 576 36,864 4,032 40,896 5,000 45,896
125** Canyon Creek 464 30,000 3,248 33,248 5,000 38,248
126 Forest Creek 850 54,400 5,950 60,350 5,000 65,350
127 Caldwell Heights 647 41,408 4,529 45,937 5,000 50,937
128 Great Oaks 813 52,032 5,691 57,723 5,000 62,723
130 Blackland Prairie 883 56,512 6,181 62,693 5,000 67,693
131 Teravista 841 53,824 5,887 59,711 5,000 64,711
132 Cactus Ranch 942 60,288 6,594 66,882 5,000 71,882
134 Sommer 650 41,600 4,550 46,150 5,000 51,150
136 Callison 849 54,336 5,943 60,279 5,000 65,279
137 Union Hill 827 52,928 5,789 58,717 5,000 63,717
135 Chandler Oaks 618 39,552 4,326 43,878 5,000 48,878
138 Herrington 639 40,896 4,473 45,369 5,000 50,369
139 England 470 30,080 3,290 33,370 5,000 38,370
Sub-Total 22,331 1,448,640 158,389 1,607,029 165,000 1,772,029
Campuses Total 46,240 3,704,024 509,379 4,213,403 165,000 4,378,403

Round Rock ISD
2012-2013 Library Allocations
SCHOOL
ENROLLMENT
PROJECTIONS REFERENCE BASIC
$5 PER
STUDENT
OTHER
FUNDS
LIBRARY
TOTAL
001 ROUND ROCK 2,812 1,200 3,500 14,060 18,760
002 RROC 108 1,200 3,500 540 5,240
003 WESTWOOD 2,593 1,200 3,500 12,965 17,665
004 MCNEIL 2,450 1,200 3,500 12,250 16,950
005 GOALS 0 0 0
007 STONY POINT 2,380 1,200 3,500 11,900 16,600
008 CEDAR RIDGE 2,979 1,200 3,500 14,895 19,595
011 SUCCESS 200 0 0 0 0
Subtotal High School 13,522 7,200 21,000 66,610 0 94,810
041 C.D. FULKES 741 900 1,500 3,705 6,105
042 GRISHAM 671 900 1,500 3,355 5,755
043 CHISHOLM TRAIL 1,073 900 1,500 5,365 7,765
044 CANYON VISTA 1,259 900 1,500 6,295 8,695
045 DEERPARK 990 900 1,500 4,950 7,350
046 HOPEWELL 854 900 1,500 4,270 6,670
047 CEDAR VALLEY 1,241 900 1,500 6,205 8,605
051 RIDGEVIEW 1,395 900 1,500 6,975 9,375
052 WALSH 1,227 900 1,500 6,135 8,535
053 HERNANDEZ 936 900 1,500 4,680 7,080
Subtotal Middle School 10,387 9,000 15,000 51,935 0 75,935
101 BERKMAN 545 700 800 2,725 4,225
105 SPICEWOOD 696 700 800 3,480 4,980
106 VOIGT 721 700 800 3,605 5,105
107 DEEPWOOD 425 700 800 2,125 3,625
108 FOREST NORTH 392 700 800 1,960 3,460
109 ANDERSON MILL 545 700 800 2,725 4,225
110 CARAWAY 701 700 800 3,505 5,005
111 ROBERTSON 549 700 800 2,745 4,245
113 PURPLE SAGE 290 700 800 1,450 2,950
114 BRUSHY CREEK 801 700 800 4,005 5,505
115 WELLS BRANCH 899 700 800 4,495 5,995
116 LAUREL MOUNTAIN 727 700 800 3,635 5,135
117 POND SPRINGS 661 700 800 3,305 4,805
118 BLUEBONNET 703 700 800 3,515 5,015
119 DOUBLE FILE TR. 663 700 800 3,315 4,815
120 LIVE OAK 542 700 800 2,710 4,210
121 GATTIS 764 700 800 3,820 5,320
122 OLD TOWN 834 700 800 4,170 5,670
123 FERN BLUFF 804 700 800 4,020 5,520
124 JOLLYVILLE 576 700 800 2,880 4,380
125 CANYON CREEK 464 700 800 2,320 3,820
126 FOREST CREEK 850 700 800 4,250 5,750
127 CALDWELL HEIGHTS 647 700 800 3,235 4,735
128 GREAT OAKS 813 700 800 4,065 5,565
130 BLACKLAND PRAIRIE 883 700 800 4,415 5,915
131 TERAVISTA 841 700 800 4,205 5,705
132 CACTUS RANCH 942 700 800 4,710 6,210
134 SOMMER 650 700 800 3,250 4,750
136 CALLISON 849 700 800 4,245 5,745
137 UNION HILL 827 700 800 4,135 5,635
135 CHANDLER OAKS 618 700 800 3,090 4,590
138 HERRINGTON 639 700 800 3,195 4,695
139 ENGLAND 470 2,350 2,350
Subtotal Elementary 22,331 22,400 25,600 111,655 0 159,655
PROF. LIBRARY -
CONTINGENCY 29,665 29,665
TOTALS 46,240 38,600 61,600 230,200 29,665 360,064
Line 14


2012 Certified Totals (School Year 2012/13)
Category
Williamson County
Assessed Value
Travis County
Assessed Value
Total All
Assessed Values
Single Family Residence 9,556,763,184 3,194,406,329 12,751,169,513
Multi Family Residence 1,733,417,118 563,387,030 2,296,804,148
Vacant Lots/Tracts 385,104,280 40,021,333 425,125,613
Land Real 109,801,165 13,369,990 123,171,155
Farm or Ranch Improvements 10,474,471 1,100,822 11,575,293
Real Commercial and Industrial 3,699,086,751 1,039,990,669 4,739,077,420
Real and Intangible Utilities (inc CO-OP) 161,849,024 19,929,143 181,778,167
Tangible Personal, Business 910,559,816 727,409,401 1,637,969,217
Tangible Other Personal, Mobile Home 3,323,281 230,770 3,554,051
Residential Inventory 106,624,741 0 106,624,741
Special Inventory Tax 55,093,578 2,027,068 57,120,646
Other 0 0 0
Total Appraised value before Exemptions 16,732,097,409 5,601,872,555 22,333,969,964
Disabled persons (Local and State) (7,616,036) (986,560) (8,602,596)
Residential Homestead Exemption (State mandated) (561,679,732) (152,308,732) (713,988,464)
Residential Homestead Over 65 (State mandated) (55,579,551) (18,658,851) (74,238,402)
Disabled Veteran Exemption (36,569,224) (6,082,674) (42,651,898)
Pollution Exemption (983,757) (1,633,391) (2,617,148)
Prorated Exempt Property 0 (190,405) (190,405)
House Bill/Solar Wind (75,465) 0 (75,465)
House Bill 366 (Personal Property Under $500) (42,050) (12,017) (54,067)
Free Port 0 0 0
Other- Comm. Housing Development (2,332,241) 0 (2,332,241)
Total Exemptions/Reductions (664,878,056) (179,872,630) (844,750,686)
Taxable Value Before Freezes 16,067,219,353 5,421,999,925 21,489,219,278
CAD % for ARB and Adjudgements Before freezes 15,625,370,820 5,247,923,599 20,856,960,928
Current Taxable Values - April 26, 2012 20,374,975,431
Taxable Value Increase - 2012-13 481,985,497
% Increase in 2012-13 2.37%
Less Exemptions/Reductions at 100% Market Value:

School Year % 2010-11 % 2011-12 % 2012-13
Category
Estimated or Forecasted CAD Value -3.97% 20,096,272,541 1.39% 20,374,975,431 2.26% 20,834,578,385
Frozen Property Value 6.61% 1,191,061,277 5.55% 1,257,198,272 6.40% 1,337,686,878
Frozen Tax Levy 13.90% 12,040,851 9.17% 13,145,372 9.50% 14,394,182
TIF payments 0.00% - 0.00% - 0.00% -
Optional Homestead Value lost 0.00% - 0.00% - 0.00% -
Net Taxable Value -4.56% 18,905,211,264 1.12% 19,117,777,159 1.98% 19,496,891,507
CPTD Property Value Preceding Year 0.65% 20,673,094,881 -3.89% 19,869,616,193 1.50% 20,168,036,848
Percentage change from prior year CAD value -1.21% -1.13% -1.02%
M&O Tax rate 0.00% 1.040000 0.00% 1.040000 0.00% 1.040000
I&S Tax Rate 0.00% 0.340000 -13.24% 0.295000 15.25% 0.340000
Total Tax Rate 0.00% 1.380000 -3.26% 1.335000 3.37% 1.380000
Current Year Collections % 0.35% 99.28% -0.33% 98.95% -0.05% 98.90%
Current Year M&O Collections -3.51% 204,354,637 1.23% 206,870,284 2.12% 211,265,691
Delinquent M&O Collections -3.18% 1,680,494 -9.25% 1,525,000 -4.92% 1,450,000
Total Current and Delinquent M&O Collections -3.51% 206,035,131 1.15% 208,395,284 2.07% 212,715,691
M&O Other-Penalties/Interest/Certificates -15.22% 1,243,981 -15.59% 1,050,000 0.00% 1,050,000
Total M&O Collections -3.59% 207,279,112 1.05% 209,445,284 2.06% 213,765,691
Current Year I&S Collections -3.51% 66,808,252 -12.17% 58,679,552 17.70% 69,067,630
Delinquent I &S Collections 0.29% 539,851 -10.72% 482,000 -6.64% 450,000
Total Current and Delinquent I&S Collections -3.48% 67,348,104 -12.16% 59,161,552 17.50% 69,517,630
I&S Other-Penalties/Interest/Certificates -15.19% 304,509 -21.18% 240,000 0.00% 240,000
Total I&S Collections -3.54% 67,652,613 -12.20% 59,401,552 17.43% 69,757,630
Total Tax Collection -3.58% 274,931,725 -2.21% 268,846,836 5.46% 283,523,321
Comparison Of Current And Prior Tax Information
2010 CPTD for 2011-122009 CPTD for 2010-11
Estimated Cert value w
Forecast 4/26/2012 Budget 4/26/2012
2011 CPTD for 2012-13

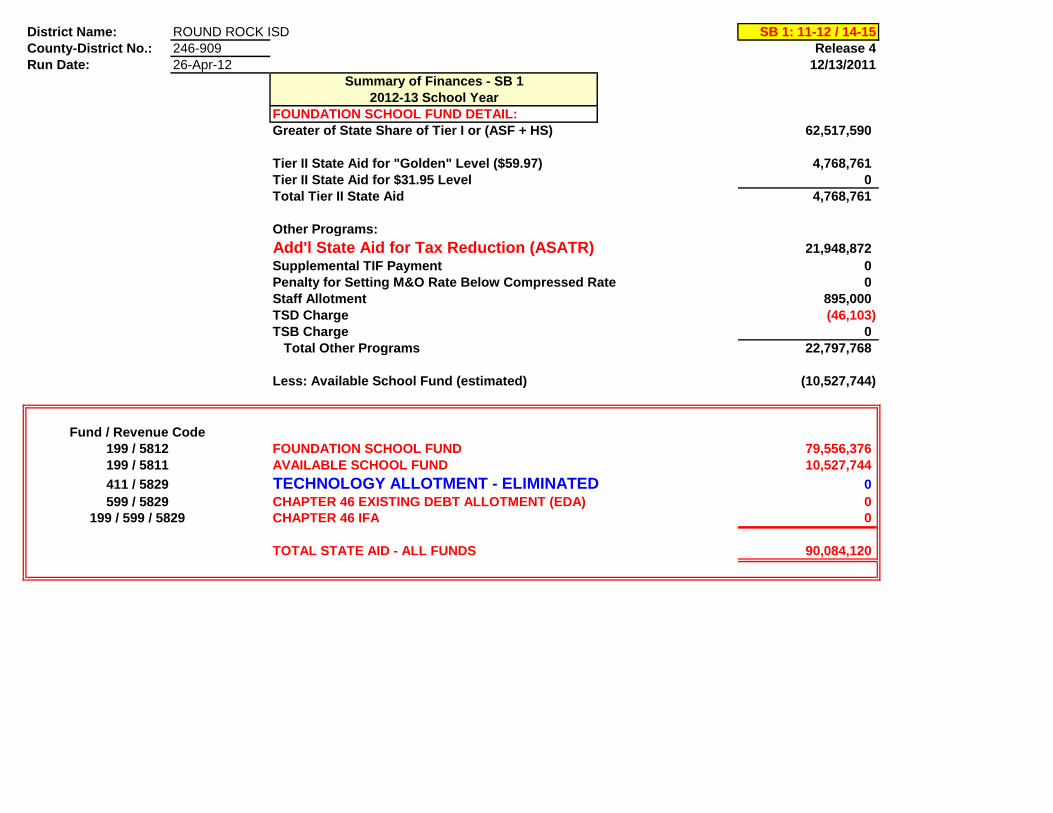
District Name: ROUND ROCK ISD SB 1: 11-12 / 14-15
County-District No.: 246-909 Release 4
Run Date: 26-Apr-12 12/13/2011
Summary of Finances - SB 1
2012-13 School Year
Basic Information:
Total Refined ADA (adj. for decline, if applicable) 43,827.6780
Special Education FTE 1,047.5230
Career & Technology FTE 1,694.1680
Regular Program ADA 41,085.9870
CPTD Property Value 20,168,036,848
Adjusted CPTD Property Value 20,168,036,848
Unadjusted Cost of Education Index 1.1200
Adjusted Cost of Education Index 1.1200
Total M&O Tax Collections 212,715,691
Status in 2011-12 ASATR DIST
Program Intent Code
11 REGULAR PROGRAM ALLOTMENT @ 98% or 95.195% 207,763,61923 Regular Special Education Block Grant 16,607,974
Other Special Education Allotments:
23 Mainstream Special Education Allotment 4,779,640
23 Residential Care & Treatment Allotment 202,499
23 State Schools Allotment 0
23 Non-public Contracts Allotment 0
Less: Charge for Dist. Share of ECI Project (252,466)
22 Career & Technology Block Grant 11,801,574
Advanced Career & Technology Allotment 0
21 Gifted & Talented Block Grant 1,356,905
Less: Charge for Dist. Share of AP Tests (10,054)
24/30 Compensatory Education Block Grant 14,341,178
24/30 Compensatory Ed Pregnant Allotment 90,531
25 Bilingual Education Block Grant 1,680,181
31 High School Allotment 3,472,850
Public Education Grant Allotment 0
New Instructl Facilities Allot (NIFA) - Eliminated 0
99 Transportation 1,939,999
Total Cost of Tier I 263,774,430
LESS: Local Fund Assignment 201,256,840
State Share of Tier I 62,517,590
District Name: ROUND ROCK ISD SB 1: 11-12 / 14-15
County-District No.: 246-909 Release 4
Run Date: 26-Apr-12 12/13/2011
Summary of Finances - SB 1
2012-13 School Year
FOUNDATION SCHOOL FUND DETAIL:
Greater of State Share of Tier I or (ASF + HS) 62,517,590
Tier II State Aid for "Golden" Level ($59.97) 4,768,761
Tier II State Aid for $31.95 Level 0
Total Tier II State Aid 4,768,761
Other Programs:
Add'l State Aid for Tax Reduction (ASATR) 21,948,872
Supplemental TIF Payment 0
Penalty for Setting M&O Rate Below Compressed Rate 0
Staff Allotment 895,000
TSD Charge (46,103)
TSB Charge 0
Total Other Programs 22,797,768
Less: Available School Fund (estimated) (10,527,744)
Fund / Revenue Code
199 / 5812 FOUNDATION SCHOOL FUND 79,556,376
199 / 5811 AVAILABLE SCHOOL FUND 10,527,744
411 / 5829 TECHNOLOGY ALLOTMENT - ELIMINATED 0
599 / 5829 CHAPTER 46 EXISTING DEBT ALLOTMENT (EDA) 0
199 / 599 / 5829 CHAPTER 46 IFA 0
TOTAL STATE AID - ALL FUNDS 90,084,120

District Name: ROUND ROCK ISD SB 1: 11-12 / 14-15
County-District No.: 246-909 Release 4
Run Date: 26-Apr-12 12/13/2011
Summary of Finances - SB 1
2012-13 School Year
SUMMARY OF TOTAL STATE/LOCAL M&O REVENUE:
M&O Revenue From State (not including Fund 599) (includes TIF & tuition reimbursement, if applicable) 90,084,120
M&O Revenue From Local Taxes (net of recapture and up to compressed rate) 204,104,796
M&O Revenue From Local Taxes (for first $.06 above compressed rate; no recapture) 8,610,895
M&O Revenue From Local Taxes (net of recapture for pennies beyond compressed rate + $.06) 0
2012-13 TOTAL STATE/LOCAL M&O REVENUE 302,799,811
Less: Credit Balance Due State (See FSF balance above) 0
2012-13 NET TOTAL STATE/LOCAL M&O REVENUE 302,799,811

SALARIES

TASB Poll
Question 1 - (248 districts responded)

TASB Poll
Question 2 - (489 districts responded)
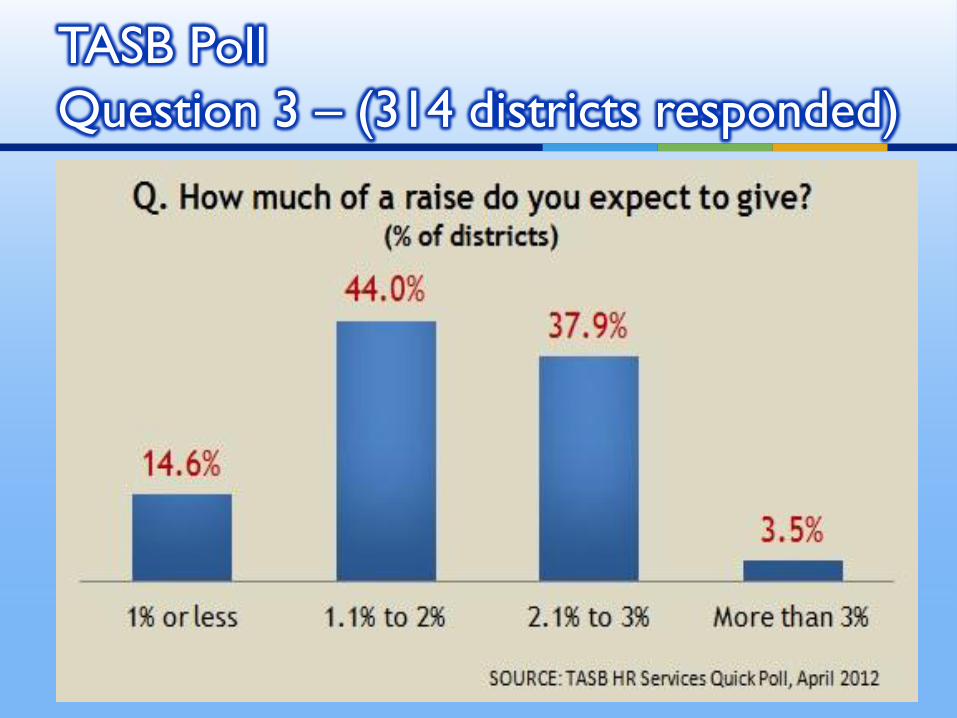
TASB Poll
Question 3 – (314 districts responded)

District % Increase Proposals
Austin One-time payment up to 3%
Conroe 3%
Del Valle 3% of midpoint/ $1,400 for teachers *
Eanes 2.5% of midpoint/ $1,200 for teachers *
Georgetown 0%
Hays 1% across the board
Klein 3%
Leander 2% of midpoint
Lockhart 3%
Pflugerville 1% plus 1.5% retention bonus *
* Board already approved salary increases for
2012-13.
Other Districts – 2012-13 Salaries

2012-2013 Salary Increase
Teacher, Librarian, RN,
Instructional Coach, etc.
Estimated FTE Estimated Cost Avg. %
Increase
Adjust starting salary to $42,300
Give $1,500 general pay increase
to full-time employees
3,188 $4,780,650 3.15%
Counselor, SLP, LSSP, PT, OT,
etc.
Estimated FTE Estimated Cost Avg. %
Increase
Adjust starting salary to $47,300
Give $1,500 general pay increase
to full-time employees
211 $315,900 2.79%

Pay Grades 101-112 Estimated FTE Estimated Cost Avg. %
Increase
Give general pay increase of
3.0% of range midpoint
325 $673,299.87 3.04%
2012-2013 Salary Increase
Pay Grades 201-211 Estimated FTE Estimated Cost Avg. %
Increase
Give general pay increase of
3.0% of range midpoint
833 $604,141.31 3.33%
Pay Grades 301-313 Estimated FTE Estimated Cost Avg. %
Increase
Give general pay increase of
3.0% of range midpoint
934 $639,161.24 3.17%

Employee Group 3.0% Cost
Teachers, Librarians, RNs $4,780,650.00
Counselors & Licensed
Professionals
$315,900.00
Pay Grades 101-112 $673,299.87
Pay Grades 201-211 $604,141.31
Pay Grades 301-313 $639,161.24
TOTAL $7,013,152,42
2012-2013
Total Estimated Cost of Salary Increases
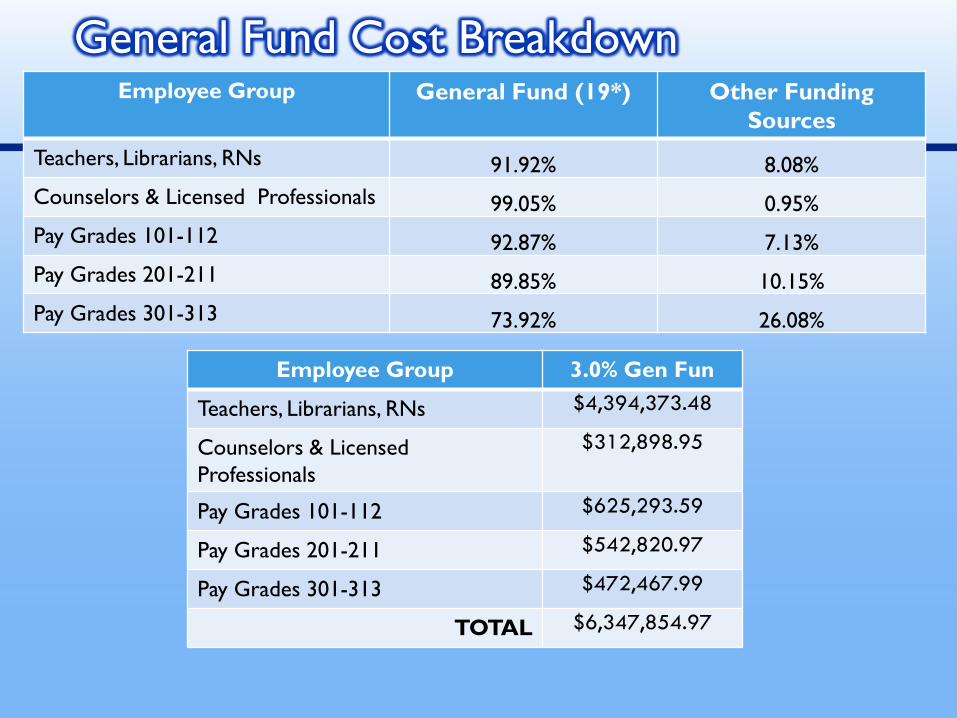
Employee Group General Fund (19*) Other Funding
Sources
Teachers, Librarians, RNs 91.92% 8.08%
Counselors & Licensed Professionals 99.05% 0.95%
Pay Grades 101-112 92.87% 7.13%
Pay Grades 201-211 89.85% 10.15%
Pay Grades 301-313 73.92% 26.08%
General Fund Cost Breakdown
Employee Group 3.0% Gen Fun
Teachers, Librarians, RNs $4,394,373.48
Counselors & Licensed
Professionals
$312,898.95
Pay Grades 101-112 $625,293.59
Pay Grades 201-211 $542,820.97
Pay Grades 301-313 $472,467.99
TOTAL $6,347,854.97

Provides equity by aligning salaries for employees
who are in similar positions with similar
experience
Enables the District to calculate new hire salaries
consistently based on position and experience
Enables the District to recruit and retain valuable
employees
TASB recommends reviewing equity every 4-5
years
Purpose of Equity Study

Previous equity study conducted in 2008
Reviewed and aligned employees to a rate relative to their years of experience
Most employees received only a portion of the adjustment based on available funding
Equity study conducted in Spring 2012
Reviewed 873 employees in pay grades 101-112, 206-211, and 306-313
323 employees, or 37%, were less than 5% below target rate for their experience (23 were off target in 2008)
63 employees, or 7%, were more than 5% below target for their experience (13 were off target in 2008)
2012 Equity Study Findings

452 (52%) At or Above Target
323 (37%) Less Than 5% Below
Target
63 (7%) 5% - 20%
Below Target
35 (4%) Resigned
At or Above Target
Less Than 5% Below Target
5% - 20% Below Target
Resigned employees
Equity Study Employee Distribution

Employee Job Title Years Exp Annual Salary
Employee A Elementary Principal 18 $80,115
Target Rate Elementary Principal 18 $79,447
Employee B Elementary Principal 18 $76,084
New Hire Elementary Principal 18 $76,084
New Hire Salary Scenario

Total cost to bring 100% employees on target
$620,000
Proposing $300,000 to adjust employees who
are more than 5% below target
25 employees in pay grades 101-112
19 employees in pay grades 206-211
19 employees in pay grades 306-313
Recommendations

A position may be reviewed as a result of a
sustained increase in job responsibilities
In 2011-12, $100,000 was budgeted for this
purpose
For 2012-13, $50,000 is proposed
Position Reclassifications

Cost
Salary Increases from General Fund $6,347,854.97
Equity Adjustments/Reclassifications $350,000
TOTAL $6,697,854.97
Overall Cost

HEALTH PLAN UPDATE

100% of Standard Plan Premium paid by
District on behalf of employee
Monthly District contribution - $344.67
($25 reduction from prior year - $300 annually)
Annual Benefit to Employee - $4,136
Health Plan Contribution

Round Rock ISD
Health Plans - 2011-12
Effective October 1, 2011
Round Rock ISD Round Rock ISD Round Rock ISD
Health Plan Benefits Standard Intermediate Premium *
Deductible
Individual $1,000 $750 $300
Family $3,000 $2,250 $600
Co-Insurance 70% 80% 90%
Co-Insurance Maximum
Individual $2,500 $2,000 $1,500
Family $6,000 $6,000 $3,000
Preventive Care
Annual Routine Physical Exam &
Routine Child Care $0 $0 $0
Routine Mammogram $0 $0 $0
Colonoscopy $0 $0 $0
Routine Lab & X-ray $0 $0 $0
Office Visit
Primary & Specialist $30 & $50 copay $30 & $50 copay $20 & $40 copay
Urgent Care $75 copay $75 copay $75 copay
Hospital
Hospitalization$400 per adm., 70%
after deduct.
$400 per adm., 80%
after deduct.
$250 per adm., 90%
after deduct.
Inpatient Facility & Physician Services 70% after deductible 80% after deductible 90% after deductible
Outpatient Surgery 70% after deductible 80% after deductible 90% after deductible
Emergency - Facility $150, 70% after deduct. $150, 80% after deduct. $150, 90% after deduct.
Emergency - Physician 70% after deductible 80% after deductible 90% after deductible
Prescriptions
Retail (30 days)$5 / $40 / $70/ 10% or
$200
$5 / $40 / $70/ 10% or
$200
$5 / $30 / $50/ 10% or
$200
Premiums
District Contribution (Operating) $344.67 $344.67 $344.67
Self-Insurance Fund Balance At-Risk
Premium after District Contribution
Employee Only $0.00 $39.41 $100.49
Employee + Child(ren) $252.78 $296.14 $369.31
Employee + Spouse $386.67 $460.98 $572.41
Employee + Family $507.95 $603.47 $750.79
Note: Only In-Network benefits included for comparison.
* The benefits of this plan are the same as the benefits under the 2010-11 health plan.
$952,380
2011-2012

Breakout of Health Plan Options SelectedMonthly Payroll Only
Standard Intermediate Premium Totals
Employee Only 1,438 573 966 2,977
Employee + Child 116 124 300 540
Employee + Spouse 40 19 72 131
Employee + Family 100 81 150 331
Employee Married 16 31 47 94
TOTAL 1,710 828 1,535 4,073
% of TOTALS 41.98% 20.33% 37.69%
Breakout of Health Plan Options SelectedSemi-Monthly Payroll Only
Standard Intermediate Premium Totals
Employee Only 594 101 155 850
Employee + Child 14 5 12 31
Employee + Spouse 7 4 4 15
Employee + Family 9 3 2 14
Employee Married 3 1 1 5
TOTAL 627 114 174 915
% of TOTALS 68.52% 12.46% 19.02%
Breakout of Health Plan Options SelectedCOMBINED
Standard Intermediate Premium Totals
Employee Only 2,032 674 1,121 3,827
Employee + Child 130 129 312 571
Employee + Spouse 47 23 76 146
Employee + Family 109 84 152 345
Employee Married 19 32 48 99
TOTAL 2,337 942 1,709 4,988
% of TOTALS 46.85% 18.89% 34.26%

Comparison of Central Texas ISDs Health Plans
2011-12
Round Rock ISD Austin ISD Leander ISD Pflugerville ISD TRS Active Care
Health Plan Benefits Low (Standard) Low (PPO 2) Low (PPO 2500) Low (Coverage 1st) Low (1)
Deductible
Individual $1,000 $500 $2,500 $3,000 $1,200
Family $3,000 $1,500 $5,000 $6,000 $3,000
Co-Insurance 70% 80% 80% 70% 80%
Co-Insurance Maximum
Individual $2,500 $2,500 $2,000 $6,000 $2,000
Family $6,000 $7,500 $6,000 $12,000 $6,000
Preventive Care
Annual Routine Physical Exam &
Routine Child Care $0 $0 $0 $0 $0
Routine Mammogram $0 $0 $0 $0 $0
Colonoscopy $0 Info not available Info not available $0 $0
Routine Lab & X-ray $0 Info not available Info not available $0 Info not available
Office Visit
Primary & Specialist $30 & $50 copay $25 80% after deductible $30 80% after deductible
Urgent Care $75 $45 80% after deductible $40 Info not available
Hospital
Hospitalization$400 per adm., 70%
after deduct.
$500 per adm., 80%
after deduct.80% after deductible 70% after deductible 80% after deductible
Inpatient Facility & Physician Services 70% after deductible 80% after deductible 80% after deductible 70% after deductible 80% after deductible
Outpatient Surgery 70% after deductible 80% after deductible 80% after deductible 70% after deductible 80% after deductible
Emergency - Facility $150, 70% after deduct. $100 80% after deductible $150 80% after deductible
Emergency - Physician 70% after deductible 80% after deductible 80% after deductible 70% after deductible 80% after deductible
Prescriptions
Retail (30 days)$5/ $40/ $70/ 10% or
$200
$50 deductible;
$10/$25/$45; mail order
separate
80% after deductible;
mail order separate
$10/ $35/ $55/ 25%;
mail order separate
80% after deductible;
mail order separate
Premiums (Monthly)
District Contribution $344.67 $377.87 $310.00 $320.00 N/A
Premium after District Contribution
must subtract district
contribution from
premium
Employee Only $0.00 $0.00 $10.00 $0.00 $325.00
Employee + Child(ren) $252.78 $266.98 $210.00 $249.00 $519.00
Employee + Spouse $386.67 $455.91 $363.00 $299.00 $741.00
Employee + Family $507.95 $625.95 $553.00 $594.00 $817.00
Note: Only In-Network benefits included for comparison.
Round Rock ISD:
Three separate plans are offered.
Plan administrator - Blue Cross Blue Shield.
Austin ISD:
Three separate plans are offered.
Plan administrator - Blue Cross Blue Shield.
Leander ISD:
Four separate plans are offered.
Plan administrator - Aetna.
Pflugerville ISD:
Four separate plans are offered.
Plan administrator - Humana.
TRS Active Care:
Four separate plans are offered. Additional HMO plans offered.
Plan administrator - Blue Cross Blue Shield, others for HMOs.
Lowest Benefit Plan Offered
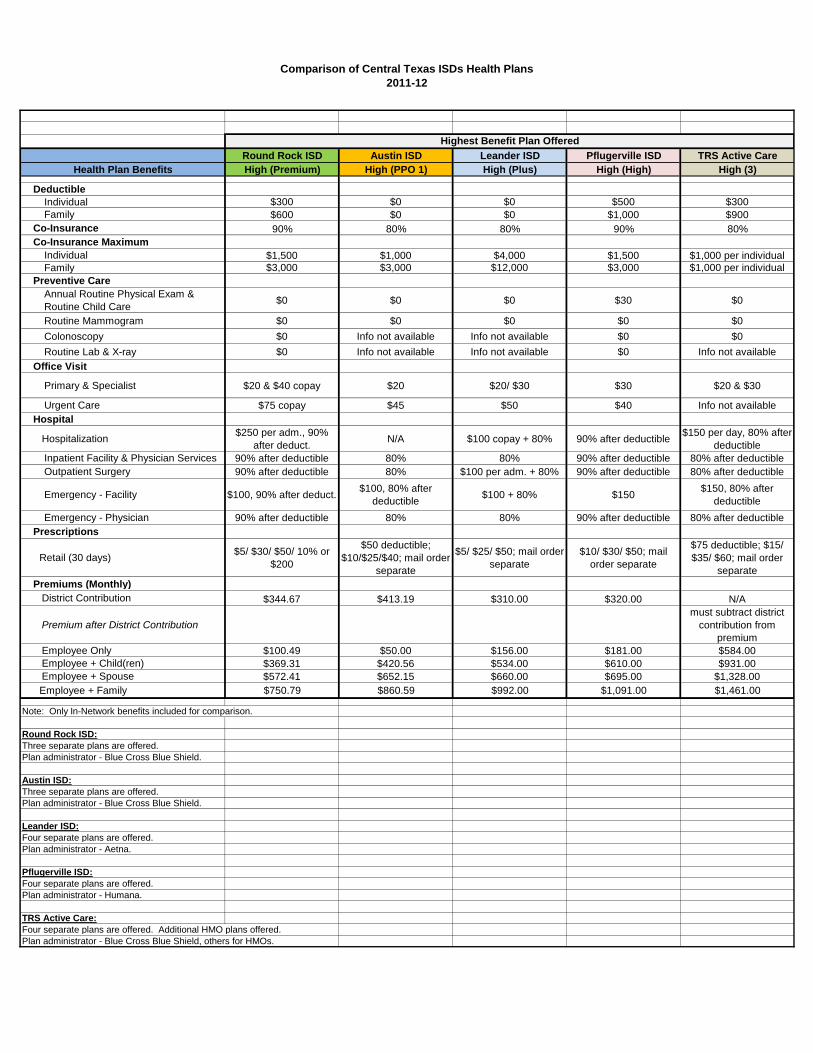
Comparison of Central Texas ISDs Health Plans
2011-12
Round Rock ISD Austin ISD Leander ISD Pflugerville ISD TRS Active Care
Health Plan Benefits High (Premium) High (PPO 1) High (Plus) High (High) High (3)
Deductible
Individual $300 $0 $0 $500 $300
Family $600 $0 $0 $1,000 $900
Co-Insurance 90% 80% 80% 90% 80%
Co-Insurance Maximum
Individual $1,500 $1,000 $4,000 $1,500 $1,000 per individual
Family $3,000 $3,000 $12,000 $3,000 $1,000 per individual
Preventive Care
Annual Routine Physical Exam &
Routine Child Care $0 $0 $0 $30 $0
Routine Mammogram $0 $0 $0 $0 $0
Colonoscopy $0 Info not available Info not available $0 $0
Routine Lab & X-ray $0 Info not available Info not available $0 Info not available
Office Visit
Primary & Specialist $20 & $40 copay $20 $20/ $30 $30 $20 & $30
Urgent Care $75 copay $45 $50 $40 Info not available
Hospital
Hospitalization$250 per adm., 90%
after deduct.N/A $100 copay + 80% 90% after deductible
$150 per day, 80% after
deductible
Inpatient Facility & Physician Services 90% after deductible 80% 80% 90% after deductible 80% after deductible
Outpatient Surgery 90% after deductible 80% $100 per adm. + 80% 90% after deductible 80% after deductible
Emergency - Facility $100, 90% after deduct.$100, 80% after
deductible$100 + 80% $150
$150, 80% after
deductible
Emergency - Physician 90% after deductible 80% 80% 90% after deductible 80% after deductible
Prescriptions
Retail (30 days)$5/ $30/ $50/ 10% or
$200
$50 deductible;
$10/$25/$40; mail order
separate
$5/ $25/ $50; mail order
separate
$10/ $30/ $50; mail
order separate
$75 deductible; $15/
$35/ $60; mail order
separate
Premiums (Monthly)
District Contribution $344.67 $413.19 $310.00 $320.00 N/A
Premium after District Contribution
must subtract district
contribution from
premium
Employee Only $100.49 $50.00 $156.00 $181.00 $584.00
Employee + Child(ren) $369.31 $420.56 $534.00 $610.00 $931.00
Employee + Spouse $572.41 $652.15 $660.00 $695.00 $1,328.00
Employee + Family $750.79 $860.59 $992.00 $1,091.00 $1,461.00
Note: Only In-Network benefits included for comparison.
Round Rock ISD:
Three separate plans are offered.
Plan administrator - Blue Cross Blue Shield.
Austin ISD:
Three separate plans are offered.
Plan administrator - Blue Cross Blue Shield.
Leander ISD:
Four separate plans are offered.
Plan administrator - Aetna.
Pflugerville ISD:
Four separate plans are offered.
Plan administrator - Humana.
TRS Active Care:
Four separate plans are offered. Additional HMO plans offered.
Plan administrator - Blue Cross Blue Shield, others for HMOs.
Highest Benefit Plan Offered

RRISD 2010-2011
Plan Year Performance
10/10 ~ 9/11
ENROLLES REVENUE ASL ISL ADMIN. FEE CLAIMS TOTAL FEES FEES/CLMS RESERVE
Oct-10 5,354 $2,466,946 $14,242 $101,833 $162,708 $2,110,205 $278,783 $2,388,988 $77,958
Nov-10 5,237 $2,418,691 $13,930 $99,608 $159,152 $2,228,244 $272,691 $2,500,935 ($82,244)
Dec-10 5,226 $2,422,888 $13,901 $99,399 $158,818 $2,494,443 $272,118 $2,766,561 ($343,673)
Jan-11 5,155 $2,390,760 $13,712 $98,048 $156,660 $3,116,965 $268,421 $3,385,386 ($994,626)
Feb-11 5,237 $2,425,730 $13,930 $99,608 $159,152 $1,864,946 $272,691 $2,137,637 $288,093
Mar-11 5,222 $2,422,311 $13,891 $99,322 $158,697 $2,297,992 $271,910 $2,569,902 ($147,591)
Apr-11 5,210 $2,413,375 $13,859 $99,094 $158,332 $1,924,913 $271,285 $2,196,198 $217,177
May-11 5,163 $2,385,775 $13,734 $98,200 $156,904 $2,078,098 $268,837 $2,346,935 $38,839
Jun-11 5,141 $2,378,113 $13,675 $97,782 $156,235 $2,322,907 $267,692 $2,590,599 ($212,485)
Jul-11 5,111 $2,372,868 $13,595 $97,211 $155,323 $3,170,559 $266,130 $3,436,689 ($1,063,820)
Aug-11 5,107 $2,371,011 $13,585 $97,135 $155,202 $3,374,719 $265,921 $3,640,640 ($1,269,629)
Sep-11 5,035 $2,337,599 $13,385 $95,709 $152,922 $2,576,379 $262,016 $2,838,395 ($500,796)
($592,739) Stop Loss Reimbursements
TOTAL 62,198 $28,806,067 $165,439 $1,182,949 $1,890,106 $28,374,891 $3,238,493 $31,613,384 ($2,807,317)
10-11 Plan Year 0.57% 4.11% 6.56% 98.50% 11.24% 109.75% -9.75%
TOTAL 59,985 $27,275,649 $124,769 $891,377 $2,152,474 $25,662,929 $2,731,117 $28,831,549 ($1,555,900)
09-10 Plan Year 0.46% 3.27% 7.89% 94.09% 10.01% 105.70% -5.70%
TOTAL 56,577 $25,521,109 $67,893 $1,340,309 $1,678,957 $21,644,478 $3,127,867 $24,772,345 $748,764
08-09 Plan Year 0.27% 5.25% 6.58% 84.81% 12.26% 97.07% 2.93%
TOTAL 52,789 $23,700,220 $63,347 $1,192,504 $1,500,958 $17,377,835 $2,794,798 $19,939,717 $3,760,503
07-08 Plan Year 0.27% 5.03% 6.33% 73.32% 11.79% 84.13% 15.87%
TOTAL 49,709 $22,239,328 $58,462 $1,043,447 $1,345,519 $15,105,687 $2,447,428 $17,553,115 $4,686,213
06-07 Plan Year 0.26% 4.69% 6.05% 67.92% 11.00% 78.93% 21.07%
TOTAL 47,451 $21,203,660 $51,721 $888,283 $1,281,495 $14,856,019 $2,221,499 $17,077,518 $4,126,143
05-06 Plan Year 0.24% 4.19% 6.04% 70.06% 10.48% 80.54% 19.46%
TOTAL 46,666 $19,278,305 $54,635 $911,325 $1,136,547 $14,462,582 $2,102,507 $16,565,089 $2,713,216
04-05 Plan Year 0.28% 4.73% 5.90% 75.02% 10.91% 85.93% 14.02%
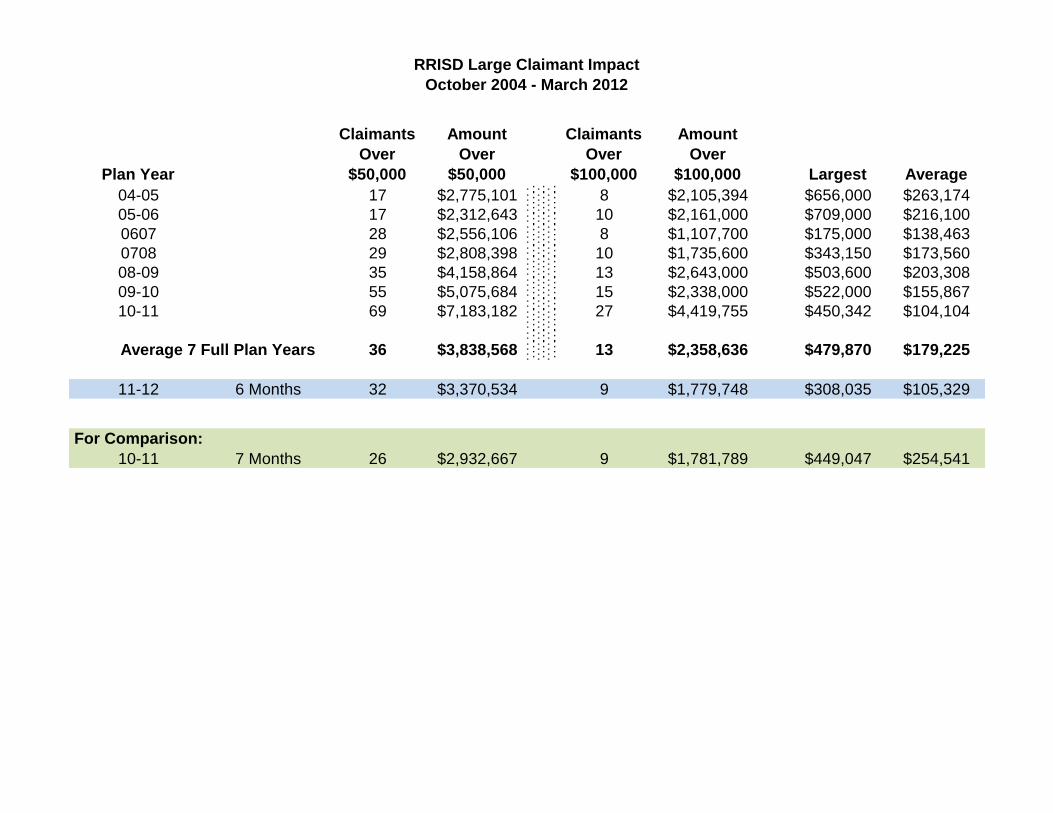
RRISD Large Claimant Impact
October 2004 - March 2012
Plan Year
Claimants
Over
$50,000
Amount
Over
$50,000
Claimants
Over
$100,000
Amount
Over
$100,000 Largest Average
04-05 17 $2,775,101 8 $2,105,394 $656,000 $263,174
05-06 17 $2,312,643 10 $2,161,000 $709,000 $216,100
0607 28 $2,556,106 8 $1,107,700 $175,000 $138,463
0708 29 $2,808,398 10 $1,735,600 $343,150 $173,560
08-09 35 $4,158,864 13 $2,643,000 $503,600 $203,308
09-10 55 $5,075,684 15 $2,338,000 $522,000 $155,867
10-11 69 $7,183,182 27 $4,419,755 $450,342 $104,104
Average 7 Full Plan Years 36 $3,838,568 13 $2,358,636 $479,870 $179,225
11-12 6 Months 32 $3,370,534 9 $1,779,748 $308,035 $105,329
For Comparison:
10-11 7 Months 26 $2,932,667 9 $1,781,789 $449,047 $254,541

Round Rock ISD
2011 - 2012
Plan Year Performance
Claims, Admin., and Stop Loss
Oct 2011 thru Mar 2012
StandardEE
Count
Covered
Lives
Avg.
EE Rate Revenue Expenses
Loss
Ratio
Revenue
PMPM
Paid
PMPM
Inc. Exp.
PMPM
EEON 12,065 12,065 2,011 $344.67 $4,158,444 $1,630,004 39.20% $344.67 $135.10
EESP 275 550 46 $731.34 $201,119 $93,574 46.53% $365.67 $170.13
EECH 768 2,136 128 $597.45 $458,842 $205,979 44.89% $214.81 $96.43
EEFM 774 3,224 129 $852.62 $659,928 $262,912 39.84% $204.69 $81.55
EEON COBRA 40 40 7 $351.56 $14,063 $21,551 153.25% $351.56 $538.78
EESP COBRA 0 0 0 $745.97 $0 $0
EECH COBRA 0 0 0 $609.40 $0 $0
EEFM COBRA 0 0 0 $869.67 $0 $0
18,015 2,320 $5,492,394 $2,960,239 53.90% $304.88 $164.32 $164.32
IntermediateEE
Count
Covered
Lives
Avg.
EE Rate Revenue Expenses
Loss
Ratio
Revenue
PMPM
Paid
PMPM
EEON 4082 4082 680 $384.08 $1,567,815 $712,461 45.44% $384.08 $174.54
EESP 135 270 23 $805.65 $108,763 $69,583 63.98% $402.83 $257.71
EECH 764 2146 127 $640.81 $489,579 $402,456 82.20% $228.14 $187.54
EEFM 711 2768 119 $948.14 $674,128 $455,753 67.61% $243.54 $164.65
EEON COBRA 2 2 0 $391.76 $784 $3,548 452.83% $391.76 $1,774.00
EESP COBRA 0 0 0 $821.76 $0 $0
EECH COBRA 0 0 0 $653.63 $0 $0
EEFM COBRA 1 6 0 $967.10 $967 $19
9,274 949 $2,842,034 $1,949,072 68.58% $306.45 $210.17 $210.21
PremiumEE
Count
Covered
Lives
Avg.
EE Rate Revenue Expenses
Loss
Ratio
Revenue
PMPM
Paid
PMPM
EEON 6,889 6,889 1,148 $445.16 $3,066,707 $5,083,283 165.76% $445.16 $737.88
EESP 471 942 79 $917.08 $431,945 $571,000 132.19% $458.54 $606.16
EECH 1,762 5,066 294 $713.98 $1,258,033 $2,108,067 167.57% $248.33 $416.12
EEFM 1,198 4,812 200 $1,095.46 $1,312,361 $2,169,659 165.32% $272.73 $450.89
EEON COBRA 200 200 33 $454.06 $90,813 $185,398 204.15% $454.06 $926.99
EESP COBRA 5 10 1 $935.42 $4,677 $7,862 168.10% $467.71 $786.20
EECH COBRA 14 38 2 $728.26 $10,196 $21,826 214.07% $268.31 $574.37
EEFM COBRA 31 138 5 $1,117.37 $34,638 $21,036 60.73% $251.00 $152.43
18,095 1,762 $6,209,370 $10,734,683 172.88% $343.15 $593.24 $400.18
Health
Plan
EE
Count
Covered
Lives
Avg.
EE Revenue Expenses
Loss
Ratio
Revenue
PMPM
Paid
PMPM
EEON 23,036 23,036 4,607 $8,792,965 $7,425,748 84.45% $381.71 $322.35
EESP 881 1,762 176 $741,826 $734,157 98.97% $421.01 $416.66
EECH 3,294 9,348 659 $2,206,453 $2,716,502 123.12% $236.03 $290.60
EEFM 2,683 10,804 537 $2,646,417 $2,888,324 109.14% $244.95 $267.34
EEON COBRA 242 242 48 $105,659 $210,497 199.22% $436.61 $869.82
EESP COBRA 5 10 1 $4,677 $7,862 168.10% $467.71 $786.20
EECH COBRA 14 38 3 $10,196 $21,826 214.07% $268.31 $574.37
EEFM COBRA 32 144 6 $35,606 $21,055 59.13% $247.26 $146.22
45,384 6,037 $14,543,798 $15,643,994 107.56% $320.46 $344.70 $218.39
Stop Loss Reimbursement 105.66%
Surplus/Loss
$276,360
($823,836)
Page 1 of 1 C-CBS

Fiscal Year Change in Net Assets
2002-03 ($830,761) loss before transfer
2003-04 ($725,973) loss before transfer
2004-05 $6,253,153
2005-06 $5,376,924
2006-07 $5,893,923
2007-08 $4,887,491
2008-09 $3,526,782
2009-10 ($2,168,449)
2010-11 ($702,235)
2011-12 - Projected ($5,000,000)
Self-Insured Fund Balance @ 6/30/11 $22,687,043
Financial Performance Summary
Self-Insured Health Fund

FINE ARTS FUNDING

Develop a plan to ensure programs associated
with district and campus priorities are funded
equitably
Board of Trustees – 2011-12
Goal #1

Band - 21
Orchestra - 22
Choir/Music - 23
Art – various
Theatre – various
Dance - various
Funded Separately: Mariachi, Ballet Folklorico
Fine Arts Programs & Subobject Code

Expenditure Funding Source Amount for Campus
(direct student use)
Amount for Dept.
(facility/admin)
Comments
Dept. Budget Dept. Budget -
Operating
$104,464 $24,598 Total of $129,823
Band Uniforms,
Tuxes & Dresses &
Instrument Repairs
Academic Repair
and Replacement
schedule (ARR)
$221,300 Uniform
replacement
schedule
PAC Dept. Budget Dept. Budget -
Operating
$157,891 used for facility
administration
Campus Budgets Campus Budget -
Operating
$294,740 may not include all
funds due to budget
arrangements of
campuses
2012-13
Current Fine Arts Funding – ALL Levels

Average budget for all programs – $47,125
High of $61,647; Low of $19,533
Does not include Cedar Ridge HS
High School Campus Budgets
Fiscal Years 10, 11 & 12

Average spend for all programs – $113,813
High of $141,561; Low of $80,246
Does not include Cedar Ridge HS
Includes campus budget, ARR, central fine arts transfers,
activity/booster contributions
High School Campus Expenditures
Fiscal Years 09, 10 & 11
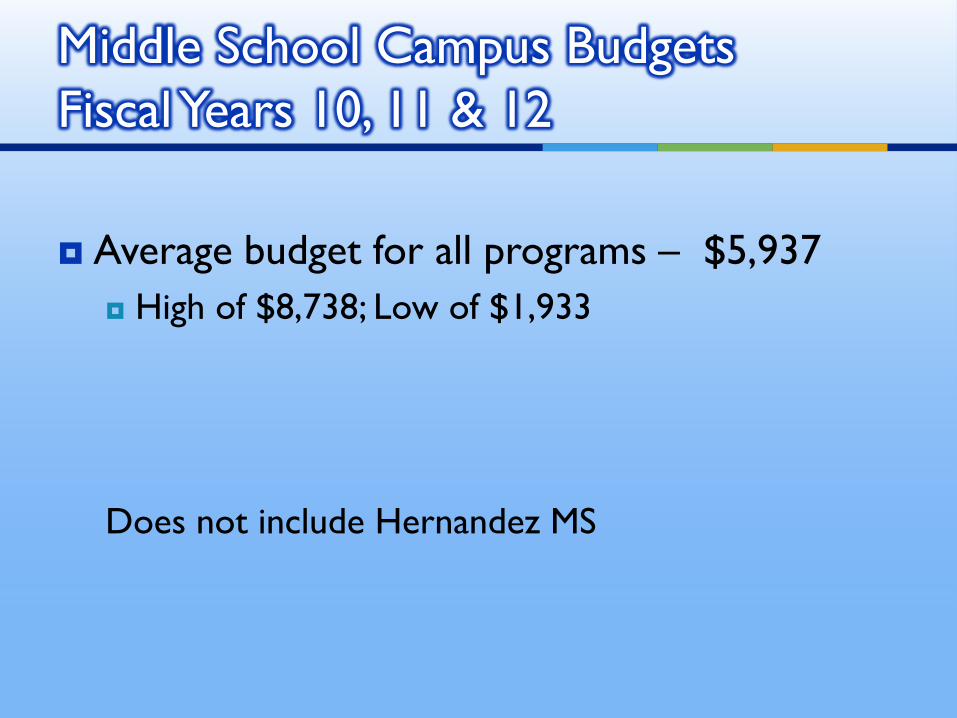
Average budget for all programs – $5,937
High of $8,738; Low of $1,933
Does not include Hernandez MS
Middle School Campus Budgets
Fiscal Years 10, 11 & 12

Average spend for all programs – $9,964
High of $20,466; Low of $4,910
Does not include Hernandez MS
Includes campus budget, ARR, central fine arts transfers,
activity fund contributions
Middle School Campus Expenditures
Fiscal Years 09, 10 & 11

Establish minimum thresholds for fine arts programs
High & Middle Schools
Reduction to current allocation based on average campus
fine arts budget
New per student allocation for fine arts
Principal continues to have control over allocation of funds
within fine arts programs; spending controlled by campus
Addition to school budget - $93,948:
High Schools – $58,400; Average per campus $11,680
Middle Schools – $35,548; Average per campus $3,555
Allocation Spreadsheet
New Funding Proposal

FINE ARTS INSTRUMENTS

Academic Replacement & Repair (ARR) Budget(Instrument Replacement, Repair, Uniform Replacement Schedule)
1) InstrumentTOTAL Budget Budget for Repair Budget for Uniforms/ Total ARR Fine Arts % of Usage Fee
FY for ARR Instrument Replacement Tuxes/Dresses Replacement Budget for Fine Arts ARR Budget Collections12-13 $364,172 $150,300 $71,000 $221,300 60.8% N/A11-12 $364,167 $170,336 $45,000 $215,336 59.1% $49,145 2)10-11 $401,055 $104,350 $96,686 $201,036 50.1% $49,12909-10 $397,511 $145,678 $79,520 $225,198 56.7% $50,41808-09 $397,575 $101,100 $110,000 $211,100 53.1% $41,48807-08 $450,000 $103,906 $85,000 $188,906 42.0% $40,945
1) Uniform, Tuxes and Dresses are on an 8 year replacement schedule.
2) Through April 30, 2012.
Note> Instrument Usage Fees are $50 annually ($25 per semester) and are waived for students receiving free/reduced lunch.Deposited into General Fund (Revenue Account R573901) to offset ARR Repair.

ITEMBEGINNER
LEVEL
INTERMEDIATE
LEVELUPPER LEVEL
HIGH SCHOOL
ONLY: IF
USED FOR
MARCHING
TO BE USED AS
BASIS FOR
REPLACEMENT
DATE
Violins 10-15 yrs 10-15 yrs 12-15 yrs n/a 15
Violas 10-15 yrs 10-15yrs 12-15 yrs n/a 15
Cellos 10-15 yrs 10-15 yrs 12-15 yrs n/a 15
String Basses 10-15 yrs 10-15 yrs 12-15 yrs n/a 15
Piccolos (Concert) n/a 12-14 yrs 12-14yrs n/a 14
Marching Piccolos n/a n/a n/a 8-10 yrs 10
Flutes 10-16 yrs 10-16 yrs n/a 10-12 yrs 16
Alto Flutes n/a 10-15 yrs n/a n/a 15
Oboes n/a 12-15 yrs 12-15 yrs n/a 15
English Horns n/a 12-18 yrs 12-15 yrs n/a 15
Bassoons n/a 12-18 yrs 12-15 yrs n/a 15
Contrabassoons n/a 14-16 yrs n/a n/a 16
E-flat Clarinets n/a n/a 12-15 yrs n/a 15
Clarinets 10-20 yrs 10-15 yrs 12-15 yrs 10-12 yrs 15
Bass Clarinets n/a 12-15 yrs 12-15 yrs 10-12 yrs 15
Bass Clarinets for Marching n/a 10-14 yrs n/a 10-14 yrs 14
Eb Contra Alto Clarinets n/a 12-15 yrs 12-15 yrs n/a 15
BBb Contrabass Clarinets n/a 12-15 yrs 12-15 yrs n/a 15
Soprano Saxophones n/a 10-15 yrs 12-15 yrs n/a 15
Alto Saxophones 10-20 yrs 12-16 yrs 12-16 yrs 10-12 yrs 16
Tenor Saxophones n/a 12-16 yrs 12-16 yrs 10-12 yrs 16
Tenor Sax for Marching n/a 10-12 yrs n/a 10-12 yrs 12
Baritone Saxophones n/a 12-16 yrs 12-16 yrs 10-12 yrs
Bari Saxes for marching n/a 10-12 yrs n/a 10-12 yrs 12
Trumpets 10-20 yrs 10-20 yrs 12-20 yrs 10-20 yrs 20
French Horns n/a 12-16 yrs 12-16 yrs n/a 16
Marching French Horns n/a 10-12 yrs n/a 10-12 yrs 12
Trombones 10-16 yrs 10-16 yrs 12-16 yrs 10-15 yrs 16
Bass Trombones n/a n/a 12-16 yrs 10-15 yrs 16
Euphoniums n/a 12-15 yrs 12-15 yrs 10-12 yrs 16
Marching Baritones n/a 10-12 yrs n/a 10-12 yrs 15
Tubas 10-15 yrs 12-15 yrs 12-16 yrs n/a 15
Sousaphones n/a 12-16 yrs n/a 12-16 yrs 16
Harps - Concert Grande n/a n/a 15-20 yrs n/a 15
Harps - Troubadour n/a 12-20 yrs? n/a n/a 15
Marching Snare Drums n/a 12-15 yrs (MS) 5-7 yrs 5-7 yrs 7
Marching Tenor Drums n/a 12-15 yrs (MS) 5-7 yrs 5-7 yrs 7
Useful Life of Instruments for Orchestra and Band Note that there are wide variances, depending on availability of funds for proper maintenance, student
age group, quality of instruments, frequency of use, etc.

ITEMBEGINNER
LEVEL
INTERMEDIATE
LEVELUPPER LEVEL
HIGH SCHOOL
ONLY: IF
USED FOR
MARCHING
TO BE USED AS
BASIS FOR
REPLACEMENT
DATE
Marching Bass Drums n/a 12-15 yrs (MS) 5-7 yrs 5-7 yrs 7
Tympani n/a 8-10 yrs 10-14 years 6-8 yrs 14
Tympani used outdoors n/a 8-10 yrs n/a 8-10 yrs 10
Concert Bass Drums n/a 10-15 yrs 10-15 yrs 6-8 yrs 15
Concert Snare Drums n/a 10-15 yrs 10-15 yrs n/a 15
Orchestra Bells n/a 10-15 yrs 10-15 yrs n/a 15
Orchestra Bells outdoors n/a 5-7 yrs n/a 5/7 yrs 7
Xylophones n/a 12-15 yrs 12-16 yrs n/a 16
Xylophones outdoors n/a 5-7 yrs n/a 5-7 yrs 7
Marimbas n/a 12-15 yrs 12-16 yrs 5-7 yrs 16
Marimbas outdoors n/a 5-7 yrs n/a 5-7 yrs 7
Chimes n/a 12-15 yrs 12-18 yrs n/a 18
Chimes outdoors n/a 5-7 yrs n/a 5-7 yrs 7
Concert Toms n/a 12-15 yrs 12-16 yrs 5-7 yrs 16
Drum Sets n/a 12-15 yrs 12-16 yrs 5-7 yrs 16
Pianos n/a 20+ years* 20+ years* 20+ years* 20

Fine Arts Instruments
Estimated Replacement Schedule
Year of Replacement Totals
2012 5,841,620
2013 487,539
2014 851,705
2015 853,982
2016 298,505
2017 415,650
2018 68,457
2019 274,745
2020 432,755
2021 231,165
2022 135,341
2023 566,724
2024 464,149
2025 916,282
2026 805,550
2027 69,654
2028 114,959
2029 96,000
2030 81,100
2031 1,800
2032 32,900
13,040,582$
* Values based on estimated replacement costs as of Spring 2012.