round 1 scoring guide - ded.mo.gov · 1 . application scoring process overview . this guide is...
TRANSCRIPT

Round 1 Scoring Guide
1

1
Application Scoring Process Overview This guide is provided to assist applicants in understanding the scoring process and requirements for the each criteria.
All applications are evaluated using a 100-point objective scoring process. Applicants self-score their application as part of the application submission. Scoring is verified by MO DED Business and Community Solutions program staff during the application review period. Prior to submission of the application, program staff can assist applicants in assessing potential competitiveness based on an anticipated self-score.
The competitive scoring includes 12 criteria that fall under four main categories:
• Overall Size and Quality of the Project (35 Points)
• Level of Economic Distress (30 Points)
• Net Fiscal Benefit to the State and Local Municipality (25 Points)
• Input from Local Elected Officials (10 Points)
Based on their scores, the department will place preliminary applications into one of the following three tiers:
• Tier 1: 70 points and above
• Tier 2: 31-69 points
• Tier 3: 30 points and below
Round 1 Timeline The following dates are important deadlines for Round 1:
Application Cycle Opens: June 3, 2019 Application Cycle Closes: July 31, 2019 Application Review Period: June 3, 2019 – September 30, 2019 Award Announcement: On or after July 1, 2019
Program Contact
Landon Garber Or Bongkotch Anderson HTC Preliminary Reviewer HTC Program Administrator Missouri Department of Economic Development Missouri Department of Economic Development (573) 522-8005 (573) 751-7939 [email protected] [email protected]
2
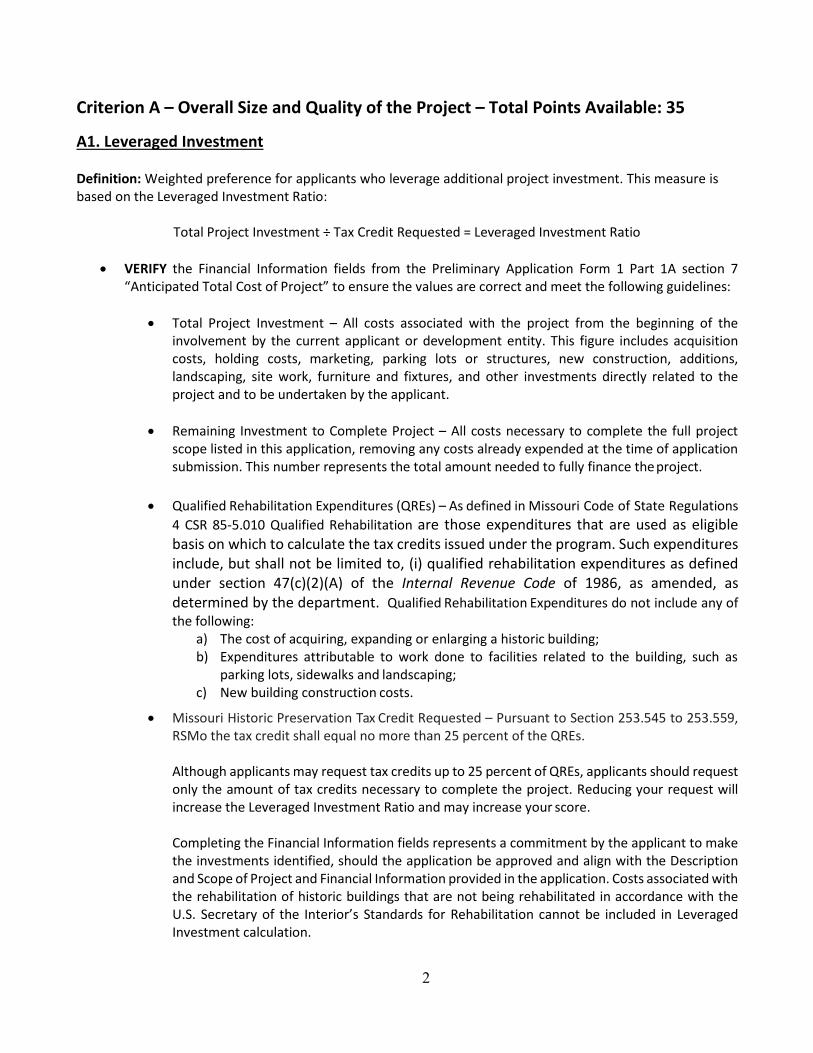
Criterion A – Overall Size and Quality of the Project – Total Points Available: 35
A1. Leveraged Investment
Definition: Weighted preference for applicants who leverage additional project investment. This measure is based on the Leveraged Investment Ratio:
Total Project Investment ÷ Tax Credit Requested = Leveraged Investment Ratio
• VERIFY the Financial Information fields from the Preliminary Application Form 1 Part 1A section 7 “Anticipated Total Cost of Project” to ensure the values are correct and meet the following guidelines:
• Total Project Investment – All costs associated with the project from the beginning of the
involvement by the current applicant or development entity. This figure includes acquisition costs, holding costs, marketing, parking lots or structures, new construction, additions, landscaping, site work, furniture and fixtures, and other investments directly related to the project and to be undertaken by the applicant.
• Remaining Investment to Complete Project – All costs necessary to complete the full project
scope listed in this application, removing any costs already expended at the time of application submission. This number represents the total amount needed to fully finance the project.
• Qualified Rehabilitation Expenditures (QREs) – As defined in Missouri Code of State Regulations
4 CSR 85-5.010 Qualified Rehabilitation are those expenditures that are used as eligible basis on which to calculate the tax credits issued under the program. Such expenditures include, but shall not be limited to, (i) qualified rehabilitation expenditures as defined under section 47(c)(2)(A) of the Internal Revenue Code of 1986, as amended, as determined by the department. Qualified Rehabilitation Expenditures do not include any of the following:
a) The cost of acquiring, expanding or enlarging a historic building; b) Expenditures attributable to work done to facilities related to the building, such as
parking lots, sidewalks and landscaping; c) New building construction costs.
• Missouri Historic Preservation Tax Credit Requested – Pursuant to Section 253.545 to 253.559, RSMo the tax credit shall equal no more than 25 percent of the QREs.
Although applicants may request tax credits up to 25 percent of QREs, applicants should request only the amount of tax credits necessary to complete the project. Reducing your request will increase the Leveraged Investment Ratio and may increase your score.
Completing the Financial Information fields represents a commitment by the applicant to make the investments identified, should the application be approved and align with the Description and Scope of Project and Financial Information provided in the application. Costs associated with the rehabilitation of historic buildings that are not being rehabilitated in accordance with the U.S. Secretary of the Interior’s Standards for Rehabilitation cannot be included in Leveraged Investment calculation.

3
• ATTACH a copy of the projected budget. The projected budget should include a detailed listing of all
costs including: acquisition, construction, furniture, fixtures, equipment, construction interest, architectural design, engineering, taxes and insurance, legal and professional fees, financing fees, project overhead, development fees, marketing and advertising, and any other major expenditure involved in the project. The projected budget should demonstrate how the Total Project Investment, Remaining Investment to Complete Project, Qualified Rehabilitation Expenditure, and Missouri Historic Preservation Tax Credit Requested values were calculated.
• LABEL the attachment “Projected Budget.”
• SELECT the appropriate option based on the calculated Leveraged Investment Ratio. Leveraged Investment Points Available Points Scored More than 10.0 5 8.1 to 10 4 6.1 to 8.0 3 5.1 to 6.0 2 4.1 to 5.0 1 4.0 or less 0
A2. Number of New Jobs to the State to be Created by the Project
NOTE: Only non-construction jobs that are new to the State and not relocated from elsewhere in the State may be counted.
• SELECT the appropriate scoring option based on the number of new jobs to the State.
Number of Net New Jobs to the State to be Created by the Project
Points Available Points Scored
Greater than 100 Net New Jobs 5 81-100 Net New Jobs 4 61-80 Net New Jobs 3 41-60 Net New Jobs 2 21-40 Net New Jobs 1 20 or Less Net New Jobs 0
A3. Average Wage for the New Jobs to be Created by the Project
• RESEARCH the county average wage for your project:
• OPEN your web browser to https://www.missourieconomy.org/indicators/countywage.stm.
4
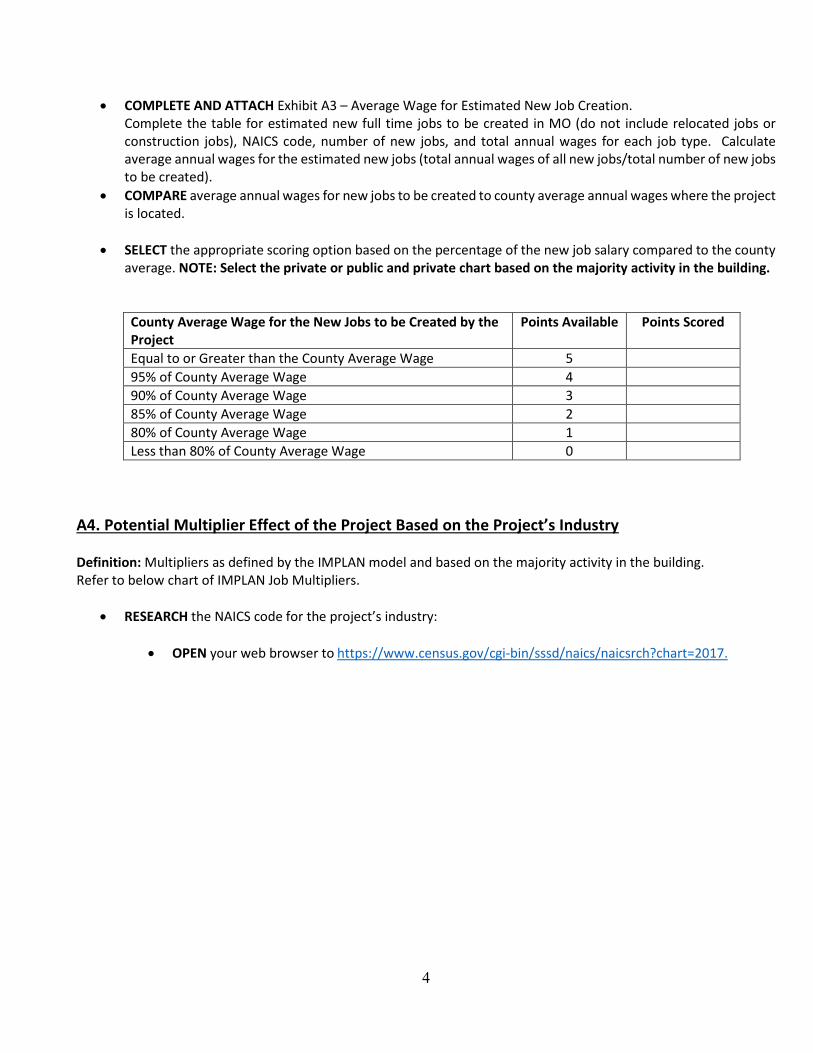
• COMPLETE AND ATTACH Exhibit A3 – Average Wage for Estimated New Job Creation. Complete the table for estimated new full time jobs to be created in MO (do not include relocated jobs or construction jobs), NAICS code, number of new jobs, and total annual wages for each job type. Calculate average annual wages for the estimated new jobs (total annual wages of all new jobs/total number of new jobs to be created).
• COMPARE average annual wages for new jobs to be created to county average annual wages where the project is located.
• SELECT the appropriate scoring option based on the percentage of the new job salary compared to the county average. NOTE: Select the private or public and private chart based on the majority activity in the building. County Average Wage for the New Jobs to be Created by the Project
Points Available Points Scored
Equal to or Greater than the County Average Wage 5 95% of County Average Wage 4 90% of County Average Wage 3 85% of County Average Wage 2 80% of County Average Wage 1 Less than 80% of County Average Wage 0
A4. Potential Multiplier Effect of the Project Based on the Project’s Industry
Definition: Multipliers as defined by the IMPLAN model and based on the majority activity in the building. Refer to below chart of IMPLAN Job Multipliers.
• RESEARCH the NAICS code for the project’s industry:
• OPEN your web browser to https://www.census.gov/cgi-bin/sssd/naics/naicsrch?chart=2017.

5
IMPLAN Job Multipliers
Sector NAICS Job
Multiplier
Utilities 22 4.03 Information 51 3.64 Manufacturing 31-33 2.89 Management of Companies 55 2.54 Wholesale Trade 42 2.21 Real Estate and Rental 53 2.20 Finance and Insurance 52 2.02 Professional, Scientific & Tech. Services 54 1.92 Construction 23 1.79 Transportation and Warehousing 48-49 1.77 Mining 21 1.68 Health and Social Services 62 1.55 Arts, Entertainment & Recreation 71 1.49 Educational Services 61 1.41 Administrative & Waste Services 56 1.40 Retail Trade 44 1.39 Accommodation & Food Services 72 1.28 Agriculture, Forestry, Fishing & Hunting 11 1.28
2016 multipliers represent rounded statewide estimates and are for reference only. Multipliers for individual projects will vary based on region, time period, detailed industry, and project information.
• SELECT the appropriate scoring option based on the multiplier result.
Potential Multiplier Effect of the Project Based on the Project’s Industry
Points Available Points Scored
2.50 or More 5 1.80 – 2.49 4 1.50 – 1.79 3 1.30 – 1.49 2 Less than 1.30 1
A5. Financing Committed
Definition: Weighted preference for applicants who have financing and/or equity in place and are ready to begin development immediately.

6
• COMPLETE Exhibit A5 – Financing Committed
• VERIFY the Missouri Historic Preservation Tax Credit field to ensure the value is correct.
• COMPLETE the Federal Historic Preservation Tax Credit field. The Federal Historic Preservation Tax Credit
Value should not exceed 20 percent of QRE’s.
• COMPLETE the table with each type of committed financial sources (e.g. bank loans, developer equity, local incentives) and the amount each source will provide. A separate line should be used for each unique commitment and/or funder.
• ATTACH Exhibit A5 – Financing Committed and documentation for all identified financing sources. All
financing sources (Private Financing, Public Financing and Developer Equity) must be documented meeting the guidelines below. Financing sources without proper documentation will be removed from the percentage of financing committed.
• Private Financing in place can be demonstrated through any or all of the following documents:
a) Term Sheet: This document is signed by a bank, financial institution or other investment
source declaring their total financial investment in the project, the date that the investment will be made, the term of the investment and any conditions upon closing.
b) Executed Loan Agreement: This is a legal document demonstrating a commitment to
loan a specific amount of financing for the project, the date the commitment was made and an established period of time in which the investment will take place.
c) Commitment Letter: This document is signed by a bank, financial institution or other
investment source declaring their total financial investment in the project, the date the commitment was made and an established period of time in which the investment will take place. Letters of interest will be accepted but will not count toward the percentage of financing committed.
• Public Financing in place can be documented through an approved council or commission
ordinance, development agreement, letter of commitment or approval letter from a jurisdiction or public agency and must contain the dollar amount of financing for the project.
Specific Public Financing Source Requirements:
a) HUD Insured Loans: Provide 1) a term sheet or executed loan agreement from a HUD
approved lender meeting the private financing guidance requirements for term sheets and agreements and 2) documentation from HUD approving the pre-application and inviting the applicant to submit the final firm application for the project (Invitation to Submit letter).
Please Note: Tax abatements will not count toward the percentage of financing

7
committed. Documentation of tax abatements should be included in Section D1: Local Participation and Support to document city or county financial support.
• Developer Equity in place requires at a minimum 1) a signed letter of commitment from the
developer containing the dollar amount committed and 2) information from a bank, financial institution or third-party accountant that clearly demonstrates the committed developer equity is unencumbered and available for this project. Should more than 50% of the financing be documented with developer equity from an individual, a personal financial review will be conducted on the individual. Please Note: Deferred Developer Fee documentation will be accepted but will not count toward the percentage of financing committed.
• LABEL the attachments with the following: Public, Private, or Other Source.
• SELECT the appropriate scoring option based on the calculated Percentage of Financing Committed.
Overall Size and Quality of Project – Total Points Scored Out of 35
Criterion B – Level of Economic Distress – Total Points Available: 30
B1. Federal Opportunity Zone
Definition: The project’s census tract is designated as a Federal Opportunity Zone.
• RESEARCH the project’s census tract’s designation as a Federal Opportunity Zone.
(1) Open your web browser to: https://www.cims.cdfifund.gov/preparation/?config=config_nmtc.xml
(2) Enter the property address including the city and state in the search box at the top right and search (3) Click on the “red” pin that represents your property address on the map (4) Click the “zoom to” link in the pop up window (5) Click on the map just outside of the “red” pin but still within the census tract border to retrieve the
property information (6) In the pop up window find Qualified Opportunity Zone: Yes or No
Financing Committed Points Available Points Scored 100% of financing in place 15 90% of financing in place 13 80% of financing in place 11 70% of financing in place 9 60% of financing in place 7 50% of financing in place 5 40% of financing in place 3 Less than 40% of financing in place 1

8
(7) Print and attach a copy of the map. Note: make sure that the pop up window with the Opportunity Zone information is open and shown on the printed map
• LABEL the map “Federal Opportunity Zone Map.”
• SELECT the appropriate scoring option based on the whether or not the projects census tract is located in a
Federal Opportunity Zone. The Project Census Tract’s Designation as a Federal Opportunity Zone
Points Available Points Scored
Yes 10 No 0
B2. Qualified Census Tract
Definition: The project’s census tract is designated as a Qualified Census Tract.
• RESEARCH the project’s census tract’s designation as a Qualified Census Tract.
(1) Open your web browser to: https://mogov.maps.arcgis.com/apps/webappviewer/index.html?id=893ffd30139149a68ef434f3557c897b
(2) Enter the property address including the city and state in the search box at the top left and search (3) Click and open the “legend” in the top right corner (4) Determine if the property address is in one of the two shaded areas on the map. If the address is in a
shaded area it is in a Qualified Census Tract. If the address is NOT in a shaded area it isn’t in a Qualified Census Tract.
(5) Click and open the print option in the top left corner under the address search box (6) Click the print tab and a PDF will be created (this may take several minutes) (7) Click on the newly generated PDF titled “Qualified Census Tracts” (8) Print and attach a copy of the PDF map
• LABEL the map “Qualified Census Tract Map.”
• SELECT the appropriate scoring option based on whether or not the project’s census tract is designated as a
Qualified Census Tract.
The Project Census Tract’s Designation as a Qualified Census Tract
Points Available Points Scored
Yes 3 No 0
B3. The Project County’s Level of Unemployment

9
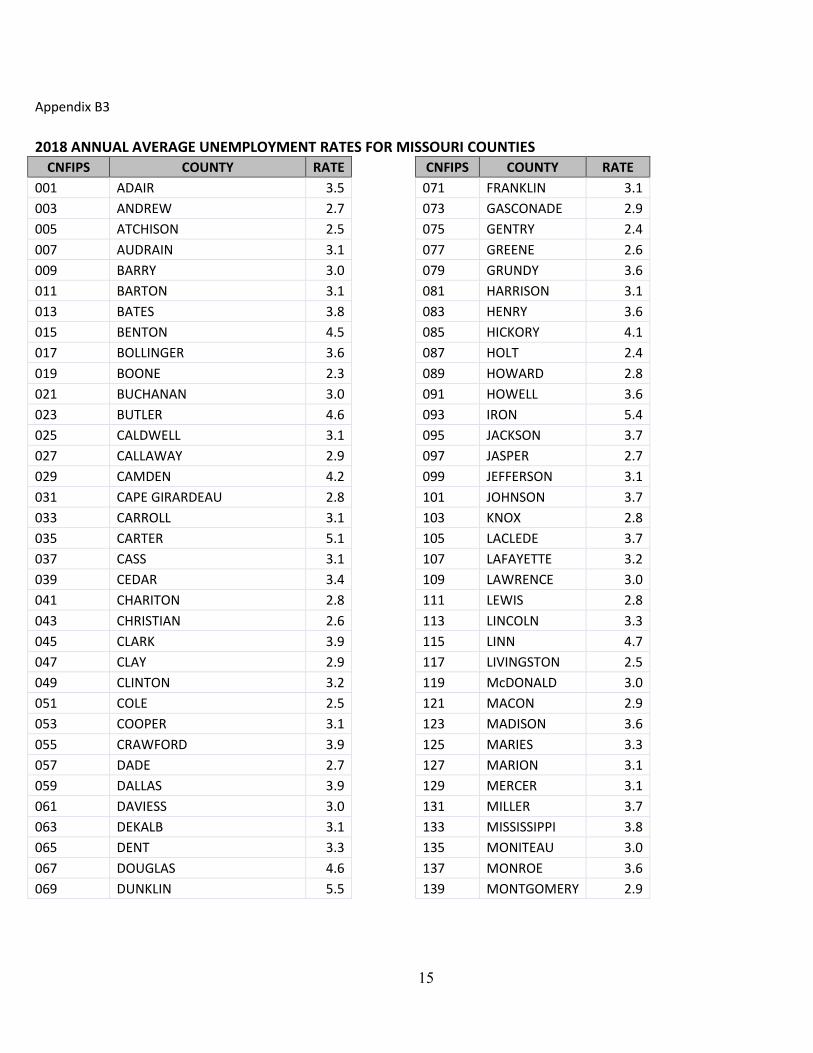
Definition: Weighted preference for projects that will create economic growth in distressed areas. This measure uses the average unemployment rate of the county during the year currently available preceding the start of the application period.
• REFERENCE Appendix B3 for average county unemployment rates, calculated by Missouri Economic Research Information Center (MERIC).
• COMPARE the average county unemployment rate to the average state unemployment rate. The Missouri
average unemployment rate for 2018 was 3.2%.
The Project County’s Level of Unemployment Points Available Points Scored Unemployment rate greater than 2 percentage points above Missouri rate
4
Unemployment rate between1.1 and 2.0 percentage points above Missouri rate
3
Unemployment rate between 1.0 percentage point below and 1.0 percentage point above Missouri rate
2
Unemployment rate between 1.1 and 2.0 percentage points below Missouri rate
1
Unemployment rate more than 2.0 percentage points below Missouri rate
0
B4. The Project Census Tract’s Overall Poverty Rate
Definition: Weighted preference for projects that will create economic growth in distressed areas. This measure uses the poverty rate of census tract.
• RESEARCH the poverty rate of the census tract by using the U.S. Census Bureau’s American Factfinder:
1. Open your web browser to http://factfinder.census.gov/ 2. From the FactFinder Main page, click on Advanced Search in the center of the page, then click
on the “Show Me All” button. 3. Select the ‘Topics’ search option on the left side of the screen.
4. Select ‘People,’ then ‘Poverty,’ then ‘Poverty’ nested under that. 5. Close the ‘People’ topic and select the ‘Dataset‘ topic, then select “2017 ACS 5-year estimates.”
Make sure ‘Your Selections’ box is now displaying ‘Poverty’ and “2017 ACS 5-year estimates.” 6. Click on the ‘Geographies’ search option, and select the Address tab. 7. Type in the project address and hit the ‘Go’ button. 8. The results display different scopes of geography. For your tract, look for “Census Tract” under
the Geography Type column, and click on its associated Geography Name. 9. Close the ‘Geographies’ search option. Make sure ‘Your Selections’ box now includes the census tract
name as a search selection. 10. In the Search Results, select table S1701 “Poverty Status in the Past 12 Months.” 11. Save the Results page as a PDF. 12. Print and attach the PDF

10
• LABEL the attachment “Project Census Tract’s Overall Poverty Rate.”
• Select the appropriate scoring option based on your project census tract’s overall poverty rate.
The Project Census Tract’s Overall Poverty Rate Points Available Points Scored 50% or greater poverty 3 40% or greater poverty 2 30% or greater poverty 1
B5. Vacant Property Definition: Weighted preference for buildings that are underutilized or not occupied and will generate a greater catalytic impact upon completion of their rehabilitation. Vacancy is measured over a one-year period ending on the date on which the application must be submitted.
• SELECT the appropriate scoring option based on the vacancy of existing building(s).
Vacant Property Points Available Points Scored 95% - 100% vacant 10 85 - 94.99% vacant 9 70 - 84.99% vacant 8 55 - 69.99% vacant 7 40 - 54.99% vacant 5 25 - 39.99% vacant 4 10 - 24.99% vacant 2 Less than 10% vacant 1
• ATTACH a table that demonstrates the average vacancy rate of the existing building(s) in the project,
including the historic building(s). As demonstrated in the example table below, include a row for each floor, a column for each month of the one-year period and columns for both the 12-month average vacancy and percentage of building vacancy for each floor.
If the property was 100 percent vacant for the full year, a statement of vacancy may be provided in place of a floor-by-floor table.
Example vacancy table:

11
• LABEL the attachment “Statement of vacancy or vacancy table.” Level of Economic Distress – Total Points Scored Out of 30
Criterion C – Net Fiscal Benefit – Total Points Available: 25
C1. Net Fiscal Benefit Definition: Weighted preference for projects with the greatest return on investment (ROI). DED Business and Community Solutions will conduct a cost-benefit analysis based on the data provided in this section and award up to 25 points based on the ROI from the project to state and local governments. These points are not self-scored by the applicant.
State Cost-Benefit Analysis Points Available Points Scored ROI of 2.0 or more over 10 years 15 ROI between .76 and 1.99 over 10 years 10 ROI between .25 and .75 over 10 years 5 ROI between .10 and .24 over 10 years 2 ROI less than .10 over 10 years 0
Local Cost-Benefit Analysis Points Available Points Scored No Tax Abatement 10 ROI of 2.0 or more over 10 years 8 ROI between 1.0 and 1.99 over 10 years 6 ROI between .50 and .99 over 10 years 4 ROI less than .50 over 10 years 2 100% Tax Abatement 0
Net Fiscal Benefit – Total Points Available 25
Criterion D – Input from Local Elected Officials – Total Points Available: 10

12
D1. Local Participation and Support Definition: Weighted preference for applicants who have received an indication of support from their local jurisdiction (municipality or township) or county.
If the applicant is documenting an indication of local support:
• ATTACH a letter supporting a Missouri Historic Preservation Tax Credit application for the project. The letter should be signed by the Mayor of the local jurisdiction, or the County Executive of the county where the project is located, and must be dated within six months of the date this application was submitted.
OR • ATTACH a resolution of support passed by the Legislative Body of the Municipality, or the
County Commissioners of the county, where the project is located supporting the project’s application for the Missouri Historic Preservation Tax Credit. The resolution must be dated within one year of the date this application is submitted. Additional points will not be awarded for submitting multiple letters of support from more than one local entity.
• LABEL the attachment “Indication of Local Support.”
• SELECT the appropriate scoring option based on the highest level of participation.
Local Participation and Support Points Available Points Scored Financial Commitment AND Indication of Local Support 10 Financial Commitment 6 Indication of Local Support 2 No Indication of Support 0
Input from Local Elected Officials – Total Points Scored Out of 10
Total Application Score
Total Overall Points Available 100 Total Overall Points Scored

13
HISTORIC PRESERVATION TAX CREDIT PROGRAM
Exhibit A3 Average Wage for
Estimated New Job Creation
THE TOTAL NUMBER OF NEW JOBS TO BE CREATED BY THE PROJECT (REPORT ONLY FULL TIME JOBS THAT ARE NEW TO THE STATE OF MISSOURI, DO NOT INLCUDE RELOCATED JOBS OR CONSTRUCTION JOBS DURING THE REHABILITATION) COMPLETE THE TABLE BELOW FOR EACH JOB TYPE, NAICS CODE, NUMBER OF NEW JOBS, AND TOTAL ANNUAL WAGES FOR EACH JOB TYPE JOB TYPE NAICS NUMBER OF NEW
JOBS TOTAL ANNUAL WAGES
1. AMOUNT
2. AMOUNT
3. AMOUNT
4. AMOUNT
5. AMOUNT
6. AMOUNT
7. AMOUNT
8. AMOUNT
9. AMOUNT
10. AMOUNT
TOTAL TOTAL AMOUNT
Total number of new jobs reported in this exhibit must match the total number of new jobs reported in Section 8 of Preliminary Application form 1, part 1A
TOTAL NUMBER OF ESTIMATED NEW JOBS ____________ JOBS
TOTAL ANNUAL WAGES OF ESTIMATED NEW JOBS $______________ AVERAGE ANNUAL WAGES FOR ESTIMATED NEW JOBS $_______________
COUNTY AVERAGE ANNUAL WAGES WHERE THE PROJECT IS LOCATED $_____________
AVERAGE ANNUAL WAGES FOR ESTIMATED NEW JOBS COUNTY AVERAGE ANNUAL WAGES = ____________

14
HISTORIC PRESERVATION TAX CREDIT PROGRAM
Exhibit A5 Financing Committed
THE AMOUNT OF OVERALL PROJECT FINANCING THAT THE APPLICANT HAS SECURED FIRM COMMITMENTS PRIOR TO SUBMITTING PRELIMINARY APPLICATION TO DED
COMPLETE THE TABLE BELOW WITH EACH TYPE OF COMMITTED FUNDING SOURCE (E.G. BANK LOANS, DEVELOPER EQUITY, LOCAL INCENTIVES) AND THE AMOUNT EACH SOURCE WILL PROVIDE HISTORIC PRESERVATION TAX CREDITS: MISSOURI HISTORIC PRESERVATION TAX CREDIT $ FEDERAL HISTORIC PRESERVATION TAX CREDIT $
SOURCES 1:
DESCRIPTION OF SOURCE AMOUNT $
SOURCES 2:
DESCRIPTION OF SOURCE AMOUNT $
SOURCES 3:
DESCRIPTION OF SOURCE AMOUNT $
SOURCES 4:
DESCRIPTION OF SOURCE
AMOUNT $
SOURCES 5:
DESCRIPTION OF SOURCE AMOUNT $
SOURCES 6:
DESCRIPTION OF SOURCE AMOUNT $
PROVIDE SUPPORTING DOCUMENTATION FOR EACH SOURCE OF FUND LISTED ABOVE. See the Self-Scoring Guide for acceptable form of documentation. TOTAL FINANCING AMOUNT COMMITED $ REMAINING INVESTMENT TO COMPLETE THE PROJECT $ PERCENTAGE OF FINANCING COMITTED ______%
15
Appendix B3 2018 ANNUAL AVERAGE UNEMPLOYMENT RATES FOR MISSOURI COUNTIES
CNFIPS COUNTY RATE CNFIPS COUNTY RATE 001 ADAIR 3.5 071 FRANKLIN 3.1 003 ANDREW 2.7 073 GASCONADE 2.9 005 ATCHISON 2.5 075 GENTRY 2.4 007 AUDRAIN 3.1 077 GREENE 2.6 009 BARRY 3.0 079 GRUNDY 3.6 011 BARTON 3.1 081 HARRISON 3.1 013 BATES 3.8 083 HENRY 3.6 015 BENTON 4.5 085 HICKORY 4.1 017 BOLLINGER 3.6 087 HOLT 2.4 019 BOONE 2.3 089 HOWARD 2.8 021 BUCHANAN 3.0 091 HOWELL 3.6 023 BUTLER 4.6 093 IRON 5.4 025 CALDWELL 3.1 095 JACKSON 3.7 027 CALLAWAY 2.9 097 JASPER 2.7 029 CAMDEN 4.2 099 JEFFERSON 3.1 031 CAPE GIRARDEAU 2.8 101 JOHNSON 3.7 033 CARROLL 3.1 103 KNOX 2.8 035 CARTER 5.1 105 LACLEDE 3.7 037 CASS 3.1 107 LAFAYETTE 3.2 039 CEDAR 3.4 109 LAWRENCE 3.0 041 CHARITON 2.8 111 LEWIS 2.8 043 CHRISTIAN 2.6 113 LINCOLN 3.3 045 CLARK 3.9 115 LINN 4.7 047 CLAY 2.9 117 LIVINGSTON 2.5 049 CLINTON 3.2 119 McDONALD 3.0 051 COLE 2.5 121 MACON 2.9 053 COOPER 3.1 123 MADISON 3.6 055 CRAWFORD 3.9 125 MARIES 3.3 057 DADE 2.7 127 MARION 3.1 059 DALLAS 3.9 129 MERCER 3.1 061 DAVIESS 3.0 131 MILLER 3.7 063 DEKALB 3.1 133 MISSISSIPPI 3.8 065 DENT 3.3 135 MONITEAU 3.0 067 DOUGLAS 4.6 137 MONROE 3.6 069 DUNKLIN 5.5 139 MONTGOMERY 2.9

16
CNFIPS COUNTY RATE CNFIPS COUNTY RATE
141 MORGAN 4.3
186 STE. GENEVIEVE 2.8
143 NEW MADRID 4.8 187 ST. FRANCOIS 3.7 145 NEWTON 3.0 189 ST. LOUIS CO. 3.0 147 NODAWAY 2.9 195 SALKINE 3.0 149 OREGON 3.5 197 SCHUYLER 4.1 151 OSAGE 2.4 199 SCOTLAND 2.9 153 OZARK 5.2 201 SCOTT 3.4 155 PEMISCOT 5.5 203 SHANNON 5.0 157 PERRY 2.3 205 SHELBY 3.0 159 PETTIS 4.1 207 STODDARD 4.4 161 PHELPS 3.1 209 STONE 4.7 163 PIKE 3.6 211 SULLIVAN 3.1 165 PLATTE 2.6 213 TANEY 5.2 167 POLK 3.6 215 TEXAS 4.1 169 PULASKI 3.6 217 VERNON 3.1 171 PUTNAM 3.4 219 WARREN 2.8 173 RALLS 2.8 221 WASHINGTON 4.4 175 RANDOLPH 3.8 223 WAYNE 4.8 177 RAY 3.6 225 WEBSTER 3.1 179 REYNOLDS 3.1 227 WORTH 2.8 181 RIPLEY 5.2 229 WRIGHT 4.1 183 ST. CHARLES 2.5 510 ST. LOUIS CITY 3.8 185 ST. CLAIR 4.4 NOTE: Data are provisional: they have been revised but are not yet official and are subject to change. MISSOURI DEPARTMENT OF ECONOMIC DEVELOPMENT/MERIC IN COOPERATION WITH U.S. DEPARTMENT OF LABOR, BUREAU OF LABOR STATISTICS (BLS)