roughness and ordering at the interface of oxidized polystyrene and water
TRANSCRIPT

Published: June 23, 2011
r 2011 American Chemical Society 8678 dx.doi.org/10.1021/la200203s | Langmuir 2011, 27, 8678–8686
ARTICLE
pubs.acs.org/Langmuir
Roughness and Ordering at the Interface of Oxidized Polystyreneand WaterStela Andrea Muntean,*,†,‡ Marijn Kemper,§,‡ Leo J. van IJzendoorn,§ and Alexey V. Lyulin†
†Theory of Polymers and Soft Matter (TPS), Department of Applied Physics, Eindhoven University of Technology,Den Dolech 2, 5600 MB Eindhoven, The Netherlands‡Dutch Polymer Institute, 5600 AX Eindhoven, The Netherlands§Molecular Biosensors for Medical Diagnostics (MBx), Department of Applied Physics, Eindhoven University of Technology,Den Dolech 2, 5600 MB Eindhoven, The Netherlands
bS Supporting Information
’ INTRODUCTION
Polymeric materials are used in biomolecular diagnostics as thesolid phase for immunoassays. Simple plate readers as well as largescale diagnostic systems rely on the use of polystyrene well platesand the condition of the polystyrene surface determines to a largeextent the biochemical functionality of the proteins attached.Consequently, well plates are produced with many different typesof functionalized surfaces ranging from several degrees of oxida-tion determining their hydrophilic character to chemically mod-ified surfaces which are terminated by e.g. amines or carboxylgroups and allow covalent coupling of proteins on the surface. Thedevelopment of point-of-care-diagnostics invokes surfaces withadditional requirements on their functionality such as transpar-ency, low cost, easy processing, and again polymeric materials are agood candidate for these lab-on-a-chip applications.1 In addition,polymers are also used in novel detection methods based onactuated magnetic beads which consist of magnetite grains in apolystyrene matrix.2 The polystyrene surface of these beads isfunctionalized by proteins, and additionally an injection moldedpolymeric cartridge is used with a functionalized surface. Ob-viously, a fundamental understanding of the interactions of proteinswith polymeric surfaces is important for the overall performance
and the detection limit, in particular, of biomolecular diagnosticequipment.
In this paper we focus on the properties of a polystyrenesurface with various degrees of oxidation as a model systemwhich can be used as a starting point for measuring andcalculating the interactions between proteins and oxidized poly-styrene surfaces. We use the characterization of experimentallyprepared oxidized polystyrene surfaces as an input for moleculardynamics simulations and evaluate roughness, hydrophilicity,and ordering of both the molecular groups at the surface ofthe polystyrene and the water molecules in contact with thepolystyrene.
Hydrophilicity of the atactic polystyrene (aPS) surfaces isusually increased by surface oxidation using plasma treat-ment,3 UV radiation,4,5 or by permanganate oxidation in dilutesolutions of sulfuric acid.6 Such a modification in the hydrophiliccharacter of the aPS surface by the incorporation of oxygencontaining groups also changes the morphology and roughness
Received: January 17, 2011Revised: May 27, 2011
ABSTRACT: For the first time, atomistically detailed moleculardynamics calculations revealed molecular ordering of the water-oxidized atactic polystyrene (aPS) interface. Both ordering of thewater molecules and the phenyl rings occur. In addition, thenatural roughness of the surface has been simulated and com-pared to experimental values. The composition of the simulatedaPS films is based on spin-coated aPS films that have beenoxidized and characterized experimentally. The aPS surfaces areoxidized with ultraviolet-ozone radiation and have been char-acterized by XPS, AFM, and water contact angle measurements. XPS measurements show that the oxygen content in the sampleincreases rapidly with exposure and reaches saturation near 24 at. % of oxygen. Themolecular dynamics simulations show smootheningof an hydrophobic aPS surface upon transition from vacuum to water. The smoothening decreases with increasing hydrophilicity. Thecalculations reveal ordering of oxidized phenyl rings for aPS surfaces in water. The order increases with increasing hydrophilicity.Additionally, we investigated the water structure near the aPS�water interface as a function of the surface hydrophilicity. Withincreasing hydrophilicity, the density of water at the aPS�water interface increases. The water density profile is steeper in the presenceof hydrophobic aPS. The water shows an ordered layer near both the hydrophobic and hydrophilic surfaces; the position of this layershifts toward the interface with increasing hydrophilicity.

8679 dx.doi.org/10.1021/la200203s |Langmuir 2011, 27, 8678–8686
Langmuir ARTICLE
of the surface. The existence of the free interface can also lead tosome ordering of chains in surface layers. Oblique-polarized-raymeasurements on evaporated films from xylene showed7 that theaPS chain fragments are oriented predominantly parallel tothe surface of the film. This ordering decreases exponentially asthe distance of the layer from the interface boundary increases.Such an ordering has also been observed in recent moleculardynamics simulations of thin free-standing aPS films.8 Whetherand how the roughness is related to the orientation of chains nearthe surface of the polymeric film are unclear.
Experimental data indicate that oxidation makes the aPSsurface rougher. Usually roughness is defined by the standarddeviation Rq of the distribution of surface heights (root-mean-square roughness)9 or by the simple arithmetic average Ra ofsurface heights.10 The surface roughness strongly depends on thepreparation method. Wang et al.11 prepare aPS surfaces bypressing molten PS beads between glass slides and modify themwith oxygen radical anions. Using AFM, they find an increase ofRq from about 180 nm to about 380 nm for 30 μm � 30 μmsamples. Such a treatment adds polar CdO andO�CdObondsonto the aPS surface (by attaching them to the aromatic rings),making it significantly hydrophilic. The alkyl chains of aPS can beoxidized, turning aliphatic carbons into carboxylic groups bydifferent oxidizing agents, as permanganate,6 for example. One ofthe possible reactions in this case is the cleavage of the aPS main-chain carbon bonds and its oxidation into carboxylic acid.Ultraviolet-ozone oxidation (UVO) of aPS surface shows12 theformation of the carbonyl groups in the aPS phenyl groups. It wasshown that oxygen creates a modified hydrophilic layer of at least4 nm thickness. Teare et al.5 investigated polystyrene cell culturedishes and found a much lower surface roughness (Ra) of 2.5 nm.UVO treatment of these dishes induces the formation of surfacegrains. However, after washing, the roughness (Ra) of theseoxidized aPS surfaces was only slightly increased from 2.5 to 3 nmprobing 2 μm� 2 μm areas. Browne et al.4 show that spincoatedaPS is evenmore flat and oxidation byUVO and washing in watercauses an increase in Rq from about 0.2 to about 0.4 nm. Withincreasing oxidation time they observe an increase in C�O,CdO, and O�CdO functional groups. Rytlewski and Zenkie-wicz reported recently13 the laser-induced surface oxidation ofinjection molded polystyrene. They observed changes in thechemical composition (breaking of C�Cmain-chain bonds) andoxidation of a thin (about 4 nm) aPS surface layer. Measuring byAFM the surface roughness Ra, they also observe an increasefrom about 10 to about 60 nm for 30 μm� 30 μm samples, uponoxidation. Plasma treatment and corresponding molecular dy-namics (MD) simulations3 showed that a modified layer on anaPS surface with thickness of a few nanometers has beenproduced, and the roughness of the surface was increased. Allmeasurements reported above describe the induced roughnessmeasured in vacuum.
In order to obtain more detailed information on the structureand interactions of molecules, molecular simulations are exten-sively used. For an overview of simulations of biomolecularsurfaces, see the paper by Latour.10 Only few studies have beendevoted to atomistic MD simulations of hydrophilicity androughness of polymer surfaces.
Not only the surface itself but also the solvent (e.g., water) ismodified near the interface. Enhanced structuring of water andentropy loss in the vicinity of hydrophobic surfaces is reported,14
as obtained from vibrational spectroscopy experiments on structureof water at interfaces with CCl4 and hexane. The measurements
show that the hydrogen-bonding interactions between interfacialwaters is weak.
Most of the knowledge about the water structure at theinterface with various surfaces relies again on MD simulations.MD simulations of water drying at nonpolar interfaces have beencarried out by Mittal and Hummer.15 They find subnanometerscale fluctuations in water density near a convex hydrophobicsolute. These fluctuations do not lead to formation of large voidsat the interface. A void space of less than 1 nm close to the talchydrophobic surface is reported in MD simulations of Du andMiller.16 They also show that the interfacial water molecules arepreferentially located in a plane parallel to the hydrophobiccrystalline surface. Lee and Rossky17,18 showed that both struc-tured and structureless hydrophobic surfaces behave equivalentlyin this respect and mainly result in the loss of hydrogen bondingat the interface. The hydrogen bonding between hydrophilicsurface and water is stronger than the hydrogen bonding in bulkwater,18 the interfacial layer ranging up to 1 nm thickness. Waterorientation at structureless surfaces, without any atomistic detail,of varying hydrophobicity has been simulated recently byTrudeau et al.19 Simulations show that the water moleculesdirect one of their hydrogens toward the hydrophobic surface,while near the less hydrophobic surfaces they orient in a planeparallel to the surface. The water molecules at hydrophilicsurfaces are strongly oriented because of the dipole�dipoleinteractions between the water molecules and the polar organiccompound.
Molecular simulations of water near surfaces were also per-formed in the Netz group.20 They studied the influence on thewater structure of density, spatial distribution, and orientation ofpolar groups at the surface. In the same group they show thatwater viscosity increases near a polar surface, the viscosity andthickness of the interface water layer depending on the density ofpolar groups on the surface.21
The main goal of the present study is twofold: (i) to under-stand the changes of the aPS surface structure upon oxidation,both in vacuum and in water (to do this, we calculate the orderingof aPS segments at the interface and study the surface roughnessupon oxidation); (ii) to understand the changes of the waterstructure in the vicinity of the surface upon its oxidation.
In this study, we combine atomistic MD simulations andexperimental techniques, such as X-ray photoelectron spectros-copy (XPS), atomic force microscopy (AFM), and water contactangle measurements to investigate the hydrophilicity and rough-ness of aPS surface upon oxidation. We choose amorphousatactic polystyrene as a model system for the polymeric film.We do not aim to reproduce in every detail the oxidation ofpolystyrene, but to study the effects of oxygen (as polar group)on the surface properties of aPS. We experimentally perform theoxidation of polystyrene by UVO treatment. We also computa-tionally modify the surface of the aPS film by attaching oxygenatoms to the phenyl rings, in a fashion that is similar to theexperimental photo-oxidation of aPS.22 The polystyrene surfacein both vacuum and water surroundings is being simulated. Thesurface roughness of the aPS films is calculated from MDsimulations and measured by AFM. The ordering of the polymermonomers near the aPS surface is computationally analyzed andthe influence of water presence and of the chemical modificationon the surface properties is being discussed. Finally, we study thewater density profile and orientation near the surface as afunction of the hydrophobic/hydrophilic character of the surface.The novelty in this paper is that we consider a disordered glassy

8680 dx.doi.org/10.1021/la200203s |Langmuir 2011, 27, 8678–8686
Langmuir ARTICLE
polymer in atomistic detail, gradually oxidized and in presence ofwater. We calculated ordering of oxidized polystyrene films andrelate it to the roughness of these films. We combine results fromexperiments and simulations.
The main result of this paper is showing that surfaces becomesmoother in water than they are in vacuum and that thesmoothening decreases with increasing the degree of oxidation.The smoothening of hydrophobic surfaces is accompanied by aloss of the natural ordering of phenyl rings at the interface upontransition from vacuum to water.We also show that water densitynear the hydrophobic surface has a sharper profile compared towater near hydrophilic surfaces. The water molecules near thehydrophobic surface are more oriented as compared to watermolecules near hydrophilic surfaces. This suggests an effectiverepulsion between water and hydrophobic surfaces.
The present paper is organized as follows: In the sectionMethodology both experimental and computational methods arepresented. The results of the experimental investigation and MDsimulations of the aPS surface in vacuum and water are presentedand discussed in the section Results and Discussion. This sectionis divided in subsections dealing with the oxidation of aPS films,surface roughness, and orientation of phenyl rings near thesurface and structure of water near the interface.
’METHODOLOGY
Experimental Methods. aPS surfaces have been prepared by spin-coating onto glass microscope slides, cut into approximately 13 mm �13 mm pieces, this being the desired size for analysis. To promote theattachment of the aPS on glass, a layer of polyimide is applied inbetween. This prevents the aPS layer to come loose from the glass whenwashed in water or treated in solution. aPS was obtained from Alfa Aesarwith a formula weight of 125 000�250 000. This was dissolved at 2 wt %in toluene and spin-coated at 1000 rpm. The samples were left overnightto let all toluene evaporate.
The aPS substrates are oxidized using a PSD-UV ultraviolet/ozoneprobe and surface decontamination unit (Novascan). They are placed inthe UVO chamber and irradiated for a specified time. After irradiationthe chamber is immediately opened and the substrates are removed.
XPS measurements have been carried out on the (oxidized) aPSsamples using a VGCLAM II hemispherical analyzer with a channeltrondetector. Spectra were obtained using the aluminum anode (Al KR =1486.6 eV) operating at 150 W. For survey scans a constant pass energyof 100 eV was used and for region scans a constant pass energy of 50 eV.The background pressure was 2 � 10�9 mbar. Using XPS, the bindingenergies of electrons released from the sample by illumination withX-rays can be determined. From these binding energies the local chemicalstructure of the elements that are present in the top ≈5�10 nm of thesample can be determined. This has been done for samples with a range ofoxidation times between 0 and 600 s.
In order to analyze the hydrophilic character of the oxidized poly-styrene, water contact angles were measured. The instrument used is aDataPhysics OCA 30 Instrument Gm, Germany, model TBU 90E, withworking software OCA 20. A droplet of 10 μL is dispensed and hangingon the needle of an automated dispense unit. Then the substrate ismoved up until it touches the droplet. Subsequently the substrate ismoved down until the droplet is released from the needle. After therelease, a camera is used to capture an image of the droplet. Using thesoftware, the droplet is fitted by an ellipse to determine the left and rightcontact angles on the substrate.
A Veeco MultiMode atomic force microscope (AFM) is usedto measure surface topology of the samples in air and the influenceof oxidation hereon. Samples with four different oxidation times are
studied: 0, 30, 180, and600 s. For each sample areas of 0.5μm� 0.5μmhavebeen inspected with the AFM. Data are analyzed using NanoScope 6software.23
Simulation Details. We model the aPS film using the united-atomrepresentation, that is considering explicitly all heavy atoms, with thehydrogen atoms collapsed on the corresponding heavy atom. The systemconsists of 32 chains of 80 monomers each, having a molecular weight of≈8400. The model is similar to that used in our previous studies.8
The system was prepared starting with the chains in stretchedconfiguration, oriented parallel to each other and with the Z axis andplaced in a large simulation box of 40 nm lateral size (X and Y) and heightof about 22 nm (Z). The system was allowed to relax in melt at 540 K,and pressure was applied in Z direction in order to adjust the density inthe middle of the film to match experimental bulk density ofpolystyrene.24 At this stage the system was compressed in X and Ydirections, in order to adjust the lateral size of the film. Finally, the systemwas cooled down to 300Kwith a constant cooling rate of 0.01K/ps.25 Thecooling rate is much higher than experimental cooling rates. However,since the glass transition temperature increases logarithmically with thecooling rate,26 the aging effects on the time scale of our simulations arenegligible.27 The films obtained in this way have the size 10 nm in X andY directions and a thickness of∼6 nm. Because of the pressure applied inZ direction during the preparation of the film, the surface plane isoriented in the XY plane. Periodic boundary conditions are applied tothe simulation box having the size 10 nm� 10 nm� 20 nm (X� Y� Z).The aPS film is placed in the middle of the box. For clarity, we present asnapshot of the simulation box containing the aPS film and water (seeFigure 1a).
In order to tune the hydrophilicity of aPS films, we attach oxygenatoms to the phenyl rings in the ortho and meta position and in differentamounts, so that we obtain systems with 0, 6, 12, 18, and 24% oxygencontent at the surface. A typical top view of the oxidized surface with 12%oxygen content is shown in Figure 1b. For each degree of oxidation inthe range from 0 to 24% we prepared four statistically independentsystems and performed simulations for them. The final results areaverages of these four samples. The oxygen content is consistent withthe values measured by XPS after UVO oxidation of spincoated aPS, as itwill be discussed in the following section.
We simulated the systems in both vacuum and water. For the simula-tions in vacuum the volume of the system was fixed, and the temperature
Figure 1. (a) Side view of the simulation box of aPS in water: red =oxygen, white = hydrogen, and cyan = carbon (united atoms). (b) Topview of the oxidized aPS surface with 12% oxygen in vacuum: red spotsrepresent the oxygen atoms.
8681 dx.doi.org/10.1021/la200203s |Langmuir 2011, 27, 8678–8686
Langmuir ARTICLE
was maintained constant at 300 K (NVT statistical ensemble). Wealways check that the systems are well enough equilibrated before weperform the simulations. When we perform simulations of aPS in water,for the equilibration part, we fix the external pressure instead of thevolume (NPT ensemble), such that the water occupies the free volumein the box without altering its density, but by varying the box volume.After equilibration for 100�200 ps, the production runs have beenperformed with a time step of usually 4 fs; when simulating thepolystyrene film in water, the time step was decreased to 2 fs. Thelarger time steps are justified by the fact that we use the united-atomrepresentation, and we constrain our bonds, making them rigid. Thesingle point charge (SPC) model for water was used. For electrostaticinteractions we consider particle mesh Ewald (PME) summation. Thetotal length of each simulation is 1 ns. We simulated some of the systemsfor 15 ns, and we obtained very similar results as after 1 ns simulations,which is an indication that the results converge.
The simulations are performed with the GROMACS28 package ofprograms, using the GROMOS 53A6 force field parameter set.29 Thechoice of the force field was motivated by the larger perspective of theentire project which we are working on and which includes simulationsof proteins at a later stage. Nevertheless, we compared results of simu-lations performed with GROMOS 53A6 force field with results obtainedwith the force field byMondello et al.,25,30 and we find a good agreementof the bulk density, average density, and thickness of the film.
’RESULTS AND DISCUSSION
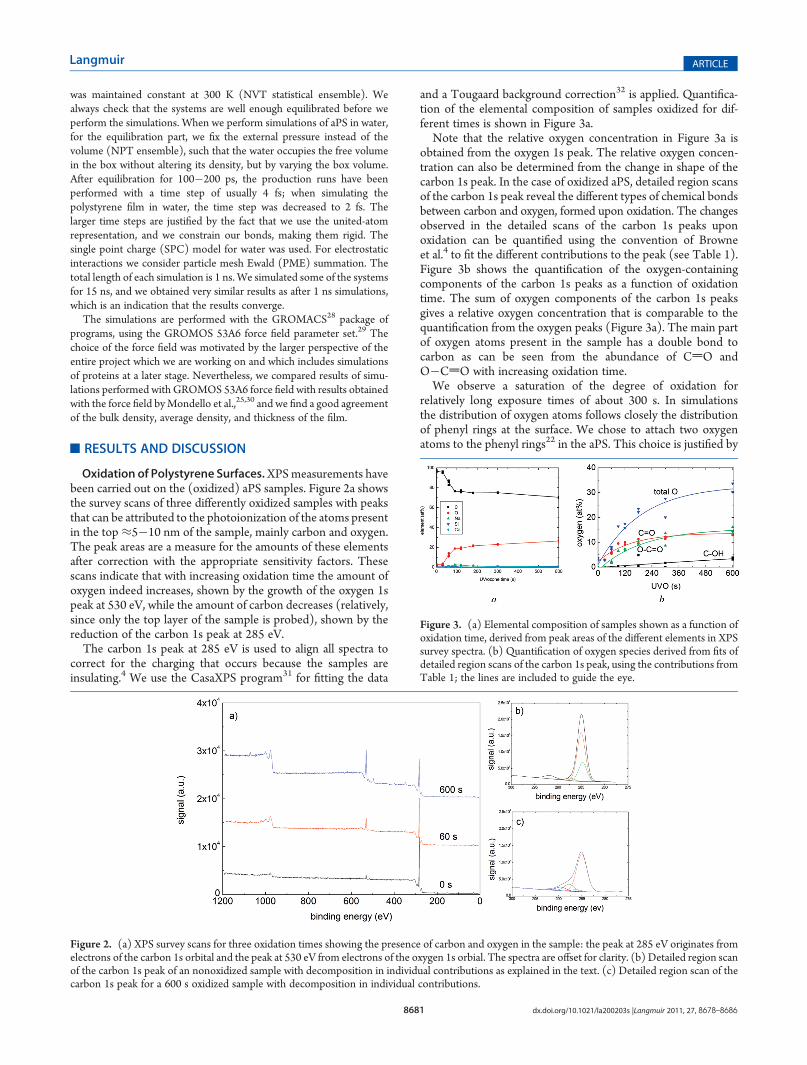
Oxidation of Polystyrene Surfaces.XPSmeasurements havebeen carried out on the (oxidized) aPS samples. Figure 2a showsthe survey scans of three differently oxidized samples with peaksthat can be attributed to the photoionization of the atoms presentin the top≈5�10 nm of the sample, mainly carbon and oxygen.The peak areas are a measure for the amounts of these elementsafter correction with the appropriate sensitivity factors. Thesescans indicate that with increasing oxidation time the amount ofoxygen indeed increases, shown by the growth of the oxygen 1speak at 530 eV, while the amount of carbon decreases (relatively,since only the top layer of the sample is probed), shown by thereduction of the carbon 1s peak at 285 eV.The carbon 1s peak at 285 eV is used to align all spectra to
correct for the charging that occurs because the samples areinsulating.4 We use the CasaXPS program31 for fitting the data
and a Tougaard background correction32 is applied. Quantifica-tion of the elemental composition of samples oxidized for dif-ferent times is shown in Figure 3a.Note that the relative oxygen concentration in Figure 3a is
obtained from the oxygen 1s peak. The relative oxygen concen-tration can also be determined from the change in shape of thecarbon 1s peak. In the case of oxidized aPS, detailed region scansof the carbon 1s peak reveal the different types of chemical bondsbetween carbon and oxygen, formed upon oxidation. The changesobserved in the detailed scans of the carbon 1s peaks uponoxidation can be quantified using the convention of Browneet al.4 to fit the different contributions to the peak (see Table 1).Figure 3b shows the quantification of the oxygen-containingcomponents of the carbon 1s peaks as a function of oxidationtime. The sum of oxygen components of the carbon 1s peaksgives a relative oxygen concentration that is comparable to thequantification from the oxygen peaks (Figure 3a). The main partof oxygen atoms present in the sample has a double bond tocarbon as can be seen from the abundance of CdO andO�CdO with increasing oxidation time.We observe a saturation of the degree of oxidation for
relatively long exposure times of about 300 s. In simulationsthe distribution of oxygen atoms follows closely the distributionof phenyl rings at the surface. We chose to attach two oxygenatoms to the phenyl rings22 in the aPS. This choice is justified by
Figure 2. (a) XPS survey scans for three oxidation times showing the presence of carbon and oxygen in the sample: the peak at 285 eV originates fromelectrons of the carbon 1s orbital and the peak at 530 eV from electrons of the oxygen 1s orbial. The spectra are offset for clarity. (b) Detailed region scanof the carbon 1s peak of an nonoxidized sample with decomposition in individual contributions as explained in the text. (c) Detailed region scan of thecarbon 1s peak for a 600 s oxidized sample with decomposition in individual contributions.
Figure 3. (a) Elemental composition of samples shown as a function ofoxidation time, derived from peak areas of the different elements in XPSsurvey spectra. (b) Quantification of oxygen species derived from fits ofdetailed region scans of the carbon 1s peak, using the contributions fromTable 1; the lines are included to guide the eye.

8682 dx.doi.org/10.1021/la200203s |Langmuir 2011, 27, 8678–8686
Langmuir ARTICLE
the fact that in the fitting of the carbon 1s peak the maincontribution to oxygen containing species comes from CdOgroups and is also in agreement with the results on UVOoxidation by Klein et al.12 The degree of oxidation, defined inthe simulations as the number percentage of oxygen atoms in a1 nm layer at the aPS surface, is chosen in the range of experi-mental values obtained after UVO oxidation of aPS films.Surface Hydrophilicity. The aPS surface with 0% oxygen
content is hydrophobic; the more oxygen the surface contains,the more hydrophilic it becomes. Water contact angle measure-ments are performed on spin-coated aPS samples, before and aftercontrolledUVOoxidation. The results are shown in Figure 4a.Weobserve that the contact angle decreases with increasing oxygencontent. A contact angle of 90� corresponds to a hydrophobicsurface. The smaller the contact angle becomes the more hydro-philic the surface is.A measure of hydrophilicity of a molecule in atomistic MD
calculations is the number of hydrogen bonds formed betweenwater and that molecule. Here we adopt a similar definition forlarger systems, such as the aPS film we study here. Theincrease of the number of hydrogen bonds of water moleculeswith the surface for increasing degree of oxidation is shown inFigure 4b.Both contact angle and number of hydrogen bonds change in a
linear fashion with increasing degree of oxidation. We observeno saturation of the number of hydrogen bonds between thesimulated surface and water molecules up to an oxygen concen-tration of 24% (see Figure 4b) as well as no saturation of contactangle over the entire range of degrees of oxidation (seeFigure 4a). This suggests that the hydrophilicity is primarilydetermined by the degree of oxidation, that is, the number ofpolar groups at the surface of the aPS.
Surface Roughness and Orientation of Chains in aPS Film.When analyzing the surface properties of aPS films, we first haveto define a reference surface. The Gibbs dividing surface(GDS)33,34 is such a mathematical surface used to define a sharpinterface between two phases. We obtain the GDS of the aPS filmby plotting the density profile near the interface and finding theposition on the Z axis for which the area of the dashed regions inFigure 5 taken with opposite signs sums up to zero.The further analysis of the surface properties is based on the
division of the film in layers perpendicular to the Z axis andcalculating their density as a function of the position relativeto the GDS of the film. There are also other methods in theliterature in which the division is made based on single molecularlayers at the surface, such as the identification of the trulyinterfacial molecules (ITIM) analysis.35 This method is particu-larly useful to study the local orientation of molecular segmentsat interface, but since we are interested in statistical propertiesover large areas, we use GDS as a reference.In order to analyze the surface obtained from simulations, we
first divide the XY section of the simulation box in grid elementsof 0.1 nm � 0.1 nm. The surface topography is obtained by
Figure 4. (a)Measured water contact angles onUVOoxidized aPS samples: the at. % oxygen is quantified for different oxidation times using XPS surveyscans and is expressed here as “degree of oxidation”. (b) Simulated number of hydrogen bonds formed between water and aPS films with differentdegrees of oxidation. No saturation of the amount of hydrogen bonds is observed.
Figure 5. Example of density profile of aPS near the interface used forconstruction of GDS.
Table 1. Contributions to the Carbon 1s Peak Used forFitting the XPS Region Scans (See Examples in Figure 2b,c),Based on the Convention of Browne et al.4
energy (eV) species energy (eV) species
285 C�C/C�H 286.4( 0.3 C�OH
284.7 aromatic C 287.6( 0.3 CdO
291.5 ( 0.3 π f π* shakeup (aromatic) 289.9( 0.3 O�CdO

8683 dx.doi.org/10.1021/la200203s |Langmuir 2011, 27, 8678–8686
Langmuir ARTICLE
representing the atoms which have the maximum Z coordinate ineach XY grid element. The surfaces are further analyzed bycalculating their root-mean-square roughness, Rq, defined as
Rq ¼ffiffiffiffiffiffiffiffiffiffiffiffiffiffiffiffiffiffiffiffi1N ∑
N
i¼ 1Δzi2
sð1Þ
where N is the number of surface atoms and Δzi their distancesfrom GDS.The roughness of simulated aPS surfaces in vacuum was
compared with experimental values measured by AFM. The valuesof roughness are of the same order of magnitude, in spite of thedifferences in resolution and size of the probed sample. AFMimages and roughness data of experimentally prepared oxidized aPSsamples are given in the Supporting Information. We chose theresolution for the analysis of the simulated aPS surfaces to be 1 nm,which is equal to the lateral step size in the AFM measurement.The obtained roughness values, Rq, are represented as a
function of degree of oxidation for the simulations in vacuumand in water as shown in Figure 6. In contrast to the roughnesscalculated for a sample in water, a clear trend is observed for theroughness of a sample in vacuumwhich decreases upon increasingoxygen content. The simulation shows that the presence of waterinduces a roughness at the interface that does not depend on thedegree of oxidation. The difference with the roughness of the samefilm in vacuum is most prominent for hydrophobic surfaces.We analyze the aPS surface also in terms of orientation of the
phenyl rings near the interface. In order to do so, we calculate theangle θ between the vector vB associated with the phenyl ring andthe Z direction, i.e., the vector perpendicular to the aPS surfaceplane and pointing out of the aPS bulk (see insert in Figure 7).We compute the orientational order parameter defined as
P2 ¼ 32cos2 θ� 1
2
� �ð2Þ
The surface region was defined in our analysis as being all theatoms with Z > ZGDS� 0.5 nm, where ZGDS is the position of theGDS. The bulk order parameter was calculated for all phenylrings situated in the ≈5 nm thick middle part of the film. Theorder parameters obtained for the surface and the bulk region areplotted in Figure 7 as a function of the aPS film’s degree ofoxidation, in both vacuum and water. The values of the orderparameter in bulk are, as expected, around 0. Nevertheless, thephenyl rings at the film surface have a slight orientation out ofthe surface plane for all the systems in vacuum, as indicated by thepositive value of P2. In case of hydrophobic aPS in water, the
phenyl rings lose this orientation, the order parameter droppingto a value near the bulk order parameter. With increasing oxygencontent the order parameter increases, showing a slight averageorientation of the phenyl rings toward water. The values of theorder parameter remain small because we deal with a highlydisordered system. Nevertheless, since we average over manyconfigurations, the effect is significant.Structure of Water. By analyzing the water structure near the
interface with the simulated polymeric film, we can obtaininformation about the affinity of the water molecules for thepolymer. This information is useful as starting point in discussingthe interaction of a biomolecule (e.g., protein) with the poly-meric surface in a water environment. In the system formed bypolymeric surface, water and protein, the total interaction energyof the surface with the protein is influenced by the balancebetween the energy of interaction between water and protein aswell as between water and polymeric surface.The density profile of the water near the aPS surface
represented as a function of the Z coordinate is pointed outin Figure 8a. We observe that the decay in density is steepernear the hydrophobic, nonoxidized, surface (black dots,Figure 8a) as compared to the decay in the water density nearthe hydrophilic surfaces (depicted with open symbols). Thissuggests the existence of a depletion layer of water in thevicinity of the hydrophobic surface. But in this representation,the density profiles of water near the oxidized aPS overlap. At acloser look, by representing the same density profiles as afunction of the distance from the GDS of the aPS (Figure 8b),we observe that there is a monotonic shift of the water densityprofile in the surface region with increasing the degree ofoxidation. This suggests an attractive force between the surfaceand water which increases with increasing the hydrophilicity ofthe aPS surface. The overlap in Figure 8a can be explained bythe superposition of two opposite effects: the shift of the densityprofile, and hence of the GDS of water, due to the attractionbetween water and hydrophilic aPS (Figure 8a), on one hand,and the shift of the Gibbs dividing surface of the aPS withincreasing the degree of oxidation, due to addition of mass and
Figure 6. Simulated smoothening of the oxidized aPS surfaces. Thedrawn lines are added only as guide to the eye.
Figure 7. Order parameter P2 of phenyl rings at the interface withvacuum and water. The order parameter of phenyl rings in bulk is shownfor comparison. The drawn lines are added only as guide to the eye. Inthe inset the vector associated with the phenyl ring and the angle it formswith the Z direction are depicted.

8684 dx.doi.org/10.1021/la200203s |Langmuir 2011, 27, 8678–8686
Langmuir ARTICLE
hence increasing thickness of aPS films (as shown in Figure 9),on the other hand.To illustrate the net effect of oxidation on thewater�aPS affinity,
the distance between theGDS of water and theGDS of the aPS filmis plotted (Figure 10). This distance decreases with increasing thedegree of oxidation, becoming negative for hydrophilic aPS. Thismeans that at the interface between water and hydrophilic aPS thereis a mixing zone in which water and oxidized aPS coexist. Thismixing zone increases with increasing hydrophilicity.In addition to identifying the mixing zone between the
oxidized aPS and water we also investigated the orientation ofwater molecules near oxidized aPS. As discussed in previousstudies,18�20,36 the water molecules near hydrophobic andhydrophilic surfaces orient in such way that the network ofhydrogen bonds is disturbed minimally. This orientation isquantified and discussed in detail in the case of structurelesswalls.19 The authors conclude that there are two regimes: thesemiwetting regime, in which surface water interactions arestrong and lead to an increase in density and ordering of watermolecules in a plane parallel to the surface, and the nonwettingregime, in which the surface water interactions are weak and thewater�water interactions lead to an interfacial structure of watersimilar to the air�water interface.
In the present study we deal with rough surfaces, thus thequantification of the orientation is more complicated. Theorientation of water molecules is defined by the average angleγ, which is the average angle between the vector associatedwith the dipole moment of water molecules in one layer andthe Z direction, perpendicular to the GDS and pointing out of thebulk aPS. This analysis will provide information about theaverage orientation of water molecules, irrespective of how theyare locally oriented with respect to the local normal to thesurface.Note that in Figure 11 we represent the product between Æcosγæ
and the normalized density profile of the interfacial water as afunction of the distance from the GDS of the aPS film. Thisweighting is necessary in order to account for the low density ofwater near the aPS surface.First of all, we observe an increase in the orientation of the
water molecules near the hydrophobic surface, i.e. 0% oxygen(Figure 11). We also observe an orientation of water moleculesnear the hydrophilic aPS. Following the conclusions by Trudeauet al.,19 we suggest that the maximum orientation for 0% oxygencorresponds to the regime in which the aPS�water interface isdetermined by the water�water interactions, while the
Figure 8. (a) Density profile of water near oxidized aPS film, as a function of Z coordinate. (b) Density profile of water near oxidized aPS film, as afunction of the distance from the GDS of the aPS. The drawn lines are added only as guide to the eye. Different symbols stand for different degrees ofoxidation.
Figure 9. Thickness of aPS films, defined as the difference between theZ coordinates of the upper and lower GDS of the free-standing aPS film,relative to the thickness of the nonoxidized film. The solid line is a linearfit of the calculated values.
Figure 10. Distance between the GDS of aPS film and GDS of water asa function of the degree of oxidation. The drawn lines are added only asguide to the eye.

8685 dx.doi.org/10.1021/la200203s |Langmuir 2011, 27, 8678–8686
Langmuir ARTICLE
maximum orientation for 24% oxygen corresponds to the case inwhich the aPS�water interface is influenced by the surface waterinteractions. It is interesting to note that the ordered layerrepresented by the maximum value of order parameter is alsoshifted toward the aPS�water interface in case of the waternear the hydrophilic surface. This shift is mainly due to theincrease of water density at the interface with increasing surfacehydrophilicity.
’CONCLUSIONS
Polystyrene surfaces with different degrees of oxidation havebeen prepared, both experimentally and computationally, in awell-controlled way. Structureless surfaces and their interactionwith water were intensively studied in the past.18�20,36 To thebest of our knowledge, the results of the present study are thefirst results meant to characterize rough polymeric surfaces inatomistic detail and their interaction with water. The surfacesstudied here represent the solid phase for immunoassays inbiomolecular diagnostics.
The roughness of simulated aPS surfaces in vacuum wascompared with experimental values obtained by AFM. Thevalues of roughness are of the same order of magnitude, in spiteof the differences in resolution and size of the probed sample.Simulations reveal that aPS surfaces become smoother uponwater presence. The smoothening is more pronounced for thehydrophobic surface and decreases with increasing oxygencontent on the surface. The water presence near the hydro-phobic surface suppresses the natural orientation of phenylrings found in case of the aPS surfaces in vacuum. The orienta-tion of the phenyl rings is preserved in case of hydrophilic aPSin water.
The water density decreases near an hydrophobic surface.This result is in good agreement with results of previous studiesof water near polar and nonpolar solid walls.36
The water forms an oriented shell around the aPS which ismore pronounced for the hydrophobic aPS. The shell is alsoshifted away from the hydrophobic surface as compared to theshell around the oxidized aPS. We conclude that the water hasa depletion layer accompanied by a higher ordering of thewater molecules near the hydrophobic surface. We also findthat water next to hydrophilic surfaces is oriented as well, theordered layer being shifted toward the hydrophilic surface.
The ordering of water near the hydrophilic surfaces can beexplained using the semiwetting regime arguments proposedby Trudeau et al.19
’ASSOCIATED CONTENT
bS Supporting Information. Figure S1 and Table S1. Thismaterial is available free of charge via the Internet at http://pubs.acs.org.
’AUTHOR INFORMATION
Corresponding Author*E-mail: [email protected].
’ACKNOWLEDGMENT
This study is a part of a Dutch Polymer Institute researchprogram, project #677. This work was also sponsored by theStichting Nationale Computerfaciliteiten (National ComputingFacilities Foundation, NCF) for the use of supercomputerfacilities, with financial support from the Nederlandse OrganisatievoorWetenschappelijk Onderzok (NetherlandsOrganisation forScientific Research, NWO). We thank Prof. Menno Prins forcritical reading of the manuscript.
’REFERENCES
(1) Darain, F.; Yager, P.; Gan, K. L.; Tjin, S. C. Biosens. Bioelectron.2009, 24, 1744–1750.
(2) Bruls, D. M.; Evers, T. H.; Kahlman, J. A. H.; van Lankvelt,P. J. W.; Ovsyanko, M.; Pelssers, E. G. M.; Schleipen, J. J. H. B.; deTheije, F. K.; Verschuren, C. A.; van der Wijk, T.; van Zon, J. B. A.;Dittmer, W. U.; Immink, A. H. J.; Nieuwenhuis, J. H.; Prins, M.W. J. LabChip 2009, 9, 3504–3510.
(3) Bruce, R. L.; Weilnboeck, F.; Lin, T.; Phaneuf, R. J.; Oehrlein,G. S.; Long, B. K.; Wilson, C. G.; Vegh, J. J.; Nest, D.; Graves, D. B.J. Appl. Phys. 2010, 107, 084310.
(4) Browne, M.; Lubarsky, G.; Davidson, M.; Bradley, R. Surf. Sci.2004, 553, 155–167.
(5) Teare, D. O. H.; Ton-That, C.; Bradley, R. H. Surf. Interface Anal.2000, 29, 276–283.
(6) Zammatteo, N.; Girardeaux, C.; Delforge, D.; Pireaux, J.-J.;Remacle, J. Anal. Biochem. 1996, 236, 85–94.
(7) Grishchenko, A. E.;Mikhailova, N. A.; Kononov, A. I.; Rudakova,T. V.; Mel’nikov, A. B. J. Opt. Technol. 2009, 76, 167–169.
(8) Baljon, A. R. C.; Williams, S.; Balabaev, N. K.; Paans, F.;Hudzinskyy, D.; Lyulin, A. V. J. Polym. Sci., Part B: Polym. Phys. 2010,48, 1160–1167.
(9) Gadelmawla, E. S.; Koura, M. M.; Maksoud, T. M. A.; Elewa,I. M.; Soliman, H. H. J. Mater. Process. Technol. 2002, 123, 133–145.
(10) Latour, R. A. Curr. Opin. Solid State Mater. Sci. 1999, 4, 413–417.(11) Wang, L.; Yan, L.; Zhao, P.; Torimoto, Y.; Sadakata, M.; Li, Q.
Appl. Surf. Sci. 2008, 254, 4191–4200.(12) Klein, R. J.; Fischer, D. A.; Lenhart, J. L. Langmuir 2008, 24,
8187–8197.(13) Rytlewski, P.; Zenkiewicz, M. Appl. Surf. Sci. 2009, 256,
857–861.(14) Scatena, L. F.; Brown, M. G.; Richmond, G. L. Science 2001, 3,
FC23–FC39.(15) Mittal, J.; Hummer, G. Proc. Natl. Acad. Sci. U.S.A. 2008, 105,
20130–20135.(16) Du, H.; Miller, J. D. Int. J. Miner. Process. 2007, 84, 172–184.(17) Lee, C. Y.; McCammon, J. A.; Rossky, P. J. J. Chem. Phys. 1984,
80, 4448–4455.(18) Lee, S. H.; Rossky, P. J. J. Chem. Phys. 1994, 100, 3334–3345.
Figure 11. Ordering of water molecules represented as the cosine ofthe angle between the dipole moment of water molecules and the Z axis,which is perpendicular to the water�aPS interface.

8686 dx.doi.org/10.1021/la200203s |Langmuir 2011, 27, 8678–8686
Langmuir ARTICLE
(19) Trudeau, T. G.; Jena, K. C.; Hore, D. K. J. Phys. Chem. C 2009,113, 20002–20008.(20) Janecek, J.; Netz, R. R. Langmuir 2007, 23, 8417–8429.(21) Sendner, C.; Horinek, D.; Bocquet, L.; Netz, R. R. Langmuir
2009, 25, 10768–10781.(22) R�anby, B.; Lucki, J. Pure Appl. Chem. 1980, 52, 295–303.(23) Veeco, NanoScope Software 6.13 User Guide. https://depts.
washington.edu/ntuf/facility/docs/NanoScope_Software_Guide.pdf, 2004.(24) Zoller, P.; Walsh, D. J. Standard Pressure-Volume-Temperature
Data for Polymers; Technomic: Lancaster, 1995.(25) Hudzinskyy, D.; Lyulin, A. V.; Baljon, A. R. C.; Balabaev, N. K.;
Michels, M. A. J. Macromolecules 2011, 44, 2299–2310.(26) Lyulin, A. V.; Vorselaars, B.; Mazo, M. A.; Balabaev, N. K.;
Michels, M. A. J. Europhys. Lett. 2005, 71, 618.(27) Lyulin, A. V.; Michels, M. A. J. Phys. Rev. Lett. 2007, 99, 085504.(28) van der Spoel, D.; Lindahl, E.; Hess, B.; van Buuren, A. R.; Apol,
E.; Meuelnhoff, P. J.; Tieleman, D. B.; Sijbers, A. L. T. M.; Feenstra,K. A.; vanDrunen, R.; Berendsen, H. J. C. Gromacs UserManual version3.3. www.gromacs.org, 2005.(29) Oostenbrink, C.; Villa, A.; Mark, A. E.; van Gunsteren, W. F.
J. Comput. Chem. 2004, 25, 1656–1676.(30) Mondello, M.; Yang, H.-J.; Furuya, H.; Roe, R.-J. Macromole-
cules 1994, 27, 3566–3574.(31) http://www.casaxps.com/help_manual/.(32) http://www.casaxps.com/help_manual/manual_updates/peak_
fitting_in_xps.pdf.(33) Gibbs, J. W. The Collected Works of J. W. Gibbs; Longmans,
Green: New York, 1931; Vol. I.(34) Adamson, A.W. Physical Chemistry of Surfaces;Wiley-Interscience:
New York, 1990.(35) Darvas, M.; Pojjak, K.; Horvai, G.; Jedlovszky, P. J. Chem. Phys.
2010, 132, 134701.(36) Sedlmeier, F.; Janecek, J.; Sendner, C.; Bockuet, L.; Netz, R. R.;
Horinek, D. Biointerphases 2008, 292, 908–912.