rough draft – version 1 · demsetz and lehn (1985) argue that concentrated investors have...
TRANSCRIPT

FOUNDING FAMILY OWNERSHIP AND FIRM PERFORMANCE
December 6, 2001
Ronald C. Andersona and David M. Reebb
aKogod School of BusinessAmerican University
4400 Massachusetts Ave, NWWashington, DC [email protected]
and
bCorresponding Author:Kogod School of Business
American University4400 Massachusetts Ave, NW
Washington, DC 20016(202) 885-1940
Rough Draft – Version 1
Both Professor Anderson and Professor Reeb would like to acknowledge support they received asKogod Endowed Faculty Fellows, as well as additional support from American University.

1
Founding Family Ownership and Firm Performance
ABSTRACT
We investigate the relation between founding-family ownership and firm performance in large,
publicly traded U.S. firms. We find that family ownership is both prevalent and substantial; families
are present in one-third of the S&P 500 firms and account for over 18% of outstanding equity.
Contrary to our expectations, we find that family firms are more profitable and more valuable than
non-family firms. We also document that the relation between founding-family holdings and firm
performance is nonlinear; performance first increases as the level of family ownership increases but
then decreases with increasing family ownership. Additional analysis reveals that when a family
member serves as the firm’s CEO, firm performance is better than if an outsider is CEO. Overall,
our results are inconsistent with the hypothesis that minority shareholders are adversely affected by
continued founding family ownership and instead they suggest that family ownership represents an
efficient organizational structure.

2
“As the Hewletts, Packards and Fords are demonstrating, founding familiesoften retain a surprising amount of influence on quoted companies”.
The Economist, November 17, 2001
Founding-family ownership and control in public firms is commonly perceived as a less
efficient, or at the very least, a less profitable ownership structure. Fama and Jensen (1985) argue
that combining ownership and control allows concentrated shareholders to exchange profits for
private rents. Demestz (1983) suggests that such owners may choose non-pecuniary consumption
and thereby draw scarce resources away from profitable projects. More generally, firms with large,
undiversified owners such as founding families may forgo maximum profits because they are unable
to separate their financial preferences with those of outside owners. Families also often limit
executive management positions to family members suggesting a restricted labor pool from which to
source qualified and capable talent; potentially leading to competitive disadvantages relative to non-
family firms.1 Overall, anecdotal accounts and prior literature generally suggests that separating
ownership from control, as is implicit in most U.S. corporations, is an organizational form that leads
to superior firm performance (Fama (1980), Fama and Jensen (1983)).
The notion that large, concentrated shareholders are inherently less efficient is not a
universal view. Berle and Means (1932), and Jensen and Meckling (1976) suggest that combining
ownership and control may be advantageous. Specifically, the family’s historical presence, large-
undiversified equity position, and control of management and director posts place them in an
extraordinary position to influence and monitor the firm (Shleifer and Vishny, 1997). Faccio et al
(2001) suggest that family owners often have de facto control of the firm. Beyond monitoring and
control advantages, James (1999) posits that families have longer investment horizons, leading to
greater investment efficiency. If families have advantages in disciplining and monitoring managers,

3
extended investment horizons, and provide specialized knowledge, the question of whether
founding-family presence hinders or facilitates firm performance becomes an empirical issue.
We explore the relation between founding-family ownership and firm performance. Using
accounting and market measures of firm performance, we conduct a time-series cross-sectional
comparison of family and non-family firms. Our analysis also investigates the incremental impact
on firm performance, if any, of placing a family member in the CEO position. Finally, we examine
the impact of other large equity blockholders on firm performance in the presence of family
ownership.
Using the Standard & Poor’s 500 firms from 1992 through 1999, we observe that founding
families are a prevalent and important class of investors in most industry groups. Family firms
constitute over 32% of the S&P 500 Industrials and, on average, families own nearly 18% of their
firms’ outstanding equity. Contrary to the notion that family ownership is detrimental, we find
stronger firm performance in family firms than non-family firms. Controlling for industry and firm
characteristics, our analysis suggests that firms with continued founding-family presence exhibit
significantly better accounting and market performance than non-family firms. We also present
evidence that the relation between founding-family holdings and firm performance is non-
monotonic; performance first increases as family ownership increases but then decreases with
increasing family ownership. At very high family-ownership levels, we find that firm performance is
marginally worse versus non-family firms.
Our investigation also indicates differential performance based on CEO status. Specifically,
we find that family CEOs, founders or founder-descendants, exhibit a positive relation to
accounting profitability measures. Market performance however appears to be better only in the
presence of founder CEOs; founder descendants serving as CEO have no effect on market
1We find that family members serve as CEO in about 43% of the family firms in the S&P 500.

4
performance. Our results for family ownership and family CEOs are statistically and economically
significant and are robust to concerns of non-spherical disturbances, outliers, multi-collinearity,
endogeneity, and alternative measures of the key variables.
The remainder of this paper is organized as follows. Section I reviews the literature and
presents our hypotheses. Sections II and III discuss the data, research design, and presents the
empirical results of our large-sample comparisons of family and non-family firms. Section IV
provides robustness tests and section V concludes the paper.
I. Founding Family Ownership and Firm Performance
Demsetz and Lehn (1985) note that U.S. public corporations typically feature a separation of
ownership and control where professional managers rather than fragmented shareholders control
important business decisions. Yet, Shleifer and Vishny (1986) document that large shareholders are
common and in particular, note that founding families continue to hold equity stakes and board
seats in nearly 33% of the Fortune 500 firms. These founding families represent a unique class of
investors in that they hold poorly diversified portfolios, are long-term investors (multiple
generations), and often control senior management positions.2 As such, families are in an
uncommon position to exert influence and control over the firm, potentially leading to performance
differences with non-family firms.
A. The Costs of Family Ownership
With substantial ownership of cash flow rights, founding families have the incentives and
power to take actions that benefit themselves at the expense of firm performance. For instance,
Fama and Jensen (1985) posit that large undiversifed shareholders employ different investment

5
decision rules than atomistic shareholders. Diversified shareholders are presumed to evaluate
investment decisions using market value rules that maximizes the value of firm’s residual cash flow.
Large concentrated shareholders however, may no longer receive maximum utility from enhancing
firm value but rather garner greater benefits from pursuing objectives such as firm growth,
technological innovation, or firm survival.
Further, because firm survival is potentially of great importance to families, Shliefer and
Vishny (1997) and Maug (1998) indicate that family owners are likely to seek avenues that minimize
firm risk. Families for example may have strong incentives to undertake low risk investments, seek
non-value enhancing corporate diversification, or use capital forms that reduce the probability of
firm default.
Barclay and Holderness (1989) note that large ownership stakes also reduces the probability
of bidding by other agents, thereby reducing the value of the firm. Furthermore, the family’s role in
selecting managers and directors potentially creates further impediments for third parties in
capturing control of the firm, suggesting greater managerial entrenchment and lower firm values
relative to non-family firms. In fact, Shliefer and Vishny (1997) suggest that one of the greatest
costs that large shareholders can impose is by remaining active in management even if they are no
longer competent or qualified to run the firm.
Families are also in a unique position to expropriate wealth directly from the firm through
excessive compensation, related-party transactions, or special dividends. For instance, a recent
recapitalization plan at Ford Motor increased the family’s voting power without providing
compensation to the firm’s other shareholders; leading to widespread criticism that the board’s plan
benefited the family at the expense of other claimants.
2We find that families that appear in both Forbes’ Wealthiest Americans Survey and the S&P 500 have over69% of their wealth invested in their firms.

6
In general, Demsetz (1983), and Demsetz and Lehn (1985) suggest that large shareholders
such as founding families will ensure that management – either through themselves or through
professional managers – serves family interests.3 While families may pursue actions that maximize
their personal utility, many of these same actions potentially lead to sub-optimal policies resulting in
poor firm performance relative to non-family firms.4
B. The Benefits of Family Ownership
Although prior literature suggests that family ownership leads to poor firm performance (e.g.
Faccio, et al., 2001), others posit that family influence is beneficial. Demsetz and Lehn (1985) argue
that concentrated investors have substantial economic incentives to diminish agency conflicts and
maximize firm value. Specifically, because the family’s wealth is so closely linked to firm welfare,
families may have strong incentives to monitor managers and minimize the free-rider problem
inherent with small, atomistic shareholders. Grossman and Hart (1980) and Shleifer and Vishny
(1997) support this notion by showing how firms with large incumbent shareholders could be more
valuable than firms with small, diversified shareholders because of the large owner’s incentive to
monitor and discipline control agents.
Founding families also often maintain a long-term presence in their firms. The DuPont
family for instance has held a substantial equity stake (at least 15%) for over 200 years in the firm
bearing their name. As such, families potentially have longer horizons than other shareholders,
suggesting a willingness to invest in long-term projects relative to shorter managerial horizons.
James (1999) supports this notion by showing in a two-period model that family ownership provides
3Demsetz and Lehn (1985) describe particular instances (e.g. Disney ) where families have derived non-pecuniary benefits by influencing firm policies in ways that were not profit maximizing but provided for theirown utility. 4Bebchuck (1994) observes that concentrated owners negatively affect the value of the firm when theymisapply their control position.
7
incentives to invest according to the market rule (i.e. positive NPV projects). Specifically, his model
suggests that family firms invest more efficiently than non-family firms because the family intends to
pass the firm onto succeeding generations. Following Becker (1974, 1981), Casson (1999) and
Chami (1999) also concur with James by positing that founding families view their firms as an asset
to pass on to their descendants rather than wealth to consume during their lifetimes. Firm survival
is thus an important concern for families suggesting they are potentially long-term value
maximization advocates.
Founding families also face reputation concerns arising from the family’s sustained presence
in the firm and its effect on third parties.5 The long-term nature of founding family ownership
suggests that external bodies, such as suppliers or providers of capital, are more likely to deal with
the same governing bodies and practices for longer periods in family firms than in non-family firms.
Thus, the family’s reputation is more likely to create longer-lasting economic consequences for the
firm relative to non-family firms where managers and directors turnover on a relatively continual
basis.
In summary, large investors have substantial economic incentives to maximize firm
performance and the influence and power to cause it to happen. If founding families provide
competitive advantages to the firm, we expect to observe better firm performance in family firms
versus non-family firms.
C. Control of Management Positions by the Founding Family
A common characteristic of family firms is that a family members often serve as the firm’s
CEO or fill other top management positions (e.g. Wm. C. Ford at Ford Motor). Family CEOs raise
5Fama (1980), Holmstrom (1982), and Gibbons and Murphy (1992) show that career concerns are importantelements of managers’ total incentives.
8
two particular concerns. First, families can more readily align the firm’s interests with those of the
family, suggesting that the effects of family ownership on firm performance are potentially
magnified in the presence of a family CEO. Demsetz and Lehn (1985) argue that families are more
likely to supply top managers when they can better meet their consumption goals through the firm
rather than through their wealth.
Second, family members potentially place one of their own members in the CEO position at
the cost of excluding more capable and talented outside, professional managers. For example, Wang
Laboratories, once a highly profitable and viable business while under the control of the firm’s
founder, suffered severely under the founder’s son. Prior research on small private firms suggests
that founder’s exhibiting a bias towards other family members entering the business, results in
suboptimal investments and lower profitability (Singell and Thornton, 1997). Gomez-Mejia, et al.
(2001) extend this argument and suggest that family CEOs are potentially less accountable to
shareholders and directors than outside, professional managers. Schulze, et al. (1999) note that
placing family members as CEO can lead to resentment on the part of senior non-family executives
because tenure, merit, and talent are not necessarily requisite skills for top management positions.6
Although restricting executive talent to a labor pool of family members can be problematic,
a family CEO can bring special skills and attributes to the firm that outside managers do not
possess. Morck, Shleifer, and Vishny (1988) suggest that founder CEOs as entrepreneurs, bring
innovative and value-enhancing expertise to the firm. Moreover, Davis et al (1997) argue that family
members act as stewards and, as such, identify strongly with the firm and view firm performance as
an extension of their own well-being. Anderson, Mansi, and Reeb (2001) suggest that the family’s
6Johnson et al (1985) and Morck, Shleifer, and Vishny (1988) suggest that founder CEOs are associated withstrong performance early in their careers, poorer performance in later years, and that family member CEOsaremore entrenched in their positions.

9
sustained presence in the firm also creates powerful reputation effects that provide incentives for
family managers to improve firm performance.
D. Research Focus
Our central question is the relation between family ownership and firm performance. The
differing financial preferences of family and minority shareholders, the potential for non-pecuniary
benefits for family members, and the restricted tradability of their claims suggest that family
ownership represents a less efficient organizational form. Yet, arguments of extended horizons,
family loyalty, and concerns over reputation suggest families hold strong incentives to ensure firm
profitability. Ultimately, the family’s influence on firm performance is an empirical issue that we
investigate in this study. We address three basic issues. First, are family firms less profitable or less
valuable than non-family firms? Second, if founding family ownership influences performance, is
the performance/ownership relation linear over all ranges of family holdings? Third, does the level
of family involvement or family members acting as CEO negatively impact firm performance? Our
investigation provides a comprehensive analysis of these questions, using firm-level data on large
publicly traded US firms.
II. Sampling and Data Collection
A. The Sample
For our investigation of family influence on firm performance, we use the Standard & Poors
500 firms as of December 31st, 1992 as our sample.7 Consistent with Friend and Lang (1988), we
exclude banks and public utilities from the sample. Our primary reasons for eliminating these firms
7We place no constraints on our firms other than they are members of the 1992 S&P 500. At the beginningof sample (January 1993), we have 403 firms. At the end of the sample period (December, 1999), we have329 firms or a 19% drop out rate.

10
is due to the difficulty in calculating Tobin’s Q for banks and because government regulation may
effect the way that families retain their ties with the firm. We collect data on board structure, CEO
characteristics, independent blockholdings, family attributes, and firm characteristics from 1992
through 1999 on 403 non-utility/non-banking firms yielding 2,723 firm-years or observations.
From table 1, our analysis suggests that family firms are present in 72% of the SIC codes in
the S&P 500, indicating that families operate in a board array of industries. We note however, that
family firms appear to be the prevalent organizational forms in lumber and wood products (24),
printing and publishing (27), rubber and miscellaneous plastic materials (30), electric, gas and
sanitary services (49), food stores (54), apparel and accessory stores (56), eating and drinking places
(58), miscellaneous retail (59), and business services (73).8 This suggests the importance of
controlling for industry affiliation in our empirical analysis.
B. Ownership Structure
Family Ownership
In our data collection efforts, one of our primary concerns is the determination of family
firms. Prior research provides little guidance on how to ascertain family firms. As such, we use the
fractional equity ownership of the founding family and/or the presence of family members on the
board of directors to identify family firms. For some of our younger firms, this determination is
straightforward since the proxy statement denotes the founder, his/her immediate family members,
and their holdings. However, several generations after the founder, the family expands to include
distant relatives such as second or third cousins whose last names may no longer be the same. We
8This examination is based on industries with 5 or more firms and where family firms are at least 50% of thefirms in the industry.

11
resolve descendant issues by examining corporate histories for each firm in our sample. Histories
are from Gale Business Resources, Hoovers, and from individual companies.
While the fractional holdings of family members provides a measure of control similar to
other ownership studies, it may understate (overstate) the influence that family members exert on
the firm. For instance, the Ablon family is viewed as controlling the Ogden Corporation as if they
were the majority owners but they hold roughly 2% of the outstanding shares, while at Nordstrom’s
the family has retained 24% of the shares in order to maintain control. To address this uncertainity,
we create a dummy variable that equals 1 when founding families hold shares in the firm or when
founding family members are present on the board of directors. It is our belief that we have
captured all family firms and their equity holdings. Yet, to the extent that we may have excluded
firms with a family designation or their shareholdings, this should bias our results towards zero and
make family influence more difficult to detect in our analysis.9
C. Governance Characteristics
Prior research suggests that corporate governance mechanisms influence firm performance.
We therefore include various measures of governance in our analysis. We use annual corporate
proxy statements to collect data on the size and composition of the board of directors.
Composition is established using a director classification scheme similar to the categorization in
Brickley, Coles, and Terry (1994). Directors currently employed by the firm or retired and their
9Our estimates of the fractional holdings of families are possibly biased downwards due to reportingrequirements. For instance, two great grandchildren of Schlumberger Limited’s founder serve on the currentboard of directors. From 1992 to 1997, the aggregate ownership reported in the proxy statement of thesetwo directors is 1.3%. However, in 1998, their aggregate holdings increase to 5% because their mother passesaway and they inherit an additional 25 million shares that were not previously reported in the proxystatement. The Securities Exchange Act of 1934 only requires that officers and directors, and 5% ownersreport their holdings. Thus, several family members could hold 4.9% of the firm, not serve as an officer ordirector, and we would not capture this as family ownership. This suggests the use of a binary indicatorvariable to denote family firms.

12
immediate families are identified as insiders. Outside directors are identified as members whose only
affiliation with the firm is their directorship. Affiliated or gray directors are those board members
with existing or potential business ties to the firm. We collect board information for every other year
of our sample period; 1993, 1995, 1997, and 1999.
We also incorporate a CEO compensation measure into the analysis because of the relation
between executive pay and firm performance. Our measure, pay mix, is defined as equity based pay
(new options) divided by the sum of equity based pay, salary and annual bonus. Compensation data
comes from S&P’s CompuExec.
Other large shareholders such as mutual or pension funds may also play a significant role in
monitoring and disciplining managers. As such, the family’s voice and control in the firm may be
substantially smaller in the presence of outside blockholders. From corporate proxy statements, we
identify all blockholders with at least a 5% equity stake in the firm. Blockholders are defined as
affiliated or unaffiliated where an unaffiliated blockholder is defined as an entity with no relation
with the firm other than their equity holdings. We develop a ratio to proxy for the family’s influence
in the firm relative to outside blockholdings; family holdings divided by outside blockholdings.
D. Performance Measures
Tobin’s Q and return on assets (ROA) are our primary performance measures. We follow
Perfect and Wiles (1994) and Yermack (1996), and estimate Tobin’s Q (Q) as the market value of
total assets divided by the replacement cost of assets. We estimate the replacement cost of assets
using Yermack’s (1996) algorithm. Return on assets (ROA) is computed in two ways. In one
approach, we use net income scaled by the book value of total assets. In the second approach, we
use earnings before interest, tax, depreciation and amortization (EBITDA) divided by the book
value of total assets.

13
E. Control Variables
We introduce several control variables into our regression analysis to control for industry,
and firm characteristics. Casson (2001) suggests that the characteristics of family firms could be
different from non-family firms (e.g. smaller). Firm-specific control variables are calculated with
data drawn from the Compustat Industrial Files. Firm size is the natural log of the book value of
total assets. Growth opportunities are proxied by ratio of research and development expenses to
total sales. Firm risk is the standard deviation of monthly stock returns for the prior 60 months.
We control for debt in the capital structure by dividing long-term debt by total assets.
III. Summary Statistics
Table II presents descriptive statistics for our sample of firms. The table provides means for
the entire (pooled) sample, family firms, and non-family firms. The last column of the table
provides t-statistics for difference in means tests between family and non-family firms. Family
firms represent 32.5% (882 observations) of our sample. We adjust the t-statistics for serial
correlation because the variables are unlikely to be independent from year-to-year.
Rows 3, 4, and 5 provide information on the frequency of family CEOs. We find that
among family firms that 45.7% of the CEOs are family members and 54.3% are outsiders, that is,
“hired-hands”. Of the 45.7% family CEOs, we note 14.9% are founders and 30.80% are founder
descendants. Row 9 shows that family firms, on average, are 37.1% smaller than nonfamily firms but
still of substantial size with mean total assets of $9.314billion. Family firms also appear to use
slightly less debt; their long-term debt ratio is 18.1% versus 19.0% for non-family firms.
Rows 11 through 15 present accounting and market performance for our firms. With
respect to accounting performance, we find little difference in the univariate analysis between family
and nonfamily firms with the exception of ROA (using net income as the numerator). ROA

14
indicates that family firms are stronger performers than non-family firms. Market performance,
Tobin’s Q, also suggests that market participants place a significantly greater value on family firms
(1.582) versus nonfamily firms (1.332), t=6.76.
Corporate governance characteristics are shown in rows 16, 17, and 18 indicating systematic
differences between family and non-family firms. Outside directors for instance, hold less than a
majority of board seats in family firms (43.7%) whereas the boards of non-family firms have a
substantial majority of independent directors (60.7%). In addition, we also note that CEOs in family
firms earn nearly 7% less of their total pay in equity-based forms compared to CEOs in non-family
firms. If families seek to entrench themselves and extract private rents from the firm, the lack of
strong external monitors and discipline agents potentially permits them to pursue this path. Because
of observable firm and industry characteristics that potentially affect firm performance, we examine
the individual control mechanisms in the following section using multivariate analysis.
IV. Family Ownership and Firm Performance
Our main interest is the relation between founding family ownership and firm performance.
The analysis also incorporates variables that identify CEOs as firm founders or descendants of the
firm’s founder. We use a two-way fixed effects model for our regression analysis: the fixed effects
are dummy variables for each year of the sample and dummy variables for each 2-digit SIC code.
The regression equation we employ for our multivariate analysis takes the form:
Firm Performance = δ0 + δ1(Family Firm) + δ2(CEO Founder) + δ3(CEO Descendant of Founder) +
δ4(Control Variables) + δ1-54(2 Digit SIC Code) + δ93-99(Year Dummy Variables) + ε (1)
where;
Firm Performance = ROA based on EBITDA and net income, and Tobin’s Q.

15
Family Firm = binary variable that equals 1 when the founding family is present in the firm and 0 otherwise.
CEO Founder = 1.0 if the CEO is founder of the firm and zero otherwise.CEO Descendant of Founder = 1.0 if the CEO is a descendant of the firm’s founder and zero
otherwise.Control Variables = natural log of total assets, research and development expenses divided by
total sales, long-term debt divided by total assets, stock return volatility, equity holdings of officers and directors less family holdings, fraction of independent directors, fraction of equity based pay.
2-Digit SIC Code = 1.0 for each different 2-digit SIC code in our sample.Year Dummy Variables = 1.0 for each year of our sample period.
Our data spans from 1992 through 1999 and covers 403 firms. Because our observations are
unlikely to be independent from year-to-year, we control for serial correlation using the
Huber/White/sandwich estimator for variance.
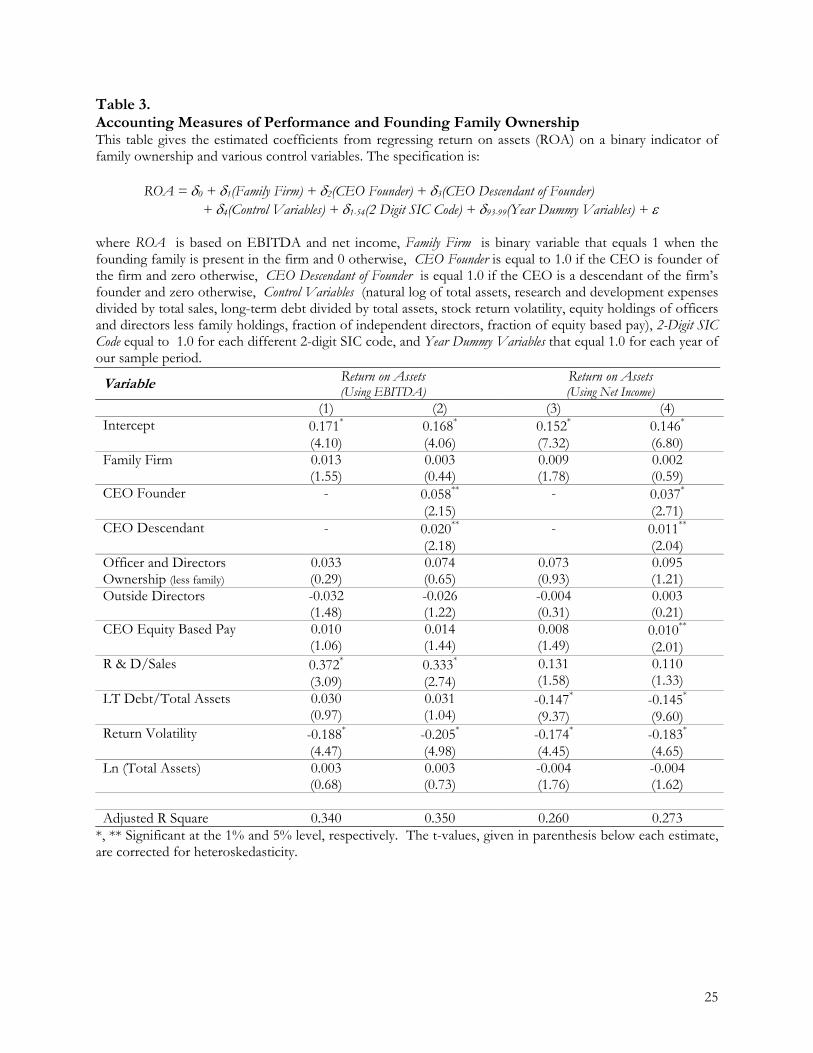
Table 3 presents results using accounting performance measures. In columns 1 and 2, we
use return on assets (ROA) calculated with earnings before interest, tax, depreciation, and
amortization (EBITDA). Columns 3 and 4 show ROA using net income as the numerator.
Columns 2, and 4 include binary variables to denote founder CEOs and founder-descendant CEOs.
Contrary to our primary hypothesis, we find no evidence that firm performance is inferior in
family firms versus non-family firms. The family-firm binary coefficients in the regressions in table
3 suggest that ROA (columns 1 and 3) is better in family firms compared to non-family firms.
However, the t-statistics indicate that the significance levels are only marginal at the 15% level10.
The inclusion of family-CEO variables suggests that the improved performance differentials
we observe in family firms is primary driven by having founder and founder descendants serving as
the firm’s CEO. The firm’s ROA is better by 3.7% and 1.1%, respectively, when the firm’s founder
or a descendant of the founder serves as CEO.
10We also repeat the analysis using return on equity (ROE) as the performance measure. Consistent with theROA results we find no evidence that the family firms perform worse than non-family firms.
16
Table 4 examines market, rather than accounting, performance for family and non-family
firms. Using the same regression specification and using an approximation of Tobin’s Q for the
dependent variable, we find evidence that the market places greater value on family firms than non-
family firms. Tobin’s Q for family firms is 11.6% larger compared to non-family firms.11 After
including the family-CEO variables, we still find that family firms have superior market valuations
versus non-family firms. The prior analysis with accounting measures suggests that both founder
CEOs and founder-descendant CEOs are associated with better firm performance. With Tobin’s Q
however, we find that the market only places greater valuations on founder CEOs; the coefficient on
founder-descendant CEOs is insignificant.
V. Non- Linearities between Firm Performance and Founding Family Ownership
The results from the prior section suggest that founding-family presence exhibits a positive
association with accounting and market performance. In this section, we examine the possibility of
non-linearities between firm performance and family ownership. Previous research suggests that the
relation between equity ownership structure and firm performance may be non-linear if the incentive
structure of the equity claimant changes as holdings increase (e.g. Morck, Shliefer, and Vishny.
1988). We modify our regression specification by including family ownership and the square of
family ownership, as continuous variables.12 The results are in table 5 with columns 1 and 2 using
accounting measures, while column 3 uses market performance or Tobin’s Q.
The results indicate that the relationship between firm performance and founding family
ownership is non-linear. Beginning with ROA using EBITDA (net income), column 1 (2) suggests
11We calculate this as the coefficient estimate of family firms (0.164) divided by the average Tobin’s Q for thesample (1.415).12Himmelberg, Hubbard, and Palia (1999) and McConnell and Servaes (1990) also use ownership and squareof ownership to capture non-linearities. In their models however, they examine managerial holdings ratherthan family ownership.

17
firm performance increases with increasing family ownership up to 30.9% (33.1%) of outstanding
equity held by the family. After reaching a maximum performance level at 30.9% family ownership,
we find additional equity holdings by the family are associated with declining firm performance.
Using Tobin’s Q (column 3) we find a similar relation with an inflection point or maximum
performance at 33.2% family ownership13.
Overall, our analysis suggests that the relation between founding family holdings is not
uniform over the entire range of family ownership; firm performance first increases as family
ownership increases but then decreases with increasing family ownership.
VI. On the Endogeneity of Family Ownership and Firm Performance
As in most empirical work, our analysis suffers from a potential endogeneity problem. For
our purpose, the issue is whether family ownership improves performance or strong performance
prompts families to maintain their holdings. Families, because of their large equity stakes and
frequent control of senior managerial positions, arguably have information advantages over the
firm’s other shareholders. As such, families can more readily ascertain the firm’s future prospects
suggesting they retain ties to only those businesses with favorable outlooks.
While founding families may have superior information, the argument for greater
performance causing family holdings is troublesome for two reasons. First, families have held their
stakes on average for 75.9 years, suggesting exceptional foresight by the family in predicting
performance. Second, it implies that families, as investors, have special insights (beyond those held
by other large shareholders such as institutional investors) in ascertaining future firm performance.
However, to the extent that family ownership is potentially a function of superior firm performance,
13Including family CEO variables, we also find a statistically significant, curvilinear relation between familyholdings and Tobin’s Q (inflection point is at 34.0%).

18
we follow Himmelberg, Hubbard, and Palia (1999) and use instrumental variable regressions to
estimate the relation between family ownership and firm performance. Demsetz and Lehn (1985)
suggest that ownership is a function of firm size and risk. Accordingly, we model family ownership
using the natural log of total assets, the square of the natural log of total assets, and monthly stock
return volatility as our instruments.
Table 6 presents instrumental variable, two-stage least squares (IV-2SLS) estimates using the
Himmelberg et al regression equation. We follow their model using the same variables, for our
sample, to provide consistency and comparison to prior empirical work. Columns 1 and 2 use
accounting measures of performance and column 3 uses our market performance metric. Overall,
our estimates from the IV-2SLS regressions are consistent with our prior OLS results, suggesting
that family firms are superior performers relative to non-family firms. The coefficients on the family
firm variable are significant and positive using accounting or market performance measures.
VII. Robustness of Model Specifications
An assumption of our analysis is that the specifications and proxies adequately capture the
appropriate attributes. We find that our results are also robust to various alternative specifications.
First, we use an alternative approach to investigate non-linearities in family ownership and
firm performance. Specifically, we explore a piece-wise linear regression model with breakpoints
estimate using switching point regressions. We explore both two-piece and three-piece models and
estimate the breakpoints by choosing the models that minimizes the unexplained variance of the
regression. We find evidence supporting both two and three piece models. Regardless of the
specification chosen, we find that families firms perform at least as well as non-family firms.
Specifically, we find that performance is first increasing and then decreasing family ownership.

19
To test the sensitivity of our results in the presence of outliers and influential observations,
we eliminate observations that the R-Student and the DFFITS statistics indicates as influential.
These tests examine a sample to determine if any observations have a dramatic effect on the fitted
least-squares funciton. The results are similar to those reported in the tables and do not change
substantively when truncated for outliers at the largest one, three , or five percent levels for each tail
of the distribution for the model variables. Further, because firm-year observations may intensify
the outlier bias, we repeated the analysis using pooled regressions which also leads to similar results.
VIII. Summary and Conclusion
Our large-sample, cross-sectional analysis indicates that family firms perform at least as well
non-family firms. Using profitability based measures of firm performance (ROA) we find that family
firms are significantly more profitable than non-family firms. This result is surprisingly robust to the
measurement of ROA and is inconsistent with the hypothesis that family ownership is inherently
less efficient. Further testing suggests this greater profitability in family firms, relative to non-family,
stems from those firms in which a family member serves as the CEO. One interpretation is that the
family understands the business and that involved family members view themselves as the stewards
of the firm.
Using market based measures of firm performance provides additional evidence that family
firms are at least as valuable as non-family firms. Specifically, we document that family firms have
higher Tobin’s Q values than non-family firms in both the univariate and multivariate testing. These
results are both statistically and economically significant, with family firms enjoying about an 11.6%
greater Tobin’s Q, relative to non-family firms14. Focusing on the impact of family members as
14This is computed by dividing the coefficient estimate for the binary family firm indicator variable by theaverage Q value in the sample.
20
CEO, indicates that founder CEO’s are associated with the greatest value gains, but that even in
families with hired hands or descendent family members as CEO, the firm is still more valuable.
The analysis also shows that the relation between family ownership in large public firms and
firm performance is not uniform across all levels of family ownership. Specifically, we find that
performance is first increasing and then decreasing in ownership (using both accounting and market
based measures). This suggests that large family holdings potentially lead to wealth expropriation
from minority shareholders or that families are better able to entrench themselves at the expense of
other claimants.
Taken as a whole, our evidence implies that family firms perform as well as, if not better
than non-family firms. Yet, Faccio, et al. (2001) suggest that family ownership in East Asia leads to
severe conflicts with other claimants and hampers firm performance. Perhaps differences in the
rules governing the treatment of minority shareholders, the greater disclosure of firm data in the US,
the prevalence of cross-shareholding networks outside the US, or the influence of other influential
claimants explains these differing inferences about family ownership and control in the US and Asia.
At a minimum, however, our results imply that continued founding family ownership, in and of
itself is not necessarily a less efficient organizational structure. Instead, it may be that the ability of
outsiders to monitor firm activity is an important attribute in minimizing family manipulations.
21
References
Becker, G., 1974, A Theory of Social Interactions, Journal of Political Economy, Nov./Dec., 1063-1093.
Becker, G., 1981, A Treatise on the Family, 2nd Edition, Cambridge, MA, Harvard University Press.
Beim, D., 1992, Estimating bond liquidity. Working Paper, Columbia University.
Berle, A. and G. Means, 1932, The Modern Corporation and Private Property. New York, MacMillon.
Casson, M., 1999, The Economics of the Family Firm, Scandinavian Economic History Review 47,10-23.
Chami, R., 1999, What’s different about family business?, Working Paper, University of Notre Dameand the International Monetary Fund.
Demsetz, H., and K. Lehn, 1985, The structure of corporate ownership: Causes and Consequences,Journal of Political Economy 93, 1155-1177.
Duffie, G., 1998, The Relationship between Treasury Yields and Corporate Bond Yield Spreads,Journal of Finance, 103, 2225-2241.
Elton, E. and M. Gruber, 1995, Modern Portfolio Theory and Investment Analysis, New York, JohnWiley & Sons.
Fama, E., M. Miller, 1972, The Theory of Finance, Hinsdale, IL, Dryden Press
Filatotchev, I., T. Mickiewicz, 2001, Ownership Concentration, “Private Benefits of Control”, andDebt Financing, working paper, University of London and University College London
Gersick, K., J. Davis, M. Hampton and I. Lansberg, 1997, Generation to generation: Life cycles ofthe family business, Boston: Harvard Business School Press.
Gibbons, R., and K. Murphy, 1992, Optimal incentive contracts in the presence of career concerns:Theory and evidence, Journal of Political Economy 100, 468-501.
Gomez-Mejia,L. M. Nunez-Nickel, and I. Gutierrez, 2001, The role of family ties in agencycontracts, Academy of Management Journal 44, 81-95.
Green, R., and B. Odegaard, 1997, Are there tax effects in the relative pricing of U.S. governmentbonds, Journal of Finance 52, 609-633.
Himmelberg, C., R. Hubbard, and D. Palia, 1999, Understanding the determinants of managerialownership, Journal of Financial Economics, 53: 353-384.
Holmstrom, B., and R. Costa, 1986, Managerial incentives and capital management, QuarterlyJournal of Economics 101, 835-861.
22
Jensen M. and W. Meckling, 1976, Theory of the firm: Managerial behavior, agency costs andownership structure, Journal of Financial Economics 3, 305-360.
Johnson, B., R. Magee, N. Nagarajan, and H. Newman, 1985, An analysis of the stock price reactionto sudden executive deaths: Implications for the management labor market, Journal ofAccounting and Economics 7, 151-174.
Jewel, J. and M. Livingston, 1998, Split ratings, bond yields, and underwriter spreads, Journal ofFinancial Research 21, 185-204.
McConnell, J. and H. Servaes, 1990, Additional evidence on equity ownership structure, and firmperformance, Journal of Financial Economics, 27, 595-612
Morck, R., A. Shleifer, and R. Vishney, 1988, Management ownership and market valuation: Anempirical analysis, Journal of Financial Economics 20, 293-315.
Myers, S., 1977, Determinants of corporate borrowing, Journal of Financial Economics 5, 146-75.
Mueller, H. and R. Inderst, 2001, Ownership concentration, monitoring, and the agency cost ofdebt, Working Paper, University of Mannheim.
Nelson C. and A. Siegel, 1987, Parsimonious Modeling of Yield Curves, Journal of Business 6, 473-489.
Neter, J., M. Kutner, C. Nachtsheim, and W. Wasserman, 1996, Applied Linear Regression Models.Irwin-McGraw Hill Publishing.
Reeb, D., S. Mansi, and J. Allee, 2001, Firm internationalization and the cost of debt financing:Evidence from non-provisional publicly traded debt, Journal of Financial and QuantitativeAnalysis 36, 395-414.
Shleifer, A. and R. Vishny, 1997, A Survey of Corporate Governance, Journal of Finance 52, 737-783
Tufano, P., 1996, Who manages risk? An empirical examination of risk management practices in thegold mining industry, Journal of Finance 51, 1097-1137.
White, H., 1980, A heteroskedasticity-consistent covariance matrix estimator and a direct test forheteroskedasticity, Econometrica 48, 817-838.

23
Table 1Number and Percent of Family and Non-family Firms by 2 Digits SIC CodeNumber and percent of firms by two-digit standard industry classification code. Non-family refers to thosefirms without family ownership or family presence on the board of directors.
SIC Industry Description
Non-Family Firms
FamilyFirms
Percent FamilyFirms
in Industry10 Metal, mining 4 0 0.013 Oil and gas extraction 8 2 25.015 General building contractors 1 1 50.016 Heavy construction, except buildings 2 0 0.020 Food and kindred products 11 8 42.121 Tobacco Products 1 0 0.022 Textile mill products 0 2 100.023 Apparel and other textile products 2 2 50.024 Lumber and wood products 1 4 80.025 Furniture and fixtures 1 2 66.726 Paper and allied products 9 6 40.027 Printing and publishing 4 10 71.428 Chemical and allied products 28 10 26.329 Petroleum and coal products 8 2 20.030 Rubber and misc. plastic products 3 3 50.031 Leather and leather products 2 0 0.032 Stone, clay, & glass products 1 0 0.033 Primary metal industries 9 5 35.734 Fabricated metal products 9 3 25.035 Industrial machinery and equipment 18 10 35.736 Electronic and other electrical equip 17 5 21.737 Transportation equipment 14 5 26.338 Instruments and related products 14 3 17.739 Miscellaneous manufacturing prods. 3 1 25.040 Railroad Transportation 5 0 0.042 Trucking and warehousing 0 1 100.045 Transportation by air 5 1 16.748 Communications 5 4 44.449 Electric, gas & sanitary services 3 3 50.050 Wholesale trade - durable goods 4 1 20.051 Wholesale trade - nondurable goods 7 0 0.052 Building materials and gardening 1 1 50.053 General merchandise stores 5 3 37.554 Food stores 1 5 83.355 Auto dealers and service stations 0 1 100.056 Apparel and accessory stores 2 5 71.457 Furniture and home finishings 2 0 0.058 Eating and drinking places 2 3 60.059 Miscellaneous retail 2 4 66.761 Non-depository institutions 4 0 0.062 Security and commodity brokers 2 0 0.063 Insurance carriers 12 4 25.064 Insurance agents, brokers, services 2 0 0.070 Hotels and other lodging places 1 2 66.772 Personal services 0 2 100.073 Business services 7 8 53.375 Auto repair, services and parking 1 0 0.078 Motion pictures 0 2 100.079 Amusement and recreation services 2 0 0.080 Health services 2 1 33.387 Engineering and management serv. 2 0 0.0

24
Table 2 Summary StatisticsThis table provides summary statistics for the data employed in our analysis. The data set is comprised of2,723 firm-year observations from 1992-1999 for S&P 500 firms.
Pooled FamilyFirms
Non-FamilyFirms
t-statistic
1 Observations 2,715 882 1,8332 Family Ownership (%) 5.96 18.26 0.00 40.0*3 Founder CEOs (%) 5.16 14.85 0.00 16.6*4 Descendant CEOs (%) 11.34 30.84 0.00 24.6*5 Outside CEOs (%) 83.50 54.31 100.0 33.9*
6 R & D/Sales (%) 2.11 2.05 2.14 0.607 LT Debt/Total Assets (%) 19.01 18.15 19.44 2.24**8 Return Volatility 0.279 0.283 0.277 1.509 Ln (Total Assets) ($000,000) 12,987 9,314 14,812 4.14*10 Firm Age (Years) 85.29 76.86 89.48 8.02*
11 Return on Assets (EBITDA) (%) 15.22 15.60 15.03 1.3412 Return on Assets (Net Income) (%) 5.17 6.15 4.68 5.75*13 Return on Equity (EBITDA) (%) 47.09 53.09 44.11 0.6014 Return on Equity (Net Income) (%) 15.70 20.47 13.32 1.70
15 Tobin’s Q 1.415 1.582 1.332 6.76*
16 Officer and Directors Ownership (less family) (%) 1.32 1.33 1.32 0.13817 Outside Directors (%) 55.06 43.73 60.68 24.60*18 Outside Blockholdings (%) 10.51 8.43 11.54 6.56*19 CEO Equity Based Pay (%) 35.90 28.65 39.51 10.00**, ** Significant at the 1% and 5% level, respectively.
25
Table 3. Accounting Measures of Performance and Founding Family OwnershipThis table gives the estimated coefficients from regressing return on assets (ROA) on a binary indicator offamily ownership and various control variables. The specification is:
ROA = δ0 + δ1(Family Firm) + δ2(CEO Founder) + δ3(CEO Descendant of Founder) + δ4(Control Variables) + δ1-54(2 Digit SIC Code) + δ93-99(Year Dummy Variables) + ε
where ROA is based on EBITDA and net income, Family Firm is binary variable that equals 1 when thefounding family is present in the firm and 0 otherwise, CEO Founder is equal to 1.0 if the CEO is founder ofthe firm and zero otherwise, CEO Descendant of Founder is equal 1.0 if the CEO is a descendant of the firm’sfounder and zero otherwise, Control Variables (natural log of total assets, research and development expensesdivided by total sales, long-term debt divided by total assets, stock return volatility, equity holdings of officersand directors less family holdings, fraction of independent directors, fraction of equity based pay), 2-Digit SICCode equal to 1.0 for each different 2-digit SIC code, and Year Dummy Variables that equal 1.0 for each year ofour sample period.
Variable Return on Assets(Using EBITDA)
Return on Assets(Using Net Income)
(1) (2) (3) (4)Intercept 0.171*
(4.10)0.168*
(4.06)0.152*
(7.32)0.146*
(6.80)Family Firm 0.013
(1.55)0.003(0.44)
0.009(1.78)
0.002(0.59)
CEO Founder - 0.058**
(2.15)- 0.037*
(2.71)CEO Descendant - 0.020**
(2.18)- 0.011**
(2.04)Officer and DirectorsOwnership (less family)
0.033(0.29)
0.074(0.65)
0.073(0.93)
0.095(1.21)
Outside Directors -0.032(1.48)
-0.026(1.22)
-0.004(0.31)
0.003(0.21)
CEO Equity Based Pay 0.010(1.06)
0.014(1.44)
0.008(1.49)
0.010**
(2.01)R & D/Sales 0.372*
(3.09)0.333*
(2.74)0.131(1.58)
0.110(1.33)
LT Debt/Total Assets 0.030(0.97)
0.031(1.04)
-0.147*
(9.37)-0.145*
(9.60)Return Volatility -0.188*
(4.47)-0.205*
(4.98)-0.174*
(4.45)-0.183*
(4.65)Ln (Total Assets) 0.003
(0.68)0.003(0.73)
-0.004(1.76)
-0.004(1.62)
Adjusted R Square 0.340 0.350 0.260 0.273*, ** Significant at the 1% and 5% level, respectively. The t-values, given in parenthesis below each estimate,are corrected for heteroskedasticity.

26
Table 4. Market Measures of Performance and Founding Family OwnershipThis table gives the estimated coefficients from regressing Tobin’s Q on a binary indicator of familyownership and various control variables. The specification is:
Tobin’s Q = δ0 + δ1(Family Firm) + δ2(CEO Founder) + δ3(CEO Descendant of Founder) + δ4(Control Variables) + δ1-54(2 Digit SIC Code) + δ93-99(Year Dummy Variables) + ε
where Tobin’s Q is as the market value of total assets divided by the replacement cost of assets, Family Firm isbinary variable that equals 1 when the founding family is present in the firm and 0 otherwise, CEO Founder isequal to 1.0 if the CEO is founder of the firm and zero otherwise, CEO Descendant of Founder is equal 1.0 ifthe CEO is a descendant of the firm’s founder and zero otherwise, Control Variables (natural log of totalassets, research and development expenses divided by total sales, long-term debt divided by total assets, stockreturn volatility, equity holdings of officers and directors less family holdings, fraction of independentdirectors, fraction of equity based pay), 2-Digit SIC Code equal to 1.0 for each different 2-digit SIC code, andYear Dummy Variables that equal 1.0 for each year of our sample period.
Dependent Variable = Tobin’s Q(1) (2)
Intercept 2.359*
(7.51)2.415*
(7.64)Family Firm 0.164**
(2.19)0.132(1.78)
CEO Founder - 0.436**
(2.08)CEO Descendant - -0.040
(0.37)Officer and Directors Ownership (less family) 1.621
(0.93)1.757(0.99)
Outside Directors -0.021(0.11)
0.024(0.13)
CEO Equity Based Pay 0.236*
(2.71)0.254*
(2.98)R & D/Sales 5.820*
(5.14)5.468*
(4.74)LT Debt/Total Assets -1.118*
(4.67)-1.120*
(4.78)Return Volatility -1.821*
(5.41)-1.964*
(5.67)Ln (Total Assets) -0.067**
(2.12)-0.073**
(2.34)
Adjusted R Square 0.379 0.387*, ** Significant at the 1% and 5% level, respectively. The t-values, given in parenthesis below each estimate,are corrected for heteroskedasticity.

27
Table 5. Non-linearities between Firm Performance and Founding Family OwnershipThis table gives the estimated coefficients from regressing Firm Performance on family ownership, the square offamily ownership, and various control variables. The specification is:
Firm Performance = δ0 + δ1(Family Own) + δ2(Family Ownership2) + δ3(Control Variables) + δ1-54(2 Digit SIC Code) + δ93-99(Year Dummy Variables) + ε
where Firm Performance is measured using ROA and Tobin’s Q, Family Own is the fractional ownership of thefamily, Family Onwership2 is the square of fractional family ownership, Control Variables (natural log of totalassets, research and development expenses divided by total sales, long-term debt divided by total assets, stockreturn volatility, equity holdings of officers and directors less family holdings, fraction of independentdirectors, fraction of equity based pay), 2-Digit SIC Code equal to 1.0 for each different 2-digit SIC code, andYear Dummy Variables that equal 1.0 for each year of our sample period.
Return on Assets(Using EBITDA)
Return on Assets(Using Net Income)
Tobin’s Q
Intercept 0.175*
(3.77)0.148*
(6.52)2.444*
(7.01)Family Own 0.128**
(2.14)0.090**
(2.26)1.644**
(2.23)Family Ownership2 -0.207**
(2.19)-0.136**
(2.58)-2.473**
(2.53)Officer and DirectorsOwnership (less family)
0.100(0.56)
0.126(1.36)
2.204(1.09)
Outside Directors -0.031(1.35)
-0.006(0.44)
-0.136(0.67)
CEO Equity Based Pay 0.007(0.71)
0.008(1.56)
0.216**
(2.34)R & D/Sales 0.381*
(3.09)0.148(1.76)
5.824*
(5.10)LT Debt/Total Assets 0.022
(0.63)-0.147*
(8.83)-1.084*
(4.41)Return Volatility -0.180*
(4.05)-0.177*
(4.41)-1.913*
(5.49)Ln (Total Assets) 0.002
(0.48)-0.003(1.29)
-0.064(1.82)
Adjusted R Square 0.340 0.262 0.371
Inflection Point (%) 30.9 33.1 33.2*, ** Significant at the 1%, 5%, and 10% levels, respectively. The t-values, given in parenthesis below eachestimate, are corrected for heteroskedasticity.

28
Table 6. Instrumental Variable Regressions between Firm Performance and Founding FamilyOwnershipThis table gives the estimated coefficients from regressing Firm Performance on family ownership, the square offamily ownership, and various control variables. The specification is:
Firm Performance = δ0 + δ1(Predicted Value of Family Firm) + δ2(Control Variables) + δ1-54(2 Digit SIC Code) + δ93-99(Year Dummy Variables) + ε
where Firm Performance is measured using ROA and Tobin’s Q, Predicted Value of Family Firm is the output fromthe stage 1, instrumental variable regressions using natural log of total assets, the square of the natural log oftotal assets, and the standard deviation of stock returns as the instruments. Control Variables (----------), 2-Digit SIC Code equal to 1.0 for each different 2-digit SIC code, and Year Dummy Variables that equal 1.0 foreach year of our sample period.
Return on Assets(Using EBITDA)
Return on Assets(Using Net Income)
Tobin’s Q
Intercept 0.019(1.00)
0.003(0.13)
0.479(1.67)
Predicted Value of Family Firm 0.044(2.10)
0.046(1.80)
0.964(3.03)
Officer and DirectorsOwnership (less family)
-0.055(2.86)
-0.050(2.71)
-1.070(4.26)
Outside Directors 0.045(2.18)
0.043(1.91)
0.754(2.37)
CEO Equity Based Pay 0.007(0.97)
0.010(2.12)
0.328(3.35)
k/s 0.074(4.64)
-0.029(2.12)
-0.382(2.19)
(K/s)2 -0.043(5.28)
-0.007(0.91)
0.041(0.51)
Y/s 0.003(13.39)
0.001(4.12)
0.005(3.23)
R&d/k 0.013(1.57)
-0.001(0.11)
0.581(4.21)
Rdum 0.002(0.28)
-0.005(0.88)
-0.025(0.29)
A/k 0.006(2.68)
0.009(4.20)
0.031(1.28)
Adum 0.003(0.60)
0.004(0.79)
-0.004(0.06)
I/k 0.080(3.81)
0.075(3.68)
1.039(3.36)
Adjusted R Square 0.457 0.216 0.383
*, ** Significant at the 1%, 5%, and 10% levels, respectively. The t-values, given in parenthesis below eachestimate, are corrected for heteroskedasticity.