root an object oriented hep analysis framework.. computing in physics physics = experimental science...
TRANSCRIPT

ROOT
An object oriented HEP analysis framework.

Physics data types
Histogram 1-dim, 2-dim
Ntuple Tree
Events Vertices
Tracks Measurements Particle properties
ROOT
The ROOT Home:
http://root.cern.ch
The ROOT Team:
Rene Brun &
Fons Rademakers
Finding Examples
The ROOT Tutorials:
http://root.cern.ch/root/Tutorials.html
The ROOT How To's: http://
root.cern.ch/root/Howto.html
For on-line help for a particular topic it's very
useful to use their facility to search the
ROOT site. http://root.cern.ch/root

Class Schedule Overview of the ROOT Framework GUI basics Command line basics Finding Information (class
reference guide)
Getting started with the exercises

Object Oriented Concepts
Members: a “has a” relationship to the class.
Inheritance: an “is a” relationship to the class.
Class: the description of a “thing” in the system Object: instance of a class Methods: functions for a class
Event
TrackSegment Vertex
Momentum MassSquare InterceptAtVert
HAS AHAS AHAS A
HAS A HAS AHAS A
TObject
IS A

ROOT's Services/Utilities Histogramming and Fitting Graphics (2D, 3D) I/O to file or socket: specialized for
histograms, Ntuples (Trees) Collection Classes and Run Time Type
Identification User Interface
GUI: Browsers, Panels, Tree Viewer Command Line interface: C++ interpreter CINT Script Processor (C++ compiled C++
interpreted)

ROOT's Service
s/Utilities

ROOT's Services/Utilities

ROOT's Services/Utilities

ROOT's Services/Utilities

ROOT's Services/Utilities

ROOT's Services/Utilities

Three User Interfaces GUI
windows, buttons, menus
Root Command lineCINT (C++ interpreter)
Macros, applications, libraries (C++ compiler and interpreter)

GUI Basics Browsing and opening files Drawing histograms Right click, left click, middle click Draw Panel Fit Panel Adding Color and Zooming Adding text and other objects Dividing the canvas Setting the log scale

GUI Basics
Display the browser TBrowser b;
Start root> root
Quit root (just in case) root[0]>.q

The ROOT file
A directory structure like UNIX
Items in a directory can be: subdirectory objects (canvas,
histograms, etc.) root trees

Displaying a Histogram
Display a histogram The Canvas
Open the root fileBrowse the file
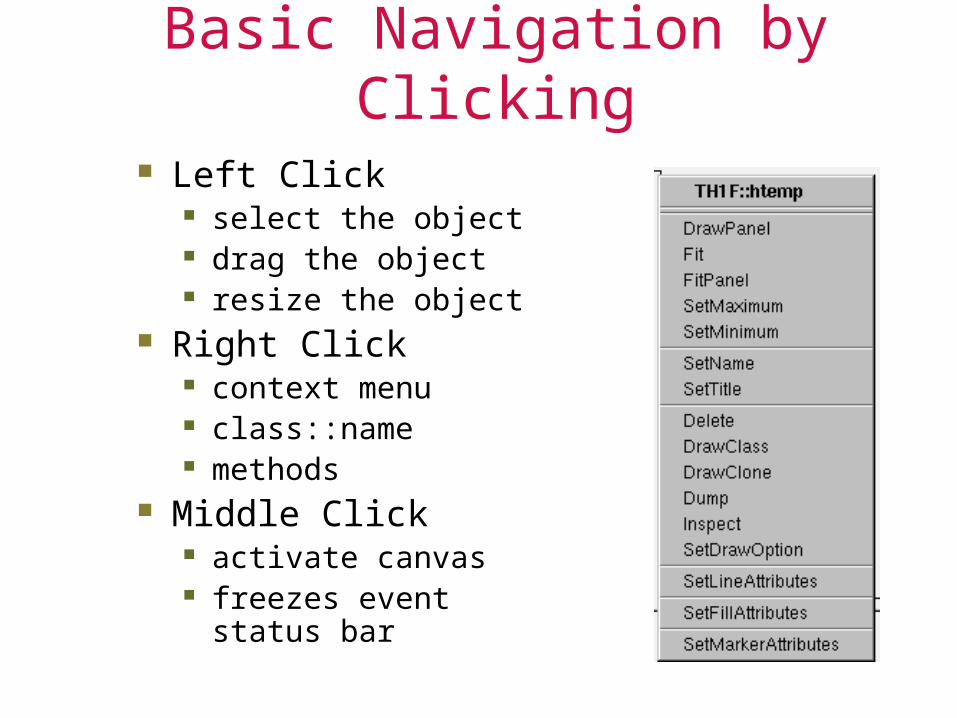
Basic Navigation by Clicking
Left Click select the object drag the object resize the object
Right Click context menu class::name methods
Middle Click activate canvas freezes event status
bar

The Draw Panel The Event Status
The Draw PanelAdding Error barsSliderDefaults

Fitting, Coloring, and Zooming
Adding a gaussian fit Coloring the histogram Zooming/unzooming

Adding Objects to the Canvas
The Editor Adding an Arrow Adding Text

Adding another Pad Add a Pad Select the new
Pad Draw a histogram Add a title for the
axis
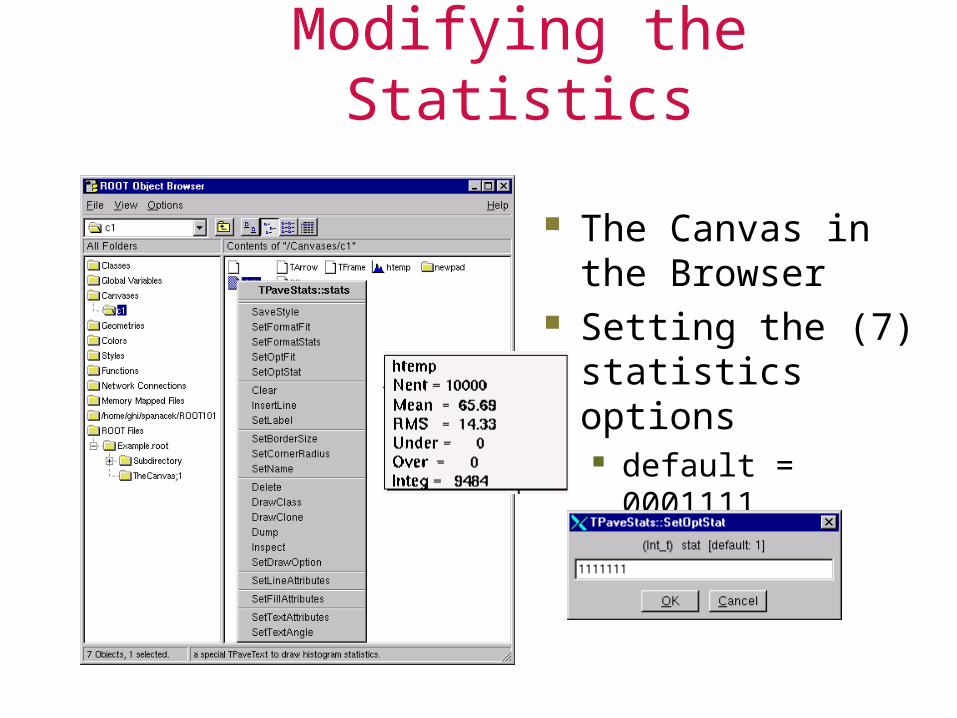
Modifying the Statistics
The Canvas in the Browser
Setting the (7) statistics options default = 0001111

Dividing the Canvas
Create a new Canvas Divide it in 2 Draw two histograms.
1. Lego plot2. LogY