rooftop-building renewable power al zoubi raafat …
TRANSCRIPT

RA
AFA
TA
L ZOU
BI
ROOFTOP-BUILDING RENEWABLE POWERSYSTEM AT THREE REGIONS IN NORTHERN
CYPRUS
A THESIS SUBMITTED TO THE GRADUATESCHOOL OF APPLIED SCIENCES
OFNEAR EAST UNIVERSITY
ByRaafat AL ZOUBI
In Partial Fulfillment of the Requirements forthe Degree of Master of Science
inCivil Engineering
NICOSIA, 2019
RO
OFTO
P-BUILD
ING
REN
EWA
BLE POW
ER SY
STEM A
T THR
EE REG
ION
S INN
OR
THER
N C
YPR
US
NEU
2019

ROOFTOP-BUILDING RENEWABLE POWERSYSTEM AT THREE REGIONS IN
NORTHERN CYPRUS
A THESIS SUBMITTED TO THE GRADUATESCHOOL OF APPLIED SCIENCE
OFNEAR EAST UNIVERSITY
ByRaafat AL ZOUBI
In Partial Fulfillment of the Requirements forthe Degree of Master of Science
inCivil Engineering
NICOSIA, 2019

Raafat AL ZOUBI: ROOFTOP-BUILDING RENEWABLE POWER SYSTEM ATTHREE REGIONS IN NORTHERN CYPRUS
Approval of Director of Graduate School of
Applied Sciences
Prof. Dr. Nadire ÇAVUŞ
We certify this thesis is satisfactory for the award of the degree of Master of Sciencein Civil Engineering
Examining Committee in Charge:
Prof. Dr. Hüseyin Gökçekuş Committee Chairman, Supervisor, CivilEngineering, NEU,
Assist. Prof. Dr. Belal Shneikat Economic and administrative sciences,Kyrenia University
Assist. Prof. Dr. Beste Çubukçuoğlu Civil Engineering Department, NEU
Dr. Fidan Aslanova Civil Engineering Department, NEU
Assist. Prof. Dr. Youssef KASSEM Co-Supervisor Mechanical EngineeringDepartment, NEU

I hereby declare that, all the information in this document has been obtained and presented
in accordance with academic rules and ethical conduct. I also declare that, as required by
these rules and conduct, I have fully cited and referenced all material and results that are
not original to this work.
Name, Last Name:
Signature:
Date:

ii
ACKNOWLEDGEMENTS
I would like to express my sincere gratitude and thanks to my supervisors Prof. Dr.
Hüseyin GÖKÇEKUŞ and Assist. Prof. Dr. Youssef KASSEM for their guidance,
suggestions and much good advice and his patience during the correction of the thesis.
They have been my mentor and my support at all the times. I am very thankful to them for
giving me an opportunity to work on interesting projects I am immensely grateful for your
kindness, patience, time and professional contributions to the success of my study. Thanks
for always pushing me for more.
I would also like to thank Assist. Prof. Dr. Belal SHNEIKAT for giving me the opportunity
to further my knowledge in the management area. Without him, I would not have the
opportunity to carry out such interesting research.
This research was generously supported by the Department of Civil Engineering of Near
East University. I am also grateful to all supporters.
I would also like to express heartiest thanks to my parents, my wife and my family
members for their patience, ever constant encouragement and love during my studies.

iii
To my parents ...

iv
ABSTRACT
The increased energy demand and related environmental problems caused by burning
fossil fuels have raised interest in alternative energy sources. This research explores
student's opinions regarding renewable energy, technologies, and benefits in Northern
Cyprus. In order to investigate the opinions and the level of awareness of the post-graduate
students, a multiple choice questionnaire was designed. The results show that the majority
of students have heard about renewable energy technologies in terms of wind and solar and
are concerned about using it to generate electricity in Northern Cyprus. Moreover, this
study investigates the wind characteristics and available wind energy for three urban
regions in Northern Cyprus using Weibull distribution function. The results illustrate that
Gazimağusa is the most applicable location for harvesting the kinetic energy of the wind
compared to Lefkoşa and Girne. Furthermore, Logistic distribution function is used for
analyzing the global solar radiation based on various periods. Moreover, this work presents
an economic evaluation of three regions with promising solar/wind potential. Therefore, a
small-scale (10kW) grid-connected solar /wind system that is able to generate electricity
with an excellent percentage of clean energy was proposed and developed. The analysis
indicates that the proposed PV projects were very promised in the all studied regions. In
addition, the proposed PV systems are the most economical option for generating
electricity compared to wind system due to low electricity prices and recovery of initial
investment. Consequently, the simulation results expect to help in demonstrating the
advantages and challenges of installing a grid-connected PV system for residential in
Northern Cyprus in order to reduce the electricity consumption produced by fossil fuel.
Keyword: Economic analysis; grid-connected; Northern Cyprus; renewable projects; urbanregions; public opinion

v
ÖZET
Artan enerji talebi ve fosil yakıtların yanmasından kaynaklanan çevresel problemler
alternatif enerji kaynaklarına ilgi artmıştır. Bu makale, öğrencinin Kuzey Kıbrıs'taki
yenilenebilir enerji, teknolojiler ve faydalar hakkındaki görüşlerini incelemektedir.
Mezuniyet sonrası öğrencilerin görüş ve farkındalık seviyelerini araştırmak için çoktan
seçmeli bir anket tasarlanmıştır. Sonuçlar, öğrencilerin çoğunluğunun rüzgar ve güneş
açısından yenilenebilir enerji teknolojilerini duyduğunu ve Kuzey Kıbrıs'ta elektrik
üretmek için kullanmaktan endişe duyduklarını göstermektedir. Öğrencinin görüşlerine
dayanarak, bu çalışma Weibull dağılım işlevini kullanarak Kuzey Kıbrıs'taki üç kentsel
bölge için rüzgar özelliklerini ve mevcut rüzgar enerjisini incelemektedir. Sonuçlar,
Gazimağusa'nın, rüzgarın kinetik enerjisini Lefkoşa ve Girne'ye kıyasla hasat için en
uygun yer olduğunu göstermektedir. Ayrıca, küresel güneş ışınımını çeşitli dönemlere göre
analiz etmek için Lojistik dağıtım fonksiyonu kullanılmaktadır. Dahası, bu çalışma ümit
vaat eden güneş / rüzgar potansiyeli ile üç bölgenin ekonomik bir değerlendirmesini
sunuyor. Bu nedenle, mükemmel oranda temiz enerjiyle elektrik üretebilen küçük ölçekli
(10 kW) bir şebekeye bağlı güneş / rüzgar sistemi önerildi ve geliştirildi. Analiz, önerilen
PV projelerinin tüm çalışılan bölgelerde çok vaat edildiğini göstermektedir. Ayrıca,
önerilen PV sistemleri, düşük elektrik fiyatları ve ilk yatırımın geri kazanılması nedeniyle
rüzgar sistemine kıyasla elektrik üretmek için en ekonomik seçenektir. Sonuç olarak,
simülasyon sonuçları, fosil yakıtın ürettiği elektrik tüketimini azaltmak için Kuzey
Kıbrıs'ta konutlar için şebekeye bağlı bir PV sistemi kurmanın avantajlarını ve zorluklarını
göstermeye yardımcı olmayı beklemektedir.
Kelimeler: Ekonomik analiz; çevre analizi; şebekeye bağlı yenilenebilir projeler;Kuzey Kıbrıs

vi
TABLE OF CONTENTS
ACKNOWLEDGEMENT ........................................................................................... ii
ABSTRACT .................................................................................................................. iv
ÖZET ............................................................................................................................ v
TABLE OF CONTENTS ............................................................................................. vi
LIST OF TABLES ........................................................................................................ viii
LIST OF FIGURES ...................................................................................................... ix
LIST OF SYMBOLS ………........................................................................................ xi
CHAPTER 1: INTRODUCTION1.1 Background ............................................................................................................... 1
1.2 Objectives of the Research ……………………………………………………....... 2
1.3 Thesis Outline .......................................................................................................... 2
CHAPTER 2: RENEWABLE ENERGY2.1 Renewable Energy ………………………………………………………………. 3
2.2 Wind and Solar Energy ………………………………………………………….. 5
2.3 Review Study …………………………………………………………………… 7
CHAPTER 3: MATERIAL AND METHOD3.1 Measurement Data ……………………………………………………………… 9
3.2 Wind Power Density ………………………………………………………………. 10
3.3 Details of Proposed Rooftop Grid Connected Renewable System ………………. 12
3.3.1 10kW grid-connected wind system …………………………………………….. 12
3.3.2 10kW Grid-Connected Solar PV System ………………………………………. 13
3.3.2.1 PV Plant Layout ………………………………………………………………. 14
3.3.2.2 Tilt Angle ……………………………………………………………………… 14
3.3.2.3 Solar Panel …………………………………………………………………….. 14
3.3.2.4 Inverter ………………………………………………………………………... 15
3.4 Simulation Software ………………………………………………………………. 15

vii
3.4.1 Photovoltaic Geographical Information system (PVGIS) Simulation Tool …….. 15
3.4.2 Clean Energy Management Software (RETScreen) …………………………….. 16
3.5 Material Data ……………………………………………………………………… 22
CHAPTER 4: RESULTS AND DISCUSSIONS4.1. Postgraduate Students Opinion Analysis …………………………………………. 23
4.2. Wind Characteristics and Wind Energy Potential ………………………………... 32
4.2.1 Wind Speed Characteristics …………………………………………………… 32
4.2.2 Wind Speed Frequency Distribution at 10m Height ………………………….. 36
4.2.3 Wind Speed and Wind Power density at Various Heights …………………… 39
4.2.4 Economic Analysis of Wind Potential ……………………………………….. 41
4.3. Solar Radiation Characteristics and Solar Energy Potential ……………………... 45
4.3.1 Global Solar Radiation Characteristics ………………………………………. 45
4.3.2 Global Solar Radiation Distributions ………………………………………… 47
4.3.3 Solar Resource Potential at Three Selected Regions in Northern Cyprus …….
Using PVGIS Tool ……………………………………………………….......
49
4.3.4 Economic Analysis of Solar Energy Potential ……………………………….. 53
4.4 Discussion …………………………………………………………………………. 56
CHAPTER 5: CONCLUSIONS AND FUTURE WORK5.1 Conclusions ............................................................................................................. 60
5.2 Limitation of research …………………………………………………………….. 61
5.3 Future Work ………………………………………………………………………. 62
REFERENCES ............................................................................................................ 63
APPENDIXAppendix 1: A questionnaire about renewable energy technology …………………. 69

viii
LIST OF TABLES
Table 3.1: Details of each region used in this study ……………………………… 9
Table 4.1: Results of survey questions of Part A ………………………………….. 24Table 4.2: Results of the second question in Part B ……………………………….. 27Table 4.3: Weibull parameters for each region (2010-2016) at a height of 10m ….. 36Table 4.4: Roughness values for different sites …………………………………… 39Table 4.5: Annual wind power density at various heights ……………………….. 41Table 4.6: Characteristics of the selected wind turbine ………………………….. 42Table 4.7: Values and assumptions for the economics of wind energy …………. 43Table 4.8: Capacity factor and Generated electricity of wind turbine system …… 44Table 4.9: Summary of grid-connected performance of 10-kW PV plant using
PVGIS …………………………………………………………………. 54
Table 4.10: Economic parameters used for economic analysis of grid-connected10kW PV plant ………………………………………………………… 55
Table 4.11: Performance of 10kW PV power plants ……………………………… 56

ix
LIST OF FIGURES
Figure 2.1: Renewable energy sources ………………………………………… 3
Figure 2.2: Renewable energy sources for generating electricity ………………. 4Figure 2.3: Wind turbine ………………………………………………………... 6Figure 2.4: Solar photovoltaic ………………………………………………..... 7Figure 3.1: The geographic location of the study area ………………………… 10Figure 3.2: Block diagram of Wind Electric Generator system ……………………….. 12Figure 3.3: Block diagram showing the components of solar PV plant ………… 14Figure 3.4: The framework of the simulation study using PVGIS ……………… 16Figure 3.5: The framework of the simulation of 45kW solar PV using
RETScreen ………………………………………………………… 21
Figure 3.6: The framework of the simulation of 40kW wind system usingRETScreen ………………………………………………………….. 22
Figure 4.1: Level of interest in renewable energy ………………………………. 25Figure 4.2: The disadvantage of using renewable energy over tradition gas or
electricity energy …………………………………………………… 29
Figure 4.3: Type of renewable energy that can be used in Northern Cyprus …… 29Figure 4.4: Benefits of generating electricity from renewable energy sources …. 30Figure 4.5: Purchasing a renewable energy system for universities or cities in
Northern Cyprus ……………………………………………………. 31
Figure 4.6: Future energy needs for the universities and cities ………………… 32Figure 4.7: Monthly variation of the mean wind speed ........................................ 33Figure 4.8: Hourly variation of the mean wind speed …………………………... 35Figure 4.9: Yearly variation of shape and scale parameters for the areas at 10m
Height ……………………………………………………………… 37
Figure 4.10: Wind speed probability frequency for the whole (2010-2016) atheight 10m ………………………………………………………….. 38
Figure 4.11: Vertical wind shear profile at six studied locations ………………… 40Figure 4.12: Average sunshine duration during the investigated period …………. 46Figure 4.13: Fitting f(G) to the global solar radiation data of studied regions …… 48
x
Figure 4.14: The framework of the simulation study using PVGIS ……………… 50Figure 4.15: Average monthly electricity production and in-plane irradiation for
studied regions using PVGIS simulation tool ……………………... 51
Figure 4.16: Electricity demand in Northern Cyprus (2004-2017) ………………. 58Figure 4.17: Total Electricity generated (EG) and solar/wind vs diesel electricity
Cost …………………………………………………………………. 59
xi
LIST OF SYMBOLS
Swept area in m2
B The total benefit of the project
C Total initial cost of the project
GHG reduction income
The annual capacity savings or income
The annual energy savings or income
The annual cost of fuel
The after-tax cash flow in year n
& The yearly operation and maintenance costs incurred by the clean energy project
The annual renewable energy (RE) production credit income
r Discount rate
, The debt ratio( ) Probability density function (PDF)
Wind power in W
Mean wind power in W
Wind speed at the original height zMean wind speed in m/s
N Project life in years∆ The annual GHG emission reduction.
Air density
α The surface roughness coefficient

BİLİMSEL ARAŞTIRMALAR ETİK KURULU
11.12.2018
Dear Raafat Al Zoubi
Your application titled “Renewable Energy Technologies in Northern Cyprus: A Survey ofUniversity Students” with the application number YDÜ/FB/2018/45 has been evaluated by the
Scientific Research Ethics Committee and granted approval. You can start your research on the
condition that you will abide by the information provided in your application form.
Assoc. Prof. Dr. Direnç Kanol
Rapporteur of the Scientific Research Ethics Committee
Note:If you need to provide an official letter to an institution with the signature of the Head ofNEU Scientific Research Ethics Committee, please apply to the secretariat of the ethicscommittee by showing this documen

1
CHAPTER 1
INTRODUCTION
1.1 Background
Renewable energy technologies areconsidered as important sources in Twenty one century,
which can be replaced the use of fossil fuel and reduced the global warming.
Internationally, the tendency in power consumption level is growing owing to
industrialization and quick vary in the set of living of the people in excess of the previous
few decades(Bano and Rao 2016; Padmavathi and Daniel 2013; Sharma and Chandel
2013; Shiva Kumar and Sudhakar 2015; Khanna et al., 2017). Optional source such as
solar power and bio-mass power are wanted to decrease the GHG (Kumar et al.,
2017).Renewable energy sources are ideal candidate for global energy transition that must
occur over the century (REN21 et al., 2012; De et al., 2011; De et al., 2014; Pakistan
Energy Yearbook 2001 et al., 2002; Muhammad et al., 2017).One of the most important
renewable energy resources are wind and solar energy. Wind and Solar energiesare
environmentally friendly and economically perfect sustainable electric power production.
Wind energy and solar energy is converted to electric power using wind turbine and solar
PV technologies, respectively. Wind and solar energy is the world’s fastest-growing
energy source and it can power industry, businesses, and homes with clean, renewable
electricity for many years to come (Razmjoo et al., 2017; Spellman &Stoudt, 2013). Wind
speed and Sunlight can be converted directly into electricity using wind turbines (Al Zohbi
et al., 2015) and solar photovoltaic (PV) (Shiva Kumar &Sudhakar, 2015), respectively.
They are a considerable power source for meeting electricity demand in many countries
(Cantarello& Newton, 2014).
In Northern Cyprus, the electricity is currently produced using diesel generators power
stations and PV power plant, which installed in Serhatköy with the capacity of 212MW
and 1.27MW, respectively (Yenen&Fahrioglu, 2013; Kassem et al., 2018). Moreover,
increasing population, rising life standards, and rapidly growing tourism and industry
sectors have led to an increase in the demand for fossil fuels. Increasing demand in

2
conventional sources has encouraged the authors to investigate in the field of renewable
energy sources especially wind and solar energy for electricity generating in Northern Part
of Cyprus.
1.2 Objectives of the Research
The first objective of this study is to provide a better understanding of the relationship
between renewable technologies (wind turbines and PV) and the cheapest energy cost at
three major cities located in the Northern part of Cyprus. In addition, this work aims to
analyze the level of awarenessof energy efficiency in terms of renewable energy
sources,technologies, and benefits in Northern Cyprus. Furthermore, this study also
addressed how the thinkingand acceptance rate of renewable energy technologies
varyespecially for the respondents’ own. Moreover, the second objective of this study is to
evaluate the economic and environmental effects of wind and solar rooftop-building
system that influence electricity cost and CO2 emission in most of the cities, in particular,
the case study of Lefkoşa, Girne, and Gazimağusa.
The study focused on finding the best renewable technologies can be used to generate
electricity in Northern Cyprus.
1.3 Thesis Outlines
Chapter 1 is provided a short description of renewable energy in terms of wind and solar
energy and the objective of this work. In chapter 2 is explained the fundamental concept of
renewable energy and wind turbine. Chapter 3 is describedthe methods used to analyze the
climate data including wind, solar radiation and sunshine duration. In addition, simulation
tools that used to study the economic evolution of renewable rooftop system are explained.
The electricity cost generated by renewable system and environmental effect is discussed
in chapter 4. The final conclusion on the current study is described in chapter 5.

3
CHAPTER 2
RENEWABLE ENERGY
2.1 Renewable energy
Renewable sources of energy are independent, naturally and not artificially existingand
they are already being economically exploited or will become so in the nearfuture as
shown in Figure 2.1.
Figure 2.1: Renewable energy sources
Renewable energy sources have as their basic origin the sun. The radiation from thesun
that reaches the Earth’s ground, apart from the vital contribution in the creation,growth and
maintenance of life of our planet, provides our planet with energy invarious forms.
Moreover solar radiation heats directly and evaporates large quantitiesof marine water and
it maintains the natural cycle of the water, creating lakes andrivers that constitute an

4
additional source of energy (Hydroelectric energy). Solarradiation puts in movement the
air masses of the atmosphere (Wind energy) and itcreates waves (Wave energy). Finally is
absorbed from combined materials andproduces electricity (Photovoltaic effect) and it
contributes in the growth of flora viathe photosynthesis phenomenon and with the
combustion of plants produces energy(Biomass).
Renewable sources are safe and unlimited in the sense that there is no possibility ofreserves
being run down. With some exceptions, proposed renewable energy sourcesare local and so
cannot be exploited by a foreign power as has happened with oil overmany years. Furthermore
renewable sources can add diversity to energy supply andalmost none of them releases gaseous
or liquid pollutants during the operation.
Of course renewable sources, with the current economic and technological facts, arenot
able, at least for the moment, to give a clear and a radical solution to the energyproblems
of humanity. However if their use is combined with an effort to save largeamounts from
existing conventional energy resources, it is possible that a progressiveremoval of
humanity’s nightmare, a befalling energy winter, may be accomplished.
2.2 Solar Energy
The sun is the largest energy source of life while at the same time it is the ultimate source
of most of our renewable energy supplies.
The sun is a typical star with the following characteristics: mass 2×1030 kg, beam length
700.000 km, age 5×10⁹ years and it is calculated that it still has roughly 5 billion more
years of life. Its surface temperature is about 5800 K while the internal temperature is
approximately 15.000.000 K. This temperature derives from reactions which were based
on the transformation of hydrogen in helium.
Energy, is the result of the high temperature of the sun and the continuous emission of
large amounts of energy. It is calculated that for each gram of hydrogen, that is converted
to He, sun radiates energy equal with U= 1.67×10⁵ kWh. The solar energy is emitted to the
universe mainly by electromagnetic radiation.
The earth spins in an elliptic orbit around the sun while the distance from the sun is
estimated to be 150.000.000 km. The light in order to cover this distance, having thespeed
of 300.000 km/sec, requires approximately 8.5 min. The emitted radiation is removed actinic

5
by the aster to the space and the intensity of the radiation J, is calculated according to the
equation below:
= 4 (2.1)Where P is the power of electromagnetic radiation and d is the distance from the
sun.Approximately one-third of this radiation is reflected back. The rest is absorbed
andretransmitted to the space while the earth reradiates just as energy as it receives andcreates
a stable energy balance at a temperature suitable for life.
Solar energy can be used to generate electricity in a direct way with the use ofphotovoltaic
panels.
2.3 Wind Energy
Wind energy is a free, clean, and inexhaustible energy source. Ithas served mankind for many
centuries by propelling ships anddriving wind turbines to grind grains and pump water.
Windpower and other forms of solar power are being strongly encouraged.Wind power may
become a major source of energy in spiteof slightly higher costs than other traditional sources
of energygeneration. Considerable progress is being made in making windpower less
expensive. But even without a clear cost advantage,wind power will become important in the
world energy sources.Wind energy is the world’s fastest-growing energy source and itcan
power industry, businesses and homes with clean, renewableelectricity for many years to
come. Wind turbines do not consumefuel due to its operation. It does not produce emissions
such as carbondioxide, sulphur dioxide, mercury, particulates, or any othertype of air pollution.
2.4 Review study
Several researchers have studied wind and solar potential of various locations in world and
Northern Cyprus.
For instant, Al Zohbi et al. (2015) investigated the wind characteristics using actual wind
data for five sites in Lebanon. They concluded that the wind power could reduce the
electricity crisis in Lebanon.

6
Bilir et al. (2015) analyzed the wind speed characteristics at Incek region of Ankara in
Turkey using actual wind data measured at various height (20 and 30m). It is found that
wind energy source in this region is classified to be poor and small-wind turbine capacity
can be used to produce electricity.
Ammari et al. (2015) evaluated the wind power at five different locations in Jordan and
examined the feasibility of using different wind turbines with the different power rated
capacity to be employed in the wind farm. The results showed that Aqaba Airport and Ras-
Muneef have a good wind speed for generating electricity, while the desert locations of
Safawi and Azraq South have moderate wind energy generation potential and Queen Alia
Airport has a poor in wind energy potential.
More recently, Alayatet al. (2018) studied techno-economic assessment of the wind power
potential for eight locations, namely, Lefkoşa, Ercan, Girne, Güzelyurt, Gazimağusa,
Dipkarpaz, YeniBoğaziçi, and Salamis, distributed over the Northern part of Cyprus. The
results showed that small-scale wind turbine use could be suitable for generating electricity
in the studied locations.
Kassem et al. (2018) are evaluated the economic feasibility of 12MW grid-connected wind
farms and PV plants for producing electricity at Girne and Lefkoşa in Northern Cyprus.The
authors concluded that PV plants are the most economical option compared to wind farms
for generating electricity in the selected studied.
Kassem et al. (2018) are analyzed the wind power potential at Salamis region in Northern
Cyprus. They found that high capacity wind turbine (MW) could not be suitable for
electricity production in the region based on the value of wind power density.
Solyali et al. (2016) studied wind power potential for Selvili-Tepelocation in Northern
Cyprus. The authors found that wind energy sources in this site are classified to be
marginal (wind power class is 2).
Kassem&Gökçekuş (2018) evaluated and analyzed the techno-economic of proposing a
1MW grid-connected PV power plant in Lefke town. The analyzing result showed that PV
plant could be used as a viable alternative to reduce the GHG emissions in Northern
Cyprus and generating electricity from environmentally friendly scours.

7
Mohammadi et al. (2018) evaluated the potential of developing 5 MW gird-connected PV
power plants in eight selected cities in the southern coast of Iran from technical, financial
and environmental viewpoints. The results showed that southern coast of Iran has a huge
potential and actual market opportunities for investors to develop grid-connected PV
projects.
Elhodeiby et al. (2011) presented a performance analysis of 3.6 kW Rooftop grid
connected solar photovoltaic (PV) system in Egypt. The system was monitored for one
year and all the electricity generated was fed into the 220 V, 50 Hz low voltage grid to the
consumer.

8
CHAPTER 3
MATERIAL AND METHOD
3.1 MeasurementData
Cyprus is the third biggest island in the Mediterranean Sea and the climate of Cyprus is a
typical Mediterranean climate (Mehmet &Bicak, 2002). Climate conditions on the island
vary by geographical factors. Cyprus was divided into two sides in 1974 after the war
(Mehmet &Bicak, 2002). It has a total surface area of 9.250 km2 and north of Island is
3.355 km². Cyprus has blocked further EU negotiations with Turkey over the issue of
Turkey’s support for the break-away Northern Cyprus region (Hobbs, 2016). The major's
cities in Northern Cyprus are Lefkoşa, Girne, and Gazimağusa. The total population in
these cities is estimated to be 94824 people for Lefkoşa, 69163 for Girne and 69741 for
Gazimağusa in 2011 (Statistics and research department, 2017). Furthermore, the total
urban building at Lefkoşa, Girne, and Gazimağusa for 2016 was 353, 111, and 145
building, respectively (Statistics and research department, 2017). Climate data for various
periods (wind speed, solar radiation, and sunshine duration) collected from the
Meteorology Department located in Lefkoşa were analyzed. The data used for this work
are monthly data using a simple statistical method to calculate the average monthly climate
data. The meteorological station's information, which was considered for the calculation,
analysis and prediction purposes, is listed in Table 3.1. The locations of these
meteorological stations are given in Figure 3.1.
Table 3.1: Details of each region used in this study
Location
CoordinatesArea
[m2]
Altitude
[m]
Period data
Latitude
[°N]
Longitude
[°E]
Wind speedat a 10m
height
Solar radiationat 2m height
Lefkoşa 35° 10' 12.9'' 33° 21' 31.32'' 502 146 2008-2016 2008-2016
Girne 35° 20' 0.6'' 33° 18' 51.156'' 690 7 2000-2016 2000-2016
Gazimağusa 35° 7' 15.9924'' 33° 56' 15.1116'' 997 7 2009-2016 2009-2016

9
Figure 3.1: The geographic location of the study area
3.2 Wind Power DensityWind power density (WPD) value can be regarded as a representative value for the wind
energy potential of a region. The model of wind power density describes the distributions
of wind energy at various wind speed values. The WPD value in W/m2 depends only on
the air density and the wind speed as given by (Ayodele et al. 2013)
= = 12 (3.1)where Pis the wind power in W, A is a swept area in m2, ρ is the air density (ρ =1.225 kg/m ) and v is wind speed in m/s.
Moreover, for a period measurement, the mean wind power density (WPD) in W/m2 can be
calculated using Eq. (2) (Irwanto et al. 2014).
= = 12 ̅ (3.2)

10
wherePis the mean wind power in W and v is the mean wind speed in m/s.
If the distribution of wind speed is taken into account, then Eq. (1) can be written as
(Ayodele et al. 2013)
= 12 ( ) (3.3)where ( ) is the probability density function (PDF).
Furthermore, the wind power density distribution for a specified distribution function f(v)
can be computed as (Mohammadi et al. 2017):
= 12 ( )(3.4)For wind energy assessments, the simple power law model is usually adopted to convert
the wind speeds to various heights. It is expressed as (Irwanto et al. 2014)
= (3.5)where v is the wind speed at the wind turbine hub height z, v is the wind speed at the
original height z , and α is the surface roughness coefficient, which depends on the
characteristics of the region [13]. In this study, the wind speed data was measured at the
height of 10 m above ground level; therefore, the value of α can be obtained from the
following expression(Masseran, 2015;Irwanto et al. 2014).
= 0.37 − 0.088 ( )1 − 0.088 ( 10⁄ ) (3.6)

11
3.3 Details of Proposed Rooftop Grid Connected Renewable System
3.3.110kW Grid-Connected Wind System
The terms "wind energy" or "wind power" describe the process by which the wind is used
to generate mechanical power or electricity. Wind turbines convert the kinetic energy in
the wind into mechanical power as presented in the previous section. This mechanical
power can be used for specific tasks (such as grinding grain or pumping water) or a
generator can convert this mechanical power into electricity to power homes, businesses,
schools, and other facilities. In this section we will discuss the basic design of wind electric
turbines.
The basic components of a wind electric system analyzed herein are shown in Figure 3.2.
A step-up gearbox and a suitable coupling connect the wind turbine to the Permanent
Magnet Synchronous Generator (PMSG). The generated power of continuously varying
frequency is fed to local load through suitable power converters, to ensure constant voltage
and constant frequency. Since the wind power fluctuates with wind velocity, the generator
output voltage and frequency vary continuously. The varying AC voltage is rectified into
DC in a diode bridge. The DC voltage is inverted to get the desired AC voltage and
frequency employing a PWM inverter. The PWM inverter can be connected directly with a
local grid such that it exchanges continuously the power between the DC side and the grid.
Figure 3.2: Block diagram of Wind Electric Generator system

12
3.3.2 10kW Grid-Connected Solar PV System
Installation of PV power plants in studied locations is quite convenient, reduces the amount
of operations and the maintenance to be carried out, There is no disturbance while
operating the power plants. Energy conversion is environment friendly and does not
generate any carbon emissions. While manufacturing the solar power plant components
some carbon emission is possible. Bearing in mind all the possibilities, 10kW solar PV
plant is suggested for these selected locations to reduce the fossil fuels consumption. The
grid-connected solar PV plant consists of the following components (Shukla et al., 2016):
Solar module: The current solar module manufacturing industry develops a variety
of solar panel-based solar panels. However, in large scale PVC plant installations,
Crystalline solar module is widely used.
Inverters: inverters are chosen based on the rating of the solar power plant, for a
size of 10kW PV plant, one inverter whose rating is 12kW can be used.
Mountings: include structures on which PV panels, inverters, and other items are
placed. Mounting of PV panels is a major one to be considered here, make sure that
they are mounted in optimal angles as per the location conditions.
Grid connection: Sub-station and its components such as transformers, pure
measuring systems, protection systems are the most important components for grid
connection.
DC/AC cables: cables are required for connecting panels, inverter and to the grid.
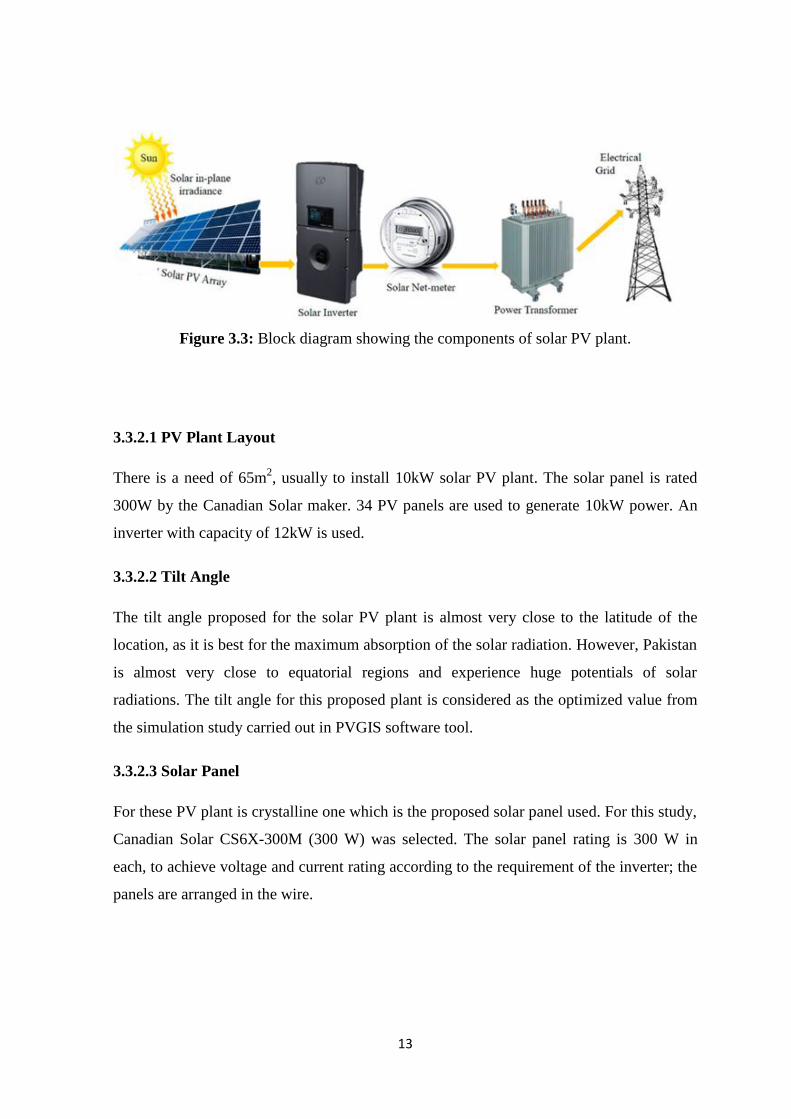
Figure 3.3 shows all the components of the solar PV plant with their respective
specification. In the suggested 10kW solar PV plant, if any excess power is generated it
can supplied to the grid. If there is any shortage the electricity provided to the grid can be
utilized. The phenomenon is generally referred as ‘net metering’.
13
Figure 3.3: Block diagram showing the components of solar PV plant.
3.3.2.1 PV Plant Layout
There is a need of 65m2, usually to install 10kW solar PV plant. The solar panel is rated
300W by the Canadian Solar maker. 34 PV panels are used to generate 10kW power. An
inverter with capacity of 12kW is used.
3.3.2.2 Tilt Angle
The tilt angle proposed for the solar PV plant is almost very close to the latitude of the
location, as it is best for the maximum absorption of the solar radiation. However, Pakistan
is almost very close to equatorial regions and experience huge potentials of solar
radiations. The tilt angle for this proposed plant is considered as the optimized value from
the simulation study carried out in PVGIS software tool.
3.3.2.3 Solar Panel
For these PV plant is crystalline one which is the proposed solar panel used. For this study,
Canadian Solar CS6X-300M (300 W) was selected. The solar panel rating is 300 W in
each, to achieve voltage and current rating according to the requirement of the inverter; the
panels are arranged in the wire.

14
3.3.2.4 Inverter
The proposed inverters with capacity of 10kW used are manufactured products by tHeiA
inverters. The inner rate of the selected THEIA series inverter is 10kWp. The internal
operating characteristics (input voltage) of the inverter DC voltage is 450–820 V DC and
the output of the proposed inverters voltage is 220 V AC with 50 Hz frequency. The
selected inverters performance is greater than 98%.
3.4 Simulation Software
3.4.1 Photovoltaic Geographical Information System (PVGIS) Simulation Tool
In this study, the solar resource potentials at the selected location are taken from the
radiation databases available from the PVGIS. During the PV plant modeling in PVGIS
simulation tool, solar radiation considered is from the PVGIS-CMSAF (Satellite
Application Facility on Climate Monitoring) database.
To simulate using PVGIS, few assumptions and inputs were used. The Latitude and
Longitude for the selected regions are given in Table3.1. Figure 3.4 shows the framework
of the simulation study using PVGIS carried out on the 45kW solar PV plant. PVGIS
allows the user to input the parameters required for RETScreen software such as slope or
tilt angle and azimuth angle of the PV module.

15
Figure 3.4:The framework of the simulation study using PVGIS
3.4.2 Clean Energy Management Software (RETScreen)
RETScreen is clean energy management software for energy efficiency, renewable energy
and cogeneration project feasibility analysis as well as ongoing energy performance
analysis.
In order to evaluate the technical, economic, and environmental effect of renewable energy
projects, RETScreen software was used in this study. RETScreen software is a useful tool
for analyzing and evaluating the feasibility of grid-connected renewable power system
(Clean Energy Project Analysis, 2005). In this study, the important economic measures
such as net present value (NPV), internal rate ofreturn (IRR), levelized cost of energy
(LCOE), payback period (PB), annual life cycle savings(ALCS), and benefit-cost-ratio (B-
C) were calculated using RETScreen software.

16
Net present value (NPV)The model calculates the Net Present Value (NPV) of the project, which is the value of all
future cash flows, discounted at the discount rate, in today's currency. NPV is related to the
internal rate of return (IRR). NPV is thus calculated at a time 0 corresponding to the
junction of the end of year 0 and the beginning of year 1. Under the NPV method, the
present value of all cash inflows is compared against the present value of all cash outflows
associated with an investment project. The difference between the present value of these
cash flows, called the NPV, determines whether or not the project is generally a financially
acceptable investment. Positive NPV values are an indicator of a potentially feasible
project. In using the net present value method, it is necessary to choose a rate for
discounting cash flows to present value. As a practical matter, organizations put much time
and study into the choice of a discount rate. The model calculates the NPV using the
cumulative after-tax cash flows. In cases where the user has selected not to conduct a tax
analysis, the NPV calculated will be that of the pre-tax cash flows.
= (1 + ) (3.7)Levelized cost of energy (LCOE)Levelized cost of energy is the ratio of discounted value of the total cost of the project
during its lifetime including both capital costs and O&M cost to the electricity generated
over the lifetime of the project. It is a robust measure to compare different electricity
generation technologies.
= (3.8)The internal rate of return (IRR)Is a discount rate at which NPV (net present value) becomes zero.In other words, IRR is
the opportunity cost at which the NPV becomes zero.

17
= (1 + ) (3.9)Simple payback (SP)The model calculates the simple payback (year), which represents the length of time that it
takes for a proposed facility to recoup its own initial cost, out of the revenue or savings it
generates. The basic premise of the simple payback method is that the more quickly the
cost of an investment can be recovered, the more desirable is the investment. For example,
in the case of the implementation of an energy project, a negative payback period would be
an indication that the annual costs incurred are higher than the annual savings generated.
= −+ + + − & + (3.10)Equity payback (EP)The model calculates the equity payback, which represents the length of time that it takes
for the owner of a facility to recoup its own initial investment (equity) out of the project
cash flows generated. The equity payback considers project cash flows from its inception
as well as the leverage (level of debt) of the project, which makes it a better time indicator
of the project merits than the simple payback. The model uses the year number and the
cumulative after-tax cash flows in order to calculate this value
= (3.11)Annual life cycle savings (ALCS)The model calculates the annual life cycle savings which is the levelized nominal yearly
savings having exactly the same life and net present value as the project. The annual life
cycle savings are calculated using the net present value, the discount rate and the project
life.

18
= 1 − ( ) (3.12)GHG emission reduction cost (GRC)The GHG reduction cost is calculated by dividing the annual life cycle savings of the
project by the net GHG reduction per year, averaged over the project life. For facilities
with a net increase in GHG emission, the GHG reduction cost is irrelevant and hence not
calculated. In order to calculate the true economic (not financial) cost of GHG reductions,
a number of other parameters, such as the GHG credits transaction fee, GHG reduction
credit rate, debt ratio, etc. should be set to 0. In addition "Income tax analysis" should not
be selected and other taxes should also be set to 0.
= ∆ (3.13)Benefit-Cost ratio (B-C)
The model calculates the net Benefit-Cost (B-C) ratio, which is the ratio of the net benefits
to costs of the project. Net benefits represent the present value of annual revenue and
savings less annual costs, while the cost is defined as the project equity.Ratios greater than
1 are indicative of profitable projects. The net benefit-cost ratio, similar to the profitability
index, leads to the same conclusion as the net present value indicator.
− = + (1 − )(1 − ) (3.14)whereN is the project life in years, is the after-tax cash flow inyear n, and r is the
discount rate, C is the total initial cost of the project, is thedebt ratio, B is the total
benefit of the project, is the incentivesand grants, is the annual energy savings or
income, isthe annual capacity savings or income, is the annual renewableenergy
(RE) production credit income, is the GHG reductionincome, & is the yearly
operation and maintenance costsincurred by the clean energy project, is the annual

19
cost of fuel, which is zero for renewable projects, and ∆ is the annual GHGemission
reduction.
Relationship between IRR, Discount rate and NPV
If IRR > Discount rate or opportunity cost of capital tis equal the NPV
always positive
If IRR <discount rate or opportunity cost of capital its equal the NPV is
always negative
If IRR = discount rate or opportunity cost of capital its equal the NPV is
zero
o As long as the NPV is positive, the project financially viable.
o The moment that NPV become negative , the project is not
financially viable
Figure 3.5 and Figure 3.6 shows the framework of the simulation study using RETScreen
carried out on 45kW and 40kWrooftop grid connected solar PV plant and wind power
turbine, respectively.

20
Figure 3.4:The framework of the simulation of 45kW solar PV using RETScreen
20
Figure 3.4:The framework of the simulation of 45kW solar PV using RETScreen
20
Figure 3.4:The framework of the simulation of 45kW solar PV using RETScreen

21
Figure 3.5:The framework of the simulation of 40kW wind system using RETScreen

22
3.5 Material Data
People usually receive weather information, water sources utilization, and its impact on the
environment from conventional media (TV, Radio, and newspapers) and social media.
Because of this continuous coverage of information, people are now better-informed and
more interested in environmental issues such as water resources and climate change. Many
studies have been conducted to gauge the opinions and awareness of people in different
countries with respect to water resource; these studies have focused on freshwater resource
and environment issues (Schumacher et al., 2019; Kardooni et al., 2018; Moula eta l.,
2013; Ozil et al., 2008).
For this study, the survey questions consist of 14 multiple-choice questions, which covered
various issues. The questionnaire designed for this study according to the previous
scientific researches (Kardooni et al., 2018; Moula eta l., 2013; Ozil et al., 2008). The
survey questions are divided into three parts: Part A: Background, Part B: General
information about renewable energy and their benefits. Part A of the survey schedule
elicits information relating to participants' background variables like participants' age,
gender, etc. Part B is concerned about the renewable energy, renewable technology, and
the renewable energy benefits. In addition, it is discussed the cost of the renewable energy
technologies. The survey equations were collected from respondents aged 22 years and
over with higher education qualifications by filling questionnaire data in tables. After that,
the quantitative analysis is conducted by summarizing all the data and calculating the
percentage of the choices for each question. Briefly, the survey equations were collected
from post-graduate students (Master and PhD) and random sampling technique was used
for collecting the data. The survey questionnaire is included in Appendix A. The sample
was approximately 31% female and 69% male, defined by sampling method. Age ranged
from 21 to 42 years old (below 25 years (50%), 25-30 (36%), 31-36 (11%) and 37-42
(1%)). For ethnic group, the questionnaires are collected from all universities located at
three populated regions in Northern Cyprus (Lefkoşa, Girne, and Gazimağusa).

23
CHAPTER 4
RESULTS AND DISCUSSION
4.1. Postgraduate Students Opinion Analysis
As mentioned before, the survey equations were collected from respondents aged 20 years
and over with higher education qualifications by filling questionnaire data in tables. The
group age, gender, and level of the participants that have been chosen for this study in
order to have an idea about the impact of the age, gender, and faculty of respondents on the
results are shown in Table 4.1. It is noticed that most of the respondents come from the
graduate school of applied science (44%) followed by a graduate school of health sciences
(34%). Moreover, Table 4.1 shows that the data have been collected more from male
respondent than female. As there is a higher male with a higher degree in most universities
in Northern Cyprus, this might explain some of the differences in experiences and ideas
about renewable energy and their technologies.
Moreover, the last question in Part A deals with the general question about the difference
between renewable and non-renewable energy. As shown in Table 4.1. The majority of
answering this question was Yes by 73% while 11% of respondents answered NO.
However, 16% of respondents have not idea about renewable and non-renewable energy.
At the beginning of Part B, the students were asked to self-identify their level of
knowledge and interest in renewable energy (Figure 4.1). It is found that 32% of the
participants are familiar with renewable energy, their technologies, and benefits, while
41% of the participants indicated that they know very little about renewable energy
technologies. In addition, only 27% of the participants are environmentally conscious and
familiar with renewable energy, their technologies, and benefits. On the other hand, it can
be seen that percentages of “very little” female and the students from the graduate school
of health sciences was closed to each other, which about 23%. This result shows that more
effort is required to widen the information base about renewable energy, their technologies,

24
and benefits amongst female students and the students who are from the graduate school of
health science.
Table 4.1: Results of survey questions of Part A
36%
11% 3%
Age group of respondents
Less than 25 years
25-30 year
31-36years
37-42years
30%
Gender
Male Female
24
and benefits amongst female students and the students who are from the graduate school of
health science.
Table 4.1: Results of survey questions of Part A
50%
Age group of respondents
Less than 25 years
22%
34%
Graduate school
Applied sciences
Social sciences
Health sciences
70%
Gender
Female
78%
Graduate program
Doctorate ProgramMaster Program
24
and benefits amongst female students and the students who are from the graduate school of
health science.
Table 4.1: Results of survey questions of Part A
44%
Graduate school
22%
Graduate program
Doctorate ProgramMaster Program

25
Difference between renewable and non-renewable energy
25
73%
11%
16%
Difference between renewable and non-renewable energy
Yes No Unsure
25
Difference between renewable and non-renewable energy

26
Figure 4.1: Level of interest in renewable energy

27
The second question in Part B deals with the level of concerning about renewable energy
sources as shown in Table 4.2. The sum of responses in the “Neither concerned nor very
concerned” and “Concerned” categories are close to each other about the renewable energy
sources in Northern Cyprus, represent about 60% of the respondents. Significantly, Male
students especially who are from the graduate school of applied or social science are more
concerned about renewable energy sources and technologies and their benefits, probably
because They know that Northern Cyprus has very high energy costs, both in urban centers
and rural areas.

28
Table 4.2: Results of the second question in Part B
28%
5%
5%28%5%
13%16%
Very unconcerned
Male Female Doctorate
Master Applied sciences Social sciences
Health sciences
14%
18%
11%21%
16%
7%
13%
Neither concerned nor very concerned
Male Female Doctorate
Master Applied sciences Social sciences
Health sciences
28
Table 4.2: Results of the second question in Part B
5%
Doctorate
Social sciences
10%
8% 15%
Less unconcerned
Male Female
Master Applied sciences
Health sciences
Neither concerned nor very concerned
Doctorate
Social sciences
30%
21%
6%7%
Concerned
Male Female
Master Applied sciences
Health sciences
28
Table 4.2: Results of the second question in Part B
18%
16%
0%33%
15%
Less unconcerned
Female Doctorate
Applied sciences Social sciences
25%
7%
4%30%
7%
Concerned
Female Doctorate
Applied sciences Social sciences

29
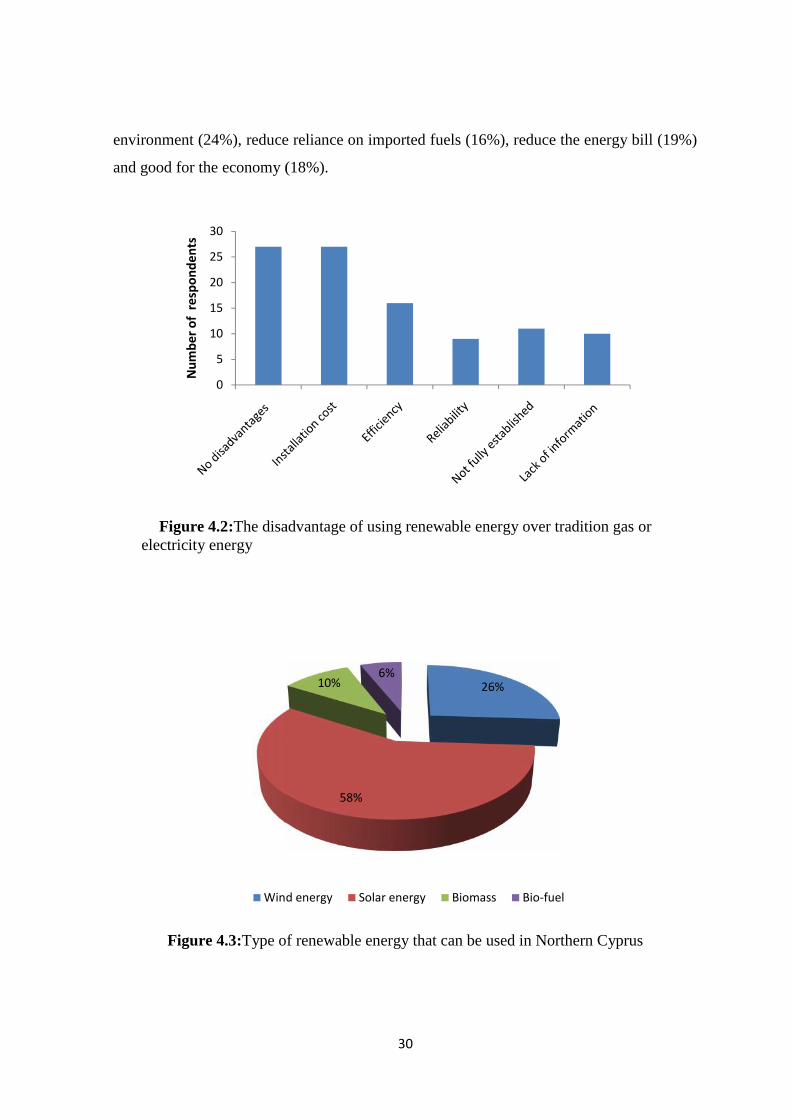
The third question in Part B (Figure 4.2) is focused on the disadvantage of renewable
energy over tradition gas or electric energy. 27% of respondents were considered no
disadvantage of using renewable energy and the insulation cost for this energy is high,
while 10% of respondents do not have an idea about renewable energy technologies and
how it works. Thus, it can be concluded that people have awarded about renewable energy,
technologies, their benefits, and influence on the environment, human activities and health.
The fourth question tests the respondents’ knowledge about the different kinds of
renewable sources and technologies that can be used in Northern Cyprus. As it can be
noted the question itself provided them with four different options, namely wind energy,
solar energy, biomass, and biofuel. As shown in Figure 4.3, 58% of respondent were
selected solar energy as a source for generating electricity in Northern Cyprus. However,
26% and 16% of respondent have chosen wind energy and other energies, respectively.
This question was more of an informative type, which educated at least 70% of the people
about the existing technologies while testing their knowledge. Notably, it was not very
properly formulated to be able to extract awareness of particular renewable technology
among participants.
In identifying the benefits of energy produced from renewable energy sources, the three
groups of students performed similarly, as seen in Figure 4.4. It is curious that a higher
percentage of graduate students agreed that renewable energy sources good for the
23%
10%
12%22%
15%
10%8%
Very concerned
Male Female Doctorate
Master Applied sciences Social sciences
Health sciences
29
The third question in Part B (Figure 4.2) is focused on the disadvantage of renewable
energy over tradition gas or electric energy. 27% of respondents were considered no
disadvantage of using renewable energy and the insulation cost for this energy is high,
while 10% of respondents do not have an idea about renewable energy technologies and
how it works. Thus, it can be concluded that people have awarded about renewable energy,
technologies, their benefits, and influence on the environment, human activities and health.
The fourth question tests the respondents’ knowledge about the different kinds of
renewable sources and technologies that can be used in Northern Cyprus. As it can be
noted the question itself provided them with four different options, namely wind energy,
solar energy, biomass, and biofuel. As shown in Figure 4.3, 58% of respondent were
selected solar energy as a source for generating electricity in Northern Cyprus. However,
26% and 16% of respondent have chosen wind energy and other energies, respectively.
This question was more of an informative type, which educated at least 70% of the people
about the existing technologies while testing their knowledge. Notably, it was not very
properly formulated to be able to extract awareness of particular renewable technology
among participants.
In identifying the benefits of energy produced from renewable energy sources, the three
groups of students performed similarly, as seen in Figure 4.4. It is curious that a higher
percentage of graduate students agreed that renewable energy sources good for the
10%
Doctorate
Social sciences
05
101520253035
Very
unc
once
rned
Less
unc
once
rnedNu
mbe
r of
resp
onde
nts
29
The third question in Part B (Figure 4.2) is focused on the disadvantage of renewable
energy over tradition gas or electric energy. 27% of respondents were considered no
disadvantage of using renewable energy and the insulation cost for this energy is high,
while 10% of respondents do not have an idea about renewable energy technologies and
how it works. Thus, it can be concluded that people have awarded about renewable energy,
technologies, their benefits, and influence on the environment, human activities and health.
The fourth question tests the respondents’ knowledge about the different kinds of
renewable sources and technologies that can be used in Northern Cyprus. As it can be
noted the question itself provided them with four different options, namely wind energy,
solar energy, biomass, and biofuel. As shown in Figure 4.3, 58% of respondent were
selected solar energy as a source for generating electricity in Northern Cyprus. However,
26% and 16% of respondent have chosen wind energy and other energies, respectively.
This question was more of an informative type, which educated at least 70% of the people
about the existing technologies while testing their knowledge. Notably, it was not very
properly formulated to be able to extract awareness of particular renewable technology
among participants.
In identifying the benefits of energy produced from renewable energy sources, the three
groups of students performed similarly, as seen in Figure 4.4. It is curious that a higher
percentage of graduate students agreed that renewable energy sources good for the
Neith
er co
ncer
ned
nor v
ery
conc
erne
d
Conc
erne
d
Very
conc
erne
d
30
environment (24%), reduce reliance on imported fuels (16%), reduce the energy bill (19%)
and good for the economy (18%).
Figure 4.2:The disadvantage of using renewable energy over tradition gas orelectricity energy
Figure 4.3:Type of renewable energy that can be used in Northern Cyprus
0
5
10
15
20
25
30
Num
ber o
f re
spon
dent
s
Wind energy
30
environment (24%), reduce reliance on imported fuels (16%), reduce the energy bill (19%)
and good for the economy (18%).
Figure 4.2:The disadvantage of using renewable energy over tradition gas orelectricity energy
Figure 4.3:Type of renewable energy that can be used in Northern Cyprus
26%
58%
10%6%
Wind energy Solar energy Biomass Bio-fuel
30
environment (24%), reduce reliance on imported fuels (16%), reduce the energy bill (19%)
and good for the economy (18%).
Figure 4.2:The disadvantage of using renewable energy over tradition gas orelectricity energy
Figure 4.3:Type of renewable energy that can be used in Northern Cyprus
Bio-fuel

31
Figure 4.4:Benefits of generating electricity from renewable energy sources;A: Lower energy bills, B: Good for the environment, C: Less relianceonimported oil and natural gas, D: Less reliance on electric utilitycompanies, E: There will not be a need for investment in nuclearpower plants, F: Good for the economy, G: There will not be anybenefit.
The fifth question is more focused on the difficulties of purchasing a renewable energy
system at universities or cities in Northern Cyprus. Figure 4.5shows the factors that have
an impact on the purchasing a renewable energy system at the region. It can be seen that
respondents identified the choosing the correct technology, obtaining the correct and
reliable information about renewable energy system have a significantly positive impact on
the purchasing a renewable energy system at a specific region. This is because of
respondents who are aware of the benefits of having a renewable energy system in the
region.
12%
10%
31
Figure 4.4:Benefits of generating electricity from renewable energy sources;A: Lower energy bills, B: Good for the environment, C: Less relianceonimported oil and natural gas, D: Less reliance on electric utilitycompanies, E: There will not be a need for investment in nuclearpower plants, F: Good for the economy, G: There will not be anybenefit.
The fifth question is more focused on the difficulties of purchasing a renewable energy
system at universities or cities in Northern Cyprus. Figure 4.5shows the factors that have
an impact on the purchasing a renewable energy system at the region. It can be seen that
respondents identified the choosing the correct technology, obtaining the correct and
reliable information about renewable energy system have a significantly positive impact on
the purchasing a renewable energy system at a specific region. This is because of
respondents who are aware of the benefits of having a renewable energy system in the
region.
19%
24%
16%
12%
18%
1%
A B C D E F G
31
Figure 4.4:Benefits of generating electricity from renewable energy sources;A: Lower energy bills, B: Good for the environment, C: Less relianceonimported oil and natural gas, D: Less reliance on electric utilitycompanies, E: There will not be a need for investment in nuclearpower plants, F: Good for the economy, G: There will not be anybenefit.
The fifth question is more focused on the difficulties of purchasing a renewable energy
system at universities or cities in Northern Cyprus. Figure 4.5shows the factors that have
an impact on the purchasing a renewable energy system at the region. It can be seen that
respondents identified the choosing the correct technology, obtaining the correct and
reliable information about renewable energy system have a significantly positive impact on
the purchasing a renewable energy system at a specific region. This is because of
respondents who are aware of the benefits of having a renewable energy system in the
region.

32
Figure 4.5:Purchasing a renewable energy system for universities or cities inNorthern Cyprus
It can notice the difference of opinion where 65% of respondents suggest that solar/wind
power plants are the best option for generating electricity in Northern Cyprus as shown in
Figure 4.6. According to study results, respondents do care about the solar/wind energy
system for producing electricity at any regions in Northern Cyprus since the results are
exactly same as in the fourth question in Part B where only the suitable energy was asked
without considering the generating electricity in Future.
010203040506070
Initi
al C
ost
Find
ing
a tr
ustw
orth
yco
ntra
ctor
Choo
sing
the
corr
ect
tech
nolo
gy
Obta
inin
g co
rrec
t and
relia
ble
info
rmat
ion
Obta
inin
g th
e be
stpo
ssib
le p
rice
Good
retu
rn o
nin
vest
men
t
Tech
nolo
gy b
ecom
esob
sole
te to
o qu
icklyNu
mbe
r of
resp
onde
nts

33
Figure 4.6:Future energy needs for the universities and cities
4.2. Wind Characteristics and Wind Energy Potential
4.2.1 Wind Speed CharacteristicsVariations of the monthly mean wind speeds at each station for the years from 2010 to
2016 are illustrated in Figure 4.7. Moreover, the figure also shows the overall monthly
mean wind speeds for the entire measurement period. The average monthly wind speeds at
Gazimağusa vary from 3.7 m/s to 7.2 m/s and the general trend is that the mean wind speed
decreases from March to August and then starts to increase afterwards for the rest of the
year. In the graph plotted for Lefkoşa, the lowest wind speeds are around 1.5 m/s during
November and highest values appear in June as 3.5 m/s. The average values for Girne
illustrate that the minimum and maximum average wind speeds vary between
approximately 1.5 m/s and 3.4 m/s for region.
Nuclear power plants
Natural gas power plants
33
Figure 4.6:Future energy needs for the universities and cities
4.2. Wind Characteristics and Wind Energy Potential
4.2.1 Wind Speed CharacteristicsVariations of the monthly mean wind speeds at each station for the years from 2010 to
2016 are illustrated in Figure 4.7. Moreover, the figure also shows the overall monthly
mean wind speeds for the entire measurement period. The average monthly wind speeds at
Gazimağusa vary from 3.7 m/s to 7.2 m/s and the general trend is that the mean wind speed
decreases from March to August and then starts to increase afterwards for the rest of the
year. In the graph plotted for Lefkoşa, the lowest wind speeds are around 1.5 m/s during
November and highest values appear in June as 3.5 m/s. The average values for Girne
illustrate that the minimum and maximum average wind speeds vary between
approximately 1.5 m/s and 3.4 m/s for region.
12%
65%
19%
4%
Nuclear power plants solar or wind power plants
Natural gas power plants Coal fired power plants
33
Figure 4.6:Future energy needs for the universities and cities
4.2. Wind Characteristics and Wind Energy Potential
4.2.1 Wind Speed CharacteristicsVariations of the monthly mean wind speeds at each station for the years from 2010 to
2016 are illustrated in Figure 4.7. Moreover, the figure also shows the overall monthly
mean wind speeds for the entire measurement period. The average monthly wind speeds at
Gazimağusa vary from 3.7 m/s to 7.2 m/s and the general trend is that the mean wind speed
decreases from March to August and then starts to increase afterwards for the rest of the
year. In the graph plotted for Lefkoşa, the lowest wind speeds are around 1.5 m/s during
November and highest values appear in June as 3.5 m/s. The average values for Girne
illustrate that the minimum and maximum average wind speeds vary between
approximately 1.5 m/s and 3.4 m/s for region.
solar or wind power plants

34
Figure 4.7: Monthly variation of the mean wind speed

35
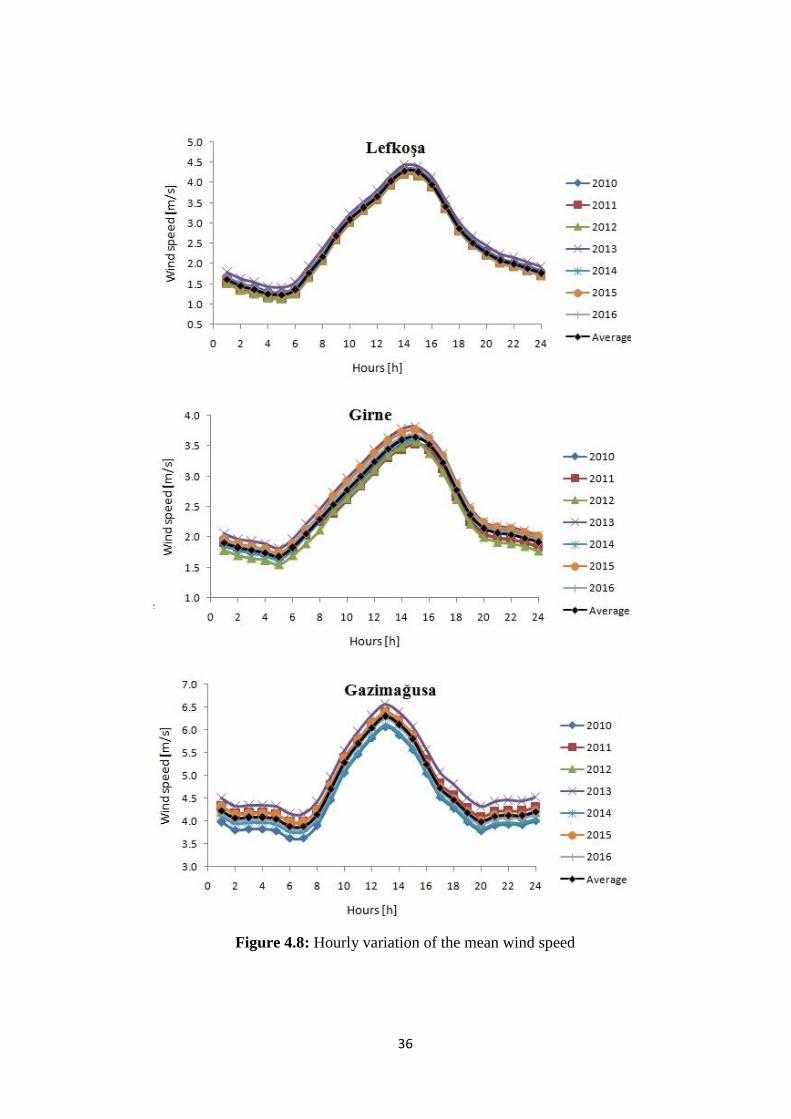
The hourly variations of the mean wind speeds for each year from 2010 to 2016 have been
presented in Figure 4.8. Furthermore, the overall average hourly wind speed variation for
the entire measurement period from 2010 to 2016 has also been illustrated.
It is evident from the charts in Figure 4.8that similar patterns within the 24-h period are
observed. The hourly average wind speeds slowly decrease early in the mornings and then
start to increase until they reach a peak. After the highest values of the period, wind speeds
are observed to decrease in Lefkoşa and Girne, except at Gazimağusa.
The average wind speed at the Gazimağusa region decreases from 1 a.m to 8 a.m and
shows a sharp increase afterward, where it reaches its maximum value at around 1 p.m.
The wind speeds decrease after 1 p.m in Famagusta until 8 p.m and the mean values show
a marginal increase through the night. Overall, it can be determined from the data in Figure
4.8, that the coastal areas record maximum average wind speeds late in the afternoon and
the minimum value occurs between 4 and 6 a.m. In contrast, the maximum wind speeds
were observed at 2 p.m and the minimum speeds were between 3 a.m and 4 a.m. in
Lefkoşa, which is the capital city of the country with the highest building density.
36
Figure 4.8: Hourly variation of the mean wind speed

37
4.2.2 Wind Speed Frequency Distribution at 10m HeightTable 4.3 illustrates the shape (k) and scale (c) values evaluated at each location for the entire wind
data obtained for the six-year period between 2010 and 2016. Additionally, Figure 4.9 presents the
yearly variations of the shape and scale parameters for the 7-year period in six different locations.
It can be noted that the calculated yearly k parameter does not show significant differences
throughout the years for all measurement locations. However, the c parameter shows profound
changes during the measurement period. Moreover, the annual wind speed frequency distribution
data from each region are presented in Figure 4.10 for the years from 2010 to 2016.
Table 4.3:Weibull parameters for each region (2010-2016) at a height of 10m
RegionParameters Mean
[m/s] WPD [W/m2]Kolmogorov-Smirnov test
k c [m/s]
Lefkoşa 2.80 2.88 2.56 15.05 0.851
Girne 4.12 2.76 2.50 11.72 0.395
Gazimağusa 5.93 5.02 4.65 68.49 0.059

38
Figure 4.9: Yearly variation of shape and scale parameters for the areas at 10mHeight
2
3
3
4
4
5
5
6
23344556677
2010 2011 2012 2013 2014 2015 2016 Whole
c [m
/s]
K
Gazimağusa Lefkoşa Girne Gazimağusa Lefkoşa Girne

39
Figure 4.10: Wind speed probability frequency for the whole (2010-2016) atheight 10m

40
4.2.3 Wind Speed and Wind Power Density at Various HeightsThe optimum wind speed for a typical wind turbine should be equal to or higher than 6.7
m/s. At the same time, it is important to note that wind speeds higher than 11 m/s can be
dangerous; therefore, it is not safe to invest in wind turbine in the regions that have a wind
speed of more than 11 m/s wind speed during the year [40]. The roughness coefficient is
expressed by the exponent α, which is associated with the characteristics of the land
surface and its value varies between 0.05 and 0.5 [40]. The surface roughness values (α),
determined by using Eq. (9) for different locations, is given in Table 4.4.
Table 4.4: Roughness values for different sitesLocations Roughness value (α)Gazimağusa 0.235
Lefkoşa 0.289
Girne 0.290
In this paper, annual mean wind speeds are estimated for different heights of 30, 50, 80,
and 90m by using the roughness coefficients listed in Table 5. Wind speed increases as one
moves higher above the ground and this variation is called the wind shear profile. Figure
13 presents the wind shear profiles at three different regions that are included in this study.

41
Figure 4.11: Vertical wind shear profile at six studied locations
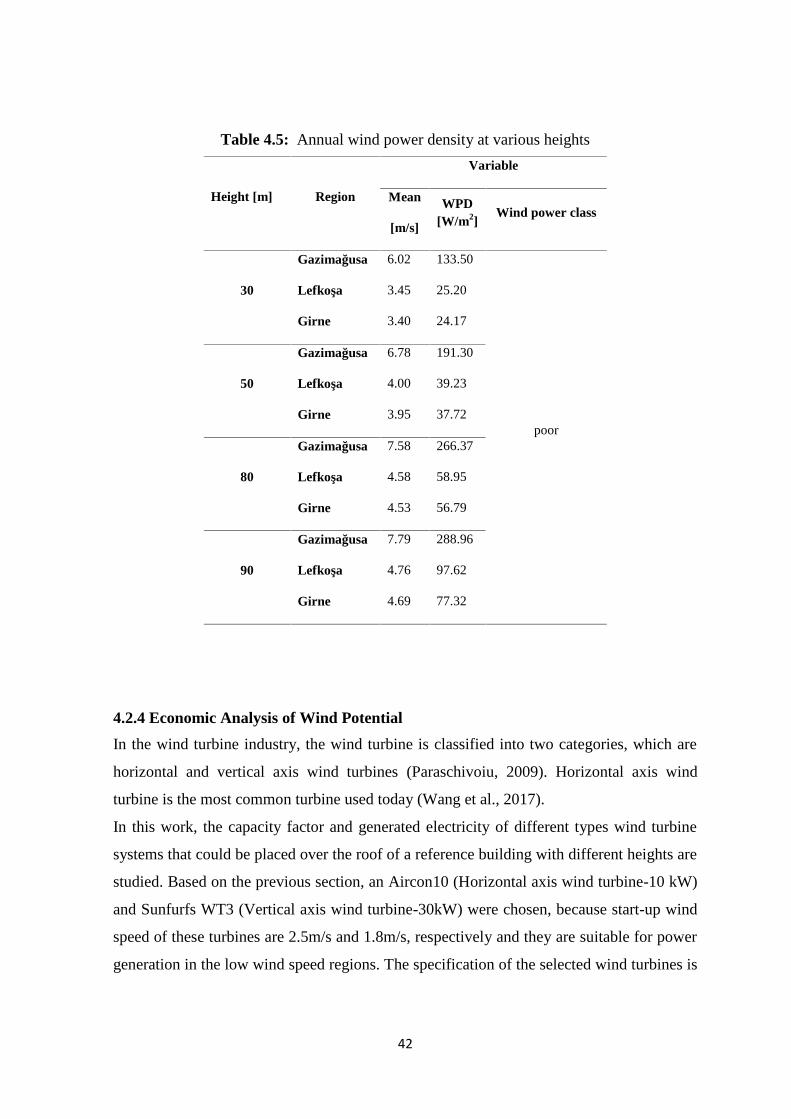
For comparison purposes, the calculated annual WPD at various heights are presented in
Table 4.5. The kinetic energy potential of the wind at each site is characterised by the mean
power density ranges given in the literature [41]. Among the sites investigated in this
study, the maximum estimated power density became prominent in the Gazimağusa region,
where the highest density is 288.96 W/m2 at a height of 90m (Table 4.5). According to the
results of the current study and the mean power density ranges found in the literature, all of
the locations chosen for investigation indicate poor wind energy potential. Therefore, high
capacity wind turbines (MWs) are not feasible to be investigated in these areas.
Nevertheless, small-scale wind turbines can be used to gather the wind energy potential in
these regions.
0102030405060708090
100
2 3 4 5 6 7 8
Heig
ht a
bove
the
grou
nd [m
]
Mean wind speed [m/s]
Gazimağusa
Lefkoşa
Girne
42
Table 4.5: Annual wind power density at various heights
Height [m] Region
Variable
Mean
[m/s]
WPD[W/m2] Wind power class
30
Gazimağusa 6.02 133.50
poor
Lefkoşa 3.45 25.20
Girne 3.40 24.17
50
Gazimağusa 6.78 191.30
Lefkoşa 4.00 39.23
Girne 3.95 37.72
80
Gazimağusa 7.58 266.37
Lefkoşa 4.58 58.95
Girne 4.53 56.79
90
Gazimağusa 7.79 288.96
Lefkoşa 4.76 97.62
Girne 4.69 77.32
4.2.4 Economic Analysis of Wind PotentialIn the wind turbine industry, the wind turbine is classified into two categories, which are
horizontal and vertical axis wind turbines (Paraschivoiu, 2009). Horizontal axis wind
turbine is the most common turbine used today (Wang et al., 2017).
In this work, the capacity factor and generated electricity of different types wind turbine
systems that could be placed over the roof of a reference building with different heights are
studied. Based on the previous section, an Aircon10 (Horizontal axis wind turbine-10 kW)
and Sunfurfs WT3 (Vertical axis wind turbine-30kW) were chosen, because start-up wind
speed of these turbines are 2.5m/s and 1.8m/s, respectively and they are suitable for power
generation in the low wind speed regions. The specification of the selected wind turbines is

43
tabulated in Table 4.6. Furthermore, Table 4.7presents various assumptions that are used to
examine the economics of wind energy system at three selected regions.
Table 4.6: Characteristics of the selected wind turbineTechnical data Aircon10 Sunfurfs WT3
Rated output capacity [kW] 9.8≈10 10
Start-up wind speed [m/s] - 1.8
Cut-in wind speed 2.5Wind speed≥2.9m/s should continue to at least 30
minutes
Rated wind speed [m/s] 11 8
Cut-out wind speed [m/s] 32 -
Height [m] 12 12
Rotor diameter [m] 9
Cost [$] 22050* 29800
* The cost of wind turbine based on the rated power of the turbine (Gökçek&Genç, 2009)

44
Table 4.7: Values and assumptions for the economics of wind energyParticular Value
wind turbine capacity [kW] 10
Turbine hub height [m] 12
A lifetime of the project [year] 20
Inflation rate [%] 3
Discount rate [%] 12
Electricity export escalation rate [%] 5/15*
The initial cost of wind turbine [$/kW] See Table 6
Wind Turbine Cost Share [%] 70
Grid connection Cost Share [%] 12
Civil work Cost Share [%] 9
Other Capital Cost Share [%] 8
O & M cost [%] 0
In order to a feasibility study for a wind rooftop system at Lefkoşa and Girne,electricity export escalation rate is assumed 15 %.
Table 4.8 presents the results of the capacity factor (CF) and annual generated electricity
(GE) of the 10kW wind systems for all studied regions. It is observed that the values of CF
of wind systems at Gazimağusa is the highest compared to other regions and are ranged
from 20.5% to 31.6%, which deepens on the heights. The reason of these substantial
increases is that cut-in wind speed, wind turbine start to rotate and generate power at wind
speed is equal to cut-in speed, maximize the generation time, which leads to increase the
capacity factor of the system. Additionally, it is noticed that the CF values at Lefkoşa and
Girne are very low, which can be considered the wind rooftop systems at these two cities
are not suitable for generating electricity.
Moreover, the cost of unit energy per kWh based on the PVC method for wind turbine
systems at studied locations is presented in Table 4.8. It is noticed that the horizontal wind
turbine has lower values of electricity cost compared to vertical axis wind turbine for all
studied regions. In addition, it is observed that Gazimağusa has the lowest values of

45
electricity cost compared to other regions. Furthermore, the wind system of Gazimağusa is
a more economical option for generating electricity because of higher values of capacity
factor as well as lower values of UCE values.
Table 4.8: Capacity factor and Generated electricity of wind turbine system
RegionHeight
[m]
Aircon10 Sunfurfs WT3
Buildingfloors CF [%]
GE[kWh/year] [$/kW]
CF [%] GE [kWh/year][$/kW]
Lefkoşa
3 22 6.4 5525 0.364 9.3 7495 0.411
4 25 7.1 6069 0.332 10.1 8678 0.378
5 28 8.9 7657 0.318 12.7 10924 0.331
6 31 10 8734 0.278 14.5 12463 0.302
Girne
3 22 6.4 5499 0.368 10.2 8922 0.442
4 25 7.1 6070 0.338 11.1 9723 0.401
5 28 9.6 8226 0.249 15.1 13192 0.296
6 31 10.1 8668 0.223 17.2 14755 0.261
Gazimağusa
3 22 20.5 17626 0.138 27.3 23459 0.141
4 25 22 18862 0.129 28.9 24800 0.133
5 28 23.3 19993 0.122 30.12 25120 0.127
6 31 24.5 21033 0.116 31.6 27120 0.121

46
3.3. Solar Radiation Characteristics and Solar Energy Potential
3.3.1 Global Solar Radiation CharacteristicsFigure 4.12shows the mean monthly global solar radiation and sunshine duration variations
throughout the years at Girne and Lefkoşa. In addition, the mean monthly global solar
radiation variations for all years at three selected regions in Northern Cyprus is shown in
Figure 4.12. It is observed from Figure 11 that the monthly average solar radiation values
range from 228.584 to 676.789 Cla/cm2-day for Lefkoşa, 178.930 to 630.224 Cla/cm2-day
for Girne and 205.718 to 672.183 Cla/cm2-day Gazimağusa. During the period of
measurement, the highest mean monthly global solar radiation occurred in summer (June,
July, and August) at all selected cities, while the minimum occurred in winter (December,
January, and February).
Figure 4.12:Average global solar radiation during the investigated period

47
Based on Figure 4.13, it is observed that Lefkoşa has a higher annual global solar radiation
followed by Gazimağusa. The mean monthly sunshine duration varies from 5.263 to
11.429 h/day for Lefkoşa, 4.158 to 11.599 h/day for Girne and 4.475-11.168 h/day
Gazimağusa as shown in Figure 4.13. Additionally, it is found that the mean monthly
sunshine duration for all cities is approximately 8h/day. Moreover, it can be seen that the
annual sunshine duration for the studied regions ranged between 7.914 h/day and 11. h/day
for all regions (Figure 4.13).
Figure 4.13:Average sunshine duration during the investigated period

48
4.3.2 Global Solar Radiation Distributions
The scientific researchers were investigated the use of probability density function in
modeling monthly average global solar radiation. For instant, Kassem et al. (2018)
foundthat Logistic distribution function was the best distribution for analyzing the global
solar radiation of Girne and Lefkoşa. More recent, AyodeleandOgunjuyigbe(2015)
proposed a probability distribution of clearness index for predicting the global solar. They
found that logistic distribution provided the best fit for clearness index and the proposed
method is effective in predicting the monthly average global solar radiation. Logistic
distribution has the shape of normal distribution but with a heavier tail i.e. higher kurtosis.
The ( )and the ( ) of this distribution can be expressed as Eq.s (23) and (24)
respectively.
( ) = 1 + − − ∞ < < ∞(4.1)( ) = 11 + − − ∞ < < ∞(4.2)
where L and S are location parameter and the scale parameter, respectively.
Therefore, logistic distribution function was used to analysis the global solar radiation data
of three selected regions. The ( ) curves of global solar radiation for various periods are
shown in Figure4.14.

49
Figure 4.14: Fitting f(G) to the global solar radiation data of studied regions
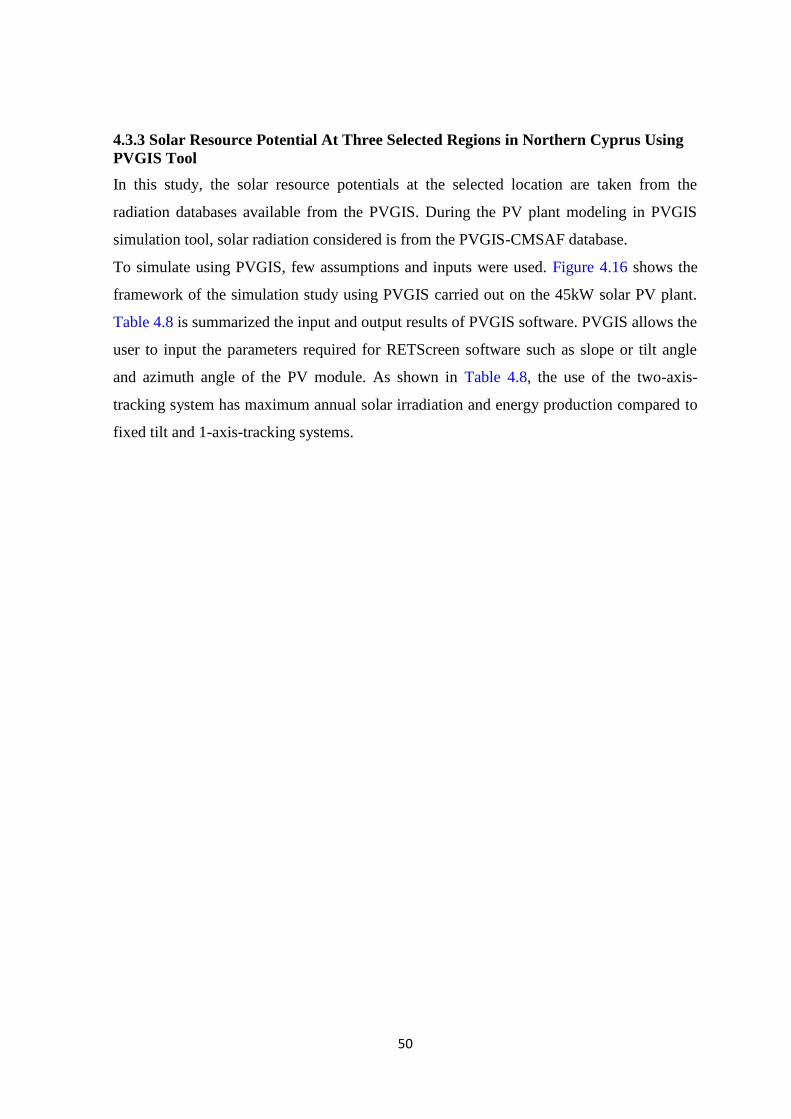
50
4.3.3 Solar Resource Potential At Three Selected Regions in Northern Cyprus UsingPVGIS ToolIn this study, the solar resource potentials at the selected location are taken from the
radiation databases available from the PVGIS. During the PV plant modeling in PVGIS
simulation tool, solar radiation considered is from the PVGIS-CMSAF database.
To simulate using PVGIS, few assumptions and inputs were used. Figure 4.16 shows the
framework of the simulation study using PVGIS carried out on the 45kW solar PV plant.
Table 4.8 is summarized the input and output results of PVGIS software. PVGIS allows the
user to input the parameters required for RETScreen software such as slope or tilt angle
and azimuth angle of the PV module. As shown in Table 4.8, the use of the two-axis-
tracking system has maximum annual solar irradiation and energy production compared to
fixed tilt and 1-axis-tracking systems.

51
Figure 4.15: The framework of the simulation study using PVGIS
Considering the PVGIS Simulation, for Freestanding system, maximum solar radiation
potential at selected regions is achieved in July followed by August (Figure 4.16). The
minimum potential is observed in January for Lefkoşa and in December for Girne and
Gazimağusa (Figure 4.16). Moreover, it is found that for 1-axis and 2-axis tracking system,
the maximum radiation is observed in the month of July for all studied regions, while the
minimum one is recorded in January for Lefkoşa and Gazimağusa and in December for
Girne .It is found that Gazimağusa has the maximum annual solar radiation potential
compared to other regions. In addition, the energy generations on a monthly and annually
basis based on PVGIS are shown in Figure 4.16. It is found that 2-axis tracking mode has
the maximum energy production compared to Freestanding and 1-axis tracking mode.

52
Figure 4.16: Average monthly electricity production and in-plane irradiation forstudied regions using PVGIS simulation tool

53
Figure 4.16: Continued

54
4.3.4 Economic Analysis of Solar Energy PotentialThe economic analysis describes the cash flow return on investment during the utilization
of the PV plant. The economic parameters used for the study is assumed based on previous
scientific research. Thus, the economic parameters that used for economic studies of PV
plants are presented in Table 4.9.
The annual produced electricity exported to grid and CF values of 45MW PV plants for
three different tracking modes are shown in Table 4.10. In general, the generated electricity
and CF values of use tracking system are higher than fixed-tilt option (Mohammadi et al.,
2018). Because trackers minimize the angle of incidence between the incoming solar
radiation and the surface of PV panels and therefore maximize the amount of solar
radiation absorbed by PV panels (Mohammadi et al., 2018). Therefore, it is observed that
the highest generated electricity and CF is obtained from the two-axis tracking system,
while, the lowest one obtained from Fixed-axis system as shown in Table 4.10.
The results of economic performance of small-scale plants for various tracking-mounting
options are tabulated in Table4.10. The results indicated that economic feasibility of PV
plants for electricity power generation provided an estimated cost ranging from 0.035 to
0.053$/kWh of energy produced under different tracking-mounting options for all studied
regions. In addition, it is can be seen that 2-axis tracking is more economical option for
generating electricity in Northern Cyprus because of higher values of NPV, BCR, ALCS,
and IRR as well as lower values of EB, SB and LCOE values.

55
Table 4.8: Summary of grid-connected performance of 10-kW PV plant using PVGIS
TrackingSystem
Parameters Lefkoşa Girne Gazimağusa
Input
Location [Lat/Lon] 35.164/33.315 35.340/ 33.319 35.117/33.950Database used PVGIS-
CMSAFPVGIS-CMSAF
PVGIS-CMSAF
PV technologyCrystalline
siliconCrystalline
siliconCrystalline
siliconSystem loss [%] 14% 14% 14%
Freestanding(Fixed)
Output
Slope angle [°] 31 31 32Azimuth angle [°] -8 -5 -4Yearly PV energyproduction [kWh]
17300 17500 18100
Yearly in-planeirradiation [kWh/m2]
2240 2280 2270
1-axis Output
Slope angle [°] 53 53 54Azimuth angle [°] 0 0 0Yearly PV energyproduction [kWh]
23500 23700 24900
Yearly in-planeirradiation [kWh/m2]
3010 3050 3090
2-axis Output
Slope angle [°] - - -Azimuth angle [°] - - -Yearly PV energyproduction [kWh]
24400 24600 25900
Yearly in-planeirradiation [kWh/m2]
3140 3170 3230

56
Table 4.9: Economic parameters used for economic analysis of grid-connected 10kWPV plant
Parameters ValueTechnical dataPlant capacity 10kWPV module type mono-Si - CS6X-300MLosses 15%Number of PV module 34Solar collector area 65 m2
Capital CostCS6X-300M 250-300$Inverter (12kW) 1500-3000$Total capital cost 12000$O&M costFixed tiled system 1.5 c$/kWh1-axis tracking system 1.8 c$/kWh2-axis tracking system 1.8 c$/kWhOther parametersInflation rate 7.2%Discount rate 3%Project life 25 yearElectricity export escalation rate 5%

57
Table 4.10: Performance of 10kW PV power plants
City Tracking mode CF [%] Generated electricity[kWh/year]
Electricity export revenue[$]
Lefk
oşa
Fixed 17.8 15873 1587One-axis 22.9 20450 2045Two-axis 24.2 21651 2165
Economic performance
Tracking mode NPV[$]
EPB[year]
SPB[year]
LCOE[$/kWh] BCR ALCS [$/year] IRR
[%]Fixed 36834 4.1 7.6 0.053 11.2 2115 30.1One-axis 51670 2.7 5.9 0.041 15.4 2967 42.2Two-axis 55562 2.5 5.5 0.039 16.4 3191 45.4
City Tracking mode CF [%] Generated electricity[kWh/year]
Electricity export revenue[$]
Gir
ne
Fixed 17.8 15918 1592One-axis 22.9 20497 2050Two-axis 24.2 21691 2169
Economic performance
Tracking mode NPV[$]
EPB[year]
SPB[year]
LCOE[$/kWh] BCR ALCS [$/year] IRR
[%]Fixed 36981 4.1 7.5 0.053 11.3 2124 30.2One-axis 51820 2.7 5.9 0.041 15.4 2976 42.3Two-axis 55693 2.5 5.5 0.039 16.5 3198 45.5
City Tracking mode CF [%] Generated electricity[kWh/year]
Electricity export revenue[$]
Gaz
imağ
usa
Fixed 19.2 17173 1717One-axis 25.1 22451 2245Two-axis 26.6 23760 2376
Economic performance
Tracking mode NPV[$]
EPB[year]
SPB[year]
LCOE[$/kWh] BCR ALCS [$/year] IRR
[%]Fixed 41047 3.6 7 0.049 12.4 2357 33.5One-axis 58153 2.4 5.3 0.037 17.2 3340 47.6Two-axis 62396 2.2 5.1 0.035 18.3 3583 51.2
4.4 DiscussionThis particular paper aimed to depict the attitudes of people on a series of issues related to
electricity production, renewable energy and explore the impact of the public's knowledge
about renewable energy technologies. The current study found that the cost of renewable
energy has a direct impact on public intention to use renewable energy technologies. It
means that public perception about the cost of renewable energy is one of the key elements
to encourage or discourage them from using renewable energy technologies. In terms of
cost, another finding was that most of the respondents believed that the price of renewable
energy products is expensive. In addition, based on public opinion, it is found that
approximately 95% of respondent were selected solar energy as the best sources for

58
generating electricity in Northern Cyprus. This agreement may be due to the awareness of
widely used solar heating systems in Northern Cyprus. The respondents who are aware of
district heating benefits have surely responded positively, as it is the cheapest and most
energy efficient way of producing heat and hot water.
In Northern Cyprus, the electricity energy generated by diesel generators (212MW) and
PV power plant (1.27MW) installed in Serhatköy. In the last decade, there has been a sharp
increase in the population of Northern Cyprus, mainly due to the international tourism and
higher education sectors. Consequently, the growth of the population has led to an increase
in energy demand (Figure 4.17), where nearly all of the energy production is currently
dependent on fossil fuels. The increased energy demand and related environmental
problems caused by burning fossil fuels has raised interest in alternative energy sources.
According to KibrisTürkElektrikKurumu (2018), the diesel electricity cost is about
0.15$/kWh (0-250kWh) and 0.17$/kWh (250-500 kWh). Based on the public opinion
section (3.1), the authors assessed economic evaluations of developing 10kWgird-
connected solar/wind power systems. Thus, the results of the collected data and analysis
show that the proposed 10kW PV projects are very promising in the selected regions due to
the obtained results of economic performance. The recovery of the initial investment of PV
power generation can be achieved in 2.2 to 4.1 years, which depends on the location of the
studied region in Northern Cyprus. Moreover, with regard to the wind potential in
Northern Cyprus, the wind systems is not willing to invest in this type of technology due to
high electricity prices and recovery of initial investment. In addition, this type of
technology is not suitable to use in Lefkoşa and Girne due to low capacity factor.
Moreover, it is noticed that these systems are the most economical option for generating
electricity than the producing electricity by diesel generating because of lower value of
LCOE. In addition, Figure 4.18(a) shows the total annual electricity generated by
solar/wind systems at selected regions in Northern Cyprus. Figure 4.18 (b)-(d) is also
showed the comparison between the electricity cost generated by solar/wind systems with
diesel. For example, the electricity cost of the same total annual electricity generated by
PV/wind systems and diesel is compared and illustrated in Figure 4.18(b)-(d). The results
show that using solar system for producing electricity in Northern Cyprus could be reduced
the electricity cost with average of 70% comparing to diesel electricity cost. Moreover, the

59
net fuel savings by the overall electricity-generation system with solar systems are nearly
three times greater than those obtained with wind systems.
Figure 4.17: Electricity demand in Northern Cyprus (2004-2017)(KibrisTürkElektrikKurumu, 2018)
-10
0
10
20
30
40
50
0
200
400
600
800
1000
1200
1400
1600
2004
2005
2006
2007
2008
2009
2010
2011
2012
2013
2014
2015
2016
2017
Incr
easin
g per
cent
age
[%]
Elec
trici
ty co
nsum
ptio
n [k
Wh
x106 ]
Electricity consumption Increasing percentage [%]

60
Figure 4.18: Total Electricity generated (EG) and solar/wind vs diesel electricitycost; (a) electricity generated by PV systems and wind systems,(b) comparison between PV systems electricity cost vs. dieselelectricity, (c) comparison between wind system (Aircon10)electricity cost vs.diesel electricity and (d) comparison betweenwind system(Sunfurfs WT3) electricity cost vs. diesel electricity
61
CHAPTER 5
CONCLUSIONS AND FUTURE WORKS
5.1 Conclusions
This study set out to explore public opinion about renewable energy, technologies, as well
as benefits in Northern Cyprus. Data were collected from all over Northern Cyprus
especially from the three major cities, namely; Lefkoşa, Girne, and Gazimağusa. The
results of this survey are identified opinion on renewable energy with focused on
environmental condition and generating during a period of significant interest in electrical
issues in Northern Cyprus. This study has the potential to improve the information and
knowledge base to effectively support decision makers aiming at sustainable renewable
resource management and planning.
Moreover, the present paper is aimed to give a conscious analysis of the performance of a
10kW grid-connected solar/wind power system for the most populated regions in Northern
Cyprus. In comparison with solar and wind systems, the 2-axis tracking systems are the
best optional for producing electricity in the studied regions. Generally, it concluded that
PV system project is the most economical option for generating electricity in studied
regions location than the wind system due to low electricity prices and recovery of initial
investment. Moreover, the net fuel savings by the overall electricity-generation system
with solar systems are nearly three times greater than those obtained with wind systems.
5.2. Limitation of the research
Limitations are potential weaknesses in our study and are out of our control. The study limitations
are
1. Due to the nature of the research questions, this research was based on qualitative research
methods. The survey conducted in the research did not, for the most part, yield statistically
significant results.
2. Some respondents have difficulty in understanding the questionnaires.
3. Most of respondents were not English first-language speakers, and they may have
misunderstood the questionnaires.

62
5.3 Future Work
In this study, Weibull distribution was used to study the wind speed characteristics. In
addition, PVGIS and RETScreen were used to analyze the performance of solar system in
three selected regions. As future work, different distribution such as Normal and Logistic,
Log-Logistic, Lognormal functions will be used to analyze the wind speed distribution at
three regions. Additionally, PV*SOL and PVWATT’S simulation tool will be used and
compared with PVGIS and RETScreen tool.

63
REFERENCES
Al Zohbi, G., Hendrick, P., &Bouillard, P. (2015). Wind characteristics and wind energy
potential analysis in five sites in Lebanon. International Journal of Hydrogen
Energy, 40(44), 15311-15319.
Alayat, M., Kassem, Y., &Çamur, H. (2018). Assessment of Wind Energy Potential as a
Power Generation Source: A Case Study of Eight Selected Locations in Northern
Cyprus. Energies, 11(10), 2697
Ayodele, T., &Ogunjuyigbe, A. (2015). Prediction of monthly average global solar
radiation based on statistical distribution of clearness index. Energy, 90, 1733-1742
Baranes, E., Jacqmin, J., &Poudou, J. (2015). Non-Renewable and Intermittent Renewable
Energy Sources: Friends and Foes? SSRN Electronic Journal.
Benedek, J., Sebestyén, T., &Bartók, B. (2018). Evaluation of renewable energy sources in
peripheral areas and renewable energy-based rural development. Renewable and
Sustainable Energy Reviews, 90, 516-535.
Biswas, P. P., Suganthan, P., &Amaratunga, G. A. (2017).Optimal power flow solutions
incorporating stochastic wind and solar power. Energy Conversion and
Management, 148, 1194-1207.
Cantarello, E., & Newton, A. C. (2014). An Introduction to the Green Economy: Science,
Systems and Sustainability. New York
Evrendilek, F., &Ertekin, C. (2003).Assessing the potential of renewable energy sources in
Turkey. Renewable Energy, 28(15), 2303-2315.
Gao, X. S., Yang, H., & Lu, L. (2014). Study on offshore wind power potential and wind
farm optimization in Hong Kong. Applied Energy, 130, 519-531.
Giannakopoulos, C., Psiloglou, B., Lemesios, G., Xevgenos, D., Papadaskalopoulou, C.,
Karali, A., …Loizidou, M. (2015). Climate change impacts, vulnerability and
adaptive capacity of the electrical energy sector in Cyprus. Regional Environmental
Change, 16(7), 1891-1904.
Gökçek, M., &Genç, M. S. (2009). Evaluation of electricity generation and energy cost of
wind energy conversion systems (WECSs) in Central Turkey. Applied Energy,
86(12), 2731-2739

64
Gökgöz, F., &Güvercin, M. T. (2018).Energy security and renewable energy efficiency in
EU. Renewable and Sustainable Energy Reviews, 96, 226-239.
Gómez-Navarro, T., &Ribó-Pérez, D. (2018).Assessing the obstacles to the participation of
renewable energy sources in the electricity market of Colombia. Renewable and
Sustainable Energy Reviews, 90, 131-141.
Hache, E. (2018). Do renewable energies improve energy security in the long
run? International Economics, 156, 127-135.
Hobbs. (2016). Fundamentals of World Regional Geography.Cengage Learning
Irwanto, M., Gomesh, N., Mamat, M., &Yusoff, Y. (2014).Assessment of wind power
generation potential in Perlis, Malaysia. Renewable and Sustainable Energy
Reviews, 38, 296-308.
Jadhav, H., & Roy, R. (2015).Stochastic optimal power flow incorporating offshore wind
farm and electric vehicles. International Journal of Electrical Power & Energy
Systems, 69, 173-187.
Kabir, E., Kumar, P., Kumar, S., Adelodun, A., & Kim, K. (2018). Solar energy: Potential
and future prospects. Renewable and Sustainable Energy Reviews, 82, 894-900.
Kardooni, R., Yusoff, S. B., Kari, F. B., &Moeenizadeh, L. (2018).Public opinion on
renewable energy technologies and climate change in Peninsular Malaysia.
Renewable Energy, 116, 659-668.
Kassem, Y. Gökçekuş, H. &Çamur, H. (2018). Economic assessment of renewable power
generation based on wind speed and solar radiation in urban regions. Global J.
Environ. Sci. Manage., 4(4),465-482
Kassem, Y., &Gökçekuş, H. (2018). GHG emissions and energy performance of 1MWp
grid-connected solar PV plant at Lefke in Northern Cyprus: a Case study. Disaster
Science and Engineering. In press
Kassem, Y., Çamur, H., &Gökçekuş, H. (2018). Economic assessment of renewable
power generation based on wind speed and solar radiation in urban regions. Global
J. Environ. Sci. Manage, 4(4), 465-482.
Kassem, Y., Gökçekuş, H., &Çamur, H. (2018).Effects of Climate Characteristics on Wind
Power Potential and Economic Evaluation in Salamis Region, Northern
Cyprus. International Journal of Applied Environmental Sciences, (13), 3, 287-307.

65
Khan, M. A., Rehman, S., & Al-Sulaiman, F. A. (2018). A hybrid renewable energy
system as a potential energy source for water desalination using reverse osmosis: A
review. Renewable and Sustainable Energy Reviews, 97, 456-477.
Khanna, V., Shekher, A., Singh, A., &Budhraja, V. (2017). Performance of grid connected
photovoltaic system in North of India. 2017 IEEE 44th Photovoltaic Specialist
Conference (PVSC).
Khanna, V., Shekher, A., Singh, A., &Budhraja, V. (2017). Performance of grid
connected photovoltaic system in North of India. 2017 IEEE 44th Photovoltaic
Specialist Conference (PVSC).
KibrisTürkElektrikKurumu. (2018). Retrieved October 5, 2018, from
https://www.kibtek.com/tarifeler/
Kousksou, T., Allouhi, A., Belattar, M., Jamil, A., El Rhafiki, T., Arid, A., &Zeraouli, Y.
(2015).Renewable energy potential and national policy directions for sustainable
development in Morocco. Renewable and Sustainable Energy Reviews, 47, 46-57.
Kumar, N. M., Kumar, M. R., Rejoice, P. R., & Mathew, M. (2017). Performance analysis
of 100 kWp grid connected Si-poly photovoltaic system using PVsyst simulation
tool. Energy Procedia, 117, 180-189.
Li, C., Liu, Y., Li, G., Li, J., Zhu, D., Jia, W., …Zhai, X. (2016). Evaluation of wind
energy resource and wind turbine characteristics at two locations in
China. Technology in Society, 47, 121-128.
Lin, B., & Chen, Y. (2018). Does electricity price matter for innovation in renewable
energy technologies in China? Energy Economics, 1.
Manoj Kumar, N., Sudhakar, K., &Samykano, M. (2017). Techno-economic analysis of 1
MWp grid connected solar PV plant in Malaysia. International Journal of Ambient
Energy, 1-10.
Mehmet, O., &Bicak, H. (2002).Modern and traditional irrigation technologies in the
Eastern Mediterranean.Ottawa: IDRC International Development Research Centre.
Mohammadi, K., Naderi, M., &Saghafifar, M. (2018).Economic feasibility of developing
grid-connected photovoltaic plants in the southern coast of Iran. Energy, 156, 17-
31.

66
Moula, M. E., Maula, J., Hamdy, M., Fang, T., Jung, N., &Lahdelma, R.
(2013).Researching social acceptability of renewable energy technologies in
Finland. International Journal of Sustainable Built Environment, 2(1), 89-98.
Owusu, P. A., &Asumadu-Sarkodie, S. (2016). A review of renewable energy sources,
sustainability issues and climate change mitigation. Cogent Engineering, 3(1).
Ozil, E., Ugursal, V. I., Akbulut, U., &Ozpinar, A. (2008). Renewable Energy and
Environmental Awareness and Opinions: A Survey of University Students in
Canada, Romania, and Turkey. International Journal of Green Energy, 5(3), 174-
188.
Paraschivoiu, I. (2009). Wind turbine design: With emphasis on Darrieus concept.
Montréal: Presses internationals Polytechniques
Paska, J., &Surma, T. (2014). Electricity generation from renewable energy sources in
Poland. Renewable Energy, 71, 286-294.
Prasad, A. A., Taylor, R. A., & Kay, M. (2017). Assessment of solar and wind resource
synergy in Australia. Applied Energy, 190, 354-367.
Razmjoo, A., Qolipour, M., Shirmohammadi, R., Heibati, S. M., &Faraji, I. (2017).
Techno-economic evaluation of standalone hybrid solar-wind systems for small
residential districts in the central desert of Iran
Schumacher, K., Krones, F., McKenna, R., &Schultmann, F. (2019). Public acceptance of
renewable energies and energy autonomy: A comparative study in the French,
German and Swiss Upper Rhine region. Energy Policy, 126, 315-332.
Shiva Kumar, B., &Sudhakar, K. (2015). Performance evaluation of 10 MW grid
connected solar photovoltaic power plant in India. Energy Reports, 1, 184-192.
Shoaib, M., Siddiqui, I., Amir, Y. M., &Rehman, S. U. (2017). Evaluation of wind power
potential in Baburband (Pakistan) using Weibull distribution function. Renewable
and Sustainable Energy Reviews, 70, 1343-1351.
Solyali, D., Altunç, M., Tolun, S., &Aslan, Z. (2016). Wind resource assessment of
Northern Cyprus. Renewable and Sustainable Energy Reviews, 55, 180-187.
Taliotis, C., Taibi, E., Howells, M., Rogner, H., Bazilian, M., &Welsch, M. (2017).
Renewable energy technology integration for the island of Cyprus: A cost-
optimization approach. Energy, 137, 31-41.

67
Vogiatzis, N., Kotti, K., Spanomitsios, S., &Stoukides, M. (2004). 04/02445 Analysis of
wind potential and characteristics in North Aegean, Greece. Fuel and Energy
Abstracts, 45(5), 342-343.
Wang, B., Cot, L., Adolphe, L., &Geoffroy, S. (2017). Estimation of wind energy of a
building with canopy roof.Sustainable Cities and Society, 35, 402-416
Woldeyohannes, A. D., Woldemichael, D. E., &Baheta, A. T. (2016).Sustainable
renewable energy resources utilization in rural areas. Renewable and Sustainable
Energy Reviews, 66, 1-9.
Yenen, M.;Fahrioglu, M., (2013). Wind and solar energy assessment of Northern Cyprus.
2013 12th International Conference on Environment and Electrical Engineering
Zerrahn, A., Schill, W., &Kemfert, C. (2018).On the economics of electrical storage for
variable renewable energy sources. European Economic Review, 108, 259-279.

68
APPENIDIX

69
APPENDIX 1
A QUESTIONNAIRE ABOUT RENEWABLE ENERGY TECHNOLOGY
Dear students:Hello! We are researchers from Near East University. We are conducting a survey onInternational postgraduate students’ opinions about renewable energy technologies that canbe used for generating electricity at the universities in Northern Cyprus. We would liketoinvite you to answer the questions in our questionnaire. Your decision as to whether ornot to take part in this study is completely voluntary (of your free will). You are not askedto mention your name or any other information that may lead to identify you.Yourcooperation with our research is highly appreciated and we assure that all datawecollect will be used for research purposes only.
1. Do you know the difference between renewable and non-renewable energy?Yes
No
Unsure2. Which of the following statement(s) best represent your level of interest inrenewableenergy?
I am environmentally conscious and familiar with renewable energy technologiesandtheir benefits.I am familiar with renewable energy technologies and their benefitsI know very little about renewable energy technologies and their benefits
3. How much you are concerned about renewable energy source?Very unconcernedLess unconcernedNeither concerned nor very concernedConcernedVery concerned
4. In your opinion, What are the disadvantages of using renewable energy overtradition gas or electricity energy?
I don’t see any disadvantages of using renewable energyInstallation costEfficiencyReliabilityI feel it is not fully establishedLack of information on how it worksOther,

70
5. To what extent do you think renewable energy can solve the electricityproblem at the university?
To a very small scaleTo a small extentTo a moderate extentTo a large extentTo a very large extent
6. Which renewable energy do you think has the most extensive scope to besuccessfully implemented across the universities by 2030?
Wind energySolar energyBiomassBio-fuel
7. What are the benefits of using electricity and/or thermal energy produced fromrenewableenergy sources? (Mark all that apply))
Lower energy bills.Good for the environment.Less reliance on imported oil and natural gasLess reliance on electric utility companies.There will not be a need for investment in nuclear power plants.Good for the economyThere will not be any benefit.
8. If we were to consider purchasing a renewable energy system for Near EastUniversity, which are the TOP THREE difficulties you would likely experience?(Rank the top three, 1 most important, 3 least important)
Initial CostFinding a trustworthy contractorChoosing the correct technologyObtaining correct and reliable informationObtaining the best possible priceGood return on investmentTechnology becomes obsolete too quickly

71
9. To satisfy the future energy needs of our university, what options should be givenpriorityto (Mark all that apply)
Nuclear power plantsPower plants that rely on renewable energy resources such as solar or windNatural gas power plantsCoal fired power plants
10. Would you consider buying your electrical energy from a renewable source even ifit isslightly more expensive?
YesNoI don’t know
11. GenderMaleFemale
12. AgeLess than 25 years25-30 year31-36years37-42yearsOver 42 years
13. FacultyApplied sciencesSocial sciencesHealth sciences