ronny kohavi, microsoft slides available at ://exp-platform.com
TRANSCRIPT

Planning, Running, and Analyzing Controlled Experiments on the Web Ronny Kohavi, Microsoft
Slides available at http://exp-platform.com
Part 1

2
Amazon Shopping Cart Recs
Add an item to your shopping cart at a websiteMost sites show the cart
At Amazon, Greg Linden had the idea of showing recommendations based on cart itemsEvaluation
Pro: cross-sell more items (increase average basket size)Con: distract people from checking out (reduce conversion)
HiPPO (Highest Paid Person’s Opinion) was: stop the projectSimple experiment was run, wildly successful
From Greg Linden’s Blog: http://glinden.blogspot.com/2006/04/early-amazon-shopping-cart.html

Stress HiPPO
Whenever you feel stressed that a decision is made without data, squeeze the Stress-HiPPOPut one in your office to show others you believe in data-driven decisions based on experimentsHippos kill more humans than anyother (non-human) mammal (really)Don’t let HiPPOs in your orgkill innovative ideas. ExPeriment!
3
The less data, the stronger the opinions

Agenda
Controlled Experiments in one slideExamples: you’re the decision makerCultural evolution: hubris, insight through measurement, Semmelweis reflex, fundamental understandingControlled Experiments: deeper dive
Two key messages to rememberIt is hard to assess the value of ideas.Get the data by experimenting because data trumps intuitionMake sure the org agrees what you are optimizing
4

Controlled Experiments in One SlideConcept is trivial
Randomly split traffic betweentwo (or more) versions
A/ControlB/Treatment
Collect metrics of interestAnalyze
5
100%Users
50%Users
50%Users
Control:Existing System
Treatment:Existing System with Feature X
Users interactions instrumented, analyzed & compared
Analyze at the end of the experiment
Must run statistical tests to confirm differences are not due to chanceBest scientific way to prove causality, i.e., the changes in metrics are caused by changes introduced in the treatment(s)

Examples
Three experiments that ran at Microsoft recentlyAll had enough users for statistical validityGame: see how many you get right
Everyone please stand upThree choices are:
A wins (the difference is statistically significant)A and B are approximately the same (no stat sig diff)B wins
If you guess randomly1/3 left standing after first question1/9 after the second question
6

MSN Real Estate
“Find a house” widget variationsOverall Evaluation Criterion: Revenue to Microsoft generated every time a user clicks search/find button
7
• Raise your right hand if you think A Wins• Raise your left hand if you think B Wins•Don’t raise your hand if you think they’re about the same
A B

MSN Real Estate8
If you did not raise a hand, please sit downIf you raised your left hand, please sit downA was 8.5% betterSince this is the #1 monetization, it effectively raised revenues significantly.
Actual experiment had 6 variants. There was a “throwdown” (vote for the winning variant) and
nobody from MSN Real Estate or Zaaz (the company that did the creative) voted for the winning widget

MSN Home Page Search BoxOEC: Clickthrough rate for Search box and popular
searches
A
B
Differences: A has taller search box (overall size is the same), has magnifying glass icon, “popular searches”
B has big search button
• Raise your right hand if you think A Wins• Raise your left hand if you think B Wins•Don’t raise your hand if they are the about the same

Search Box
If you raised any hand, please sit down
Insight Stop debating, it’s easier to get the data
10

MSN US Home Page: Search Box11
A later test showed that changing the magnifying glass to an actionable word (search, go, explore) was highly beneficial.This:
is better than

Office OnlineOEC: Clicks on revenue generating links (red below)
A B
• Raise your right hand if you think A Wins• Raise your left hand if you think B Wins•Don’t raise your hand if they are the about the same

Office Online
If you did not raise a hand, please sit downIf you raised your left hand, please sit downB was 64% worse
What % of the audience is still standing?Humbling!
13

14
Twyman’s LawAny figure that looks interesting or
different is usually wrong If something is “amazing,” find the flaw! Examples
If you have a mandatory birth date field and people think it’s unnecessary, you’ll find lots of 11/11/11 or 01/01/01
If you have an optional drop down, do not default to the first alphabetical entry, or you’ll have lots jobs = Astronaut
Traffic to web sites doubled between 1-2AM November 6, 2011 for many sites, relative to the same hour a week prior. Why?
The previous Office example assumes click maps to revenue.Seemed reasonable, but when the results look so extreme, find the flaw

Hard to Assess the Value of Ideas:Data Trumps IntuitionFeatures are built because teams believe they are useful.But most experiments show that features fail to move the metrics they were designed to improveWe joke that our job is to tell clients that their new baby is uglyIn the recently published book Uncontrolled, Jim Manzi writes
Google ran approximately 12,000 randomized experiments in 2009, with [only] about 10 percent of these leading to business changes.
In an Experimentation and Testing Primer by Avinash Kaushik, authors of Web Analytics: An Hour a Day, he wrote
80% of the time you/we are wrong about what a customer wants
15

Hard to Assess the Value of Ideas:Data Trumps IntuitionQualPro tested 150,000 ideas over 22 years
75 percent of important business decisions andbusiness improvement ideas either have no impact onperformance or actually hurt performance…
Based on experiments at Microsoft (paper)1/3 of ideas were positive ideas and statistically significant1/3 of ideas were flat: no statistically significant difference1/3 of ideas were negative and statistically significant
Our intuition is poor: 60-90% of ideas do not improve themetric(s) they were designed to improve (domain dependent).Humbling!
16

Failures are Not Mistakes
One page article by Stefan Thomke, May 2006Mistakes refer to the wrong actions that result from poor judgments or inattention; they should be avoided because they produce little new or useful information.A poorly planned or badly conducted experiment that results in ambiguous data, forcing researchers to repeat the experiment, is a mistake.Another common mistake is repeating a prior failure or learning nothing from the experience
17

Failures are Not Mistakes (2)
Story about Tom Watson Sr., IBM's founder A promising young executive involved in a risky new venture, managed to lose more than $10 million while trying to make the venture workWhen the nervous man was called into Watson's office, he offered to accept the logical consequence of losing the company such a large amount of money: "I guess you want my resignation, Mr. Watson.“Much to his surprise, Watson countered: 'You can't be serious! We've just spent 10 million [dollars] educating you."
18

Key LessonsAvoid the temptation to try and build optimal features through extensive planning without early testing of ideasExperiment often
To have a great idea, have a lot of them -- Thomas EdisonIf you have to kiss a lot of frogs to find a prince, find more frogs and kiss them faster and faster -- Mike Moran, Do it Wrong Quickly
Try radical ideas. You may be surprisedDoubly true if it’s cheap to implement (e.g., shopping cart recommendations and Behavior-Based search at Amazon)If you're not prepared to be wrong, you'll never come upwith anything original – Sir Ken Robinson, TED 2006

The OEC
If you remember one thing from this talk, remember this pointOEC = Overall Evaluation Criterion
Agree early on what you are optimizingGetting agreement on the OEC in the org is a huge step forwardSuggestion: optimize for customer lifetime value, not immediate short-term revenueCriterion could be weighted sum of factors, such as
Time on site (per time period, say week or month)Visit frequency
Report many other metrics for diagnostics, i.e., to understand why the OEC changed and raise new hypotheses
20

Agenda
Controlled Experiments in one slideExamples: you’re the decision makerCultural evolution: hubris, insight through measurement, Semmelweis reflex, fundamental understandingControlled Experiments: deeper dive
Two key messages to rememberIt is hard to assess the value of ideas.Get the data by experimenting because data trumps intuitionMake sure the org agrees what you are optimizing
21

The Cultural Challenge
Why people/orgs avoid controlled experimentsSome believe it threatens their job as decision makersAt Microsoft, program managers select the next set of features to develop. Proposing several alternatives and admitting you don’t know which is best is hardEditors and designers get paid to select a great designFailures of ideas may hurt image and professional standing.It’s easier to declare success when the feature launchesWe’ve heard: “we know what to do. It’s in our DNA,” and“why don’t we just do the right thing?”
22
It is difficult to get a man to understand something when his salary depends upon his not understanding
it. -- Upton Sinclair

Cultural Stage 1: HubrisThe org goes through stages in its cultural evolutionStage 1: we know what to do and we’re sure of it
True story from 1849John Snow claimed that Cholera was caused by polluted waterA landlord dismissed his tenants’ complaints that their water stank
Even when Cholera was frequent among the tenants
One day he drank a glass of his tenants’ water to show there was nothing wrong with it
He died three days laterThat’s hubris. Even if we’re sure of our ideas, evaluate themControlled experiments are a powerful tool to evaluate ideas

Semmelweis
Cultural Stage 2: Insight through Measurement and Control• Semmelweis worked at Vienna’s General Hospital, an
important teaching/research hospital, in the 1830s-40s
• In 19th-century Europe, childbed fever killed more than a million women
• Measurement: the mortality rate for women giving birth was• 15% in his ward, staffed by doctors and students• 2% in the ward at the hospital, attended by midwives

Semmelweis
Cultural Stage 2: Insight through Measurement and Control• He tries to control all differences• Birthing positions, ventilation, diet, even the way laundry
was done• He was away for 4 months and death rate fell
significantly when he was away. Could it be related to him?
• Insight:• Doctors were performing autopsies each morning on
cadavers• Conjecture: particles (called germs today) were being
transmitted to healthy patients on the hands of the physicians
He experiments with cleansing agents• Chlorine and lime was effective: death rate fell from 18%
to 1%

Cultural Stage 3: Semmelweis ReflexSuccess? No! Disbelief. Where/what are these particles?
Semmelweis was dropped from his post at the hospitalHe goes to Hungary and reduced mortality rate in obstetrics to 0.85%His student published a paper about the success. The editor wroteWe believe that this chlorine-washing theory has long outlived its usefulness… It is time we are no longer to be deceived by this theory
In 1865, he suffered a nervous breakdown and was beaten at a mental hospital, where he diedSemmelweis Reflex is a reflex-like rejection of new knowledge because it contradicts entrenched norms, beliefs or paradigmsOnly in 1800s? No! A 2005 study: inadequate hand washing is one of the prime contributors to the 2 million health-care-associated infections and 90,000 related deaths annually in the United States

Cultural Stage 4: Fundamental Understanding
In 1879, Louis Pasteur showed the presence of Streptococcus in the blood of women with child fever2008, 143 years after he died, there is a 50 Euro coin commemorating Semmelweis

Summary: Evolve the Culture
Hubris
Measure and Control
Accept Results avoid Semmelweis Reflex
Fundamental Understanding
In many areas we’re in the 1800s in terms of our understanding, so controlled experiments can help
First in doing the right thing, even if we don’t understand the fundamentalsThen developing the underlying fundamental theories

Agenda
Controlled Experiments in one slideExamples: you’re the decision makerCultural evolution: hubris, insight through measurement, Semmelweis reflex, fundamental understandingControlled Experiments: deeper dive
Two key messages to rememberIt is hard to assess the value of ideas.Get the data by experimenting because data trumps intuitionMake sure the org agrees what you are optimizing
29

Typical Discovery
With data mining, we find patterns, but most are correlational, providing hypotheses for possible causesHere is one a real example of two highly correlatedvariables
30

Correlations are not Necessarily Causal
31
• Data for the city of Oldenburg, Germany• X-axis: stork population • Y-axis: human population
What your mother told you about babies and storks when you were three is still not right, despite the strong correlational “evidence”
Ornitholigische Monatsberichte 1936;44(2)
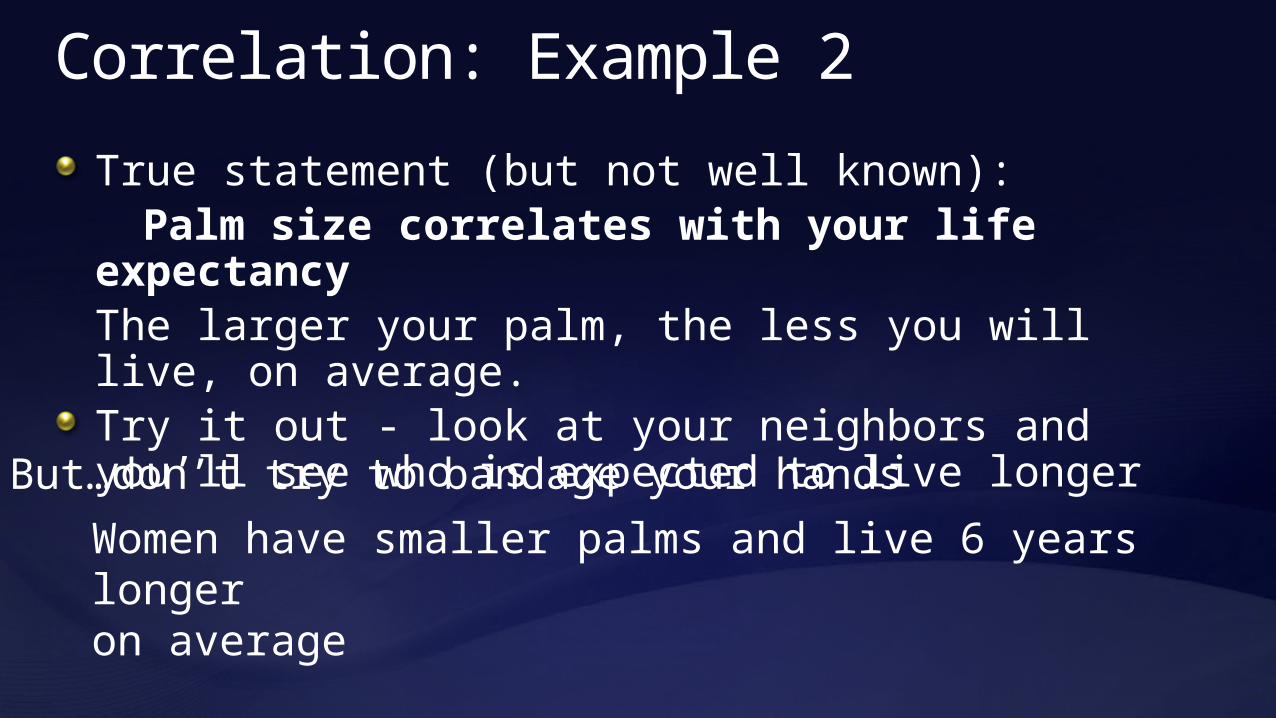
Correlation: Example 2
True statement (but not well known):Palm size correlates with your life
expectancyThe larger your palm, the less you will live, on average.Try it out - look at your neighbors and you’ll see who is expected to live longer
Women have smaller palms and live 6 years longeron average
But…don’t try to bandage your hands

Advantages of Controlled Experiments
Controlled experiments test for causal relationships, not simply correlationsWhen the variants run concurrently, only two things could explain a change in metrics:1. The “feature(s)” (A vs. B)2. Random chanceEverything else happening affects both the variantsFor #2, we conduct statistical tests for significanceThe gold standard in science and the only way to prove efficacy of drugs in FDA drug tests
33
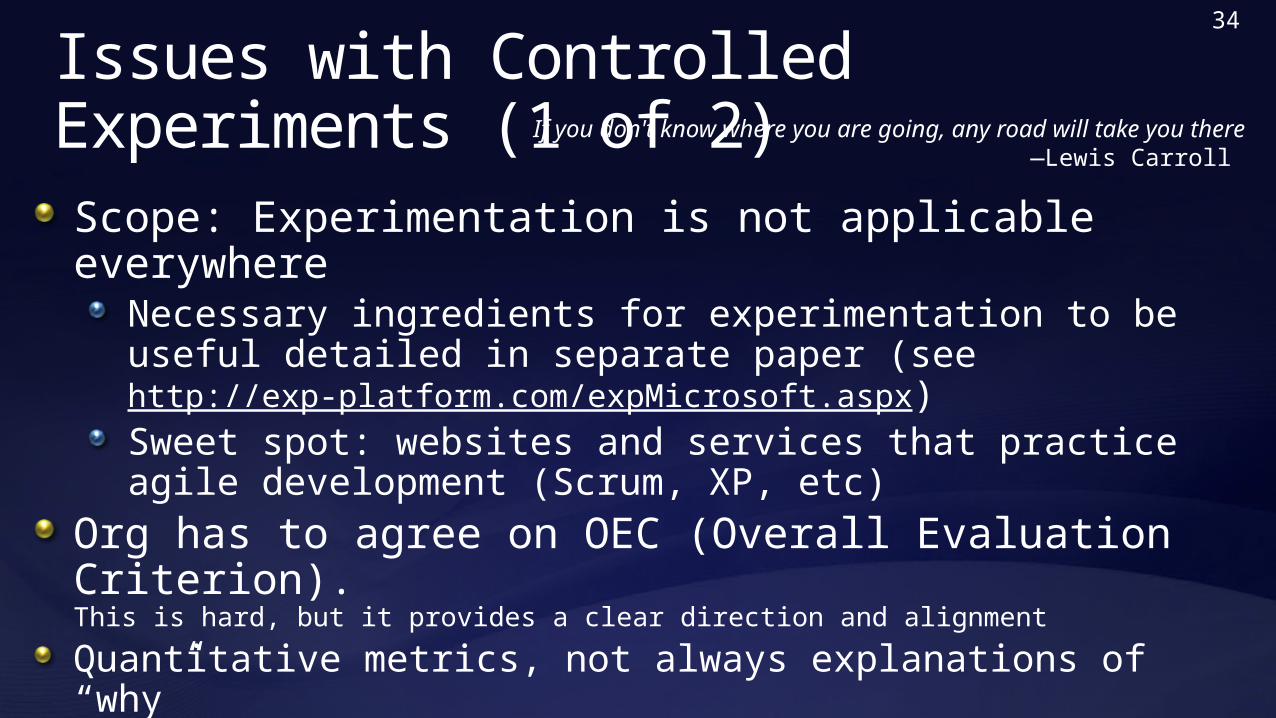
Issues with Controlled Experiments (1 of 2)Scope: Experimentation is not applicable everywhere
Necessary ingredients for experimentation to be useful detailed in separate paper (see http://exp-platform.com/expMicrosoft.aspx)Sweet spot: websites and services that practice agile development (Scrum, XP, etc)
Org has to agree on OEC (Overall Evaluation Criterion).This is hard, but it provides a clear direction and alignment
Quantitative metrics, not always explanations of “why”A treatment may lose because page-load time is slower.At Amazon, we slowed pages by 100-250msec and lost 1% of revenueA treatment may have JavaScript that fails on certain browsers, causing users to abandon.
34
If you don't know where you are going, any road will take you there —Lewis Carroll
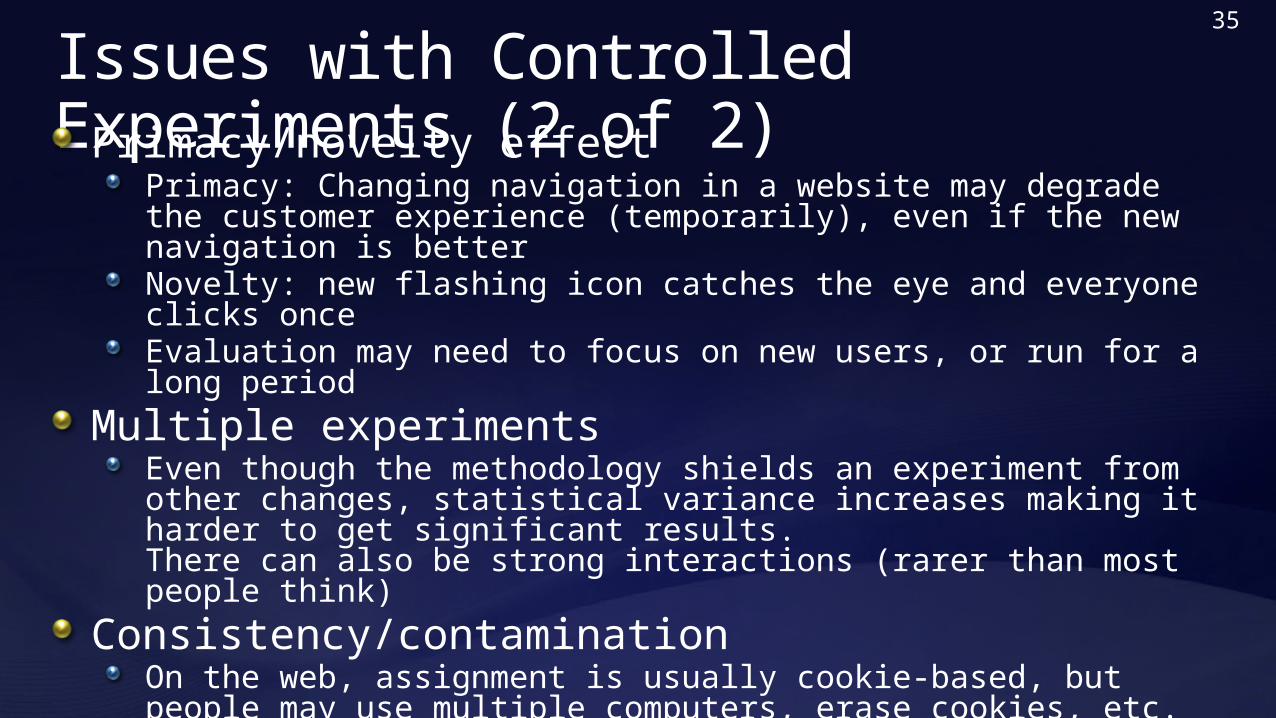
Issues with Controlled Experiments (2 of 2)Primacy/novelty effect
Primacy: Changing navigation in a website may degrade the customer experience (temporarily), even if the new navigation is betterNovelty: new flashing icon catches the eye and everyone clicks onceEvaluation may need to focus on new users, or run for a long period
Multiple experimentsEven though the methodology shields an experiment from other changes, statistical variance increases making it harder to get significant results.There can also be strong interactions (rarer than most people think)
Consistency/contaminationOn the web, assignment is usually cookie-based, but people may use multiple computers, erase cookies, etc. Typically a small issue
Launch events / media announcements sometimes preclude controlled experiments
The journalists need to be shown the “new” version
35

Best Practice: A/A Test
Run A/A tests Run an experiment where the Treatment and Control variants are coded identically and validate the following:1. Are users split according to the planned percentages?2. Is the data collected matching the system of record?3. Are the results showing non-significant results 95% of the time?
This is a powerful technique for finding bugs and other integration issues before teams try to make data-driven decisions
Generating some numbers is easyGetting correct numbers you trust is much harder!

Best Practice: Compute Statistical Significance
A very common mistake is to declare a winner when the difference could be due to random variationsCompute 95% confidence intervals on the metrics to determine if the difference is due to chance or whether it is statistically significantIncrease percentage if you do multiple tests (e.g., use 99%)Idea: run an A/A test in concurrent to your A/B test to make sure the overall system doesn’t declare it as significant more than 5% of the time (great QA)
37

Best Practice: Ramp-up
Ramp-upStart an experiment at 0.1%Do some simple analyses to make sure no egregious problems can be detectedRamp-up to a larger percentage, and repeat until 50%
Big differences are easy to detect because the min sample size is quadratic in the effect we want to detect
Detecting 10% difference requires a small sample and serious problems can be detected during ramp-upDetecting 0.1% requires a population 100^2 = 10,000 times bigger
Abort the experiment if treatment is significantly worse on OEC or other key metrics (e.g., time to generate page)
38

Run Experiments at 50/50%
Unless you’re running an experiment on one of the top 10 sites in the world, run experiments at 50/50%Novice experimenters run 1% experimentsTo detect an effect, you need to expose a certain number of users to the treatment (based on power calculations)Fastest way to achieve that exposure is to run equal-probability variants (e.g., 50/50% for A/B)If you perceive risk, don’t start an experiment at 50/50% from the beginning: Ramp-up over a short period
39

Randomization
Good randomization is critical.It’s unbelievable what mistakes developers will make in favor of efficiency
Properties of user assignmentConsistent assignment. User should see the same variant on successive visitsIndependent assignment. Assignment to one experiment should have no effect on assignment to others (e.g., Eric Peterson’s code in his book gets this wrong)Monotonic ramp-up. As experiments are ramped-up to larger percentages, users who were exposed to treatments must stay in those treatments (population from control shifts)
40

Controversial ClaimsRun concurrent univariate experiments
Vendors make you think that MVTs and Fractional Factorial designs are critical---they are not. The same claim can be made that polynomial models are better than linear models: true in theory, less useful in practiceLet teams launch multiple experiments when they are ready, and do the analysis to detect and model interactions when relevant (less often than you think)
Backend integration (server-side) is a better long-term approach to integrate experimentation than Javascipt
Javascript suffers from performance delays, especially when running multiple experimentsJavascript is easy to kickoff, but harder to integrate with dynamic systemsHard to experiment with backend algorithms (e.g., recommendations)
41

Summary1.It is hard to assess the value of ideas
Listen to your customersGet the data by experimenting because data trumps intuitionExamples are humbling. More at http://exp-platform.com
2.Empower the HiPPO with data-driven decisionsOEC: make sure the org agrees what you are optimizing (long term lifetime value)
3.Compute the statistics carefullyPower, 95% confidence, ramp-up Stats/details described in DMKD journal paper: http://exp-platform.com/hippo_long.aspx
4.Experiment oftenTriple your experiment rate and you triple your success (and failure) rate.Fail fast & often in order to succeedAccelerate innovation by lowering the cost of experimenting
42
The less data, the stronger the opinions

Extra Slides43

Microsoft Support
Support.microsoft.com shows “top issues”OEC = click-through rateA shows top issuesB filters top issues toOS & Browser used tovisit site (useragent)
44
Personalization rarely hurts, but does it help?• Raise your right hand if you think B Wins by over 30%• Raise your left hand if you think B Wins by under 30%•Don’t raise your hand if you think they’re about the same

If you did not raise a hand, please sit downIf you raised your left hand, please sit downB was >50% better
Personalization helps more than people think!
45
Microsoft Support

MSN UK Hotmail experimentHotmail module on the MSN UK home page
Microsof
t Confidential

MSN UK Hotmail experiment
A: When user clicks on emailhotmail opens in same window
B: Open hotmail in separate windowTrigger: only users that click in the
module are in experiment (no diff otherwise)
OEC: clicks on home page (after trigger)
• Raise your right hand if you think A Wins• Raise your left hand if you think B Wins•Don’t raise your hand if they are the about the same
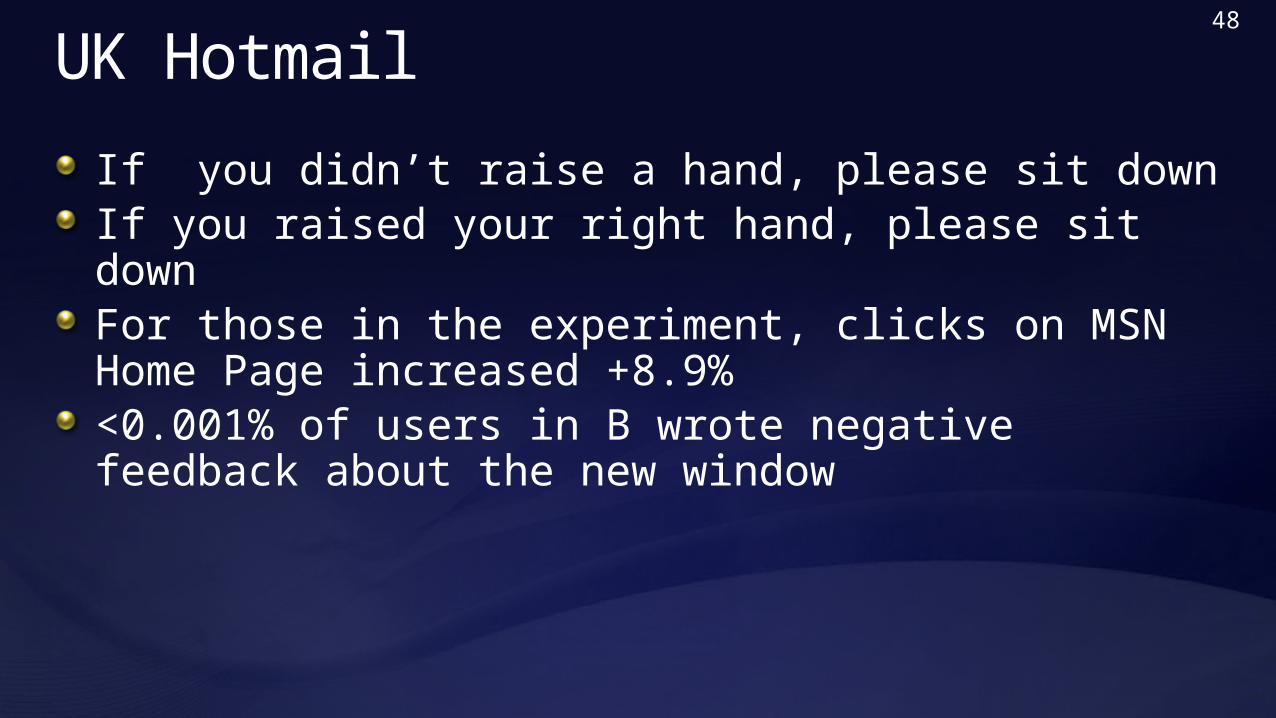
UK Hotmail
If you didn’t raise a hand, please sit downIf you raised your right hand, please sit downFor those in the experiment, clicks on MSN Home Page increased +8.9%<0.001% of users in B wrote negative feedback about the new window
48

Data Trumps Intuition
The experiment report was sent by the BI/CI team to all multiple teams across the world
Someone who saw the report wroteThis report came along at a really good time and was VERY useful.
I argued this point to my team (open Live services in new window from HP) just some days ago. They all turned me down.
Funny, now they have all changed their minds.
49

Real Example: MSN Real Estate
“Find a house” widget variationsOverall Evaluation Criterion: Revenue to Microsoft generated every time a user clicks
50
Think which one should win…

MSN Real Estate
the simplest
Revenue increase over control: +9.7% Interesting note: nobody from MSN Real Estate or Zaaz (the
company that did the creative) thought this widget would win
51
The widget that performed the best was…

MSN Home Page
Proposal: New Offers module below Shopping
Treatment
Control

The Experiment
Value propositionThe Offers module appears below the foldSales estimated the three ads would sell for several millions of dollars a year
ConcernDo more ads degrade the user experience?
How do we trade the two off?Experiment!

Experimental ResultsRan experiment for 12 days on 5% of trafficClickthrough rate per user (CTR) decreased 0.31% (p-value =0.044). This result is statistically significantClicks per user decreased 0.72% (p-value=0.015) Value of click from home page: talk to finance and the SEM team (how much are you paying to drive traffic from search engines)
The net result: losing idea

MSN Entertainment and Video Services (EVS)
Determine impact of 2 factors for video ads.1) Factor A: pre-roll vs. post-roll ads2) Factor B: time between ads (90, 120, 180, 300, 900 seconds)
OEC: revenue from ad starts

MSN EVS (results)
Eliminating the initial pre-roll adIncreased repeat visits by 1-3%, butReduced overall ad views by 50-60%
The amount of time between ad plays had no statistically significant impact on repeat visitsDecreasing the length of time between ad streams increased the total ad streams without impacting loyalty(as measured by return visits)Reducing the time to 90 seconds would improve annual revenue by millions
Client wroteThere is a preponderance of opinion driven design… The results of the experiment were in some respect counterintuitive. They completely changed our feature prioritization. It dispelled long held assumptions about video advertising. Very, very useful.
56

Marketplace: Solitaire v Poker
B: Poker game in hero position
A: Solitaire game in hero position
This experiment ran in Windows Marketplace / Game DownloadsWhich image has the higher clickthrough? By how much?
A is 61% better

Bloodletting (1 of 2)
For many years, the prevailing conception of illness was that the sickwere contaminated by some toxin Opening a vein and letting the sickness run out – bloodletting. One British medical text recommended bloodletting foracne, asthma, cancer, cholera, coma, convulsions, diabetes, epilepsy, gangrene, gout, herpes, indigestion, insanity, jaundice, leprosy, ophthalmia, plague, pneumonia, scurvy, smallpox, stroke, tetanus, tuberculosis, and for some one hundred other diseases
Physicians often reported the simultaneous use of fifty or more leeches on a given patient. Through the 1830s the French imported about forty million leeches a year for medical purposes

Bloodletting (2 of 2)
President George Washington had a sore throat anddoctors extracted 82 ounces of blood over 10 hours (35% of his total blood), causing anemia and hypotension. He died that night.Pierre Louis did an experiment in 1836 that is now recognized as one of the first clinical trials, or randomized controlled experiment. He treated people with pneumonia either with
early, aggressive bloodletting, orless aggressive measures
At the end of the experiment, Dr. Louis counted the bodies. They were stacked higher over by the bloodletting sink.
Lancet

Design GoalsTight integration with other systems (e.g., content management) allowing “codeless experiments”Accurate results in near real-time
Trust is importantQuickly detect and abort poorly performing experimentsHigh-performance data pipeline with built-in data loss detection
Minimal risk for experimenting applicationsEncourage bold innovations with reduced QA cyclesAuto-abort catches bugs in experimental codeClient library insulates app from platform bugs
Experimentation should be easyClient library exposes simple interfaceWeb UI enables self-serviceService layer enables platform integration 60

Amazon Behavior-Based Search
Ronny Kohavi
61
Searches for “24” are underspecified, yet most humans are probably searching for the TV program
Prior to Behavior-based search, here is what you would get (you can get this today by adding an advanced modifier like –foo to exclude foo)
Mostly irrelevant stuff:• 24 Italian songs• Toddler clothing suitable for 24
month olds• 24” towel bar• Opus 24 by Strauss• 24- lb stuff, cases of 24, etc

The Idea Behind BBS(*)
Amazon/P13N had an engine for X to Y People who bought item X bought YFeed searches, i.e., People who searched for X bought YPrototype looked greatIntegration with Search would take a long time: different team in A9 in the Bay AreaThey also highlighted a flaw:The results don’t always have the search terms.Example: search for “duracell charger” and you will see a best selling Sony charger, which does not have the word Duracell.But people choose to buy it after searching with this phrase!
62
(*) Based on UW iEdge Seminar talk by Amazon, 4/2006

End Result
Ran experiment with very thin integrationStrong correlations shown at the top of the page, pushing search results downImplemented simple de-duping of resultsResult : +3% increase to revenue.3% of $12B is $360M
Ronny Kohavi
63

Ronny Kohavi, Microsoft Confidential
64
TIMITI – Try It, Measure It, Tweak It(*)
I’m a Netflix user since 1/2000Great example of a company tweaking things
(*) TIMITI acronym by Jim Sterne

Ronny Kohavi, Microsoft Confidential
65TIMITI – Try It, Measure It, Tweak It (II)

Ronny Kohavi, Microsoft Confidential
66TIMITI – Try It, Measure It, Tweak It (III)
Details in Business 2.0 Apr 21, 2006.The evolution of the NetFlix envelope

Mixed Effects of Inconsistency on Experimentation in Organizations
Article in Organization Science Management can support experimentation and highlight it as a value (normative influence)However, inconsistent reward systems that punish failure lead to aversionEspecially in organizations that are under constant evaluation for perfect execution
67

OEC Thought ExperimentTiger Woods comes to you for advice on how to spend his time: improving golf, or improving ad revenue (most revenue comes from ads)
68
Short term, he could improve his ad revenueby focusing on ads…
But to optimize lifetime financial value(and immortality as a great golf player),he needs to focus on the game
While the example seems obvious,organizations commonly make the mistakeof focusing on the short term

Enlightened Experimentation: The New Imperative for InnovationHBR article by Stefan Thomke (Feb, 2001)Experimentation lies at the heart of every company's ability to innovateIn the past, testing was relatively expensive, so companies had to be parsimonious with the number of experimental iterationsThe electric light bulb, required more than 1,000 complex experiments with filament materials and shapes, electromechanical regulators, and vacuum technologies
69

Enlightened Experimentation (2)
Essentials for enlightened experimentation1. Organize for rapid experimentation
a) Encourage rapid experimentationb) Use small development groups with key people to iterate rapidlyc) Perform experiments in parallel
2. Fail early and often, but avoid mistakesa) Embrace failure to advance knowledgeb) Failure can expose important gaps in knowledgec) Don't forget the basics: well designed tests with clear objectivesd) IDEO's “fail often to succeed sooner”e) Don't develop expensive sleek prototypes, as you become
committed to them before you know if they work.
70

Enlightened Experimentation (3)
Essentials (CONT)3. Anticipate and exploit early information
a) Front-load to identify problems and provide guidance when it's cheap
b) Acknowledge trade-off between cost and fidelity. Low-fidelity experiments (costing less) are suited in early exploratory stages
4. Combine new and traditional technologiesa. Today's new technology might eventually replace its traditional
counterpart, but it could then be challenged by tomorrow's new technology
71

McNamara’s Fallacy
Beware of measuring what is easy instead of what’s important. For example:
Clicks to the beginning of the purchase pipeline rather than actual purchases (you may change the probability of purchase given someone enters the pipeline).
McNamara’s Fallacy:The first step is to measure what can easily be measured. This is OK as far as it goes. The second step is to disregard that which can't easily be measured or give it an arbitrary quantitative value.This is artificial and misleading.The third step is to presume that which can't be measured easily really isn't important.This is blindness. The fourth step is to say that what can't be easily measured really does not exist.This is suicide.