ronald b. gibbons group leader, lighting and
TRANSCRIPT
Photometric Measurements in the
Field
Ronald B. Gibbons
Group Leader,
Lighting and Infrastructure Technology
Photometric Measurements in
the Field Traditional Methods
• Luminance Meters
Current Methods
• CCD Photometry
Future Considerations
• Image Processing

Early Pavement Luminance
Measurement Waldram began
researching luminance in
1934
Using Photographic plates
and a scaling system of
known reflectance,
luminance was able to be
measured.
• Image is from July 3rd,
1934
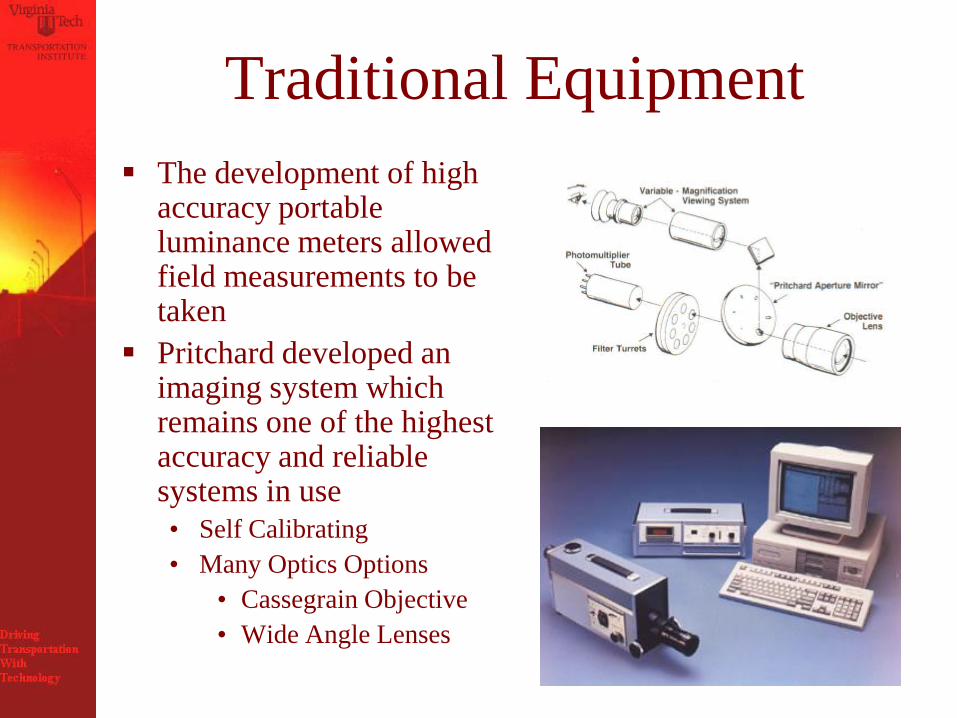
Traditional Equipment
The development of high accuracy portable luminance meters allowed field measurements to be taken
Pritchard developed an imaging system which remains one of the highest accuracy and reliable systems in use
• Self Calibrating
• Many Optics Options
• Cassegrain Objective
• Wide Angle Lenses
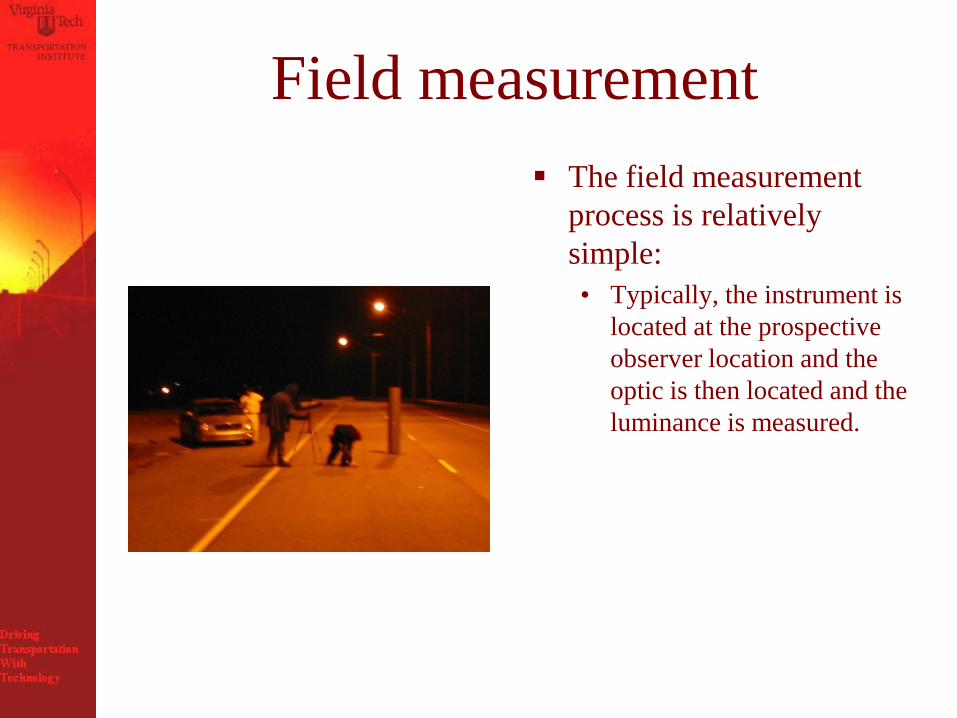
Field measurement
The field measurement
process is relatively
simple:
• Typically, the instrument is
located at the prospective
observer location and the
optic is then located and the
luminance is measured.
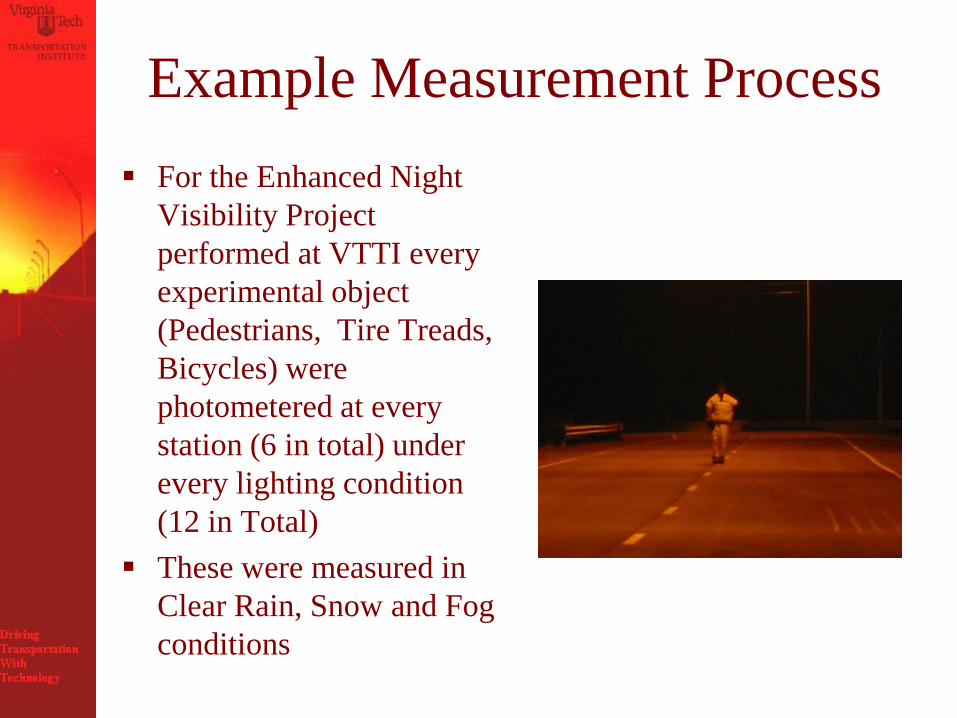
Example Measurement Process
For the Enhanced Night
Visibility Project
performed at VTTI every
experimental object
(Pedestrians, Tire Treads,
Bicycles) were
photometered at every
station (6 in total) under
every lighting condition
(12 in Total)
These were measured in
Clear Rain, Snow and Fog
conditions
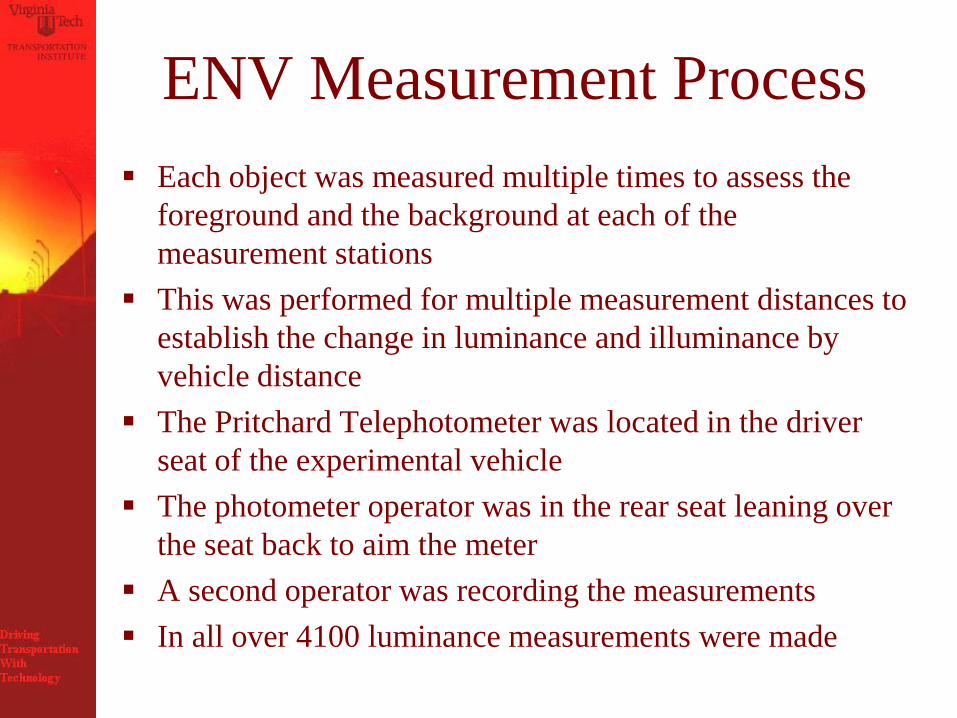
ENV Measurement Process
Each object was measured multiple times to assess the
foreground and the background at each of the
measurement stations
This was performed for multiple measurement distances to
establish the change in luminance and illuminance by
vehicle distance
The Pritchard Telephotometer was located in the driver
seat of the experimental vehicle
The photometer operator was in the rear seat leaning over
the seat back to aim the meter
A second operator was recording the measurements
In all over 4100 luminance measurements were made
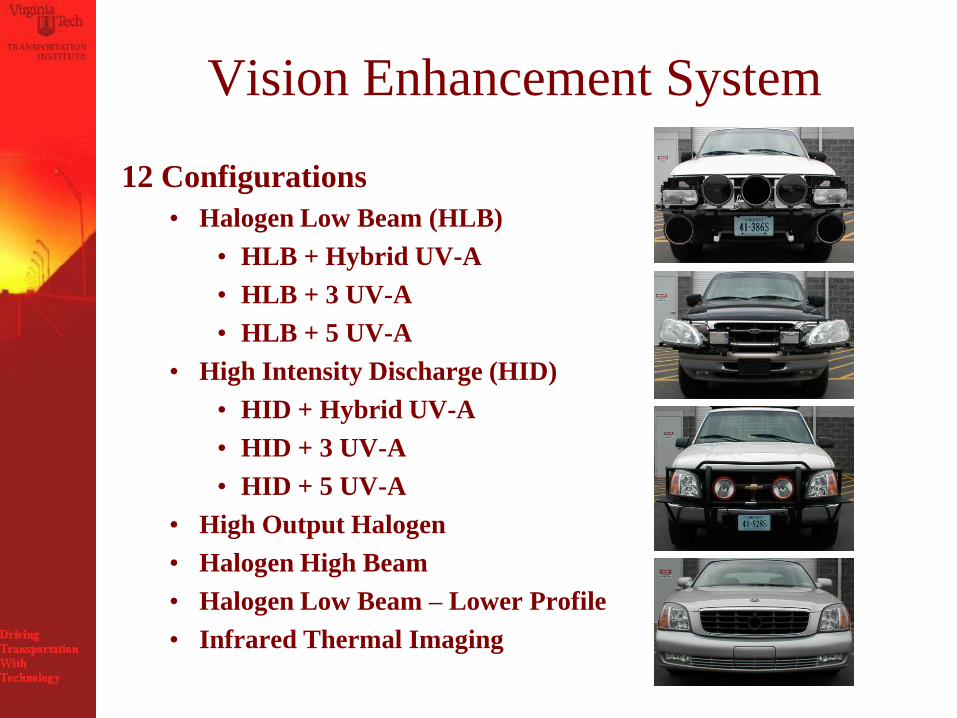
Vision Enhancement System
12 Configurations
• Halogen Low Beam (HLB)
• HLB + Hybrid UV-A
• HLB + 3 UV-A
• HLB + 5 UV-A
• High Intensity Discharge (HID)
• HID + Hybrid UV-A
• HID + 3 UV-A
• HID + 5 UV-A
• High Output Halogen
• Halogen High Beam
• Halogen Low Beam – Lower Profile
• Infrared Thermal Imaging

Object Type
• Perpendicular Pedestrian
• White clothing
• Black clothing
• Parallel Pedestrian
• White clothing
• Black clothing
• Cyclist
• White clothing
• Black clothing
• Static Pedestrian
• White clothing
• Tire Tread
• Children’s Bicycle
Black Clothed Pedestrian
White Clothed PedestrianWhite Clothed Cyclist
Children’s Bicycle Tire Tread
Black Clothed Cyclist

Measurement Locations
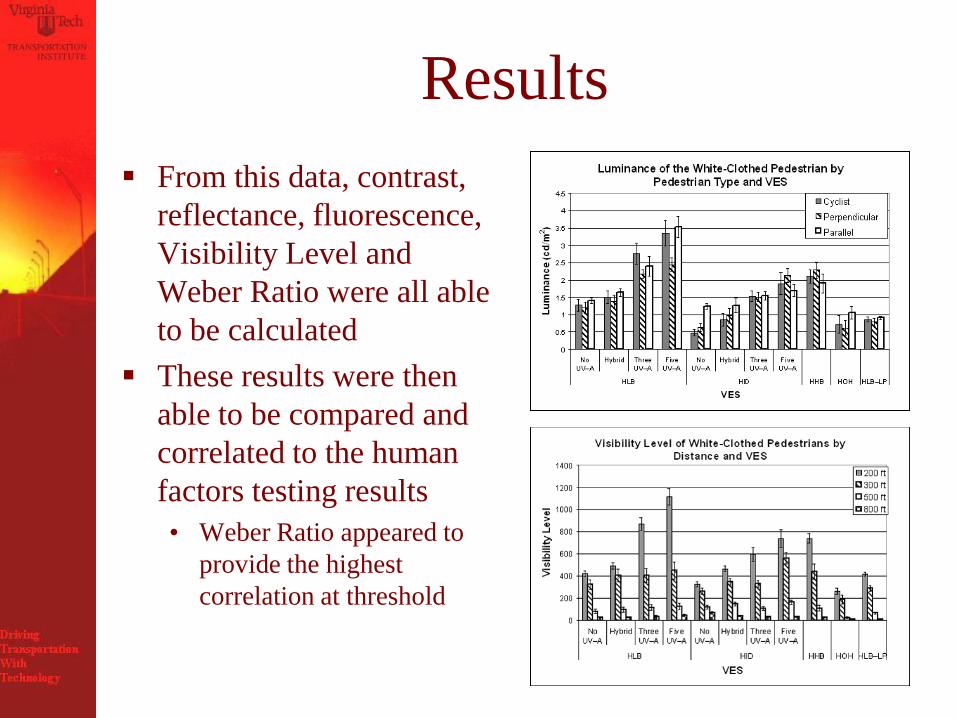
Results
From this data, contrast,
reflectance, fluorescence,
Visibility Level and
Weber Ratio were all able
to be calculated
These results were then
able to be compared and
correlated to the human
factors testing results
• Weber Ratio appeared to
provide the highest
correlation at threshold
Issues with the Traditional
Methods Equipment
• Many luminance meters have high uncertainties
• The Pritchard is bulky and difficult to use in the field
as it requires more electricity than can be provided by
the vehicle
Time
• A single measurement system is time consuming to use
to develop comprehensive measurements
• The ENV testing process took four weeks of staff and
resource time

Traditional Mindset
Traditional thinking is that you aim the
photometer at an object and get a measurement
• Objects do not have a single luminance but a range of
luminance and contrasts which are not captured by
traditional means
New technologies allow us to consider these
variations in a much broader scale

New Technologies
The greatest development in photometry may be
the use of CCD technology to allow us to
consider the entire scene rather than just a single
component of it
FHWA owns a Radiant Imaging Prometric CCD
Photometer which is used by VTTI and TTI for
visibility research• 1024x1024 16 bit full color CCD
• 1,000,000 measurements vs. 1 with a conventional photometer

CCD System
Calibration• The CCD array has a field calibration applied for each pixel
• This field calibration changes with each lens and aperture used
• The impact of the exposure time is assumed to be linear.
Sensitivity• The array is sensitive to a wide range of luminance
• Adjusting the exposure time allows for an infinite capture
• The 16 bit capability in the CCD limits the max\min ratio of luminance in the image to 1:64000 (1:40000 functionally)
Communication and Power• Initial systems required a desktop PC and a 17inch screen
• New USB2 versions allow for Laptop Usage
• Requires 110 volt power for the Camera
• Current requirements are low enough for the use of a 300 Watt in-vehicle inverter

In Vehicle Usage
The CCD system can be
placed in the vehicle and
then used from the
passengers seat
• Images show an earlier
version with desktop PC
and tripod
• Two vehicles were required
because of the power
requirements
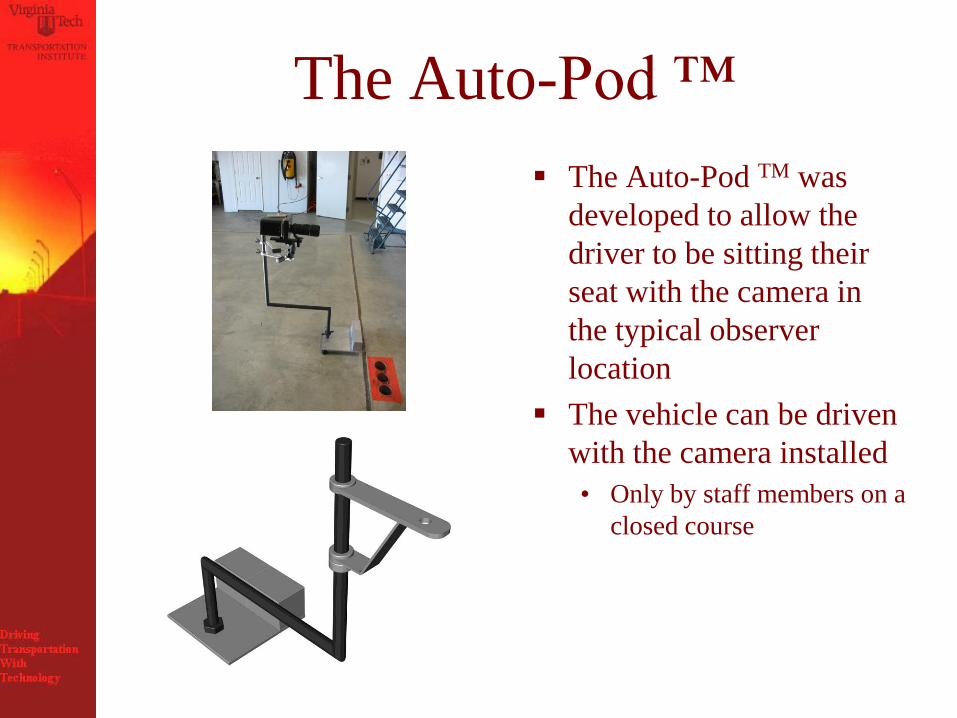
The Auto-Pod ™
The Auto-Pod TM was
developed to allow the
driver to be sitting their
seat with the camera in
the typical observer
location
The vehicle can be driven
with the camera installed
• Only by staff members on a
closed course
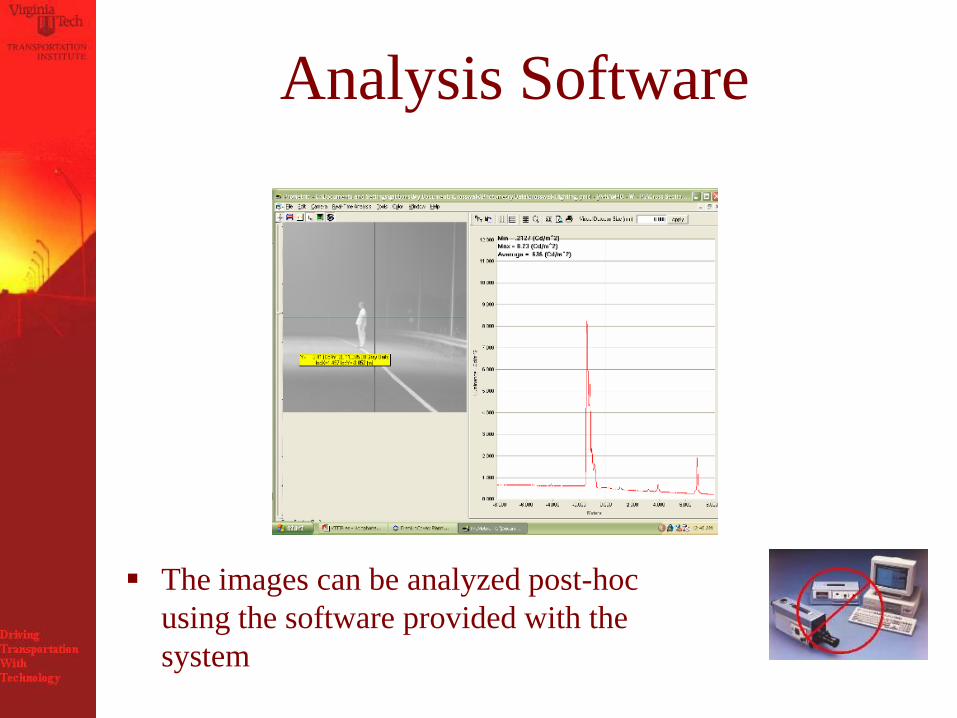
Analysis Software
The images can be analyzed post-hoc
using the software provided with the
system
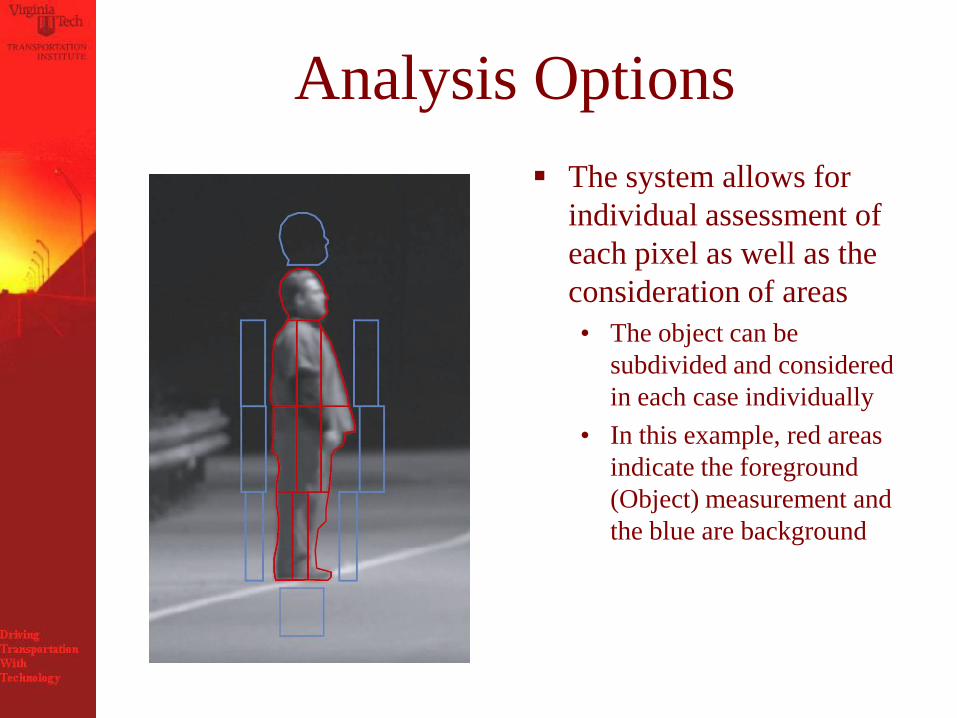
Analysis Options
The system allows for
individual assessment of
each pixel as well as the
consideration of areas
• The object can be
subdivided and considered
in each case individually
• In this example, red areas
indicate the foreground
(Object) measurement and
the blue are background

Luminance Zones

Contrast Consideration
Allows for a greater analysis of the actual lighting
condition of all of the object and the background
Example Projects
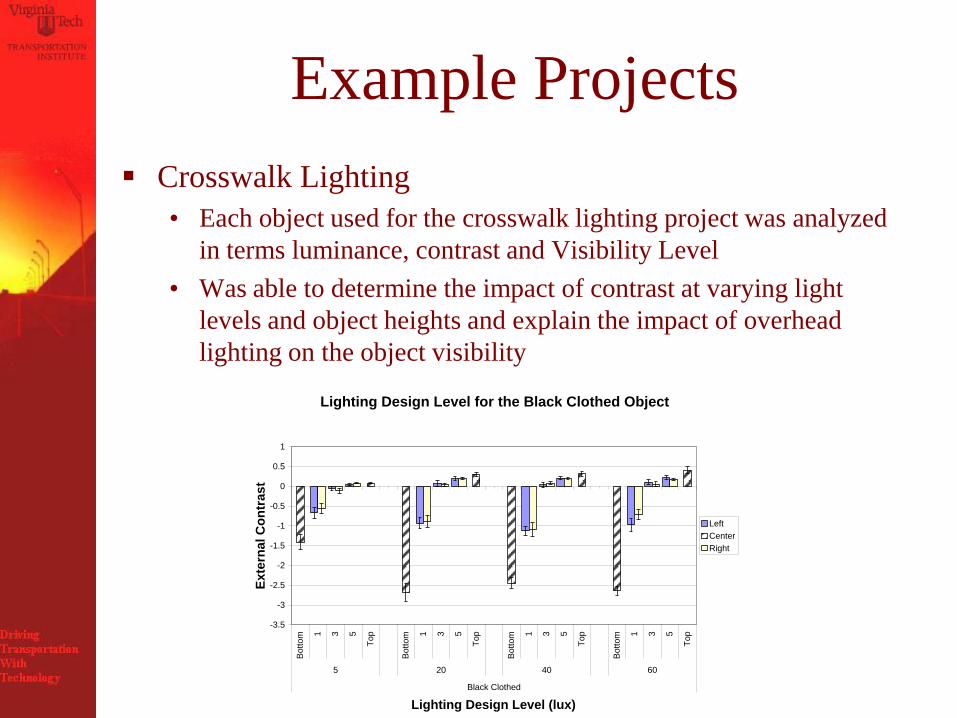
Crosswalk Lighting
• Each object used for the crosswalk lighting project was analyzed
in terms luminance, contrast and Visibility Level
• Was able to determine the impact of contrast at varying light
levels and object heights and explain the impact of overhead
lighting on the object visibility
Lighting Design Level for the Black Clothed Object
-3.5
-3
-2.5
-2
-1.5
-1
-0.5
0
0.5
1
Bott
om 1 3 5
Top
Bott
om 1 3 5
Top
Bott
om 1 3 5
Top
Bott
om 1 3 5
Top
5 20 40 60
Black Clothed
Lighting Design Level (lux)
Ex
tern
al
Co
ntr
as
t
Left
Center
Right

Example Projects
Wet Visibility of Pavement Markings
• The luminance of the pavement markings at threshold was able to
be determined for each participant as the rating were being
performed
• Used to establish the required retroreflectivity for detection.
Examples
Billboard Study
• The luminance of a series of billboards within the City
of Cleveland was investigated
• The CCD photometer was mounted in a vehicle which
was driven to various sites and images were taken from
the shoulder of the road
• In all Seventy Seven different images were taken
within a period of 3 hours including the driving time
Benefits of the CCD Technology
Speed
• Results which required 4 weeks have been reduced to 2
nights of imaging and 4 days of post-hoc in office
analysis
Content
• The data is rich with opportunities for greater
understanding of the visual environment
Analysis
• The shape and the size of the detection field is
determined in the software analysis and is not limited
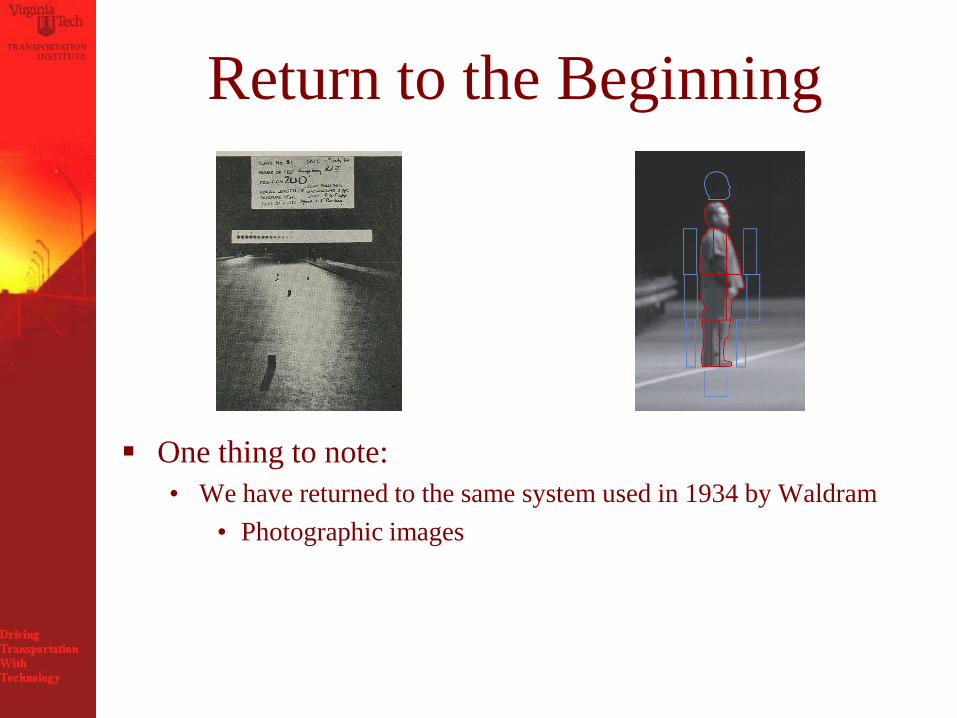
Return to the Beginning
One thing to note:
• We have returned to the same system used in 1934 by Waldram
• Photographic images
The Future
Image Processing Techniques
• We may be able to tap into different technologies for
the analysis of the images to provide greater tools for
visibility analysis
Live Photometric Video
• There is a need for a mobile photometer which takes
live imaging video that can be analyzed for luminance
• This tool could then be used for analysis of the visual
scene as we really see it – in a dynamic environment
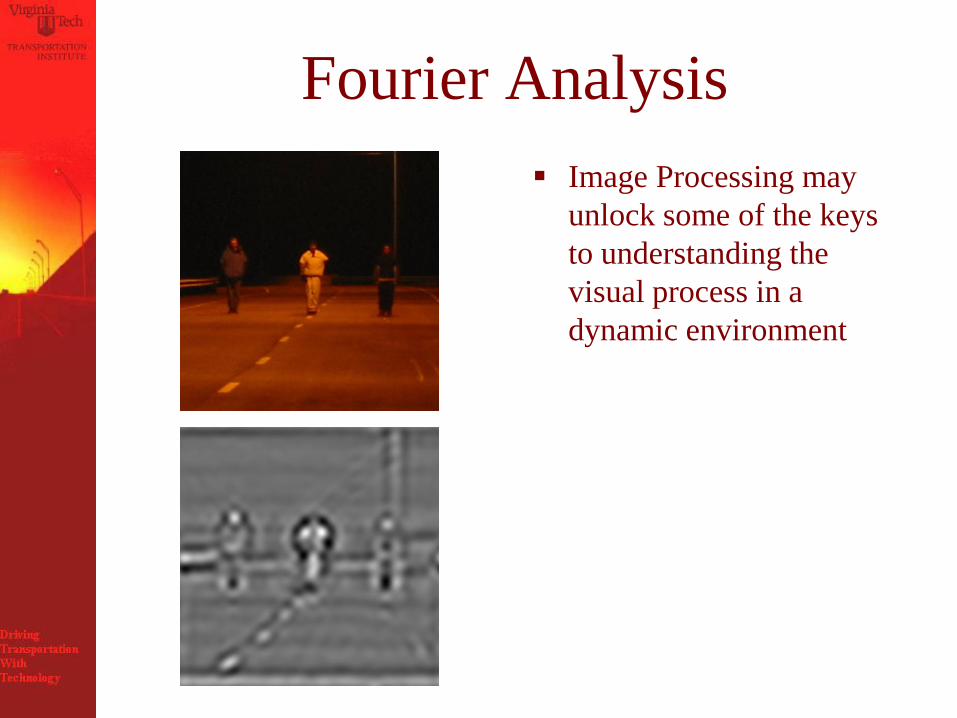
Fourier Analysis
Image Processing may
unlock some of the keys
to understanding the
visual process in a
dynamic environment

Outlook
New technologies are taking us beyond a single
number/single measurement world
We will soon be able to fully measure the
luminance environment that we live in
This should lead to an even greater understanding
of the visual processes behind driving, walking
and living