roll call: the importance of teacher attendance -...nctq
TRANSCRIPT

ROLL CALL:The importance of teacher attendance

Roll call: The importance of teacher attendance
NCTQ | June 2014
ABOUT NCTQ
The National Council on Teacher Quality (NCTQ) is a non-partisan research and policy organization committed to restructuring the teaching profession, led by our vision that every child deserves effective teachers.
THE NCTQ TEAM FOR THIS PROJECT
Nithya Joseph, Nancy Waymack and Daniel Zielaski authored the study. Ginger Moored, Tara Williams, Korine O'Sullivan, Laura Saltzman and Tara Canada also contributed to this report.
FUNDING
Funding for this project was provided in part by the Bodman Foundation.

Roll call: The importance of teacher attendance
Executive Summary
While policymakers have been directing considerable attention to teacher effective-ness, one basic aspect of effectiveness has received relatively little attention: teach-er attendance. No matter how engaging or talented teachers may be, they can only have an impact on student learning if they are in the classroom.
This paper asks a simple question: How often are teachers in the classroom and what factors influence their attendance?
Using school district data for 40 of the country’s largest metropolitan areas for the 2012 – 2013 school year,1 we found:
• On average, public school teachers were in the classroom 94 percent of the school year, missing nearly 11 days out of a 186-day school year (the average school year length). Teachers used slightly less than all of the short-term leave offered by the district, an average of 13 days in the 40 districts.
• 16 percent of all teachers were classified as chronically absent teachers because they missed 18 days or more in the school year, accounting for almost a third of all absences.
• In spite of previous research to the contrary, this study did not find a relationship between teacher absence and the poverty levels of the children in the school building.2
• Districts with formal policies in place to discourage teacher absenteeism did not appear to have better attendance rates than those without such policies, suggesting that the most common poli-cies are not particularly effective.
Improving teacher attendance most likely requires greater focus in which detailed attendance data are tracked both by the school principal and the central office. Teacher attendance needs to be a higher and more public priority for school districts that is complemented by school cultures that expect excel-lent teacher attendance.
1 Data was requested from school districts in the 50 largest metropolitan areas in the United States. Forty districts provided enough data to be part of the study. See Appendix A for a list of those districts.
2 Our examination of teacher attendance by school poverty level used categories of school poverty as the basis of that analysis, as opposed to a continuous variable of school poverty. See the Technical Appendix for further details.
Teacher attendance needs to be a higher and
more public priority for school districts.
NCTQ | June 2014 2
Roll call: The importance of teacher attendance
IntroductionAs common sense suggests, teacher attendance is directly related to student outcomes: the more teachers are absent, the more their students’ achievement suffers. When teachers are absent 10 days, the decrease in student achievement is equivalent to the difference between having a brand new teach-er and one with two or three years more experience.3,4 Worse yet, a number of studies have found there to be a disproportionately high rate of teacher absenteeism in schools serving low income and minority students, providing yet another obstacle to closing the achievement gap.5,6,7
The costs of teacher absenteeism add up-- and not just in terms of student achievement. Money spent on substitute teachers amounts to a significant expense to districts. The 40 districts included in this analysis spent approximately $424 million combined on substitutes in 2012-2013, not factoring in the time and resources spent recruiting, training and securing substitutes. In other words, districts spent an average of at least $1,800 for each teacher they employ to cover absences.8
Investing in a system that keeps effective teachers in the classroom should be a priority for school leaders and policymakers. A key part of that effort is creating a school climate in which consistent teacher attendance is the norm. That said, teachers have demanding, stressful jobs that often include long hours outside the normal school day. Their job requires that they always be "on" regardless of how well they feel. For attendance policies to be effective, they must be flexible for a job that is unique in many ways.
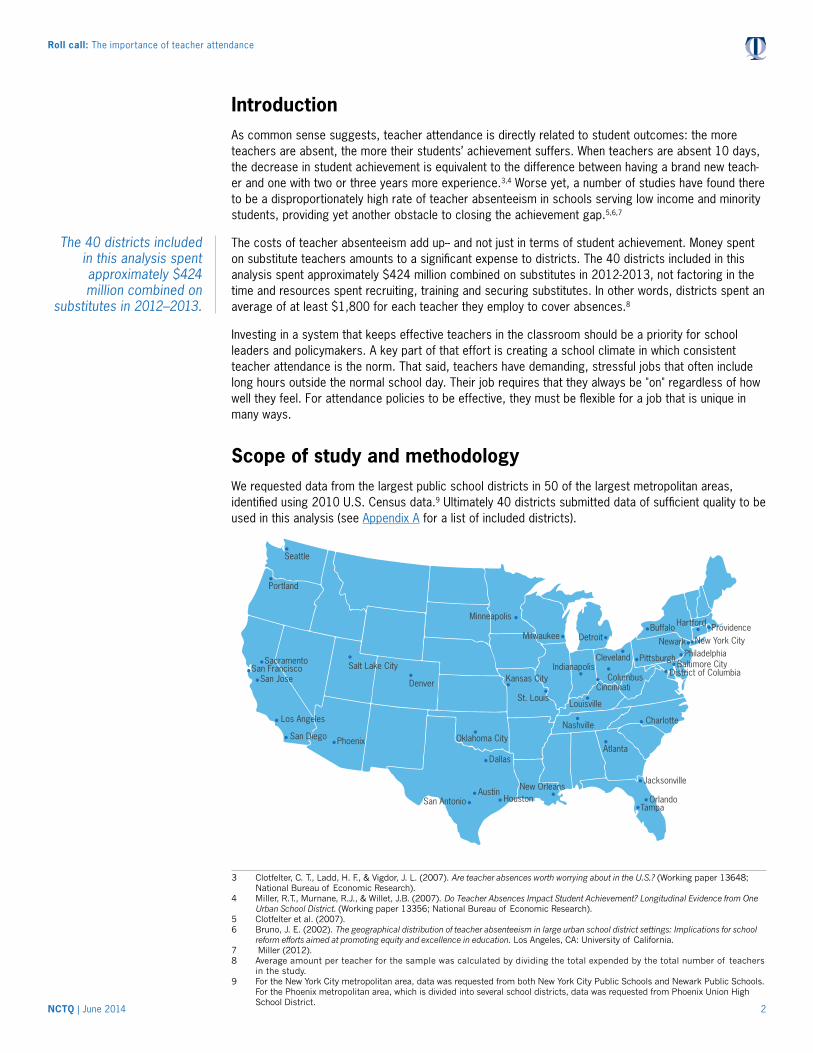
Scope of study and methodologyWe requested data from the largest public school districts in 50 of the largest metropolitan areas, identified using 2010 U.S. Census data.9 Ultimately 40 districts submitted data of sufficient quality to be used in this analysis (see Appendix A for a list of included districts).
Atlanta
Indianapolis
HartfordBuffalo
District of ColumbiaBaltimore City
Milwaukee Detroit
Houston
Minneapolis
Denver
Jacksonville
Tampa
New Orleans
Nashville
Orlando
New York CityNewark
Kansas City
St. LouisLouisville
Phoenix
Los Angeles
San Diego
PhiladelphiaPittsburghSan Francisco
San Jose
Sacramento
Seattle
Portland
Oklahoma City
Providence
CincinnatiColumbus
ClevelandSalt Lake City
Austin
Dallas
San Antonio
Charlotte
3 Clotfelter, C. T., Ladd, H. F., & Vigdor, J. L. (2007). Are teacher absences worth worrying about in the U.S.? (Working paper 13648; National Bureau of Economic Research).
4 Miller, R.T., Murnane, R.J., & Willet, J.B. (2007). Do Teacher Absences Impact Student Achievement? Longitudinal Evidence from One Urban School District. (Working paper 13356; National Bureau of Economic Research).
5 Clotfelter et al. (2007).6 Bruno, J. E. (2002). The geographical distribution of teacher absenteeism in large urban school district settings: Implications for school
reform efforts aimed at promoting equity and excellence in education. Los Angeles, CA: University of California.7 Miller (2012).8 Average amount per teacher for the sample was calculated by dividing the total expended by the total number of teachers
in the study.9 For the New York City metropolitan area, data was requested from both New York City Public Schools and Newark Public Schools.
For the Phoenix metropolitan area, which is divided into several school districts, data was requested from Phoenix Union High School District.
The 40 districts included in this analysis spent approximately $424 million combined on
substitutes in 2012–2013.
NCTQ | June 2014 3
Roll call: The importance of teacher attendance
Since the attendance data is from the 2012-2013 school year, we examined leave policies that were in place in the district that year.10
Importantly, we looked only at short-term absences, which are absences of 1 to 10 consecutive days. Long-term absences (absences lasting more than 10 consecutive days) were not included to exclude leave taken for serious illness and maternity/paternity leave. Professional development and other job-re-lated absences that would require students to be taught by a substitute were included.
Absence rates were categorized as follows: excellent attendance (3 or fewer days absent), moderate attendance (between 4 and 10 days absent), frequently absent (between 11 and 17 days absent) and chronically absent (18 or more days absent).
Schools were also grouped by poverty level using the percentage of students eligible for free and reduced lunch. Not surprisingly, given the urban characteristics of the districts, over 75 percent of teachers in these 40 districts taught in high-poverty schools (60 percent or more poverty), compared to only 4 percent of teachers who taught in low-poverty schools (20 percent or less poverty). Sixteen of the 40 districts did not have any low-poverty schools.11
Finally, because districts categorize teacher absences in different ways, all absences were placed in one of the following categories: sick, personal, professional and other.12
Teacher attendance rates across the districtsTeachers were in the classroom, on average, 94 percent of the school year.
Number of districts Number of teachers Attendance rate13 Average days absent
40 234,031 94% 11
Excellent attendance(3 or fewer days absent)
Moderate attendance(4 – 10 days absent)
Frequently absent (11 – 17 days absent)
Chronically absent (18 or more days absent)
16% 40% 28% 16%
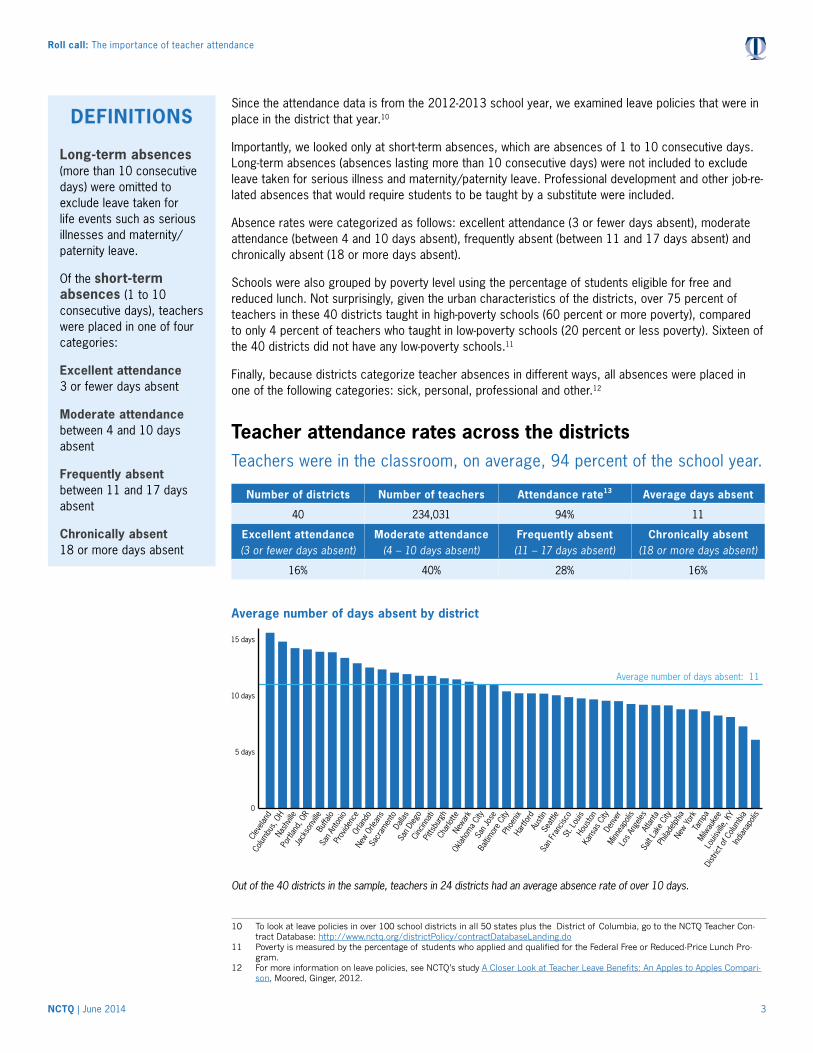
Average number of days absent by district
Average number of days absent: 11
0
5 days
10 days
15 days
Out of the 40 districts in the sample, teachers in 24 districts had an average absence rate of over 10 days.
10 To look at leave policies in over 100 school districts in all 50 states plus the District of Columbia, go to the NCTQ Teacher Con-tract Database: http://www.nctq.org/districtPolicy/contractDatabaseLanding.do
11 Poverty is measured by the percentage of students who applied and qualified for the Federal Free or Reduced-Price Lunch Pro-gram.
12 For more information on leave policies, see NCTQ’s study A Closer Look at Teacher Leave Benefits: An Apples to Apples Compari-son, Moored, Ginger, 2012.
DEFINITIONS
Long-term absences (more than 10 consecutive days) were omitted to exclude leave taken for life events such as serious illnesses and maternity/ paternity leave.
Of the short-term absences (1 to 10 consecutive days), teachers were placed in one of four categories:
Excellent attendance 3 or fewer days absent
Moderate attendance between 4 and 10 days absent
Frequently absent between 11 and 17 days absent
Chronically absent 18 or more days absent
NCTQ | June 2014 4
Roll call: The importance of teacher attendance
Teacher attendance highs and lows
Lowest average teacher absences Highest average teacher absences
Districts Days per year District Days per year
Indianapolis, IN 6.1 Cleveland, OH 15.6
District of Columbia 7.3 Columbus, OH 14.8
Louisville, KY 8.1 Nashville, TN 14.2
Milwaukee, WI 8.3 Portland, OR 14.1
Tampa, FL 8.6 Jacksonville, FL 13.9
On average, teachers in Cleveland were absent more than twice as many days as teachers in Indianapolis.
Teachers used slightly less than all of the short-term leave offered by the 40 districts, an average of 13 days.
Contractual agreements and board policies across 114 districts in the NCTQ Teacher Contract Data-base provide teachers with an average of 12.7 days of general (sick, personal) leave each year. This ranges from a low of 8 sick and personal days in Dallas, to a high of 25 sick and personal days for tenured teachers in Hartford.13
In most districts (73 percent), teachers took less general, short-term leave than what the district offered in sick and personal days. However, in 11 districts – Dallas, Jacksonville, San Antonio, Orlando, New Orleans, Sacramento, San Diego, Nashville, Austin, Portland and San Jose – teachers took more short-term leave than what was offered by the district. While we cannot be sure what enabled teachers to take more days than they accrued over the course of the year, we have three hypotheses:
1. The district authorized the absences because the teachers were out of the classroom for training, but not technically absent for record-keeping purposes.
2. Teachers used leave accrued from prior years.
3. Teachers took leave without pay.
As a rule, in districts where teachers took more general, short-term leave than what was offered, the yearly allocation of leave by the district was relatively small. Dallas and Austin offered the least amount of short-term leave at 8 and 9 days, respectively, and teachers in Dallas exceeded their leave by 1 day and in Austin by 4. Jacksonville, San Antonio, Orlando, New Orleans and San Diego offered only 10 days of short-term leave, and teachers in those districts exceeded their leave by between 2 and 4 days.
However, in three districts – Nashville, Sacramento and Portland – where the leave packages are rela-tively generous, teachers still exceeded the annual allocation. These districts offer between 15 and 17 days of general, short-term leave, but their teachers took between 1 and 2 days more, though some of these days were likely professional development days.
A comparison between Hartford and San Francisco illustrates the disparity between the amount of leave offered and the amount taken in some districts. While teachers in both Hartford and San Francisco used an average of 10 days of general, short-term leave in 2012-2013, the discrepancy between what was offered and what was taken was larger in Harford because that district offered up to 25 sick and personal days, while San Francisco offered a total of 10 sick and personal days per year.
13 For more information, see NCTQ’s brief on leave policies, A Closer Look at Teacher Leave Benefits: An Apples to Apples Compari-son Moored, 2012.
NCTQ | June 2014 5
Roll call: The importance of teacher attendance
-6 days
-3 days
0
3 days
6 days
9 days
12 days
15 days
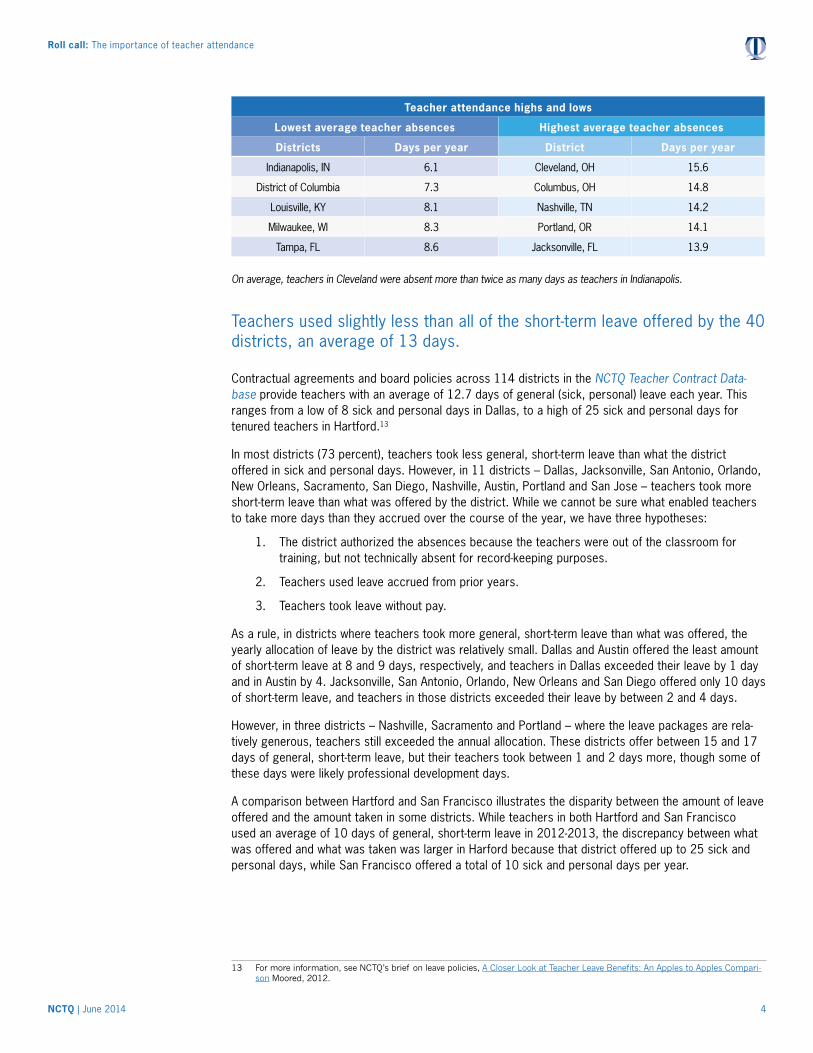
Difference between short-term leave offered and average short-term leave taken
Teachers in 73 percent of the districts in the sample took less leave than what was available to them.
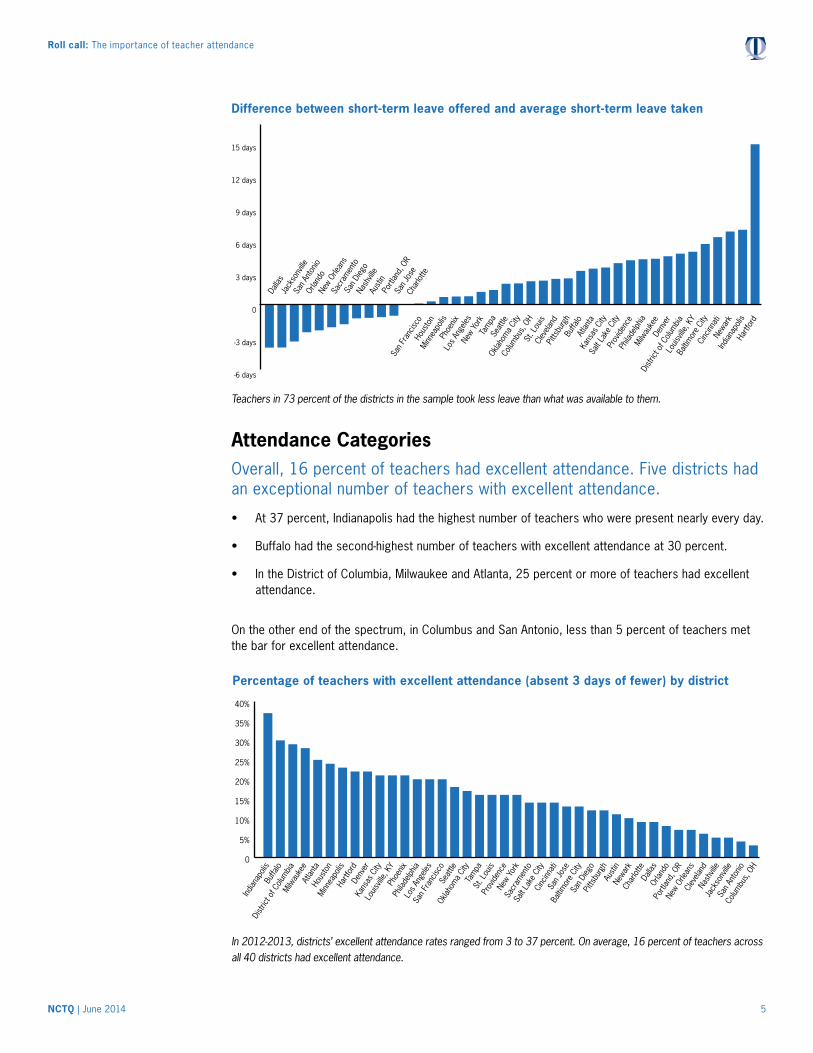
Attendance Categories Overall, 16 percent of teachers had excellent attendance. Five districts had an exceptional number of teachers with excellent attendance.
• At 37 percent, Indianapolis had the highest number of teachers who were present nearly every day.
• Buffalo had the second-highest number of teachers with excellent attendance at 30 percent.
• In the District of Columbia, Milwaukee and Atlanta, 25 percent or more of teachers had excellent attendance.
On the other end of the spectrum, in Columbus and San Antonio, less than 5 percent of teachers met the bar for excellent attendance.
0
5%
10%
15%
20%
25%
30%
35%
40%
Percentage of teachers with excellent attendance (absent 3 days of fewer) by district
In 2012-2013, districts’ excellent attendance rates ranged from 3 to 37 percent. On average, 16 percent of teachers across all 40 districts had excellent attendance.

NCTQ | June 2014 6
Roll call: The importance of teacher attendance
Within each district, as excellent attendance went up, the number of chroni-cally absent teachers did not always go down.
Conventional wisdom would suggest that teachers working under the same district policies would act in the same way, resulting in consistent patterns of attendance across a district’s teachers. While some districts, like Indianapolis and the District of Columbia had higher rates of teachers with excellent attendance and lower rates of chronically absent teachers, most districts in the sample did not show a consistent pattern from one category to the other.
Notably, Buffalo had the second-highest rate of excellent attendance but also had the highest rate of chronically absent teachers. Nearly 4 out of every 10 teachers in Buffalo missed at least 18 days of the 2012-2013 school year. Following close behind with high percentages of chronically absent teachers were Cleveland (34 percent), Columbus (32 percent) and Nashville (30 percent).
Indianapolis and Louisville stood out as having less than 5 percent chronically absent teachers. The District of Columbia, Tampa, Salt Lake City and New York followed closely behind, with chronic absence rates between 5 percent and 8 percent.
0
5%
10%
15%
20%
25%
30%
35%
40%
Percentage of chronically absent teachers (absent 18 days or more) by district
In six districts - Buffalo, Cleveland, Columbus, Nashville, Portland and Jacksonville - more than a quarter of teachers were chronically absent.
Indianapolis and Louisville stood out as having less
than 5 percent chronically absent teachers.
NCTQ | June 2014 7
Roll call: The importance of teacher attendance
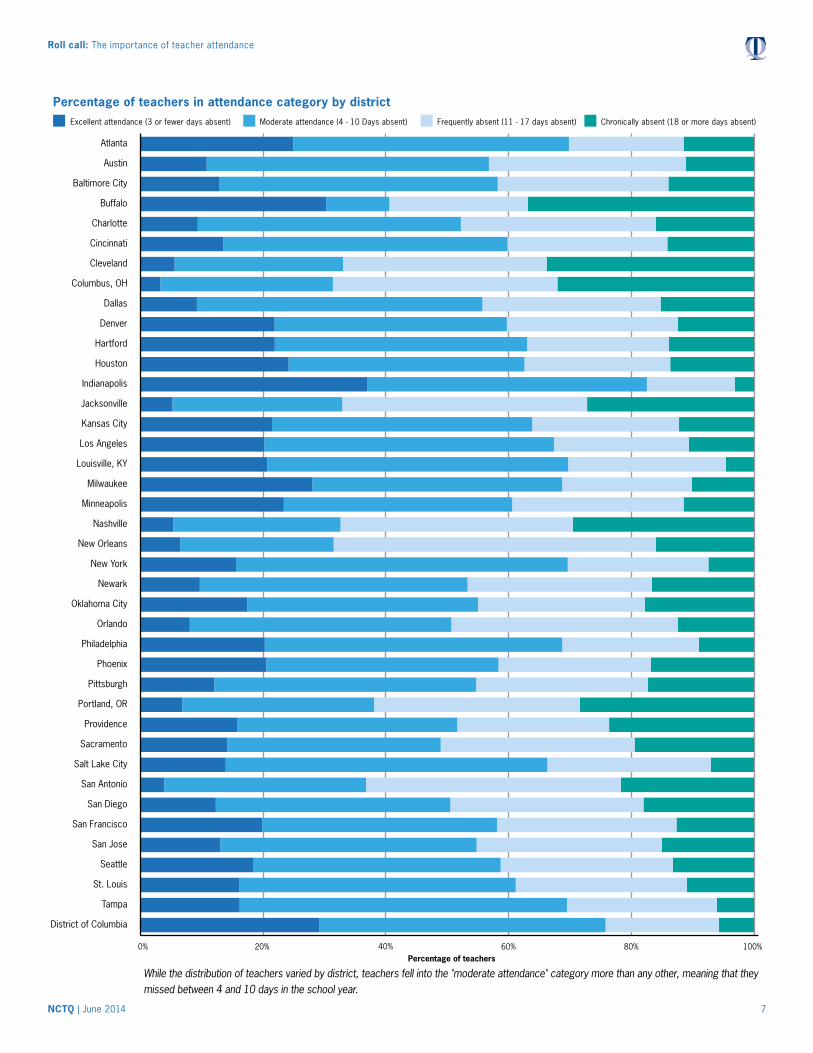
Percentage of teachers in attendance category by districtExcellent attendance (3 or fewer days absent) Moderate attendance (4 - 10 Days absent) Frequently absent (11 - 17 days absent) Chronically absent (18 or more days absent)
0% 20% 40% 60% 80% 100%
District of Columbia
Tampa
St. Louis
Seattle
San Jose
San Francisco
San Diego
San Antonio
Salt Lake City
Sacramento
Providence
Portland, OR
Pittsburgh
Phoenix
Philadelphia
Orlando
Oklahoma City
Newark
New York
New Orleans
Nashville
Minneapolis
Milwaukee
Louisville, KY
Los Angeles
Kansas City
Jacksonville
Indianapolis
Houston
Hartford
Denver
Dallas
Columbus, OH
Cleveland
Cincinnati
Charlotte
Buffalo
Baltimore City
Austin
Atlanta
Percentage of teachers
While the distribution of teachers varied by district, teachers fell into the "moderate attendance" category more than any other, meaning that they missed between 4 and 10 days in the school year.

NCTQ | June 2014 8
Roll call: The importance of teacher attendance
Approximately 16 percent of teachers were responsible for over a third of all absences.
These teachers missed approximately one day of teaching once every two weeks, at least 10 percent of the school year.
0
5%
10%
15%
20%
25%
30%
35%
40%
Chronically absentFrequently absentModerate attendanceExcellent attendance
Average percentage of teachers Average percentage of absences
Share of absences taken by attendance category
Teachers with excellent attendance, 16 percent of the total sample, accounted for only 2 percent of the total absences. Conversely, chronically absent teachers, a group about the same size, accounted for 34 percent of the absences.
High-poverty versus low-poverty schoolsTeacher absence rates did not significantly increase as the level of school poverty increased.
To examine how school poverty levels affected teacher attendance, we categorized schools in each dis-trict by poverty in quintiles, from the lowest (0 – 20 percent poverty) to the highest (81 – 100 percent poverty) levels.
As mentioned previously, this analysis reflects a heavier proportion of high-poverty schools. Nearly 55 percent of teachers across the 40 districts taught in schools where at least 80 percent of students qualified for free and reduced-priced lunch.
Given the existing research on teacher attendance, an increase in teacher absenteeism was expected as school poverty levels increased. Surprisingly, there was no significant increase in these districts. The difference between the average days absent in the highest and lowest poverty schools was under one day and was not statistically significant.
NCTQ | June 2014 9
Roll call: The importance of teacher attendance
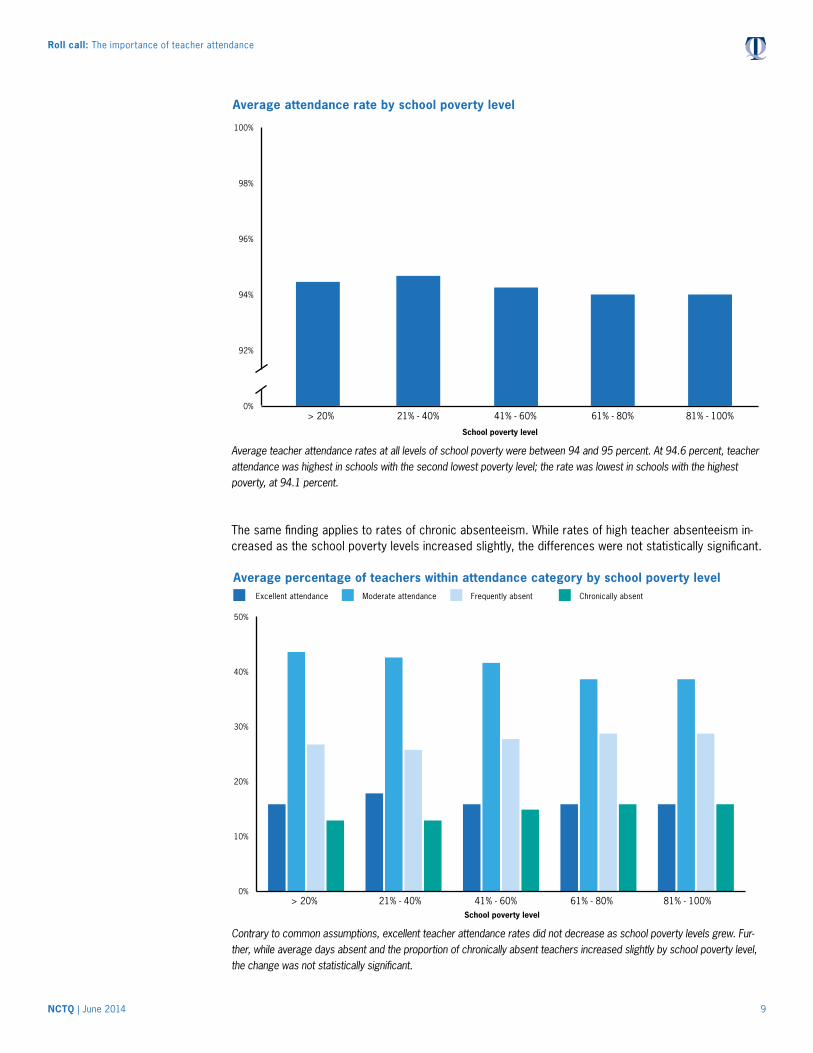
Average attendance rate by school poverty level
0%
92%
94%
96%
98%
100%
81% - 100%61% - 80%41% - 60%21% - 40%> 20%
School poverty level
Average teacher attendance rates at all levels of school poverty were between 94 and 95 percent. At 94.6 percent, teacher attendance was highest in schools with the second lowest poverty level; the rate was lowest in schools with the highest poverty, at 94.1 percent.
The same finding applies to rates of chronic absenteeism. While rates of high teacher absenteeism in-creased as the school poverty levels increased slightly, the differences were not statistically significant.
Average percentage of teachers within attendance category by school poverty level
0%
10%
20%
30%
40%
50%
81% - 100% 61% - 80% 41% - 60% 21% - 40% > 20%
Excellent attendance Moderate attendance Frequently absent Chronically absent
School poverty level
Contrary to common assumptions, excellent teacher attendance rates did not decrease as school poverty levels grew. Fur-ther, while average days absent and the proportion of chronically absent teachers increased slightly by school poverty level, the change was not statistically significant.
NCTQ | June 2014 10
Roll call: The importance of teacher attendance
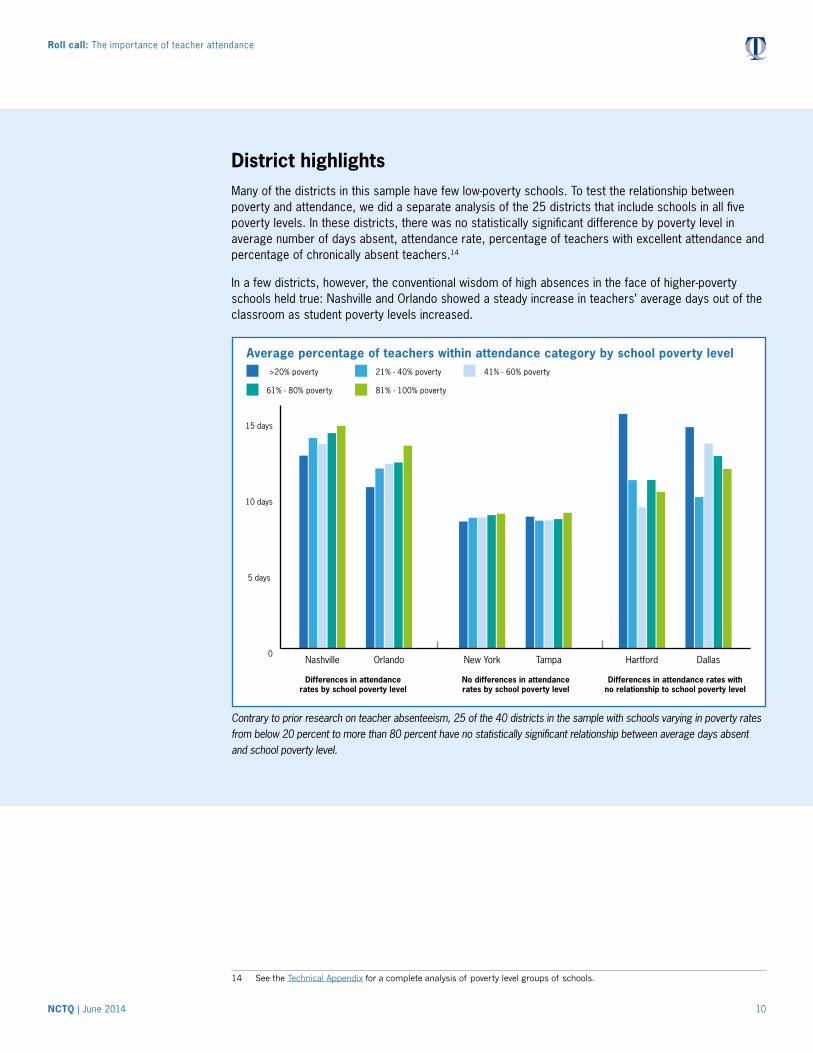
District highlightsMany of the districts in this sample have few low-poverty schools. To test the relationship between poverty and attendance, we did a separate analysis of the 25 districts that include schools in all five poverty levels. In these districts, there was no statistically significant difference by poverty level in average number of days absent, attendance rate, percentage of teachers with excellent attendance and percentage of chronically absent teachers.14
In a few districts, however, the conventional wisdom of high absences in the face of higher-poverty schools held true: Nashville and Orlando showed a steady increase in teachers’ average days out of the classroom as student poverty levels increased.
Average percentage of teachers within attendance category by school poverty level>20% poverty 21% - 40% poverty 41% - 60% poverty
61% - 80% poverty 81% - 100% poverty
0
5 days
10 days
15 days
DallasHartfordTampaNew YorkOrlandoNashville
Differences in attendance rates by school poverty level
No differences in attendance rates by school poverty level
Differences in attendance rates with no relationship to school poverty level
Contrary to prior research on teacher absenteeism, 25 of the 40 districts in the sample with schools varying in poverty rates from below 20 percent to more than 80 percent have no statistically significant relationship between average days absent and school poverty level.
14 See the Technical Appendix for a complete analysis of poverty level groups of schools.

NCTQ | June 2014 11
Roll call: The importance of teacher attendance
Leave taken by leave categorySick and personal leave account for 71 percent of the leave taken by teachers.
As expected, since all districts provide more days for illness than for personal reasons, sick leave was the most common type of leave taken by teachers overall, followed by personal leave and then professional leave, which occurs when teachers are out of the classroom for school- or district-related business such as professional development. Although professional leave is rarely counted as an ab-sence, teachers are out of the classroom, and students are not being taught by their teacher of record. Absences caused by teachers who are out of the classroom for union business, such as negotiations, are also included in this category. Districts could reduce these absences by scheduling professional development and other activities when school is not in session.
Percentage absence event by category
Sick Leave
Professional Leave
Personal Leave
Other Leave
39%
20%
32%
9%
Across all districts, sick and personal leave made up over 71 percent of the reasons for leave. Another 20 percent is attribut-able to professional leave for activities such as professional development.
Attendance incentivesAttendance rates did not differ among districts with or without formal poli-cies designed to encourage attendance.
Districts have a variety of policies meant to encourage good attendance and discourage excessive absences, and most of these policies are similar to one another. To examine the effect of these policies on attendance, we compared attendance rates in districts with incentive policies to those without them. In the districts studied, there was no relationship between any specific policy and increased or de-creased rates of teacher absenteeism.
For example, districts that allow teachers to carry over personal leave from year to year have almost the exact same teacher attendance rate as districts that do not allow personal leave to accrue from year to year.
Can personal leave carry over from school year to school year?
District Policy Number of Districts Average attendance rate
Yes, personal leave may carry over 23 94.3%
No, personal leave does not accrue 17 94.0%

NCTQ | June 2014 12
Roll call: The importance of teacher attendance
District strategies to increase teacher attendancePayment for unused sick leave at retirement
Paying teachers for unused sick leave at retirement is the most common way school districts encour-age good attendance.
Districts in our sample pay teachers for a certain percentage of accrued sick leave, ranging from 25 to 100 percent. Some districts limit the amount paid per day and cap the total number of accrued days. For example, on retirement in Orleans Parish, Louisiana teachers are paid the daily pay rate for their unused sick leave for up to 25 days. Teachers in Hartford are paid one day’s pay for each day in excess of 45 sick days, up to 30 days, which may yield a payment of approximately $14,500.15
Payment for unused sick leave at the end of the school year
Nine districts in our sample provide teachers the option of receiving some payment for unused sick leave at the end of the year: Baltimore City, Denver, District of Columbia, Jacksonville, Los Angeles, Milwaukee, Phoenix, Providence and Seattle.
Rewarding excellent attendance with additional leave or compensation
Giving teachers additional leave days or payment to reward excellent attendance is an incentive in nine districts: Cincinnati, Indianapolis, Kansas City, Salt Lake City, Los Angeles, Milwaukee, Pittsburgh, Phoe-nix and Oklahoma City.
• Ironically, Cincinnati rewards teachers who have high attendance with more leave. Teachers receive one extra sick day for having 96 percent attendance or better.
• Indianapolis teachers who have at least 97 percent attendance can carry over up to 4 personal days.
• In 2012-2013, Pittsburgh held a drawing each semester to give one teacher with excellent attend-ance a $500 bonus.
• In Los Angeles, the district pays teachers with unused sick leave up to $1,500 through available funds in its substitute teacher budget.
Restricting leave on specific dates
Districts discourage teachers from using leave by restricting the days when leave can be used: before or after holidays and vacations, during the first and last week of the school year, during state testing and/or on professional development days.
• 27 of the 40 districts in our sample have some type of policy to restrict or subject leave to refusal on particular days or times of the year.
Requiring medical certification for sick leave
Twenty-eight districts require teachers to provide medical certification after absences. This requirement is activated at different times in different districts—for example, from three days in Atlanta and Kansas City to 20 consecutive days of absence in Salt Lake City.
15 Sick leave pay-out calculated for a Hartford teacher with a Ph.D. with at least 10 years of experience.

NCTQ | June 2014 13
Roll call: The importance of teacher attendance
Including teacher attendance as a measure in teacher evaluations
In 2012-2013, 10 districts – Austin, Buffalo, Hartford, Houston, Indianapolis, Louisville, Newark, St. Lou-is, Tampa and the District of Columbia – explicitly included teacher attendance as a measure within the district’s teacher evaluation framework. In those 10 districts, this requirement is incorporated most of-ten as part of a broader evaluation measure describing the professionalism competency of the teacher.
Additional policies to encourage good attendance and discourage excessive absences
Some districts find creative ways to discourage excessive absences and encourage good attendance:
• In Austin, the University of Texas gives ticket vouchers for university events to teachers who meet teacher attendance goals or improve their students’ attendance (vouchers not applicable to UT football games).
• In Louisville, attendance data is considered in employee promotions.
• In Providence, once teachers are absent 135 days or more, they do not qualify for sick leave the following year, until they have worked at least 135 days.
Number of school districts0 5 10 15 20 25 30 35 40
Annual payment for accrued sick leave
Additional pay or leave days for good attendance
Some dates are restricted or subject to refusal
Medical certi�cation for sick leave
Payment for sick leave at retirement
Sick days carry over from year to year
Number of districts by attendance incentive
While districts took different incentive or punitive approaches to changing teacher attendance, no significant improvement was found in districts with or without such policies.
Attendance policies may have some impact on the attendance rates of chronically absent teachers.
With an average 94 percent attendance rate across districts, it makes sense to target attendance policy interventions on teachers who are chronically absent. Overall, attendance incentives did not affect the attendance of chronically absent teachers. However, in districts that implemented policies to encourage good attendance, chronically absent teachers were out of school approximately two fewer days than chronically absent teachers in districts that did not implement such policies.
Ten districts include teacher attendance as
a factor in their evaluation framework.
NCTQ | June 2014 14
Roll call: The importance of teacher attendance
Policy implications and future researchChronically absent teachers are a big problem for districts. With more-than-routine absences, teachers who are missing 10 percent of the school year, regardless of the legitimacy of their reasons, short-change their students.
Policies in place now to encourage better attendance bear further scrutiny. The common attendance incentives examined in this study did not have a significant impact on teacher attendance rates. Moving forward, therefore, union and district leaders may want to reexamine the time and money spent on cur-rent attendance incentives and to explore new, possibly more effective, efforts to support and improve teacher attendance.
While we were surprised to find little or no relationship between school poverty level and teacher at-tendance, further research is needed. What factors in high-poverty schools contribute to similar teacher attendance rates across school poverty levels? Are there differences within the poverty levels we exam-ined? Potential catalysts such as school climate, teacher and administrator leadership and community involvement might be subjects for future studies.
Some practices generally practiced by individual schools may be quite effective. Anecdotally, teachers and principals often cite school-based norms that shape the culture and tone around teacher attendance – perhaps more effectively than the broader and more distant formal district policies. Something as straightforward as principals expecting their teachers to call them directly when they must take leave can often shape school culture concerning teacher attendance. Other teachers report that absenteeism is held low when the school has a policy of not hiring substitutes, but distributing an absent teacher's students to other teachers in the school. Neither of these two practices was examined in this study.
Research has shown a significant negative impact on student achievement in classrooms where the teacher is absent for ten days. Yet in the average classroom in this study, teachers exceeded this level of absence, often for perfectly legitimate reasons and even in pursuit of becoming a more effective instructor. Given the time and attention spent on school programs, new curriculum and strategies to strengthen teacher quality, we may be overlooking one of the most basic, solvable and cost effective reasons why schools may fail to make educational progress. We owe it to our children to have the most effective policies and practices to make sure that teachers are present when the roll is called.

NCTQ | June 2014 Appendix – A | i
Roll call: The importance of teacher attendance
Appendix A: Districts included
City Official district name and location
Atlanta Atlanta Public Schools: Atlanta, GA
Austin Austin Independent School District: Austin, TX
Baltimore City Baltimore City Public Schools: Baltimore, MD
Buffalo Buffalo Public Schools: Buffalo, NY
Charlotte Charlotte-Mecklenburg Schools: Charlotte, NC
Cincinnati Cincinnati Public Schools: Cincinnati, OH
Cleveland Cleveland Metropolitan School District: Cleveland, OH
Columbus Columbus City Schools: Columbus, OH
Dallas Dallas Independent School District: Dallas, TX
Denver Denver County School District No. 1: Denver, CO
Hartford Hartford Public Schools: Hartford, CT
Houston Houston Independent School District: Houston, TX
Indianapolis Indianapolis Public Schools: Indianapolis, IN
Jacksonville Duval County Public Schools: Jacksonville, FL
Kansas City Kansas City Public Schools: Kansas City, MO
Los Angeles Los Angeles Unified School District: Los Angeles, CA
Louisville Jefferson County Public Schools: Louisville, KY
Milwaukee Milwaukee Public Schools: Milwaukee, WI
Minneapolis Minneapolis Public Schools: Minneapolis, MN
Nashville Metropolitan Nashville Public Schools: Nashville, TN
New Orleans Orleans Parish School Board: New Orleans, LA
New York City New York City Department of Education: New York, NY
Newark Newark Public Schools District: Newark, NJ
Oklahoma City Oklahoma City Public Schools: Oklahoma City, OK
Orlando Orange County Public Schools: Orlando, FL
Philadelphia The School District of Philadelphia: Philadelphia, PA
Phoenix Phoenix Union High School District: Phoenix, AZ
Pittsburgh Pittsburgh Public Schools: Pittsburgh, PA
Portland Portland Public Schools: Portland, OR
Providence Providence Public School District: Providence, RI
Sacramento Sacramento City Unified School District: Sacramento, CA
Salt Lake City Granite School District: Salt Lake City, UT
San Antonio Northside Independent School District: San Antonio, TX
San Diego San Diego Unified School District: San Diego, CA
San Francisco San Francisco Unified School District: San Francisco, CA
San Jose San Jose Unified School District: San Jose, CA
Seattle Seattle Public Schools: Seattle, WA
St. Louis St. Louis Public Schools: St. Louis, MO
Tampa Hillsborough County Public Schools: Tampa, FL
District of Coumbia District of Columbia Public Schools: Washington, DC

Roll call: The importance of teacher attendance
NCTQ | June 2014 Appendix – B | ii
Appendix B: Methodology
Data Requests
Districts were asked to provide the following for the 2012-2013 school year: • A list of teacher absences with a unique teacher identifier, school site, the reason for the absence, the dates of the absences, and
information regarding the assignment of a substitute;
• A complete teacher roster with school site;
• The percentage of students qualifying for free/reduced-lunch listed by school site;
• The district’s overall percentage of free/reduced lunch;
• The district’s substitute expenditures for the school year;
• The district’s substitute pay rates;
• The average length of elementary and secondary school days;
• Descriptions of policies that encourage teacher attendance and discourage teacher absenteeism; and
• A description of how the school district defines long-term leave.
Data requests were sent to 51 school districts, and 40 districts provided data sufficient for analysis.
Districts that did not provide data
This study was meant to include the core urban districts in the 50 largest metro areas. Eleven districts -- Birmingham, AL; Boston, MA; Chicago, IL; Clark County (Las Vegas), NV; Detroit, MI; Memphis, TN; Miami, FL; Richmond, VA; Riverside, CA; Virginia Beach, VA; and Wake County (Raleigh), NC -- are not part of our data set. Riverside’s absence data is not available by date, and teacher absences by pay period do not allow for the type of analysis in our study. Memphis was not able to produce the data, due to their merger with Shelby County Public Schools. Clark County, Virginia Beach and Wake County have state FOIA (Freedom of Information Act) laws that say a district is not obli-gated to create new records, and they did not provide data as requested. Richmond and Miami did not respond to our request to provide absence data with a unique teacher identifier and school location. Chicago, Boston and Birmingham did not provide the data as requested. Detroit provided data, but inconsistencies were found that ultimately excluded it from the study.
District data
Data from individual school districts were returned to NCTQ in a variety of forms. Several districts provided incomplete poverty information. The following sources were used to complete the datasets: the school district website and any documents or databases contained therein; U.S. Department of Education databases; and the NCTQ Teacher Contract Database.

NCTQ | June 2014 Appendix – C | iii
Roll call: The importance of teacher attendance
Appendix C: Findings by district
DistrictNumber of teachers
Average days absent
Attendance rate
Excellent attendance
Frequently absent
Moderate attendance
Chronically absen t
Atlanta 3,532 9.16 94.97% 24.94% 44.90% 18.69% 11.47%
Austin 5,636 10.19 94.55% 10.81% 45.99% 32.08% 11.12%
Baltimore City 4,446 10.39 94.53% 12.82% 45.41% 27.82% 13.95%
Buffalo 2,382 13.87 92.54% 30.27% 10.31% 22.59% 36.82%
Charlotte 8,778 11.46 94.09% 9.36% 42.87% 31.74% 16.03%
Cincinnati 1,778 11.77 93.57% 13.50% 46.34% 26.04% 14.12%
Cleveland 2,896 15.60 91.52% 5.58% 27.45% 33.17% 33.81%
Columbus, OH 2,151 14.82 91.90% 3.25% 28.13% 36.59% 32.03%
Dallas 9,395 11.93 93.66% 9.22% 46.52% 29.04% 15.22%
Denver 4,733 9.52 94.82% 21.89% 37.84% 27.83% 12.44%
Hartford 1,559 10.22 94.54% 21.91% 41.11% 23.13% 13.85%
Houston 8,266 9.68 94.83% 24.17% 38.43% 23.75% 13.65%
Indianapolis 2,041 6.09 96.71% 36.94% 45.61% 14.31% 3.14%
Jacksonville 6,642 13.91 92.68% 5.21% 27.69% 39.90% 27.21%
Kansas City 974 9.56 94.86% 21.46% 42.40% 23.92% 12.22%
Los Angeles 21,867 9.20 94.95% 20.19% 47.21% 22.00% 10.61%
Louisville, KY 5,773 8.11 95.61% 20.68% 49.02% 25.72% 4.57%
Milwaukee 3,943 8.25 95.59% 28.02% 40.71% 21.15% 10.12%
Minneapolis 2,904 9.27 95.07% 23.38% 37.22% 27.93% 11.47%
Nashville 4,129 14.24 92.35% 5.40% 27.22% 37.86% 29.52%
New Orleans 200 12.35 93.14% 6.50% 25.00% 52.50% 16.00%
New York 59,750 8.80 95.22% 15.60% 54.04% 22.93% 7.43%
Newark 2,879 11.25 94.11% 9.69% 43.63% 30.05% 16.64%
Oklahoma City 2,286 11.02 93.91% 17.45% 37.58% 27.17% 17.80%
Orlando 10,108 12.52 93.41% 8.06% 42.62% 36.88% 12.44%
Philadelphia 9,114 8.80 95.32% 20.28% 48.47% 22.27% 8.98%
Phoenix 1,316 10.23 94.47% 20.52% 37.84% 24.85% 16.79%
Pittsburgh 1,608 11.56 93.98% 12.06% 42.66% 27.99% 17.29%
Portland, OR 2,306 14.12 92.33% 6.81% 31.27% 33.56% 28.36%
Providence 2,012 12.89 93.03% 15.85% 35.79% 24.75% 23.61%
Sacramento 2,035 12.05 93.27% 14.20% 34.74% 31.60% 19.46%
Salt Lake City 1,279 9.15 95.08% 13.91% 52.41% 26.66% 7.02%
San Antonio 5,977 13.37 92.85% 3.90% 32.88% 41.53% 21.69%
San Diego 4,991 11.78 93.60% 12.30% 38.21% 31.48% 18.01%
San Francisco 3,286 9.87 94.60% 19.84% 38.28% 29.25% 12.63%
San Jose 1,290 11.00 94.09% 13.02% 41.78% 30.16% 15.04%
Seattle 3,030 10.05 94.51% 18.46% 40.25% 28.06% 13.23%
St. Louis 1,710 9.77 94.86% 16.08% 45.09% 27.89% 10.94%
Tampa 11,362 8.63 95.51% 16.19% 53.33% 24.41% 6.07%
District of Columbia 3,667 7.28 96.29% 29.12% 46.69% 18.46% 5.73%

1120 G Street NW, Suite 800Washington, D.C. 20005Tel: 202/393-0020 Fax: 202/393-0095Web: www.nctq.org
The National Council on Teacher Quality advocates for reforms in a broad range of teacher policies at the federal, state and local levels in order to increase the number of effective teachers.
Roll call: The importance of teacher attendance
NCTQ | June 2014 Technical Appendix | i
Technical Appendix
Data
Teacher attendance data was provided to NCTQ with dates listed in one of two ways: individual dates or a range of days. Using district teacher attendance data (data sets contain some method for uniquely identifying teachers), NCTQ analysts were able to determine the length of each teacher absence event. Absence events longer than 10 consecutive days were removed from the analysis to eliminate leave due to serious illness and maternity/paternity leave.
The total number of days absent was determined for individual teachers. This data was combined with the provided employee roster. Our data request was for an employee roster of only school-based teachers. When the employee roster contained job descriptions other than teacher, those individuals were removed from the analysis (nurses, principals, etc.). When no role description was provided, all employees on the roster were included in the analysis.
NCTQ analysts coded individual school sites based on their student populations to one of the following quintiles: 0-20 percent of students qualify for free/reduced lunch, 21-40 percent of students qualify for free/reduced lunch, 41-60 percent of students qualify for free/reduced lunch, 61-80 percent of students qualify for free/reduced lunch, or 81-100 percent of students qualify for free/reduced lunch. Using this information, the following was determined for the district as a whole as well as for each of the free/reduced-lunch categories: average number of absences per teacher per year; percentage of teachers with excellent attendance (those with 3 or fewer absences per year); percentage of teachers moderately absent (those with between 4 and 11 absences per year); percentage of teachers frequently absent (those with between 12 and 17 absences per year); percentage of teachers chronically absent (those with 18 or more absences per year); the top three reasons for teacher absence (when data was provided by district); and the most commonly missed day (when data was provid-ed by district).
All charter schools, private schools, and other nondistrict schools were removed from the analysis. When data identifying nondistrict schools were not available, the school district’s website and any documents contained therein were consulted to remove those schools. In all districts, the provided teacher roster was used as the primary teacher list. In other words, any individual listed on the absence list but not on the teacher roster was not included in the analysis. District data sets often included duplicate teacher records in either the teach-er absence list or the teacher roster. Duplicate records were removed to ensure that instances of teacher absence were unique. When duplicate absence events were linked to multiple school sites, the duplicate events were removed so that each teacher was assigned to one school for our analysis. In some cases the provided teacher absence list contained partial absence events. These absence events were counted as partial events when determining the total number of days absent per teacher but as full absences when excluding absence events longer than 10 days. Holidays were not taken into account when removing absence events longer than 10 days.
Significance testing
The Pearson’s r correlational coefficient test statistic was used to examine potential relationships among average days absent, attendance rate, percentage of teachers chronically absent, percentage of teachers with excellent attendance and district policies. Differences between free and reduced-lunch groups were examined using analysis of variance (ANOVA) means comparisons (see below). In either case, post hoc analysis was not required due to nonsignificant findings.

Roll call: The importance of teacher attendance
NCTQ | June 2014 Technical Appendix | ii
Findings by school poverty level
Analysis of means differences between free and reduced-lunch rate (FRL): Average days absent*
Groups Count of districts Sum Average Variance
0 – 20% poverty 25 253.75 10.15 5.20
21 – 40% poverty 34 343.97 10.12 7.66
41 – 60% poverty 35 369.22 10.55 6.97
61 – 80% poverty 39 426.48 10.94 4.64
81 – 100% poverty 40 443.06 11.08 6.01
*Only districts with all five poverty groups were included in this analysisThe derived value of F=1.09 does not exceed the tabled critical value of F=2.43 at p=0.05 with df1=4 and df2=168.
Analysis of means differences b/t free and reduced-lunch rate (FRL): Attendance rate*
Groups Count of districts Sum Average Variance
0 – 20% poverty 25 23.64 0.95 0.00
21 – 40% poverty 34 32.15 0.95 0.00
41 – 60% poverty 35 33.02 0.94 0.00
61 – 80% poverty 39 36.71 0.94 0.00
81 – 100% poverty 40 37.62 0.94 0.00
*Only districts with all five poverty groups were included in this analysis.The derived value of F=1.12 does not exceed the tabled critical value of F=2.43 at p=0.05 with df1=4 and df2=120.
Analysis of means differences b/t free and reduced-lunch rate (FRL): Percentage excellent attendance*
Groups Count of districts Sum Average Variance
0 – 20% poverty 25 4.01 0.16 0.01
21 – 40% poverty 34 6.22 0.18 0.01
41 – 60% poverty 35 5.44 0.16 0.01
61 – 80% poverty 39 6.24 0.16 0.01
81 – 100% poverty 40 6.22 0.16 0.01
*Only districts with all five poverty groups were included in this analysis.The derived value of F=0.62 does not exceed the tabled critical value of F=2.43 at p=0.05 with df1=4 and df2=120.
Analysis of means differences b/t free and reduced-lunch rate (FRL): Percentage chronic absence*
Groups Count of Districts Sum Average Variance
0 – 20% poverty 25 3.16 0.13 0.01
21 – 40% poverty 34 4.34 0.13 0.01
41 – 60% poverty 35 5.19 0.15 0.01
61 – 80% poverty 39 6.21 0.16 0.01
81 – 100% poverty 40 6.66 0.17 0.01
*Only districts with all five poverty groups were included in this analysis.The derived value of F=1.40 does not exceed the tabled critical value of F=2.45 at p=0.05 with df1=4 and df2=120.