role of microrna-709 in murine liver sneha surendran
TRANSCRIPT

ROLE OF microRNA-709 IN MURINE LIVER
Sneha Surendran
Submitted to the faculty of the University Graduate School
in partial fulfillment of the requirements
for the degree
Doctor of Philosophy
in the Department of Medical and Molecular Genetics,
Indiana University
August 2014

ii
Accepted by the Graduate Faculty, Indiana University, in partial
fulfillment of the requirements for the degree of Doctor of Philosophy.
____________________________________
Núria Morral, Ph.D., Chair
____________________________________
Brittney-Shea Herbert, Ph.D.
Doctoral Committee
____________________________________
Mircea Ivan, MD, Ph.D.
May 8, 2014
____________________________________
Robert Considine, Ph.D.
____________________________________
Nadia Carlesso, M.D., Ph.D.

iii
To my parents, Gracia and my grandparents

iv
ACKNOWLEDGEMENTS
My Ph.D. journey would not have been possible without the support from both
my teachers and family. I would first like to thank my mentor, Dr. Núria Morral, for
giving me the opportunity to pursue my Ph.D. under her guidance. I have benefited
immensely from her vast knowledge of gene therapy and diabetes. Her scientific ideas,
guidance and support have been instrumental in the successful completion of my
research. She ensured that I stayed on course and focused on my objective. I would also
like to thank the members of my research committee, Dr. Brittney-Shea Herbert, Dr.
Mircea Ivan, Dr. Robert Considine and Dr. Nadia Carlesso for their critical evaluations,
insights and guidance.
I would like to thank members of the Morral lab including Dr. Miwon Ahn, Dr.
Jae-Seung Park, Dr. Yongyong Hou, Aisha Gamble and Victoria Jideonwo. I was
fortunate to work with them on a number of projects, which enabled me to learn some of
the methods used in this study. I am fortunate to have had friends in my colleagues. I am
also grateful to summer research students John Murray and Chris Merchun for their help
with this work. I would like to thank Dr. Janaiah Kota and Dr. Guoli Dai for sharing liver
tissues for this research. I would like to thank Dr. Yunlong Liu and Chirayu Goswami for
their help and guidance on statistical analyses. I am indebted to Dr. Kenn Dunn and Dr.
Jennifer Ryan for their help with microscopy for hepatocyte polarization experiments. I
am also grateful to Dr. William A. Truitt and Pamela Minick for all the help with
TaqMan Low Density Arrays. I would also like to thank Seth Winfree and Indiana Center

v
for Biological Microscopy for their help with imaging labeled miRNA. I am also thankful
to Dr. Edenberg and Dr. Jeanette McClintick and the Center for Medical Genomics for
their help with the Affymetrix microarray. I am also immensely grateful to the DeVault
Diabetes & Obesity Program and the American Heart Association Midwest for
supporting me with pre-doctoral fellowships.
I would like to thank the faculty and staff at the Center for Diabetes Research. I
am also thankful to the members of the Department of Medical and Molecular Genetics,
especially Peggy Knople and Jean Good as well as the staff of the IUPUI Graduate Office
and the Graduate Division of the Indiana University School of Medicine for their help
during the course of my study.
Lastly, I would like to offer my heartfelt thanks to my family for their constant
support and encouragement in the pursuit of my personal and professional objectives. I
am very thankful to my parents, sister and Gracia for their unconditional love and support
even from such a long distance. I wouldn’t be me without my family. Their motivation
and support has helped me progress along smoothly and I would like to express my
sincere gratitude to them. I am also thankful to my friends and in-laws for their constant
words of encouragement. Finally, this work would not have been possible without the
constant love, support and encouragement from my husband.

vi
Sneha Surendran
ROLE OF microRNA-709 IN MURINE LIVER
MicroRNA are small RNA molecules that regulate expression of genes involved
in development, cell differentiation, proliferation and death. It has been estimated that in
eukaryotes, approximately 0.5 to 1% of predicted genes encode a microRNA, which in
humans, regulate at least 30% of genes at an average of 200 genes per miRNA. Some
microRNAs are tissue-specific, while others are ubiquitously expressed. In liver, a few
microRNAs have been identified that regulate specialized functions. The best known is
miR-122, the most abundant liver-specific miRNA, which regulates cholesterol
biosynthesis and other genes of fatty acid metabolism; it also regulates the cell cycle
through inhibition of cyclin G1. To discover other miRNAs with relevant function in
liver, we characterized miRNA profiles in normal tissue and identified miR-709. Our data
indicates this is a highly abundant hepatic miRNA and is dysregulated in an animal
model of type 2 diabetes. To understand its biological role, miR-709 gene targets were
identified by analyzing the transcriptome of primary hepatocytes transfected with a miR-
709 mimic. The genes identified fell within four main categories: cytoskeleton binding,
extracellular matrix attachment, endosomal recycling and fatty acid metabolism. Thus,
similar to miR-122, miR-709 downregulates genes from multiple pathways. This would
be predicted, given the abundance of the miRNA and the fact that the estimated number
of genes targeted by a miRNA is in the hundreds. In the case of miR-709, these suggested
a coordinated response during cell proliferation, when cytoskeleton remodeling requires
substantial changes in gene expression. Consistently, miR-709 was found significantly

vii
upregulated in an animal model of hepatocellular carcinoma. Likewise, in a mouse model
of liver regeneration, mature miR-709 was increased. To study the consequences of
depleting miR-709 in quiescent and proliferating cells, primary hepatocytes and
hepatoma cells were cultured with antagomiRs (anti-miRs). The presence of anti-miR-
709 caused cell death in proliferating cells. Quiescent primary hepatocytes responded by
upregulating miR-709 and its host gene, Rfx1. These studies show that miR-709 targets
genes relevant to cystokeleton structural genes. Thus, miR-709 and Rfx1 may be needed
to facilitate cytoskeleton reorganization, a process that occurs after liver injury and
repopulation, or during tumorigenesis.
Núria Morral, Ph.D., Chair

viii
TABLE OF CONTENTS
LIST OF TABLES .............................................................................................. xii
LIST OF FIGURES ........................................................................................... xiii
LIST OF ABBREVIATIONS ........................................................................... xvi
INTRODUCTION
A. Role of liver in metabolism ...........................................................................1
B. Liver organization .........................................................................................4
C. Hepatocyte polarity and cytoskeletal organization .......................................7
D. MicroRNAs .................................................................................................11
E. Role of miRNAs in liver function ...............................................................17
F. Thesis hypothesis and Research Aims .........................................................24
MATERIALS AND METHODS
A. Materials......................................................................................................26
1. Plasmids ...................................................................................................26
2. Primers .....................................................................................................26
3. Mice .........................................................................................................27
a. Liver miRNA analysis ......................................................................27
b. Primary hepatocyte isolation ............................................................27
c. miRNA profiles under fed, fasted, refed conditions ........................27
d. Relative expression of pre-miR-709 vs mature miR-709 ................27
4. Antibodies ...............................................................................................28
5. Other reagents ..........................................................................................28
a. Plasmid isolation ..............................................................................28

ix
b. RNA isolation ..................................................................................29
c. Protein isolation ...............................................................................29
d. DNA gel extraction ..........................................................................29
e. Ligation ............................................................................................29
f. PCR ...................................................................................................29
g. qRT-PCR..........................................................................................29
h. TaqMan miRNA Assay....................................................................30
i. Protein quantification ........................................................................30
j. Western blot detection ......................................................................30
k. LDH assay ........................................................................................30
l. Transfection ......................................................................................30
m. LB broth ..........................................................................................30
n. Bacteria for subcloning ....................................................................30
o. Cell lines ..........................................................................................30
B. Methods .......................................................................................................30
1. Plasmid cloning .......................................................................................31
2. Primary hepatocyte isolation ...................................................................35
2.a. Primary hepatocyte sandwich experiments ...................................35
2.b. Sodium fluorescein assay ..............................................................36
2.c. Imaging of labeled miR-709 in primary hepatocytes ....................37
3. Cell culture ..............................................................................................37
3.a. Imaging of labeled miR-709 in Hepa1c1c cells ............................38
3.b. LDH assay in Hepa1c1c cells .......................................................38

x
4. Cell transfection ......................................................................................39
a. Using plasmids and miRNA.............................................................39
b. Using plasmids .................................................................................39
c. Using miRNA/siRNA/antagomiRs/anti-miRs .................................40
5. miRNA target predictions .......................................................................40
6. Array analyses .........................................................................................40
a. miRNA microarray ...........................................................................40
b. mRNA Affymetrix analysis .............................................................42
c. Taqman low Density Array ..............................................................43
7. Western blotting ......................................................................................44
8. Northern blotting .....................................................................................45
9. LDH assay ...............................................................................................46
10. qPCR analysis ........................................................................................46
a. qRT-PCR ..........................................................................................46
b. TaqMan assay to quantify mature miRNAs .....................................47
11. Statistical analysis .................................................................................47
RESULTS
A. Hepatic murine miRNA expression ............................................................48
A.1 Identification of miRNAs expressed in livers of normal and
db/db mice .....................................................................................................48
A.2 Differential expression of hepatic microRNAs in the fasted and
refed state ......................................................................................................53
B. Targets of miRNA-709 in murine liver ......................................................59

xi
B.1. miR-709-3p is the mature strand of miRNA-709 ..................................59
B.2. miR-709-induced transcriptome ............................................................63
B.3. Ces1g, Rab11b and Pctp are direct targets of miR-709 ........................73
B.4. Database gene predictions .....................................................................76
C. Biological Role of miRNA-709 In Liver ....................................................79
C.1. miR-709 gene targets do not regulate hepatocyte polarity ....................79
C.2. Intracellular miR-709 localization ........................................................87
C.3. Pre-miR-709 accumulates in liver .........................................................92
C.4. miR-709 inhibition elicits cell death .....................................................99
C.5. Mature levels of miR-709 do not increase in db/db livers ..................103
DISCUSSION .....................................................................................................104
FUTURE DIRECTIONS ...................................................................................113
REFERENCES ...................................................................................................114
CURRICULUM VITAE

xii
LIST OF TABLES
Table 1. Oligonucleotides used to generate luciferase constructs and
primers used for PCR .........................................................................................................26
Table 2. Antibodies used for Western blotting ..................................................................28
Table 3. miRNAs expressed in liver of normal C57BLKS/J mice. ...................................51
Table 4. Blood glucose and body weight ...........................................................................54
Table 5. miRNAs differentially expressed between fasted and refed
groups .................................................................................................................................55
Table 6. Predicted pathway regulation by miRNAs ..........................................................58
Table 7. Genes significantly downregulated >2-fold in miR-709-treated
primary hepatocytes ...........................................................................................................66
Table 8. Predicted versus observed miR-709 target genes ................................................77
Table 9. Overlap between miR-709 target genes and hsa-miR-1827
predicted targets .................................................................................................................78

xiii
LIST OF FIGURES
Figure 1. Metabolic pathways in liver .................................................................................3
Figure 2. Liver cross section ................................................................................................6
Figure 3. Liver lobule and portal triad .................................................................................6
Figure 4. Hepatocyte polarity ..............................................................................................9
Figure 5. Endosomal recycling in hepatocytes ....................................................................9
Figure 6. Processing of miRNA .........................................................................................15
Figure 7. Structural components of a pre-miRNA .............................................................16
Figure 8. Role of miR-122 in liver.....................................................................................19
Figure 9. Schematic representation of the psi-CHECK2 plasmid used for generating
constructs for luciferase reporter assays ............................................................................31
Figure 10. Schematic representation of plasmids expressing pri-miR-709
and pri-Cel-239b ................................................................................................................34
Figure 11. Hierarchical clustering analysis of miRNAs with p-value < 0.01 ....................50
Figure 12. miR-709 strand selection in primary hepatocytes. ...........................................60
Figure 13. miR-709 strand selection in the Hepa1c1c7 cell line. ......................................61
Figure 14. Strand selection of endogenous miR-709 in primary
hepatocytes .........................................................................................................................62
Figure 15. miR-709 quantification in primary hepatocyte transfected with
mimic .................................................................................................................................62
Figure 16. Hierarchical cluster of top 100 genes ...............................................................64
Figure 17. Real time RT-PCR analysis of miR-709 targets...............................................69
Figure 18. Prolonged downregulation of miR-709 targets over time ................................70

xiv
Figure 19. miR-709 on Rab11b, Timp3 and Dync1li1 protein levels ...............................71
Figure 20. miR-709 decreases Rab11b in Hepa1c1c cells .................................................72
Figure 21. miR-709 putative binding sites in the 3’ UTR of Rab11b, Ces1g
and Pctp ..............................................................................................................................74
Figure 22. Rab11b, Pctp and Ces1g are direct targets of miR-709....................................75
Figure 23. Formation of bile canaliculi between primary hepatocytes
cultured in a sandwich configuration .................................................................................82
Figure 24. Uptake and secretion of sodium fluorescein ....................................................83
Figure 25. Sodium fluorescein transport in primary hepatocytes
transfected with miR-709 and Cel-239b ............................................................................84
Figure 26. Rab11b silencing in mouse primary hepatocytes .............................................85
Figure 27. Sodium fluorescein transport in primary hepatocytes treated
with siRab11b ....................................................................................................................86
Figure 28. Intracellular localization of miR-709 in primary hepatocytes ..........................89
Figure 29. Intracellular localization of miR-709 in Hepa1c1c ..........................................90
Figure 30. Cytoplasmic miRNA localization in Hepa1c1c cells transfected
with miRNA-709 ...............................................................................................................91
Figure 31. Relative abundance of pre- and mature miR-709 in an animal
model of hepatocellular carcinoma ....................................................................................94
Figure 32. Relative abundance of pre- and mature miR-122 in an animal
model of hepatocellular carcinoma ....................................................................................95
Figure 33. Levels of mature miR-709 in HEK293 and Hepa1c1c cells upon transfection
with plasmids expressing pri-miR-709 or pri-Cel-239b ....................................................96

xv
Figure 34. Relative abundance of miR-709 in an animal model of liver regeneration ......97
Figure 35. qPCR analysis of miR-709 and Rfx1 in animal models of liver regeneration
and hepatocellular carcinoma ............................................................................................98
Figure 36. miR-709, Rab11b, Ces1g and Rfx-1 expression in primary hepatocytes
transfected with anti-miR-709. ........................................................................................100
Figure 37. Cell viability assay in Hepa1c1c cells transfected with miR-709 inhibitor ...102
Figure 38. Levels of mature miR-709 in livers of db/db mice .........................................103

xvi
LIST OF ABBREVIATIONS
°C Degree Celsius
μM Micromolar
3’-UTR 3’-Untranslated region
Abca1 Adenosine triphosphate–binding cassette (ABC) transporter,
member 1
Acc1 Acyl-CoA carboxylase 1
Acl ATP-dependent citrate lysase
Acox2 Acyl-CoA oxidase 2
Adam10 A disintegrin and metalloprotease family 10
Adam17 A disintegrin and metalloprotease family 17
AGO Argonaute
Agpat1 Acylglycerol-3-Phosphate O-Acyltransferase 1
Anova Analysis of variance
ATCC American Type Culture Collection
bp Base pair
BCL-2 B-cell lymphoma 2
Bcrp Breast Cancer Resistance Protein
Bsep Bile Salt Export Pump
CAT-1 Cationic amino acid transporter-1
cDNA Complementary DNA
Cel-239b Caenorhabditis elegans miRNA 239b

xvii
Ces1g Carboxylesterase 1G
CD36 Cluster of Differentiation 36
CD44 CD44 Molecule
CIDEC Cell Death-Inducing DFFA-Like Effector C
Ct Threshold cycle
CPT1α Carnitine palmitoyl transferase 1α
CUTL1 Cut-like homeobox 1
Cyc-A Cyclophillin A
Db/db Mice homozygous for a point mutation in the leptin receptor gene,
rendering them deficient in leptin receptor activity
DCP2 mRNA-decapping enzyme 2
DNA Deoxyribonucleic acid
DGAT2 Diacylglycerol acyltransferase-2
DGCR8 Digeorge syndrome critical region gene 8
Dync1li1 Dynein cytoplasmic light chain 1
ECL Enhanced chemiluminescence
ECM Extracellular matrix
E. coli Escherichia coli
EGTA Ethylene glycol tetraacetic acid
ELOVL6 ELOVL fatty acid elongase 6
ENaC Epithelial sodium channel
ERC Endosomal recycling compartment
FAM 6-carboxyfluorescein

xviii
FAS Fatty acid synthase
FBS Fetal bovine serum
G6pase Glucose 6-phosphatase
Gck Glucokinase
GCOS GeneChip® Operating System
Gk Glucokinase
Gns Glutamine synthetase
Gpt Glutamic-pyruvate transaminase
Gpx Glutathione peroxidase
HBSS Hank’s Balanced Salt solution
HCC Hepatocellular carcinoma
HCV Hepatitis C Virus
HDL High-density lipoprotein
HFD High-fat diet
HIF-1α Hypoxia Inducible Factor 1, Alpha Subunit
HIST1H2BC Histone cluster 1, H2bc
HMGCR HMGCoA reductase
HRP Horse radish peroxidase
hsa-miR-1827 Homo sapiens microRNA-1827
IGF1 Insulin-like growth factor 1
IGF1R Insulin-like growth factor 1 receptor
INSR Insulin receptor
IRS-2 Insulin receptor substrate-2

xix
IRS-4 Insulin receptor substrate 4
kb Kilobase
LAP Liver activator promoter
LDH Lactate dehydrogenase
Ldlr Low-density lipoprotein receptor
LOWESS Locally-weighted Regression
LPL Lipoprotein lipase
MAPRE1 Microtubule-Associated Protein, RP/EB Family, Member 1
Mb Megabase
MCS Multiple cloning site
Mdr1 Multidrug resistance gene 1
Mdr2 Multidrug resistance gene 2
MET Met Proto-Oncogene
ml Milliliter
miRISC miRNA-induced silencing complex
miRNA microRNA
miR-709 microRNA-709
mmu-miR-709 Mus musculus miRNA-709
Mrp1 Multidrug resistance-associated protein 1
Mrp2 Multidrug resistance-associated protein 2
Mrp3 Multidrug resistance-associated protein 3
Mrp4 Multidrug resistance-associated protein 4
Mrp6 Multidrug resistance-associated protein 6

xx
mTOR Mammalian Target Of Rapamycin
MVB Multivesicular bodies
ng nanogram
nM nanomolar
N/A Not available
NAFLD Non-alcoholic fatty liver disease
NASH Non-alcoholic steatohepatitis
NDRG3 N-Myc Downstream-Regulated Gene 3
Ntcp Na/Taurocholate Cotransporting Polypeptide
P450 Cytochrome P450
P-bodies Processing bodies
P/S Penicillin/streptomycin
PCA Principal component analysis
Pck Phosphoenolpyruvate carboxykinase
PCR Polymerase chain reaction
Pctp Phosphatidylcholine transfer protein
Pfkl Phosphofructokinase liver
Pkl Pyruvate kinase
PPAR-α Peroxisome proliferator-activated receptor-α
pre-miRNA Precursor miRNA
pri-miRNA Primary transcript of a miRNA
pri-miR-15a/16-1 Primary transcript of miR-15a and 16-1
QC Quality control

xxi
qRT-PCR Quantitative real-time polymerase chain reaction
Rab11b Member RAS oncogene family
RISC RNA-induced Silencing Complex
RNase Ribonuclease
RNA Ribonucleic acid
RNAi RNA interference
RPS10 40S ribosomal protein S10
RT Reverse transcription
SD Standard deviation
SEC Sinusoidal endothelial cells
siNC Negative control siRNA
siRab11b siRNA against Rab11b
siRNA Silencing RNA
SIRT1 Sirtuin 1
sno-202 Small nucleolar RNA 202
SNP Single nucleotide polymorphism
SREBP-1 Sterol-regulatory element binding protein 1
SREBP-1c Sterol-regulatory element binding protein 1c
SREBP-2 Sterol-regulatory element binding protein 2
tTA Transactivator protein
T2DM Type 2 diabetes mellitus
TBP TATA binding protein
TLDA TaqMan low density array

xxii
TRBP TAR RNA binding protein
TuD Tough Decoy
UDPGT UDP glucuronate transferease
VLDL Very low-density lipoprotein
WAT White adipose tissue
WT Whole transcript
XPO5 Exportin 5
XRN1 Exoribonuclease 1

1
INTRODUCTION
A. Role of liver in metabolism
The liver is the largest metabolic organ in the human body8. Various metabolic
pathways occurring in this tissue, including carbohydrate metabolism (gluconeogenesis,
glycolysis, glycogenesis, glycogenolysis), lipid metabolism (cholesterol and triglyceride
synthesis and export, fatty acid oxidation, ketogenesis) and protein metabolism (synthesis
and degradation), are essential for whole body homeostasis (Figure 1). Finally, the liver
produces bile, which is critical for emulsification of lipids and aids in digestion of lipids
in the small intestine.
Maintaining blood glucose levels within a narrow range is vital for the body, both
in periods of feeding and fasting. This important function of glucose homeostasis is
carried out by hepatocytes in the liver. Upon feeding, glucose is broken down into
pyruvate through glycolysis to produce energy for the cells. In addition, excess glucose is
taken up by the liver and converted into glycogen (glycogenesis). In periods of fasting,
the glycogen stores in the liver are used to produce glucose (glycogenolysis); in addition,
the liver synthesizes glucose from amino acids, glycerol, and lactate, through the
gluconeogenesis pathway.
The liver also plays an important role in lipid metabolism. In the fed state, excess
glucose is converted into fatty acids (de novo lipogenesis) and subsequently esterified
into triglycerides, which remain as droplets in the cytoplasm or can be secreted from the

2
liver into the circulation via very low-density lipoprotein (VLDL) for use by other
tissues. In the fasted state, the liver can actively oxidize fatty acids to produce ketone
bodies that are exported into circulation, thereby providing an alternate energy source for
other organs in the body, in particular for the brain. The liver also synthesizes cholesterol,
lipoproteins and phospholipids. Some of the cholesterol is converted into bile salts. In
addition to cholesterol, the bile contains organic and inorganic solutes that make up 5%
of the bile9. The apical membranes of adjacent hepatocytes form a canalicular network
through which bile is secreted from the hepatocytes9. Bile synthesis is regulated by
transport systems localized on the apical membrane of hepatocytes9.
Protein metabolism is another important function of the liver. This tissue
synthesizes non-essential amino acids and makes most of the plasma proteins such as
albumin and clotting factors. The liver is also involved in breakdown of amino acids by
deamination and transamination, and removes ammonia from the bloodstream,
converting it into urea for excretion.

3
Figure 1. Metabolic pathways in liver. Source: Adapted from image obtained from
http://www.elmhurst.edu/~chm/vchembook/600glycolysis.html

4
B. Liver organization
The liver is a complex organ with at least 15 different cell types8. Hepatocytes
comprise approximately 60% of the cells and take up 80% of the volume in the liver,
while sinusoidal endothelial cells (SEC), Kupffer cells and hepatic stellate cells represent
20%, 15% and 5% of cells, respectively8. Each of these four major cellular types has
specific functions. Hepatocytes, in particular, play important roles in maintaining lipid
and glucose homeostasis.
The liver’s blood supply is one of its kind; it receives venous blood from the
portal vein, as well as oxygenated blood from the hepatic artery8. The blood from these
vessels flows through the liver sinusoids, a highly branched discontinuous network of
blood vessels, before it is delivered to the hepatocytes8. Hepatocytes are arranged into
hexagonal lobules, the liver’s functional unit (Figure 2 and 3). At the center of the lobule
is a central vein. The central veins from multiple lobules combine to form the hepatic
vein, which eventually joins the inferior vena cava. At the junction of several lobules is a
portal triad, consisting of branches of hepatic artery, hepatic portal vein and interlobular
bile ducts. Hepatocytes closer to the entering vascular supply (periportal) receive the
most oxygenated blood while hepatocytes close to the central vein (perivenous) receive
the least oxygenated blood. This results in a metabolic zonation, wherein the amount of
liver enzymes and their activities vary in periportal and perivenous hepatocytes10
.
Periportal hepatocytes are rich in enzymes such as phosphoenolpyruvate carboxykinase
(PCK), glucose 6-phosphatase (G6Pase) (carbohydrate metabolism), HMG-CoA
reductase (HMGCR) (lipid metabolism) and glutamic-pyruvate transaminase (GPT),

5
glutathione peroxidase (GPX) (amino acid metabolism)10
. Periportal hepatocytes are
specialized in oxidative functions such as β-oxidation of fatty acids, gluconeogenesis,
bile formation and cholesterol synthesis10
. Also, sub-cellular organelles such as
mitochondria and bile canaliculi are more abundant in periportal hepatocytes compared to
perivenous hepatocytes10
. On the other hand, perivenous hepatocytes are abundant in
enzymes such as glucokinase (GK), pyruvate kinase (PKL) (carbohydrate metabolism),
Acetyl-coA carboxylase (ACC), ATP-dependent citrate lysase (ACL), fatty acid synthase
(FAS) (lipid metabolism), glutamine synthetase (GNS) (amino acid metabolism) and
cytochrome P450 (P450), UDP glucuronate transferease (UDPGT) (xenobiotic
metabolism)10
. These hepatocytes are preferentially involved in glucose uptake for
glycogen synthesis, glycolysis, lipogenesis, and detoxification10
.

6
Figure 2. Liver cross section. The arrangement of sinusoids, hepatocytes and bile
canaliculi is shown. Source: Image from8.
Figure 3. Liver lobule and portal triad.
(Source: Image from http://en.wikipedia.org/wiki/File:Hepatic_structure.png)

7
C. Hepatocyte polarity and cytoskeletal organization
The liver is known second after brain for its complexity in structure and
function11
. Hepatocytes are the major cell type in the liver, comprising 80% of the
volume11
. Like all epithelial cells, hepatocytes must be polarized with well-defined apical
and basolateral membranes to be functional12,13
. The apical and basal surfaces are
separated by tight junctions8 (Figure 4). Specific functions are performed depending on
the polarity (apical versus basolateral domain) of the hepatocytes14
. Each of these
domains is characterized by specific marker proteins. Hepatic apical or canalicular
membrane is characterized by expression of proteins such as Breast Cancer Resistance
Protein (Bcrp), Bile Salt Export Pump (Bsep), Multidrug resistance-associated protein 2
(Mrp2), multidrug resistance gene 1 (Mdr1) and multidrug resistance gene 2 (Mdr2)
whereas basolateral markers include Multidrug resistance-associated protein 1 (Mrp1),
Multidrug resistance-associated protein 3 (Mrp3), Multidrug resistance-associated protein
6 (Mrp6), Multidrug resistance-associated protein 2 (Mrp4) and Na/Taurocholate
Cotransporting Polypeptide (Ntcp)13
. Bile canaliculi are formed on the apical membrane
of two adjacent hepatocytes and bile acid transporters are confined to this domain14,15
.
The basolateral surface of hepatocytes is involved in trafficking of metabolites from the
bloodstream14
. Hepatocytes constantly internalize extracellular ligands and other
materials by endocytosis16,17
. The endocytosed products are either recycled back to the
cell surface, destined for lysosomal degradation, or undergo transcytosis to the opposite
membrane8,16
(Figure 5). These are mediated by very dynamic and diverse endosomal
compartments17
.

8
Receptors bound to their ligands at the basolateral membrane are taken up into
early endosomes and are separated from their ligand17,18
. This occurs at the periphery of
the cell. The receptor can then recycle back while the ligand destined for degradation has
to pass through late endosomes, pre-lysosomes, or multivesicular bodies (MVBs) before
being delivered to the lysosomes17
. Substrates of apical proteins are also endocytosed and
transported from the basolateral membrane to the apical membrane of the hepatocyte, and
are then released into the bile canaliculi18
. Many of the apical proteins synthesized in the
cell are first sent to the basolateral membrane before being transported to their final
destination, the apical membrane18
. This emphasizes the importance of endocytosis in
hepatocytes.
The extracellular matrix (ECM) of the liver plays a vital role in endocytosis. It is
primarily made up of type I collagen and is crucial for hepatic function11
. The ECM
comprises many elements such as matrix metalloproteinases; the glycoproteins laminin,
fibronectin, vitronectin, undulin, nidogen (entactin); and proteoglycans such as heparan
sulfate11
. Recently, miRNAs have been shown to play a key role in regulating the
expression of ECM proteins. miR-29 targets key ECM proteins such as laminin, nidogen
and fibrillin and members of miR-29 family have been shown to be downregulated in
liver fibrogenesis. miR-199 is upregulated during fibrogenesis and targets matrix
metalloproteinases and collagen proteins. This highlights the importance of miRNAs in
maintaining the ECM of hepatocytes, which is critical for hepatic polarity.

9
Figure 4. Hepatocyte polarity. BC, Bile canaliculi; +++ Basolateral membrane; - - -
Apical membrane. (Source: Modified from13
).

10
Figure 5. Endosomal recycling in hepatocytes. Steps 1, 2, and 3: Receptor mediated
endocytosis of receptor bound to ligand. Step 4: Ligand is separated from the receptor in
early endosome. 5, 6, and 7: Ligand is either degraded in lysosome or transported into
bile canaliculi depending on the final destination of the ligand. Step 8: Receptor is
recycled back to the cell surface. Steps I, II, and III: Recycling ligand is endocytosed in
clathrin coated vesicles. Steps IV, V, VI, VII, and VIII: The ligand is recycled back to the
cell surface.(Source: Adapted from18
)

11
D. MicroRNAs
MicroRNAs (miRNAs) are a class of small non-coding RNAs that are highly
conserved19
and are widely expressed in plants, animals, and some viruses. Mature
miRNAs are typically 18-25 nucleotides in length and these regulate gene expression
post-transcriptionally20
. It has been estimated that the human genome encodes over 1,000
miRNAs21
, which may target about 60% of mammalian genes22
. Over 1,800 murine
mature miRNAs have been identified so far (www.miRBase.org). miRNAs modulate
gene function post-transcriptionally by either specific inhibition of translation or
induction of target mRNA cleavage23
. A single miRNA can target multiple mRNA
targets, and each mRNA can be targeted by many miRNAs20
. This feature allows
miRNAs to alter multiple gene expression regulatory networks20
. Initial studies on
miRNA biology indicated that miRNAs regulate their targets mostly at the protein
synthesis level and regulate gene expression by mRNA degradation to a lower extent.
However, there is increasing evidence that miRNAs target mRNA to a larger extent than
initially thought24
, and most of the miRNA-mediated repression on its targets is caused
by mRNA destabilization as opposed to the prior scenario of ‘translational-
repression’24,25
.
MiRNA processing. miRNA genes are mostly transcribed by RNA polymerase II,
although some are transcribed by RNA polymerase III26,27
. The primary miRNA
transcript (pri-miRNA) is synthesized in the nucleus of cells and is polyadenylated and
capped, similar to messenger RNAs20,28,29
. The pri-miRNA contains regions that are not
perfectly complementary, forming a stem-loop structure. In mammals, this pri-miRNA

12
undergoes further processing by two ribonuclease (RNase) III family members: Drosha
and Dicer28
. The pri-miRNA is cleaved by the complex consisting of Drosha and co-
factor DiGeorge syndrome critical region gene 8 (DGCR8), to form precursor miRNA
(pre-miRNA)20,28
. The pre-miRNA, a 60-100 nucleotides long hairpin structure, is then
exported from the nucleus into the cytoplasm by the Exportin 5 (XPO5)/Ran-GTP
complex20,28
. In the cytoplasm, Dicer and TAR RNA binding protein (TRBP) then cleave
off the loop from the pre-miRNA structure leaving behind an 18-25 nucleotides long
dsRNA duplex20,28
. This duplex is comprised of a guide strand and a passenger strand,
each of which has a different purpose in the cell28
. The guide strand is taken up by
Argonaute (AGO) to form the Argonaute-containing miRNA-induced silencing complex
(miRISC)20
while the passenger stand is degraded28
. miRISC can then bind to the 3’
untranslated region (UTR) of target mRNAs by partial base pairing and lead to mRNA
degradation or translational repression20,30-35
(Figure 6).

13
Figure 6. Processing of miRNA. The primary miRNA transcript (pri-miRNA) is
transcribed by RNA polymerase II or III. The pri-miRNA is then cleaved by the
microprocessor complex Drosha – DGCR8 (Pasha) to pre-miRNA in the nucleus. The
precursor hairpin, pre-miRNA, is then exported from the nucleus to the cytoplasm by
Exportin-5 – Ran-GTP. In the cytoplasm, the RNase Dicer along with the double-
stranded RNA-binding protein TRBP cleaves the pre-miRNA hairpin to form a miRNA
duplex. The mature strand of the miRNA is then loaded together with Argonaute (Ago)
proteins into the RNA-induced silencing complex (RISC), where it guides RISC to
silence target mRNAs through mRNA cleavage, translational repression or mRNA
deadenylation. The passenger strand from the miRNA duplex is degraded. DGCR8,
DiGeorge syndrome critical region gene 8. TRBP, TAR RNA binding protein (Source:
Adapted from36
).

14
Repression of gene expression. The nucleotides in positions 2-8 from the 5’ end of the
guide strand represent the ‘seed’ region20,37
(Figure 7). It is an important feature in
miRNA target recognition and mutations in the seed region lead to changes in target
specificity and/or disease38-40
. In plants, perfect pairing of a miRNA with its target
mRNA leads to recruitment of deadenylation factors to remove the poly(A) tail of the
target mRNA and endonucleolytic cleavage of the mRNA20,28,41,42
. In mammals, the
miRISC mostly induces gene silencing by imperfect matching of nucleotides between the
miRNA and its target RNAs, leading to repression of protein synthesis and/or mRNA
degradation through deadenylation and decapping28
. Translational repression occurs
through interference with factors required for translation such as eukaryotic translation-
initiation factor 4G (eIF4G) and poly(A)-binding protein (PABPC)43
. After extensive
speculation about the stage at which translational repression occurs (initiation versus
post-initiation stage), recent data has proved that repression occurs predominantly during
initiation of translation43
. Deadenylation of mRNAs involves the CAF1-CCR4-NOT
deadenylase complex, and mRNA-decapping enzyme 2 (DCP2), a decapping enzyme
decaps the target mRNA, resulting in mRNA degradation by exoribonuclease 1 (XRN1),
the major 5’-to-3’ exonuclease in cultured cells43
. However, this is not true in cellular
extracts. In cell extracts, deadenylated mRNAs are thought to remain undegraded in a
deadenylated, translationally repressed state43
. Irrespective of the mode of action of the
miRNA, the miRISC complexes along with the bound target mRNAs are found enriched
in processing bodies (P-bodies or GW-bodies), cytoplasmic structures containing mRNA
degrading enzymes and are implicated in the storage and degradation of the target
mRNAs23
.

15
Figure 7. Structural components of a pre-miRNA. The pre-miRNA is composed of a
stem-loop structure comprising the guide strand, passenger strand, additional sequences,
and the loop. The guide strand is shown in red and the seed sequence is highlighted in
black.
Gene regulation by miRNAs is also controlled by RNA binding proteins. RNA
binding proteins interacting with the 3’ UTR of miRNA target mRNAs can reverse or
augment the inhibition by certain miRNAs23
. Under stress conditions, inhibition of CAT-
1 mRNA by miR-122 is relieved by the protein HuR, which translocates from the nucleus
to the cytoplasm and binds to the 3’ UTR of the CAT-1 mRNA, causing the CAT-1
mRNA to leave the P-body and bind to polysomes23,44
.
Several groups have recently reported that miRNAs can also activate gene
expression of its targets, in addition to inhibit expression23
. One example is miR-122,
which has been shown to upregulate the levels of Hepatitis C Virus (HCV) RNA through
binding to its 5’ UTR23
. Also, miR-10a has been shown to increase translation of mRNAs

16
with 5’ TOP motifs by binding to the 5’ UTR downstream of the 5’ TOP motif23,45
.
Recent data shows that translational activation by miRNAs may be mediated through
AGO2-containing complexes under serum starvation conditions and during cell cycle
arrest45
.

17
E. Role of miRNAs in liver
Given that miRNAs are largely transcribed by RNA polymerase II, their
expression is subject to transcriptional regulation in a similar manner to protein-encoding
genes. Thus, the metabolic state of a cell can influence the expression of a single or
multiple miRNAs, and miRNA expression profiles have been found to be altered in
various metabolic disorders such as diabetes and obesity28
. In a study comparing miRNA
expression profiles between skeletal muscle of normal and diabetic rats, 4 miRNAs were
found up-regulated and 11 miRNAs were found down-regulated46
. This may suggest that
miRNAs play a key role in metabolism and can in fact be potential diagnostic and
prognostic markers28,47
.
Dicer1, the only RNase III family member in mammals for processing dsRNA
into both miRNAs and siRNAs48
, is critical for miRNA maturation from early postnatal
liver, and its deletion results in profound hepatocyte apoptosis, steatosis and mild
hypoglycemia37
. This implies that miRNAs have critical roles in normal liver
development and physiology. It is now widely accepted that miRNAs have important
regulatory roles in various cellular processes. Recent work has implicated miRNAs in
pancreas development and insulin secretion49
, as well as insulin sensitivity in liver50
. It
has also been shown that miRNAs play a role in various hepatic metabolic functions such
as fatty acid and cholesterol metabolism, insulin signaling and glucose metabolism.
miRNA-10b (miR-10b) was identified in L02 cells, a human model of hepatic
steatosis28,51
. Overexpression of miR-10b resulted in triglyceride and lipid accumulation

18
in these cells by directly targeting peroxisome proliferator-activated receptor-α (PPAR-
α), a nuclear receptor involved in lipid metabolism28,51
. This study provided a novel
mechanism by which miR-10b regulated hepatic steatosis in the context of non-alcoholic
fatty liver disease (NAFLD).
miRNA-122 (miR-122) is the most abundant liver-specific miRNA and has been
implicated in various metabolic processes important for hepatic function and liver
pathology52
. miR-122 is almost solely expressed in hepatocytes53
and represents roughly
70% of the total miRNAs expressed in the adult liver54
. miR-122 is expressed in mouse
and human livers, primary hepatocytes and liver-derived cell lines such as Hepa1-6 and
Huh7 cells54
. miR-122 has been shown to bind to the 3’ UTR of cationic amino acid
transporter-1 (CAT-1) mRNA44,54,55
. miR-122 has been shown to play roles in fatty acid
metabolism and cholesterol metabolism52
through downregulation of 1-Acylglycerol-3-
Phosphate O-Acyltransferase 1 (AGPAT1) and Cell Death-Inducing DFFA-Like Effector
C (CIDEC). Silencing miR-122 in mice fed a high-fat diet resulted in a significant
reduction of hepatic steatosis56
. This was also seen with a notable decrease in serum
cholesterol levels54,56
.
miR-122 has also been involved in the pathophysiology of hepatocellular
carcinoma (HCC). It acts as a tumor suppressor and is downregulated in 70% of HCC
cases57
. This is mediated by upregulation of miR-122 targets such as Cut-like homeobox
1 (CUTL1), A disintegrin and metalloprotease family 17 (ADAM17) and cyclin G157
.
Other targets of miR-122 involved in hepatocarcinogenesis that have been recently found

19
are: A disintegrin and metalloprotease family 10 (ADAM10)52
, insulin-like growth factor
1 receptor (IGF1R)52
, N-Myc Downstream-Regulated Gene 3 (NDRG3)58
and
Microtubule-Associated Protein, RP/EB Family, Member 1 (MAPRE1)59
. Overall, this
suggests that miR-122 and its targets have an integral role in liver development and
function52
(Figure 8).
Figure 8. Role of miR-122 in liver52
. The figure illustrates the role of miR-122 in the
liver. miR-122 inhibits expression of CAT-1, ADAM10, Igf1R, Mapre1, NDGR3 and is
found downregulated in hepatocellular carcinoma. miR-122 prevents hepatocellular
carcinoma through inhibiting cyclin G1 and preventing the association of cyclin G1 with
p53. miR-122 has also been shown to play a role in cholesterol and lipid metabolism.
miRNA-216 (miR-216) and miRNA-302a (miR-302a) were found
downregulated in livers of hypercholesterolemic low-density lipoprotein receptor
(LDLR) knockout mice that were fed a high-fat diet compared to those that were fed a
chow diet28,60
. Also, this study found an inverse correlation between the levels of miR-

20
302a and its target genes ABCA1 transporter and ELOVL fatty acid elongase 6
(ELOVL6), a microsomal enzyme involved in the formation of long-chain FA28,60
. This
suggests a role for miR-302a in fatty acid, cholesterol and glucose metabolism60
.
miRNA-33a/b (miR-33a/b) are the best example of intronic miRNAs that work
together with their host genes to regulate cholesterol and fatty acid metabolism. miR-33a
is co-transcribed with sterol-regulatory element binding protein 2 (SREBP-2) gene61
, a
transcription factor important in de novo cholesterol synthesis and uptake62
, while miR-
33b is co-transcribed with sterol-regulatory element binding protein 1 (SREBP-1), a
transcription factor involved in fatty acid synthesis61,63,64
. In vivo studies in mice and non-
human primates have both shown that inhibition of miR-33a/b using different approaches
resulted in increased hepatic expression of miR-33 target gene, adenosine triphosphate-
binding cassette (ABC) transporter member 1 (ABCA1), a transporter that reduces
cholesterol efflux to high-density lipoprotein (HDL)65,66
. This increase in expression of
ABCA1 resulted in elevated HDL levels in mouse and non-human primate animal
models65,66
. Other cholesterol metabolism genes targeted by miR-33a are ATP-binding
cassette sub-family G member 1 (ABCG1) and Niemann-Pick disease, type C1 (NPC1)67
.
miR-33b has been shown to target genes involved in fatty acid metabolism such as
carnitine palmitoyltransferase 1a (CPT1a), carnitine O-octaniltransferase (CROT),
hydroxyacyl-CoA-dehydrogenase (HADHB), AMP kinase subunit-α (AMPK1α) and
reduce fatty acid oxidation67
.

21
In addition, miR-33 has also been shown to have a negative role in regulating insulin
signaling by acting on insulin receptor substrate-2 (IRS-2) and reducing downstream
signaling28,67
in human hepatocellular carcinoma cell lines HepG2 and Huh7.
miRNA-34a (miR-34a) was found upregulated in livers of patients with nonalcoholic
steatohepatitis (NASH)28,68
. miR-34a directly inhibits sirtuin 1 (SIRT)-1, leading to
downstream activation of HMGCoA reductase (HMGCR) which, in turn results in
elevated levels of cholesterol in these patients28,69
.
miRNA-335 (miR-335) was found upregulated in livers and white adipose tissues
(WAT) of three animal models of obesity – db/db, ob/ob and KKAy mice70
. This was
associated with elevated hepatic triglyceride and cholesterol levels suggesting that miR-
335 may represent a biomarker for hepatic lipid accumulation in mice47,70
.
miRNA-370 (miR-370) has been shown to be a potent regulator of lipid metabolism
in HepG2 cells71
. miR-370 regulates genes involved in fatty acid and triglyceride
synthesis such as transcription factor sterol-regulatory element binding protein 1c
(SREBP-1c), diacylglycerol acyltransferase-2 (DGAT2), fatty acid synthase (FAS), and
acyl-CoA carboxylase 1 (ACC1) through upregulating miR-12228,71
. miR-370 directly
targets the 3’ UTR of carnitine palmitoyl transferase 1a (Cpt1a), a mitochondrial enzyme
involved in shuttling fatty acids into mitochondria for -oxidation28,71
. This implies that
miR-370 may be implicated in the accumulation of triglycerides in the liver by increasing

22
the expression of miR-122 (thereby increasing de novo -
oxidation71
.
miRNA-467b (miR-467b) was shown to be downregulated in livers of mice fed a
high-fat diet and in steatotic hepatocytes72
. miR-467b was found to regulate the
expression of hepatic lipoprotein lipase (LPL), an enzyme that hydrolyzes
triglycerides28,72
. This interaction between miR-467b and LPL has been associated with
insulin resistance and plays an important role in the spectrum of NAFLD.
In addition to miR-122 (see page 18), other miRNAs have been consistently
found downregulated in hepatocellular carcinoma (HCC). MicroRNAs miR-199a-1, miR-
199a-2 and miR-199b have been shown to be downregulated in HCC, which results in
upregulation of targets such as MET (Met Proto-Oncogene), mTOR (Mammalian Target
Of Rapamycin), CD44 (CD44 Molecule) and HIF-1α (Hypoxia Inducible Factor 1, Alpha
Subunit)57
. This causes HCC to be highly proliferative, invasive and resistant to radiation.
On the other hand, miR-221 is upregulated in HCC and results in downregulation of
genes involved in cell cycle inhibition, negative regulation of the mTOR pathway, pro-
apoptosis, as well as inhibition of metalloproteases57
.
Overall, these studies highlight the possibility that pharmacological inhibition of
miRNAs may become a therapeutic strategy for the treatment of hepatic diseases.
Identification of miRNA targets therefore becomes an important aspect of developing
new miRNA-based therapeutic products. Despite the emerging role of miRNAs at

23
controlling genes important in liver metabolism, the mechanisms by which miRNA
regulate physiological responses is still poorly understood.

24
F. Thesis hypothesis and research aims
The liver is an important organ regulating many metabolic processes and is responsible
for various critical functions in the body. In recent years, differential expression of
miRNAs has been observed in many disease states. Thus, the development of molecules
to inhibit miRNAs that are found upregulated in particular diseases can be exploited for
therapeutic purposes. Likewise, targeting deleterious genes with miRNAs represents an
attractive therapeutic strategy. Thus, understanding the mechanisms by which miRNAs
govern hepatic functions is key for developing novel therapeutic agents. I proposed to
identify miRNAs differentially expressed in murine liver under pathological or
nutritionally distinc conditions, to understand the role of miRNA in the pathophysiology
of type 2 diabetes, and on vital hepatic functions. My central hypothesis was that miRNA
that are dysregulated may affect expression of target genes, and contribute to the
development of that disorder. Using primary hepatocytes as a cellular model, my central
hypothesis was tested by pursuing the following specific aims: (i) To identify miRNAs
dysregulated in livers of an animal model of type 2 diabetes, and in the transition from
the fasted to refed state; (ii) To identify gene targets of mmu-miR-709 (miR-709); (iii) To
determine the biological role of miR-709 in murine liver.
Specific Aim 1: To identify miRNAs dysregulated in livers of an animal model of
type 2 diabetes, and in the transition from the fasted to refed state.
The working hypothesis for Aim 1 was that expression of hepatic miRNAs are altered in
metabolic disorders such as diabetes. Also, miRNAs are largely transcribed by RNA
polymerase II and therefore, may be transcriptionally regulated like protein-encoding

25
genes. Identifying these miRNA and understanding their function in the liver will help
understand the mechanisms that lead to hepatic disorders and developing novel therapies.
This hypothesis was tested by conducting miRNA microarrays on liver tissues from
normal and db/db mice, and from fasted and refed animals.
Specific Aim 2: To identify gene targets of miR-709. The working hypothesis for Aim
2 was that mRNAs directly regulated by a miRNA should be downregulated upon
transient transfection of miRNA mimics. I checked mRNA profiles of primary
hepatocytes transfected with miR-709 and confirmed the expression of its targets at
protein level. Identifying the targets of miR-709 enabled the characterization of the
pathways regulated by miR-709 in the murine liver.
Specific Aim 3: To determine the biological role of miR-709 in murine liver. The
abundance of miR-709 in murine liver, its predicted and confirmed targets, suggested an
important role for miR-709 in cell proliferation. This hypothesis was tested by analyzing
miR-709 in animal models of liver regeneration and liver cancer and by studying the
impact of depleting miR-709 during cell division.

26
MATERIALS AND METHODS
A. MATERIALS
A.1. Plasmids. psiCHECKTM
-2 Luciferase vector (Promega, Madison, WI) was used to
generate p.miR-709-3p, p.miR-709-5p, p.Rab11b, p.Ces1g, p.Pctp, p.NC-Rab11b, p.NC-
Ces1g and p.NC-Pctp constructs. pBluescript II SK(+) vector (Stratagene, CA, USA) was
used to generate plasmid p.pri-Cel-239b.
A.2. Primers
Table 1. Oligonucleotides used to generate luciferase constructs and
primers used for qRT-PCR (5’ 3’).
Oligonucleotides
Pctp TATGCACTCGAGCATCTGGATTTTTCCTTTCCC
ATCAGGCGGCCGCGGTGGTACACGCCTTTAATC
NC- Pctp TATGCACTCGAGTCAGGCTTCAAAGATGGCTTG
AATCAGGCGGCCGCCTGAGTTCGAGGCTAACCTG
Ces1g TATGCACTCGAGTCAATCGTCTGACACCAGTG
AATCAGGCGGCCGCTTCTAAGGGAATGTATTTGTGA
T
NC-Ces1g TATGCACTCGAGGAGCCAAGGAAACAGCAGAG
ATCAGGCGGCCGCTCCAGGAAAGCCAGGACTAC
Rab11b ATGCACTCGAGCAGGGTTTCTCTGTGTAGC
TCAGGCGGCCGCGAGGGGCAAGGGTGTCTT
NC-Rab11b ATGCACTCGAGCCAGGAAGAGCAGGAGTCC
ATCAGGCGGCCGCGAGTTTGGGATGAGGATACAG
Cel-239b
primary
transcript
CCAGTGTCCCACAGAGTAATTAGTGTGTAGCGACTA
AACACATCAACTCAGAAGTGCTCTA
AGCTTAGAACTGTCCAGTTTGAGCAGCACTGGTTGA
TGTGTTTAGTCGCTATTGTCTTTTGTTATATTGACTT
ATGCTGCA
Primers used for qRT-PCR
CD36 GGCAAAGAACAGCAGCAAAATC
TGAAGGCTCAAAGATGGCTCC
Gck CACTGCGGAGATGCTCTTTGAC
CCACGATGTTGTTCCCTTCTGC
Acox2 GAATAACAGTTGGGGACATAGG

27
CTGGAGGGTGGGTAGGAATC
Pfkl GCAAGGTATGAATGCTGCTGTC
TGGAAACGCTGAGCCAGTTGG
Pctp CAAGAAGGGGAGCAGAGAATGG
TGGTGTAGCACAGCCAGAGATG
Rab11b CAAAGTGGTGCTTATTGGGGAC
CTGAGCCTTGATGGTCTTGCC
Ces1g TGTAAAACCACCACCTCCGCTG
TCTCTGGGGTCTCCAAGAAAATC
TBP TATCACTCCTGCCACACCAG
CATGATGACTGCAGCAAATCG
A.3. Mice. Animals were purchased from The Jackson Laboratory (Bar Harbor, ME).
Animal studies were performed in compliance with Indiana University School of
Medicine Institutional Animal Care and Use Committee guidelines.
A.3.1. Liver miRNA analysis: Four 12-week old, male C57BLKS/J and db/db mice (an
obese animal model of type 2 diabetes lacking a functional leptin receptor), were used to
study hepatic miRNA expression profiles under fed conditions (see section B.6.a).
A.3.2. Primary hepatocyte isolation: Male C57BL/6J mice (11 to 12 weeks old, 24 to
30g) were used for isolation of primary hepatocytes. Mice were fed rodent chow ad
libitum and allowed free access of water. A standard 12 h light/12 h dark cycle (7 AM/7
PM) was maintained throughout the experiments. Mice were allowed to acclimate for at
least a week before experimentation.
A.3.3. miRNA profiles under fed, fasted, refed conditions: Fifteen 14-week old, male
C57BL/6J mice were used for studying the expression of miRNAs under different
nutritional status (see section B.6.b).
A.3.4. Relative expression of pre-miR-709 vs mature miR-709: Livers from normal
LapMyc mice (5 male and 2 female) and tumor LapMyc mice (5 male) were obtained
from Dr. Janaiah Kota (Department of Medical and Molecular Genetics, Indiana

28
University School of Medicine)59
. Livers from normal C57BL/6 male mice before
hepatectomy, and 24, 36 and 44 hours post-hepatectomy (3 animals per group) were
provided by Dr. Guoli Dai (Department of Biology, Purdue University School of
Science)73
.
A.4. Antibodies
Table 2. Antibodies used for Western blotting.
Antibody Manufacturer Dilution factor
Rab11b Cell Signaling, Boston, MA 1:1,000
DYNC1LI1 GeneTex, San Antonio, TX 1:1,000
Glucokinase (N-term) Abgent, San Diego, CA 1:500
Insulin receptor- Santa Cruz Biotechnology,
Dallas, TX
1:500
LDLR Abcam, Cambridge, MA 1:3000
FATP1 Santa Cruz Biotechnology,
Dallas, TX
1:500
Timp3 Santa Cruz Biotechnology,
Dallas, TX
1:1000
Cyclophilin 40 Abcam, Cambridge, MA 1:1000
Tubulin-α Ab-2 (Clone DM1A) Thermo Scientific, Rockford,
IL
1:10,000
β-actin (C4) Santa Cruz Biotechnology,
Dallas, TX
1:500
Anti-rabbit IgG, HRP-linked Cell Signaling, Boston, MA 1:3,000 - 1:5,000
A.5. Other reagents
A.5.a. Plasmid isolation. Plasmid mini kit (Qiagen, Valencia, CA) and plasmid maxi kit
(Qiagen, Valencia, CA) was used for small scale (~3 ml LB broth) and large scale (~200
ml LB broth) plasmid isolation, respectively.
A.5.b. RNA isolation. Total RNA Isolation from cells and tissues for RT-PCR:
RNAeasy mini/midi kit (Qiagen, Valencia, CA), RNAse free-DNAse I (Qiagen,

29
Valencia, CA) and β-mercaptoethanol were used to isolate total RNA. Total RNA
Isolation from cells and tissues for Taqman miRNA assay and Northern blot of miRNAs:
the long (>200 bp) and miRNA-enriched (<200 bp) RNA fractions were isolated using
mirVanaTM
miRNA Isolation kit (Ambion, Life Technologies, Grand Island, NY).
A.5.c. Protein isolation. RIPA buffer (25 mM Tris•HCl pH 7.6, 150 mM NaCl, 1% NP-
40, 1% sodium deoxycholate, 0.1% SDS; Thermo Scientific, Rockford, IL) containing
protease and phosphatase inhibitors (Roche, Indianapolis, IN) was used to lyse cells and
isolate proteins.
A.5.d. DNA gel extraction. QIAEX II Gel Extraction Kit (Qiagen, Valencia, CA) was
used to isolate PCR product fragments from agarose gels.
A.5.e. Ligation. T4 DNA ligase (New England Biolabs, Ipswich, MA) was used to ligate
PCR products into psiCHECKTM
-2 Luciferase vector according to manufacturer’s
instructions.
A.5.f. PCR. High Capacity cDNA reverse transcription kit (Applied Biosystems, Life
Technologies, Grand Island, NY) was used to generate cDNA from mouse liver.
A.5.g. qRT-PCR. QuantiTect SYBR Green RT-PCR kit (Qiagen, Valencia, CA) was
used, following the manufacturer's recommendations. Reactions were set up in 96-well
Optical reaction plates covered with optical caps (Applied Biosystem, Foster City, CA).
Real time PCR was performed using an ABI Prism 7500 instrument (Applied Biosystem,
Foster City, CA).
A.5.h. TaqMan miRNA assay. TaqMan miRNA Reverse Transcription Kit (Applied
Biosystems, Foster City, CA) was used to generate cDNA, followed by PCR with
TaqMan miRNA Assays (Applied Biosystems) specific for miR-709 and sno-202.

30
A.5.i. Protein quantification. Pierce® BCA Protein Assay Kit (Thermo Scientific,
Hanover Park, IL) was used to quantify proteins.
A.5.j. Western Blot detection. Pierce® ECL Western Blotting Substrate (Thermo
Scientific, Hanover Park, IL) was used to detect proteins.
A.5.k. LDH assay. Cytotoxicity LDH Detection Kit (Clontech, Mountain View, CA) was
used for detection of lactate dehydrogenase (LDH).
A.5.l. Transfection. METAFECTENE® PRO (Biontex, Germany) was used as
transfection reagent at lipid:DNA ratios described in the cell transfection section.
A.5.m. LB broth. Luria-Bertani (LB) broth (Sigma, St. Louis, MO) was used to grow E.
coli (Escherichia coli) bacteria.
A.5.n. Bacteria for subcloning. XL1-Blue Subcloning grade competent cells (Agilent,
Santa Clara, CA) were used for transformation of plasmids.
A.5.o. Cell lines. The mouse hepatoma cell line Hepa-1c1c7 and human embryonic
kidney cell line HEK293 were obtained from American Type Culture Collection
(ATCC).

31
B. METHODS
B.1. Plasmid cloning. p.miR-709-3p and p.miR-709-5p constructs were generated by
cloning an oligonucleotide with a sequence perfectly complementary to either the 3’ or
the 5’ strand of miR-709 (based on the sequence published in TargetScan), downstream
of the renilla luciferase gene in plasmid psiCHECKTM
-2 Luciferase vector (Promega,
Madison, WI) (Figure 9). Oligonucleotides (Invitrogen, Life Technologies, Grand Island,
NY) were inserted into the NotI – XhoI site using Quick ligation kit (New England
Biolabs, Ipswich, MA). These plasmids were used to determine whether the 3’ or 5’
strand is the guide strand of miR-709.
Figure 9. Schematic representation of the psiCHECKTM
-2 plasmid used for
generating constructs for luciferase reporter assays. All sequences were cloned using
Not I and Xho I sites into the 3’ UTR of the Renilla luciferase cDNA.

32
Tough decoys (TuDs) to reduce cellular levels of miR-709 and miR-122, were
generated by cloning 8 copies of the sequence complementary to the 3p strand of miR-
709 or the 5p strand of miR-122, downstream from the luciferase gene in psiCHECKTM
-
2. The sequence inserted was chemically synthesized (GenScript, NJ, and Genewiz, NJ)
with XhoI and NotI sites at the ends to facilitate cloning.
To confirm that Rab11b, Ces1g and Pctp are direct targets of miR-709, 220-720
base-pair (bp) fragments of the 3’ UTR containing the putative binding sites
(microrna.org74
), were cloned in the NotI – XhoI site of psiCHECKTM
-2 vector. Total
mRNA from mouse liver was used to generate the cDNA (High Capacity cDNA reverse
transcription kit, Applied Biosystems, Life Technologies, Grand Island, NY) and the
corresponding portion of the 3’ UTR of Rab11b, Ces1g and Pctp was amplified by PCR
using primers with restriction sites for NotI – XhoI (Table 1). The PCR products were
digested with XhoI and NotI, gel purified with QIAEX II Gel Extraction Kit (Qiagen,
Valencia, CA) and cloned into psiCHECKTM
-2, generating plasmids p.Rab11b, p.Ces1g
and p.Pctp. In addition, a portion of the 3’ UTR of these mRNAs without miR-709
binding sites was cloned into psiCHECKTM
-2 and used as negative controls (p.NC-
Rab11b, p.NC-Ces1g and p.NC-Pctp). Clones were sequenced prior to using them in
luciferase assays.
A plasmid expressing the primary transcript of miR-709 (p.pri-miR-709) was
purchased from OriGene (Rockville, MD, USA). p.pri-miR-709 is composed of pre-miR-
709 (88 nt) and 250-300 nt flanking genomic sequence (Figure 10A). The flanking

33
sequence is required for correct pri-miR expression and processing by the microprocessor
complex (Drosha). As control, p.pri-Cel-239b was cloned into pBluescript II SK(+)
vector (Stratagene, CA, USA) in 4 steps (Figure 10B). The promoter, polyA signal and
300 bp flanker regions were obtained by PCR amplification from the p.pri-miR-709
plasmid and thus, have the same sequence. The pre-Cel-239b sequence was chemically
synthesized as 4 oligonucleotides that anneal to form the appropriate restriction enzyme
sites on either end. All clones were sequenced prior to using them in experiments.

34
Figure 10. Schematic representation of plasmids expressing pri-miR-709 and pri-
Cel-239b. (A) Plasmid expressing pri-miR-709 (OriGene). (B) Plasmid expressing pri-
Cel-239b miRNA was generated as described in the text.
(A)
(B)

35
B.2. Primary hepatocyte isolation. Primary hepatocytes were isolated using a two-step
collagenase procedure, as previously described75
. Briefly, mice were anesthetized with
pentobarbital (90 mg/kg body weight i.p.) and the liver was perfused with Ca2+
and Mg2+
free Hank’s Balanced Salt solution (HBSS) containing 5 mM ethylene glycol tetraacetic
acid (EGTA) and 0.05 M HEPES. This was followed by perfusion with 0.075%
collagenase solution in DMEM. After perfusion, the liver was cut out and liver cells were
dispersed in 15 ml collagenase solution using forceps. Cells were filtered through a 70-
µm nylon mesh and centrifuged at 100xg for 5 min to pellet hepatocytes. The cell pellet
was washed in 20 ml DMEM with 10% FBS and centrifuged again. To enrich for live
cells, the cell pellet was resuspended in 25 ml DMEM (without FBS) plus 24 ml 90%
Percoll solution76
. Cell viability was assessed by trypan blue staining exclusion (>80%
viability). Cells were seeded at a density of 4-6x10⁵ cells per well or 35-mm dish in 2 ml
DMEM supplemented with 10% (v/v) fetal bovine serum (FBS), 100 I.U./ml penicillin,
100 µg/ml streptomycin, 3 nM insulin and 1 nM dexamethasone. Cells were incubated at
37°C, 5% CO2 in a humidified incubator and allowed to attach for 4 hours. Media was
then replaced with fresh media.
B.2.a. Primary hepatocyte sandwich77
experiments. For primary hepatocyte sandwich
experiments, 6x10⁵ cells were plated on collagen-coated glass-bottom 35-mm dishes
(MatTek, Ashland, MA). Media was replaced 4 hours post-plating and cells were
transfected with 34 nM of miR-709 or the control miRNA Cel-239b (Dharmacon,
Pittsburgh, PA). The next day, primary hepatocytes were overlaid with BD MatrigelTM
(BD Biosciences, San Jose, CA) at a final concentration of 0.25 mg/ml in cold DMEM

36
supplemented with 10% (v/v) fetal bovine serum, 100 I.U./ml penicillin, 100 µg/ml
streptomycin and 100 nM dexamethasone. Cells were cultured for 3-5 days to allow the
formation of bile canalicular networks between cells. Media was replaced every day.
B.2.b. Sodium fluorescein assay. Four hours after plating, mouse primary hepatocytes
were transfected with 34 nM miR-709 or Cel-239b (Dharmacon, Lafayette, CO),
siRab11b-1 and siRab11b-2, or siNC (Invitrogen, Life Technologies). Cells treated with
siRab11b-1 and siRab11b-2 received equimolar concentrations of siRab11b-1 and
siRab11b-2 for a final concentration of 30 nM. Next morning, media was aspirated and 2
ml of 0.25 mg/ml MatrigelTM
(BD Biosciences, San Jose, CA, USA) in DMEM
supplemented with 10% FBS, 100 I.U./ml penicillin, 100 µg/ml streptomycin and 100
nM dexamethasone was added to all wells. Twenty-four hours later, media was replaced.
Seventy-two hours post-transfection, cells were washed twice with media I (150 mM
NaCl, 20 mM HEPES, 1 mM CaCl2, 5 mM KCl, 1 mM MgCl2, and 10 mM glucose) and
sodium fluorescein was added at 4 μM in media I. Cells were then incubated at 37°C in
incubator for 10 min. The cells were washed twice with media I and 2 ml of DMEM
supplemented 10% FBS, 100 I.U./ml penicillin, 100 µg/ml streptomycin and 100 nM
dexamethasone, was added. Cells were again incubated for 10 min at 37°C in a CO2
incubator. Images were taken at specified time points.
B.2.c. Imaging of labeled miR-709 in primary hepatocytes. For imaging experiments,
6x10⁵ cells were plated on collagen-coated glass-bottom 35-mm dishes (MatTek,
Ashland, MA). Media was replaced 4 hours post-plating. Next day, cells were transfected

37
with 34 nM of 3’ FAM labeled miR-709 or the control miRNA Cel-67 labeled with
Dy547 (Dharmacon, Pittsburgh, PA). Twenty-four hours later, media was replaced and 4
drops of Hoechst 33342 (NucBlue® Live ReadyProbes® Reagent; Molecular probes)
was added to each well and incubated at 37°C in a 5% CO2 incubator for 20 mins.
Samples were then imaged by confocal fluorescence microscopy on an inverted
microscope fitted with an FV1000 MPE using a 60x 1.2 NA water immersion objective
lens (Olympus). Imaging was performed sequentially with excitation provided by solid
state lasers at 405 and 559 nm and an Argon-ion laser at 488 nm; emission was collected
with spectral filtration from 425-475 nm, 500-545 nm or filter based from 575-675 nm,
respectively. Confocal slices were taken at 0.49 micron intervals with voxel dimensions
of 0.265 x 0.265 microns. All post-acquisition analysis was performed in Fiji v1.48p78
and figure generation was performed in Photoshop (Adobe).
B.3. Cell culture. Mouse hepatoma Hepa1c1c7 cells were cultured in MEM-α
supplemented with 10% FBS and 100 I.U./ml penicillin, 100 µg/ml streptomycin and
were plated in 6-well plates at a cell density of 1-5x10⁵ cells/well in 2 ml media.
Human embryonic kidney HEK293 cells were cultured in MEM-α supplemented
with 10% FBS and 100 I.U./ml penicillin, 100 µg/ml streptomycin and were plated in 6-
well plates at a cell density of 6x10⁵ cells/well in 2 ml media.
B.3.a. Imaging of labeled miR-709 in Hepa1c1c cells. For imaging experiments, 4x10⁵
cells were plated on collagen-coated glass-bottom 35-mm dishes (MatTek, Ashland,
MA). Media was replaced 5 hours post-plating and cells were transfected with 34 nM of

38
miR-709 or the control miRNA Cel-67 (Dharmacon, Pittsburgh, PA). Next day, media
was replaced and samples were imaged by confocal fluorescence microscopy on an
inverted Olympus microscope fitted with an FV1000 MPE using a 60 x 1.2 NA water
immersion objective lens (Olympus). A second set of samples was imaged 24 hours after
culturing them in media without FBS and glucose (metabolic stress conditions). Imaging
was performed sequentially with excitation provided by solid state lasers at 405 and 559
nm and an Argon-ion laser at 488 nm; emission was collected with spectral filtration
from 425-475 nm, 500-545 nm or filter based from 575-675 nm, respectively. Confocal
slices were taken at 0.49 micron intervals with voxel dimensions of 0.265 x 0.265
microns. All post-acquisition analysis was performed in Fiji v1.48p78
and figure
generation was performed in Photoshop (Adobe).
B.3.b. LDH assay in Hepa1c1c cells. For lactate dehydrogenase (LDH) release
experiments, 4.5 x10⁵ cells were plated on 6-well plates. Media was replaced 16 hours
post-plating and cells were transfected with 25 nM or 50 nM of anti-miR-709 or anti-
control-miR. The next day, media was replaced. One-hundred μls of media was collected
before and 24, 48 and 72 hours post-transfection, and LDH release was quantified.
B.4. Cell transfection
B.4.a. Using plasmids and miRNA: Mouse primary hepatocytes or Hepa1c1c7 cells
were transfected with plasmids (1.5 µg) together with 34 nM of miR-709 or the control
miRNA Cel-239b (Dharmacon). Transfection was performed at a nucleic acid:lipid ratio
of 1:6. Cells were incubated at 37°C in a 5% CO2 incubator. After overnight incubation,

39
media was replaced with fresh media. Cells were harvested 24 hours later and analyzed
for luciferase activity using the dual-luciferase® reporter assay system (Promega) and a
luminometer (Centro LB 960 microplate luminometer, Berthold Technologies). Renilla
luciferase activity was normalized to firefly luciferase expressed from the same
psiCHECKTM
-2 plasmid.
B.4.b. Using plasmids: HEK293 cells or Hepa1c1c7 cells were transfected with 1.5 µg
plasmids expressing pri-miR-709 or pri-Cel-239b. Transfection was performed at a
nucleic acid:lipid ratio of 1:4. Cells were incubated at 37°C in a 5% CO2 incubator. After
overnight incubation, media was replaced with fresh media. Cells were harvested 24
hours later and RNA was isolated for analyzing miR-709 expression.
B.4.c. Using miRNA/siRNA/antagomiRs/anti-miRs: Four hours or the next morning
after plating, mouse primary hepatocytes were transfected with 34 nM miR-709
(Dharmacon, Lafayette, CO), Cel-239b, siRab11b-1 (MSS208343), siRab11b-2
(MSS208345), siRab11b-1 and siRab11b-2, control siRNA (siNC, 12935-300,
Invitrogen, Life Technologies) using Metafectene Pro (1:6 ratio). Cells treated with
siRab11b-1 and siRab11b-2 received equimolar concentrations of siRab11b-1 and
siRab11b-2 for a final concentration of 30 nM. Media was replaced 24 hours later and
cells were harvested 48 hours post-transfection to analyze protein expression. For
antagomiRs/anti-miRs, mouse primary hepatocytes or Hepa1c1c cells were transfected
with 10, 17, 25, 34 or 50 nM of anti-miR-709, or anti-control-miR using Metafectene Pro
(1:6 ratio). Media was replaced 24 hours later and cells were harvested 24 hours post-

40
transfection to analyze mRNA or miR-709 expression or were maintained in culture upto
72 hours for LDH assay.
B.5. miRNA target predictions. Multiple databases (miRanda74
, miRDB79,80
,
miRWalk81
, TargetScan82
, DIANAmT83,84
, miRBase85-91
, PICTAR592
and RNA2293
)
were used to predict targets of mmu-miR-709 (Mus musculus miRNA-709).
B.6. Array analyses.
B.6.a. miRNA microarray: miRNA chip analysis was conducted by LC Sciences
(Houston, TX). Four animals per group (normal and db/db) were used. The RNA of two
mice from one group was labeled with Cy3 and the RNA from the other two animals was
labeled with Cy5. One wild type and one db/db sample was used to hybridize each of
four chips. Background was determined using a regression-based background mapping
method. The regression was performed on 5% to 25% of the lowest intensity data points
excluding blank spots. Raw data matrix was then subtracted from the background matrix.
Normalization was carried out using a LOWESS (Locally-weighted Regression) method
on the background-subtracted data. Transcripts were considered detectable if they met at
least two conditions: signal intensity higher than 3x background standard deviation; and
spot CV <0.5. CV was calculated by standard deviation (SD)/signal intensity. A
transcript was listed as detectable only if the signals from at least 50% of the repeating
probes were above detection level. Data adjustment included data filtering, log2
transformation, and gene centering and normalization. The data filtering removed
miRNAs with (normalized) intensity values below a threshold value of 32 across all

41
samples. The log2 transformation converts intensity values into log2 scale. Gene
centering and normalization transform the log2 values using the mean and the standard
deviation of individual genes across all samples. A t-test was performed between normal
and diabetic sample groups. T-values were calculated for each miRNA, and p-values
were computed from the theoretical t-distribution. miRNAs with p-values below 0.01
were selected for cluster analysis. The clustering was done using a hierarchical method
and was performed with average linkage and Euclidean distance metric.
B.6.b. mRNA Affymetrix analysis: Four replicates for miR-709 and three replicates for
Cel-239b were used. The quality of RNA was determined by Agilent 600
Nanobioanalyzer. mRNA microarray hybridization was performed by the Center for
Medical Genomics, at Indiana University School of Medicine. Affymetrix mouse gene
1.0 ST arrays were used to compare expression of about 28,850 genes using one chip per
replicate. Briefly, samples were labeled using the standard Affymetrix protocol for the
WT Target Labeling and Control Reagents kit according to the Affymetrix user manual:
GeneChip® Whole Transcript (WT) Sense Target Labeling Assay GeneChip. Individual
labeled samples were hybridized to the Mouse Gene 1.0 ST GeneChips® for 17 hours,
then washed, stained and scanned with the standard protocol using Affymetrix GCOS
(GeneChip® Operating System). GCOS was used to generate data (CEL files). The CEL
file stores the results of the intensity calculations on the pixel values of the DAT file.
This includes an intensity value, standard deviation of the intensity, the number of pixels
used to calculate the intensity value, a flag to indicate an outlier as calculated by the
algorithm and a user defined flag indicating the feature should be excluded from future

42
analysis (www.Affymetrix.com). Arrays were visually scanned for abnormalities or
defects.
CEL files were imported into Partek Genomics Suite (Partek, Inc., St. Louis, Mo).
RMA signals were generated for the core probe sets using the RMA background
correction, Quantile normalization and summarization by Median Polish. Summarized
signals for each probe set were log2 transformed. These log transformed signals were
used for Principal Components Analysis, hierarchical clustering and signal histograms to
determine if there were any outlier arrays. Untransformed RMA signals were used for
fold change calculations. Data was analyzed using a 1-way Anova (analysis of variance)
using log2-transformed signals with treatment as factor and all possible contrasts made.
Fold changes were calculated using the untransformed RMA signals. Principal
component analysis (PCA) and hierarchical clustering of the top 100 genes was done.
B.6.c. Taqman Low Density Array. The ABI Taqman® microRNA Low Density
Arrays for rodents (TLDA, Applied Biosystems, Foster City, CA) was used to analyze
the expression of miRNAs between fasted and refed liver samples. The rodent TLDA
consists of 2 arrays: TLDA A array and TLDA B array for 518 mouse-specific
microRNAs. Each array/panel includes three endogenous controls including the
mammalian U6 (MammU6) assay that is repeated four times on each card as a positive
control as well as an assay unrelated to mammalian species, ath-miR159a, as negative
control. Total RNA is first converted to cDNA using MegaplexTM
RT primer pools
(Stem-loop RT primers for A and B arrays) and TaqMan® Universal PCR Master Mix is

43
simply combined with each reaction. One-hundred μl of this mix is then loaded onto each
port of the TLDA array card. The TLDA plate was centrifuged with 9 up and down ramp
rates at 1,200 rpm for 1 min and loaded into the 7900 HT Sequence Detection System
using the 384-well TaqMan Low Density Array default thermal-cycling conditions. The
ABI TaqMan SDS v2.3 software was utilized to obtain raw Ct values. To review results,
the raw Ct data (SDS file format) were exported from the Plate Centric View into the ABI
TaqMan RQ manager software. Automatic baseline and manual Ct were set to 0.2 for all
samples. All the data was normalized to U87 expression. Delta Ct (ΔCt) values of
miRNAs was calculated by subtracting the U87 Ct values from target miRNA Ct values.
Delta delta Ct (ΔΔCt) values were obtained by taking a difference of the ΔCt of a miRNA
between fasted and refed groups. ΔΔCt values were then converted into fold-change by
using the formula 2-ΔΔCt
. Anova analysis was performed to get differentially expressed
miRNAs from 2-ΔΔCt
data.
B.7. Western blotting. Primary hepatocytes were lysed in RIPA buffer (25 mM Tris-HCl
pH 7.6, 150 mM NaCl, 1% NP-40, 1% sodium deoxycholate, 0.1% SDS; Thermo
Scientific, Rockford, IL) containing protease and phosphatase inhibitors (Roche,
Indianapolis, IN). Cell extracts were centrifuged at 13,000 rpm, the fat layer carefully
aspirated, and the supernatant was collected. Protein concentration was determined using
the BCA kit from Pierce (Rockford, IL). Proteins (20-30 µg) were separated in 10% Tris-
HCl SDS PAGE Criterion gel (Bio-Rad, Hercules, CA) and transferred to 0.2-mm PVDF
membrane (Bio-Rad, Hercules, CA). Antibodies to detect Rab11b, α-tubulin, LDLR,
Timp3, FATP1, Cyc-40, IR- β, β-actin, Dync1li1 and Gck were used at the dilution

44
factors shown in Table 2. The secondary antibody horse radish peroxidase (HRP)-
conjugated anti-rabbit IgG (Cell Signaling, Boston, MA), was added and incubated at
room temperature for 1 hour at a 1:3,000 - 1:5,000 dilution. Blots were developed with
Pierce ECL kit (Thermo Scientific, Rockford, IL), and exposed to enhanced
chemiluminescence (ECL) film (GE Healthcare, Piscataway, NJ).
B.8. Northern blotting. miRNA-enriched (200 bp) RNA fractions were isolated from
~100 mg of liver using mirVana RNA isolation kit according to the manufacturer’s
instructions (Ambion, Austin, TX). Four μg of miRNA-enriched RNA was separated on
15% TBE urea gels (Bio-Rad), transferred to Hybond-N membranes (GE Healthcare),
and then UV-cross-linked using a Stratalinker 2400 (Stratagene). For miR-122 and 5s,
DNA oligonucleotide probes were used. Probes (100 pmol) were labeled with DIG using
a 2nd
generation DIG oligonucleotide tailing kit (Roche, Indianapolis, IN). Probes were
hybridized to membranes at 25°C overnight in a hybridization oven after 2 hours of pre-
hybridization at 60°C. Three 2X SSC, 0.1% SDS washes were carried out for 10 min at
room temperature followed by blocking and incubating with antibody against DIG. The
signal was developed using CSPD (Roche, Indianapolis, IN) according to the
manufacturer’s instructions. Probes used were as follows: miR-122:
ACAAACACCATTGTCACACTCCA, 5s: TTAGCTTCCGAGATCA, miR-709:
TCCTCCTGCCTCTGCCTCC and ATCCTCCTGCCTCTGCCTCCCC. In addition, to
confirm the data, a 5’-DIG labeled miRCURY LNA Detection probe for miR-709 was
used (TCCTCCTGCCTCTGCCTCC) (Exiqon, Woburn, MA, USA). For the miRCURY
LNA probe, the protocol was followed as decribed94
.

45
B.9. LDH assay. LDH measurements were performed on medium collected from
Hepa1c1c cells transfected with miR-709 or Cel-239b, using the LDH Cytotoxicity
Detection Kit (Clontech, CA, USA). At each timepoint, 100 μl of media from each well
was collected and stored at -20°C. For analysis, the medium from each well was diluted
1:4 in medium without FBS and glucose, and the company’s recommendations were
followed. Absorbance was measured at 490 nm using a microplate reader.
B.10. qPCR analysis
B.10.a. qRT-PCR: qRT-PCR was performed for the following genes: Cluster of
Differentiation 36 (Cd36), acyl-CoA oxidase 2 (Acox2), glucokinase (Gck),
phosphofructokinase liver (Pfkl), member RAS oncogene family (Rab11b),
carboxylesterase 1G (Ces1g), phosphatidylcholine transfer protein (Pctp) and TATA
binding protein (Tbp), using the primer pairs shown in Table 1. qRT-PCR was performed
using an ABI PRISM 7500 instrument (ABI, Foster City, CA) and the SYBR Green
Qiagen One-Step reverse transcription-PCR kit (Qiagen, Valencia, CA), following the
manufacturer's recommendations. A standard curve was generated with serial dilutions of
an RNA sample from cells treated with the control miRNA (Cel-239b) (200 ng to 1.6 ng).
Quantification of mRNA was measured by analyzing 50 ng of RNA, in duplicate, in a 50-
µl reaction volume and using 0.5 mM of each primer. Ct values were compared to those
of the standard curve. The Tbp gene was used as loading control. Fold-changes are
expressed relative to Cel-239b transfected cells.

46
B.10.b. TaqMan assay to quantify mature miRNAs: To quantify the level of mature
miR-709, cDNA was generated from 10 ng of total RNA sample using the TaqMan
miRNA Reverse Transcription Kit (Applied Biosystems, Foster City, CA). Quantitative
PCR was performed with TaqMan miRNA Assays (Applied Biosystems) specific for
miR-709 (P/N 001644). As endogenous control, sno-202 was used (TaqMan miRNA
Assay P/N 001232).
B.11. Statistical analysis. All experimental conditions were done at least in duplicate
and repeated in at least two separate hepatocyte isolations. Data are presented as the
arithmetic mean ± standard deviation. Statistical differences were calculated using the
unpaired two-tailed Student’s t-test. A p-value of less than 0.05 was considered
statistically significant.

47
RESULTS
A. Hepatic murine miRNA expression
The importance of miRNAs regulating liver function was demonstrated recently
in mice lacking Dicer in this tissue95,96
. The hepatocytes in the knock-out mice displayed
prominent steatosis and depleted glycogen stores95,96
, and these mice were severely
hypoglycemic after a short period of fasting. Recent work has also implicated miRNAs in
other processes, including hepatic insulin sensitivity50
. Given that miRNA expression
profiles are tissue-specific and can be altered by developmental stage, cell cycle, or
metabolic processes, the role of miRNA in liver needs to be established under specific
conditions that are relevant to its function.
A.1. Identification of miRNAs expressed in livers of normal and db/db mice
To identify miRNAs dysregulated in livers of an animal model of type 2 diabetes
relative to normal mice, the small RNA fraction of four C57BLKS/J and four db/db mice
fed ad libitum, were obtained. Expression of 617 murine miRNAs was tested using chip
miRNA microarrays (LC Sciences, Houston, TX). Of all the miRNAs expressed in the
liver, miR-122 was the most abundant (Table 3). As described in the Introduction, miR-
122 has been well characterized and shown to be involved in various cellular processes
such as fatty acid metabolism, amongst others52,56
. Of all the differentially expressed
miRNA (total of 22), those with a p-value < 0.01 were selected. These included miRNA-
709, miR-574-5p and miR-676, which were found significantly upregulated, and miR-
805 and miR-23a, which were significantly downregulated in db/db livers (Figure 11). A

48
published study showed that hepatic miR-709 expression increased 7.6-fold with ageing
in mice97
, suggesting a connection with metabolism. In addition, its abundance relative to
other miRNAs made it particularly attractive to study, given the existing evidence that
only the most abundant miRNAs suppress their targets, and that about 60% of the
miRNAs are not active98
. Predicted targets across multiple databases such as miRDB,
TargetScan, and miRBase indicated a possible role in regulating genes important for cell
adhesion/extracellular matrix (actin binding proteins, myosin proteins). Thus, we chose to
further characterize the function of miR-709, based on its high abundance and potential
role in controlling metabolic processes.

49
Figure 11. Hierarchical clustering analysis of miRNAs with p-value < 0.01. The
clustering was done using a hierarchical method and was performed with average linkage
and Euclidean distance metric. Red indicates higher expression and green indicates lower
expression.

50
Table 3. miRNAs expressed in liver of normal C57BLKS/J mice.
miRNA Mean miRNA signal S.D.
mmu-miR-122 50,406 15,046
mmu-miR-709 14,482 2,168
mmu-let-7a 6,797 1,504
mmu-let-7f 6,096 1,436
mmu-let-7c 6,086 811
mmu-let-7d 4,780 623
mmu-let-7b 4,103 369
mmu-miR-466f-3p 2,614 742
mmu-miR-26a 2,346 288
mmu-miR-467b* 1,842 499
mmu-let-7g 1,520 351
mmu-miR-192 1,463 227
mmu-miR-689 1,159 617
mmu-miR-23b 838 242
mmu-miR-466i 782 240
mmu-miR-720 778 455
mmu-miR-467f 774 253
mmu-miR-467a* 718 242
mmu-miR-466g 554 154
mmu-miR-574-5p 487 72
mmu-miR-669f 463 161
mmu-miR-191 456 170
mmu-miR-483 451 91
mmu-miR-705 378 132
mmu-let-7i 370 107
mmu-miR-690 369 48
mmu-let-7e 369 169
mmu-miR-21 355 355
mmu-miR-805 352 131
mmu-miR-24 350 125
mmu-miR-1895 343 66
mmu-miR-22 308 30
mmu-miR-762 301 107
mmu-miR-126-3p 293 120
mmu-miR-26b 283 245
mmu-miR-1224 262 72
mmu-miR-23a 258 52
mmu-miR-16 235 74
mmu-miR-125b-5p 231 80
mmu-miR-103 222 57
mmu-miR-1187 210 39
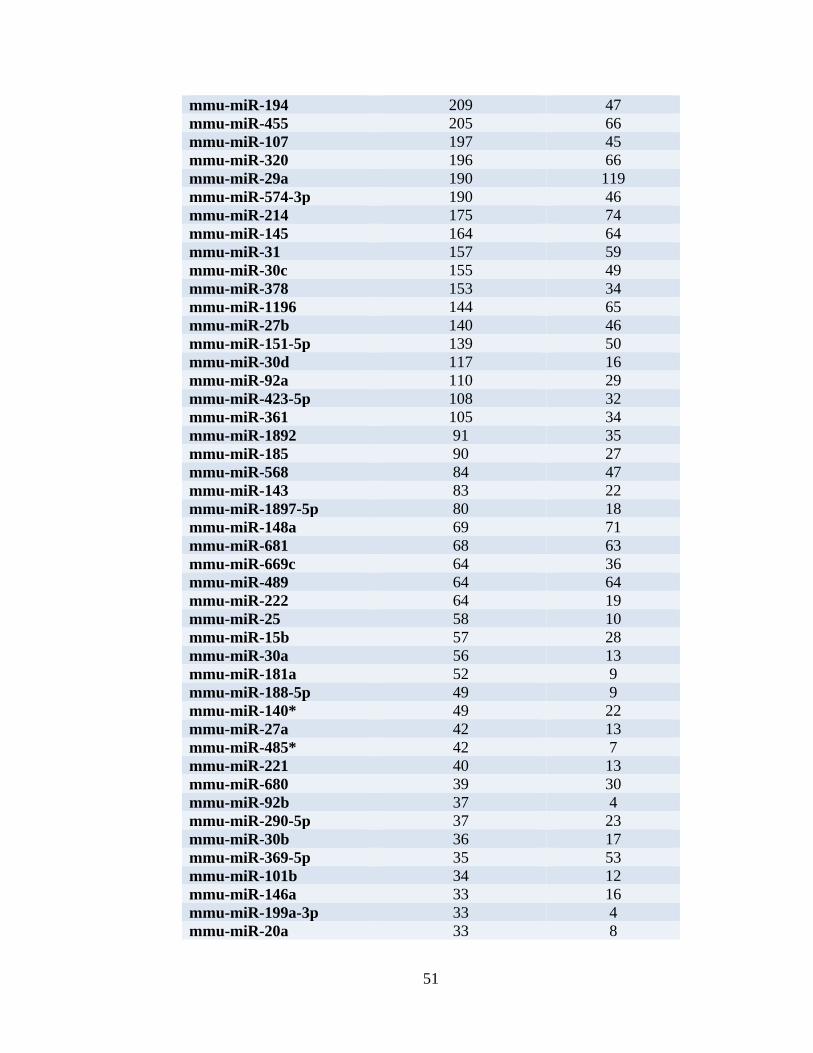
51
mmu-miR-194 209 47
mmu-miR-455 205 66
mmu-miR-107 197 45
mmu-miR-320 196 66
mmu-miR-29a 190 119
mmu-miR-574-3p 190 46
mmu-miR-214 175 74
mmu-miR-145 164 64
mmu-miR-31 157 59
mmu-miR-30c 155 49
mmu-miR-378 153 34
mmu-miR-1196 144 65
mmu-miR-27b 140 46
mmu-miR-151-5p 139 50
mmu-miR-30d 117 16
mmu-miR-92a 110 29
mmu-miR-423-5p 108 32
mmu-miR-361 105 34
mmu-miR-1892 91 35
mmu-miR-185 90 27
mmu-miR-568 84 47
mmu-miR-143 83 22
mmu-miR-1897-5p 80 18
mmu-miR-148a 69 71
mmu-miR-681 68 63
mmu-miR-669c 64 36
mmu-miR-489 64 64
mmu-miR-222 64 19
mmu-miR-25 58 10
mmu-miR-15b 57 28
mmu-miR-30a 56 13
mmu-miR-181a 52 9
mmu-miR-188-5p 49 9
mmu-miR-140* 49 22
mmu-miR-27a 42 13
mmu-miR-485* 42 7
mmu-miR-221 40 13
mmu-miR-680 39 30
mmu-miR-92b 37 4
mmu-miR-290-5p 37 23
mmu-miR-30b 36 17
mmu-miR-369-5p 35 53
mmu-miR-101b 34 12
mmu-miR-146a 33 16
mmu-miR-199a-3p 33 4
mmu-miR-20a 33 8

52
mmu-miR-99b 32 12
mmu-miR-674 32 11
mmu-miR-193 32 11
A.2 Differential expression of hepatic miRNAs in the fasted and refed state
The transition from fasting to the refed state requires significant changes in
hepatic mRNA profiles99,100
. Most of the genes are implicated in lipid metabolism,
cholesterol synthesis, gluconeogenesis and ketogenesis99,100
, as expected from the
established role of the liver at regulating these pathways in response to changes in levels
of glucose and insulin. MicroRNAs are largely transcribed by RNA polymerase II and
therefore, can be transcriptionally regulated like protein-encoding genes to change levels
of genes needed for the metabolic switch between the fed and fasted periods. To
determine whether miR-709 levels are influenced by nutritional/hormonal status, and to
gain an insight on other miRNAs that could be regulated in such manner, we generated
miRNA profiles in mice under fasted or refed conditions.
Total RNA from 14-week old, male C57BL/6J mice (5 mice per group) was used
in the study. Mice under fed conditions had free access to food throughout the study.
Mice were fasted for 16 hours (fasted group) or fasted for 16 hours and refed for 5 hours
(refed group) (Table 4). TaqMan Low Density Array (TLDA) cards A and B for rodents
were used to analyze miRNA expression in four animals from the fasted versus the refed
group. These two groups were used because we anticipated that if miRNA play a role at
regulating metabolic genes, the largest differences in miRNA expression would occur
between the fasted and refed periods, when genes involved in fatty acid oxidation,
ketogenesis and gluconeogenesis need to be shutdown, while genes involved in

53
glycolysis and lipogenesis need to be upregulated. The A and B array cards together can
detect 518 miRNAs specific to rodents. We have identified 39 miRNAs from the ‘A’ card
and 22 miRNAs from the ‘B’ card that are differently expressed under fasting/refed
conditions, with a fold-level of expression ranging from 1.5 to 32.4 (Table 5). It was
striking to note that all miRNAs exept one (mmu-miR-21*) were downregulated under
refed relative to fasting conditions, suggesting that miRNA control metabolic pathways
mostly by inhibiting expression of gene targets during fasting conditions.
Table 4. Blood glucose and body weight.
Fed Fasted Refed
Glucose (mg/dl) 140.8±19.1 71.0±9.1 148.0±11.0
Body weight (g) 29.0±2.4 26.4±1.1 28.2±2.2

54
Table 5. miRNAs differentially expressed between fasted and refed
groups.
‘A’ Array
miRNA Fold Change
(Fasted/Refed)
p-value
mmu-miR-455 27.05 0.022
mmu-miR-214 3.88 0.025
mmu-miR-23b 2.93 0.013
mmu-miR-676 2.90 0.023
snoRNA202 2.87 0.018
mmu-miR-25 2.86 0.005
mmu-miR-99a 2.82 0.012
mmu-miR-425 2.79 0.013
mmu-miR-652 2.69 0.002
mmu-miR-221 2.67 0.004
mmu-miR-340-3p 2.58 0.019
mmu-let-7g 2.50 0.017
mmu-miR-181a 2.47 0.035
mmu-miR-335-5p 2.33 0.021
mmu-miR-145 2.17 0.026
mmu-miR-125b-5p 2.17 0.006
mmu-miR-532-5p 2.16 0.009
mmu-miR-30c 2.12 0.017
mmu-miR-199a-3p 2.03 0.000
mmu-miR-381 1.98 0.020
mmu-miR-590-5p 1.95 0.045
mmu-let-7d 1.93 0.042
mmu-miR-328 1.89 0.023
mmu-miR-27a 1.86 0.033
mmu-let-7b 1.85 0.003
mmu-miR-146b 1.83 0.027
mmu-miR-93 1.82 0.017
mmu-let-7i 1.82 0.022
mmu-miR-18a 1.80 0.047
mmu-miR-152 1.80 0.022
mmu-miR-365 1.74 0.031
mmu-miR-26a 1.73 0.004
mmu-miR-143 1.73 0.023
mmu-let-7c 1.72 0.033
mmu-miR-30b 1.72 0.028
mmu-miR-195 1.68 0.039
mmu-miR-122 1.54 0.021
mmu-miR-148a 1.53 0.019

55
mmu-miR-103 1.52 0.008
‘B’ Array
miRNA Fold Change
(Fasted/Refed)
p-value
mmu-miR-29b* 32.42 0.008
mmu-miR-744* 15.79 0.003
mmu-miR-28* 5.11 0.016
mmu-miR-15b* 4.80 0.010
mmu-miR-674* 4.11 0.040
mmu-let-7a* 3.87 0.022
mmu-miR-760 3.65 0.033
mmu-miR-29c* 3.38 0.025
mmu-miR-22* 2.79 0.006
mmu-miR-214* 2.75 0.030
mmu-miR-872* 2.56 0.020
mmu-miR-193* 2.49 0.009
mmu-miR-720 2.48 0.025
mmu-miR-22* 2.34 0.015
mmu-miR-22 1.98 0.026
mmu-miR-706 1.92 0.045
mmu-miR-31* 1.88 0.023
mmu-miR-22 1.67 0.024
mmu-miR-30a* 1.64 0.034
mmu-miR-378 1.54 0.032
mmu-miR-378 1.52 0.027
mmu-miR-21* -29.52 0.025

56
The predicted targets of the 10 genes with >3-fold decrease/increase were
identified using the DIANA-microT-CDS v5.0 database. This was followed by analysis
using DIANA-miRPath v2.0 to perform hierarchical clustering of miRNAs and to
identify pathways based on their interaction levels (Table 6). Several of these pathways
were relevant to metabolic functions, including the PI3K-Akt and mTOR signaling
pathways. By the time this thesis project started, the role of these miRNAs was unknown.
Nevertheless, a recent literature search (at the end of this thesis project) on these miRNAs
has shown that several of them have roles in hepatocellular carcinoma (miR-22101-103
,
miR-378104
, miR-214105
, miR-99a106
, miR-195107
, miR-27a108
, miR-199a-3p109
, let-7g110
,
let-7c111
, miR-122112
, miR-181a113
, miR-145114
, miR-148a115
, miR-221116
, miR-125b-
5p117
, miR-590-5p118
, miR-18a119
, miR-93120
, miR-25121
), liver regeneration (miR-
23b122,123
), liver cirrhosis (miR-652124
, miR-181a113
), liver fibrosis (miR-199a-3p125
) and
insulin sensitivity (miR-10350
, miR-99a126
, miR-145127
, miR-143128
).
The results of the TaqMan Low Density Array showed that miR-709 was a highly
expressed miRNA, confirming the microarray chip results (Table 3 and data not shown).
However, the data indicated that miR-709 expression does not change significantly
between the fasted to refed state. Thus, it is unlikely that this miRNA is needed to
regulate pathways in response to insulin and/or metabolites that are generated during
fasting or refeeding. Nevertheless, given that it was significantly upregulated in db/db
animals, we questioned how miR-709 might contribute to the pathophysiology of type 2
diabetes. Analysis of predicted targets using the databases miRanda and miRWalk,
suggested a potential role on cell proliferation. Hepatic steatosis is a hallmark of type 2
diabetes, and is associated with inflammatory processes and increased apoptosis, which

57
leads to cell repair and regeneration. Thus, we hypothesized that miR-709 would play a
role in this response and proceeded with identifying its targets.
Table 6. Predicted pathway regulation by miRNAs.
Pathway/gene cluster miRNA
PI3K-Akt signaling pathway let-7b, miR-199a, miR-25
Focal adhesion miR-25, miR-199a
Transcriptional misregulation in cancer let-7b, miR-199a
Renin-Angiotensin system miR-26a, miR-193
ECM-receptor interaction let-7b, miR-25
Protein processing in endoplasmic reticulum miR-26a, miR-125b
Pathways in cancer miR-103, miR-532
Protein digestion and absorption let-7b, miR-26a
Hypertrophic cardiomyopathy (HCM) miR-25, miR-26a
mTOR signaling pathway miR-26a
ErbB signaling pathway miR-199a
Hedgehog signaling pathway miR-103
N-Glycan Biosynthesis miR-26a
Ubiquitin mediated proteolysis miR-125b
Mucin type O-Glycan biosynthesis miR-125b
Arrhythmogenic right ventricular cardiomyopathy miR-25

58
B. Targets of miR-709 in murine liver
B.1. miR-709-3p is the mature strand of miRNA-709
To determine which strand of the miRNA is loaded into the RNA-induced
Silencing Complex (RISC), and therefore available for knockdown of its target genes,
luciferase reporter constructs were generated containing the sequence complementary to
the 5’ or 3’ strand of miR-709 (Figure 9). Primary hepatocytes were transfected with
these plasmids and miR-709 mimic or control miRNA (Cel-239b). A 22.4-fold
downregulation was seen specifically for the miR-709-3p construct, compared to control
constructs (Figure 12). No effect was seen in cells transfected with miRNA-805,
confirming the specificity of the binding. The plasmid specific for the miR-709-3p strand
was also significantly downregulated in the Hepa1c1c cell line (Figure 13).
Furthermore, primary hepatocytes transfected with a tough decoy (TuD)
containing 8 copies of the sequence complementary to the 3’ strand showed a significant
downregulation of luciferase expression relative to cells transfected with a plasmid
without the sites (psiCHECKTM
-2), indicating that the 3p is used as the guide strand for
the endogenous miR-709 (Figure 14). Altogether, these data indicate that the 5p strand is
not used by RISC and confirms that the 3p is used as the guide strand of miR-709 in
murine liver.

59
Figure 12. miR-709 strand selection in primary hepatocytes. Primary hepatocytes
were plated on 6-well plates at 4x10⁵ cells/well and transfected with 34 nM miR-709,
miR-805 or Cel-239b, and 1.5 µg of plasmid p.miR-709-5p or p.miR-709-3p. Dual-
luciferase assays were performed on extracts prepared 24 hours later. Renilla luciferase
activity was normalized to firefly luciferase expressed from the same plasmid. Cel-239b
and miR-805 serve as negative control miRNAs. The results are representative of two
independent experiments. Error bars represent the standard deviation.
*

60
Figure 13. miR-709 strand selection in the Hepa1c1c7 cell line. Hepa1c1c7 cells were
plated on 6-well plates at 1x10⁵ cells/well and transfected with miR-709, miR-805 or Cel-
239b, as described in Figure 12. Dual-luciferase assays were performed on extracts
prepared 24 hours later. Renilla luciferase activity was normalized to firefly luciferase
expressed from the same plasmid. Cel-239b and miR-805 serve as negative control
miRNAs. The results are representative of two independent experiments. Error bars
represent the standard deviation.

61
Figure 14. Strand selection of endogenous miR-709 in primary hepatocytes. Tough
decoys were generated by cloning 8 copies of the sequence complementary to the 3p
strand of miR-709 or the 5p strand of miR-122. Primary hepatocytes were plated on 6-
well plates at 4x10⁵ cells/well and transfected with 2 μg of TuD122, TuD709 or
psiCHECKTM
-2 (psiCK2) using Metafectene-Pro at 1:4 ratio. Dual-luciferase assays were
performed on extracts prepared 40 hours later. Renilla luciferase activity was normalized
to firefly luciferase expressed from the same plasmid. TuD122 was used as positive
control, and psiCHECKTM
-2 as reference for luciferase expression. n = 3, with error bars
representing the standard deviation. *p < 0.05 TuD vs psiCHECKTM
-2. The same data
was obtained from two independent experiments.

62
B.2. miR-709-regulated transcriptome
To identify gene targets of miR-709, mouse primary hepatocytes were transfected
with miR-709 mimic or Cel-239b. Increased levels of miR-709 (3.8-fold) were confirmed
by TaqMan miRNA assay in cells harvested 24 hours post-transfection (Figure 15). Gene
expression profiles were then generated using murine-specific Affymetrix mRNA
microarrays (n = 3-4). The short time frame (24 hours) allowed identifying direct targets
of miR-709, reducing the possibility of detecting changes in mRNA levels due to
secondary effects.
Close to 570 genes were seen downregulated in miR-709-treated cells, compared
to Cel-239b. Hierarchical cluster of the top 100 genes was done by ANOVA, arrays
Euclidean distance, genes Pearson’s dissimilarity and average linkage (Figure 16). Of the
28,850 genes on the microarray, 36 genes were significantly downregulated >2-fold and
10 genes were downregulated >3-fold in the miR-709 group compared to control Cel-
239b-treated cells (Table 7; p-value <0.01). The list of downregulated genes was further
analyzed using bioinformatic analysis resource DAVID (Database for Annotation,
Visualization and Integrated Discovery)129,130
and GENEGO Databases using pathway
analysis and metabolic maps. The results of this analysis suggested a role for this miRNA
at controlling cellular processes involved in lipid synthesis and transport (Ces1g, Pctp,
Daglb), cytoskeleton organization (Rab11b, Dync1li1, Acta2, M6prbp1, Myo1d) and cell
adhesion (Timp3, Nid1, Thbs1, Krt19).

63
Figure 15. miR-709 quantification in primary hepatocytes transfected with mimic.
Primary hepatocytes were plated on 6-well plates at 5x10⁵ cells/well and transfected with
34 nM of miR-709 or Cel-239b using Metafectene-Pro at 1:6 ratio. Cells were harvested
24 hours later and mature miR-709 was quantified by TaqMan assay. A 3.8-fold increase
was observed relative to Cel-239b-treated cells. snoRNA-202 was used as normalizer.

64
Figure 16. Hierarchical cluster of top 100 genes. Analysis was done by ANOVA arrays
Euclidean distance, genes Pearson’s dissimilarity, and average linkage. The top
dendogram separates genes by their expression pattern. Blue indicates lower and red
indicates higher signals. The dendogram on the left separates the two treatment groups –
miR-709 and Cel-239b.

65
Table 7. Genes significantly downregulated >2-fold in miR-709-treated
compared to Cel-239-treated primary hepatocytes.
Gene
symbol
Gene name Fold
change
p-value
Tspan31 Tetraspanin 31 -5.27 1.8E-06
Rab11b Ras-related protein -4.18 6.5E-06
Cyp20a1 Cytochrome P450, Family 20, Subfamily
A, Polypeptide 1 -3.76 1.2E-07
Dync1li1 dynein, cytoplasmic 1, light intermediate
chain 1 -3.40 2.3E-07
Bpnt1 3'(2'), 5'-bisphosphate nucleotidase 1 -3.28 9.3E-09
Mmachc
methylmalonic aciduria (cobalamin
deficiency) cblC type, with
homocystinuria
-3.27 1.5E-05
Ces1 carboxylesterase 1 -3.22 1.7E-06
Timp3 Tissue Inhibitor Of Metalloproteinases 3 -3.20 4.6E-05
Pctp phosphatidylcholine transfer protein -3.19 6.2E-07
Nid1 nidogen 1 -3.03 2.7E-06
Slc35e1 solute carrier family 35, member E1 -2.95 3.7E-09
Mare alpha globin regulatory element
containing gene -2.75 7.0E-08
D13Wsu177e DNA segment, Chr 13, Wayne State
University 177, expre -2.71 1.7E-08
Thbs1 thrombospondin 1 -2.67 2.1E-06
Lrrc58 leucine rich repeat containing 58 -2.53 6.2E-07
Acta2 actin, alpha 2, smooth muscle, aorta -2.52 1.4E-05
M6prbp1 mannose-6-phosphate receptor binding
protein 1 -2.50 1.7E-06
Atrn attractin -2.46 4.7E-06
Mpzl2 myelin protein zero-like 2 -2.41 4.1E-06
Tagln transgelin -2.36 6.6E-06
Cnn1 calponin 1 -2.36 4.0E-05
Krt19 keratin 19 -2.35 2.9E-03
Myo1d myosin ID -2.31 1.5E-07
Cyb5d2 cytochrome b5 domain containing 2 -2.29 1.1E-06
Actc1 actin, alpha, cardiac muscle 1 -2.29 1.3E-05
Pfas phosphoribosylformylglycinamidine
synthase -2.27 1.1E-08
Ggcx gamma-glutamyl carboxylase -2.20 7.5E-05
Ccnyl1 cyclin Y-like 1 -2.17 1.0E-05
Amt aminomethyltransferase -2.16 2.0E-04
BC057893 cDNA sequence BC057893 -2.12 3.3E-06
Gpr155 G protein-coupled receptor 155 -2.05 1.7E-04
Daglb diacylglycerol lipase, beta -2.05 2.7E-06
Sema6a sema domain, transmembrane domain -2.04 9.4E-05

66
(TM), and cytoplasmic
Fnip2 folliculin interacting protein 2 -2.01 3.9E-04
Slc7a1 solute carrier family 7 (cationic amino
acid transporter -2.01 1.6E-06
Mobkl2a MOB1, Mps One Binder kinase activator-
like 2A (yeast) -2.00 2.3E-05

67
To validate the microarray results, CD36, Acox2, Gck, Pfkl, Rab11b, Ces1g and
Pctp were analyzed by quantitative real time PCR. Identical trends to those observed in
the microarray analysis were observed (Figure 17). Interestingly, Rab11b, Pctp and
Ces1g showed more than 5-fold downregulation upon validation, which was greater than
what was observed in the microarray analysis. The decrease in gene expression was
maintained for at least 4 days (Figure 18). Changes were confirmed at protein level for
several genes, including Rab11b, Dync1li1 and Timp3 (Figure 19). The low-density
lipoprotein receptor (Ldlr) was 1.2-fold downregulated in the microarray (p=0.004), but
remained unaltered at protein level, suggesting that small changes in mRNA levels had
no impact at protein level (Figure 19). Remarkably, levels of Rab11b, Dync1li1 and
Timp3 were lower in primary hepatocytes within 48 hours of transfection with miR-709
(Figure 19). miR-709 induced a 90% decrease in Rab11b protein levels and a 70%
decrease in Dync1li1 protein expression. Consistent with these data, Rab11b protein
levels were also significantly reduced in Hepa1c1c cells transfected with miR-709
mimics (Figure 20).

68
Figure 17. Real time RT-PCR analysis of miR-709 targets. Cluster of Differentiation
36 (CD36), Acyl-CoA oxidase 2 (Acox2), Ras-related protein (Rab11b),
phosphofructokinase, liver (Pfkl), phosphatidylcholine transfer protein (Pctp),
glucokinase (Gck) and carboxylesterase 1g (Ces1g) were analyzed by qPCR. Mouse
primary hepatocytes were plated on 6-well plates at 1x10⁶ cells/well and transfected with
34 nM miR-709 or Cel-239b using Metafectene-Pro at 1:6 ratio. Cells were harvested 24
hours later (n = 4; error bars represent the standard deviation). TATA Binding protein
(Tbp) was used as normalizer gene. *p<0.05 relative to Cel-239b-treated. The fold-
change for each gene relative to Cel-239b-treated is plotted.
* *
* *
*
* * *
*

69
Figure 18. Prolonged downregulation of miR-709 targets over time. Real time RT-
PCR analysis of Ras-related protein (Rab11b), phosphatidylcholine transfer protein
(Pctp) and tissue inhibitor of metalloproteinases 3 (Timp3). Mouse primary hepatocytes
were plated on 6-well plates at 4x10⁵ cells/well and transfected with 34 nM miR-709 or
Cel-239b using Metafectene-Pro at 1:6 ratio. Cells were harvested at 24, 48, 72 and 96
hours post-transfection (error bars represent standard deviation). TATA binding protein
(Tbp) was used as normalizer gene. The mRNA expression for each gene is plotted.
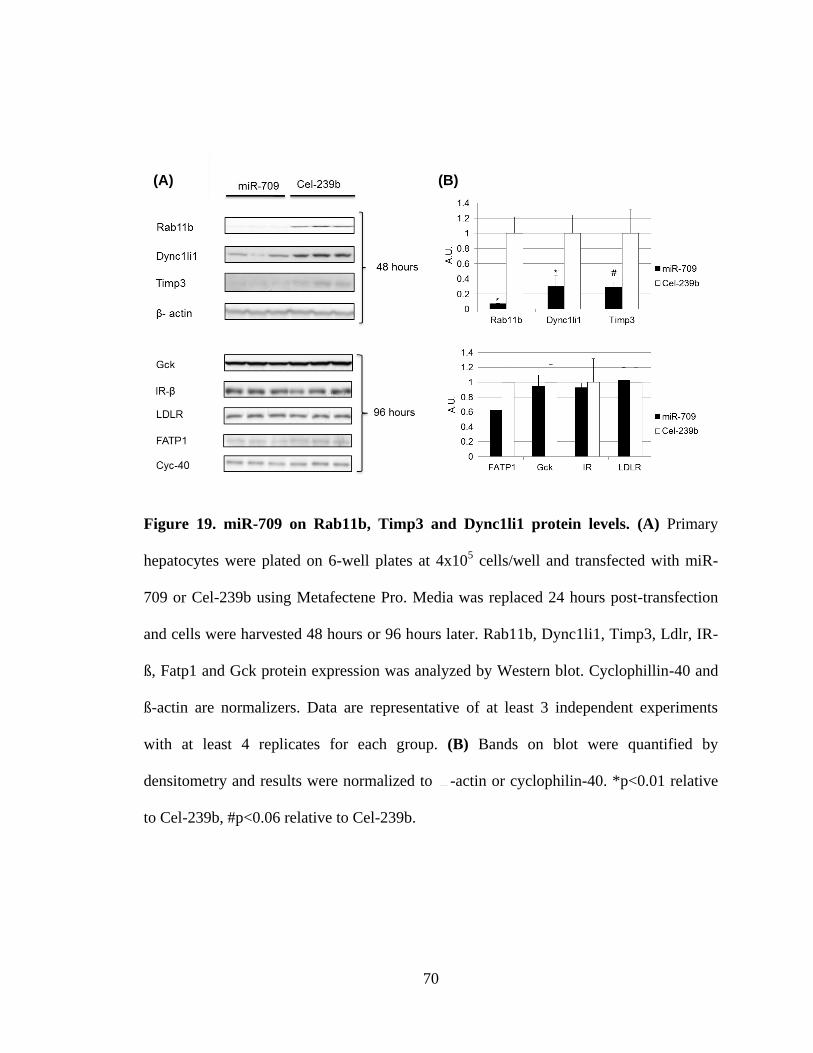
70
Figure 19. miR-709 on Rab11b, Timp3 and Dync1li1 protein levels. (A) Primary
hepatocytes were plated on 6-well plates at 4x10⁵ cells/well and transfected with miR-
709 or Cel-239b using Metafectene Pro. Media was replaced 24 hours post-transfection
and cells were harvested 48 hours or 96 hours later. Rab11b, Dync1li1, Timp3, Ldlr, IR-
ß, Fatp1 and Gck protein expression was analyzed by Western blot. Cyclophillin-40 and
ß-actin are normalizers. Data are representative of at least 3 independent experiments
with at least 4 replicates for each group. (B) Bands on blot were quantified by
densitometry and results were normalized to -actin or cyclophilin-40. *p<0.01 relative
to Cel-239b, #p<0.06 relative to Cel-239b.
(A) (B) (
A
)

71
Figure 20. miR-709 decreases Rab11b in Hepa1c1c cells. Hepa1c1c cells were plated
on 6-well plates at 4x10⁵ cells/well and transfected with 34 nM of miR-709 or Cel-239b.
Media was replaced 24 hours post-transfection and cells were harvested 72 hours later.
Rab11b protein expression was analyzed by Western blot. ß-actin acts as normalizer.
Data are representative of 3 replicates for each group. (B) Bands on blot were quantified
by densitometry and results were normalized to -actin. *p<0.01 relative to Cel-239b.
(A)
(
B)
(B)
72
B.3. Ces1g, Rab11b and Pctp are direct targets of miR-709
miRNAs act on their target genes mostly by binding to the 3’ untranslated region
(UTR) of their mRNAs. We have shown that miR-709 downregulates Rab11b, Pctp, and
Ces1g. To confirm that these are direct gene targets, we used the miRanda database to
identify predicted binding sites for miR-709 on the 3’ UTR of these genes. Rab11b, Pctp
and Ces1g had 3, 2 and 1 predicted binding sites, respectively. Using PCR, we amplified
the 3’ UTR of Rab11b, Ces1g and Pctp containing at least one of the miR-709 binding
sites (Figure 21), and cloned them in plasmid psiCHECKTM
-2 (Figure 9). As negative
control for each gene, a fragment of the 3’ UTR without miR-709 binding sites was
amplified and cloned in psiCHECKTM
-2. Primary hepatocytes were transfected with these
constructs together with miR-709 mimic or Cel-239b, and harvested 24 hours later.
Lower levels of Renilla luciferase were observed in the constructs containing binding
sites for miR-709 (p.Rab11b, p.Pctp and p.Ces1g), compared to constructs that had a
fragment of the 3’ UTR without the miR-709 target sequence (p.NC-Rab11b, p.NC-Pctp
and p.NC-Ces1g) (Figure 22). These data confirm that Rab11b, Pctp and Ces1g are direct
targets of miR-709.

73
Figure 21. miR-709 putative binding sites in the 3’ UTR of Rab11b, Ces1g and Pctp.
The primers (shown in green) were designed such that they flanked the putative miR-709
binding site (shown in red) for each gene. The 3’ UTR fragment used as negative control
(NC) was amplified using primers that bind outside of the miR-709 binding sites (shown
in blue). The size of the 3’ UTR amplified by PCR for Rab11b, NC-Rab11b, Ces1g, NC-
Ces1g, PCTP and NC-PCTP are 712, 261, 253, 236, 365 and 237 bp respectively.

74
Figure 22. Rab11b, Pctp and Ces1g are direct targets of miR-709. Primary
hepatocytes were plated on 6-well plates at 4x10⁵ cells/well and transfected with 34 nM
miR-709 or Cel-239b, and 1.5 µg of plasmids containing the 3’ UTR of Rab11b, Pctp and
Ces1g. Twenty-four hours later, dual-luciferase assays were performed. Renilla luciferase
activity was normalized to firefly luciferase expressed from the same plasmid (n=3).
Error bars represent the standard deviation. The experiment was performed in two
independent experiments with identical results. p-values (*p < 0.01) are relative to cells
treated with the same plasmid using Cel-239b miRNA. p.miR-709, plasmid containing
the sequence perfectly complementary to miR-709-3p strand; p.Pctp, p.Ces1g and
p.Rab11b, plasmids containing a fragment of the 3’ UTR with miR-709 binding sites;
p.NC-Pctp, p.NC-Ces1g and p.NC-Rab11b, plasmids with a fragment of the 3’ UTR
without miR-709 binding sites.

75
B.4. Database gene predictions
Multiple databases are available to identify predicted targets of miRNA. To
determine the accuracy of these predictions, we compared the list of the genes
downregulated at least 2-fold, with target predictions from seven databases, including
miRanda74
, miRDB79,80
, miRWalk81
, TargetScan82
, DIANAmT83,84
, miRBase85-91
,
PICTAR592
and RNA2293
(Table 8). The predictions were based on presence of the miR-
709 putative binding site in the 3’ UTR of the mRNAs. This analysis revealed that
miRanda, miRWalk, DIANAmT and PICTAR5 are the best database predictors of
miRNA targets, with 60-70% of gene predictions, while miRDB, TargetScan and RNA22
predicted less than 22% of the genes that were found downregulated. Only one gene was
predicted by all databases (Myo1d) (Table 8) and 22% of genes were not predicted by
any of them.
miR-709 is not a conserved miRNA, and the human ortholog is hsa-miR-1827,
which shares the same seed sequence (UGAGGCAGUAGAUUGAAU). Analysis of
predicted hsa-miR-1827 targets using the miRWalk database, indicates that similar genes
and pathways are regulated by both miRNA (Table 9). Overall, approximately 61% of
miR-709 target genes are also predicted targets of miR-1827. Given that the miRWalk
database only predicted 69% of the actual miR-709 targets, it is likely that the number of
commonly targeted genes is higher.

76
Table 8. Predicted versus observed miR-709 target genes.
Database
Gene FL mR mD mW TS DT PT5 R22
Tspan31 -5.3 * * * * *
Rab11b -4.2 * * * * *
Cyp20a1 -3.8
Dync1li1 -3.4 * * * * *
Bpnt1 -3.3 * * * *
Mmachc -3.3
Ces1 -3.2 * * * *
Timp3 -3.2 * * * * *
Pctp -3.2 * * * * *
Nid1 -3.0 * *
Slc35e1 -3.0 * * * * *
Mare -2.8 * * * * *
D13Wsu177e -2.7 * * * *
Thbs1 -2.7 * * * * *
Lrrc58 -2.5 * * * *
Acta2 -2.5 * * * *
M6prbp1 -2.5 * * * *
Atrn -2.5 * * * * * *
Mpzl2 -2.4 * * * *
Tagln -2.4 * * * * *
Cnn1 -2.4 *
Krt19 -2.4
Myo1d -2.3 * * * * * * *
Cyb5d2 -2.3
Actc1 -2.3 *
Pfas -2.3
Ggcx -2.2 * * * * *
Ccnyl1 -2.2
Amt -2.2
BC057893 -2.1 * * * *
Gpr155 -2.1 * *
Daglb -2.1 * * * *
Sema6a -2.1 * * *
Fnip2 -2.0
Slc7a1 -2.0 * * * * *
Mobkl2a -2.0 * * * *
TOTAL PREDICTED:
(%):
25
(69)
7
(20)
22
(61)
8
(20)
24
(67)
25
(69)
6
(17)
TOTAL UNPREDICTED:
(%):
11
(31)
29
(80)
14
(39)
28
(80)
12
(33)
11
(31)
30
(83)
FL, fold-level; mR, miRanda; mD, miRDB; mW, miRWalk; TS, Targetscan; DT,
DIANAmT; PT5, PICTAR5; R22, RNA22; * predicted.

77
Table 9. Overlap between mmu-miR-709 target genes and hsa-miR-1827
predicted targets.
miR-709 miR-1827
Tspan31 TSPAN32
Rab11b RAB11FIP5
Cyp20a1 CYP19A1
Dync1li1 DYNLL2
Bpnt1 BPNT1
Mmachc MMACHC
Timp3 TIMP4
Pctp STARD3
Slc35e1 SLC35C1, SLC35E4
Mare NPR3
Thbs1 THBS1
Lrrc58 LRRC58
Tagln TAGLN
Cnn1 CNN3
Krt19 Many KRT proteins
Myo1d Many MYO proteins
Cyb5d2 CYB561D2
Pfas PFAS
Gpr155 Many GPR proteins
Sema6a SEMA6A
Fnip2 FNIP1
Slc7a1 SLC7A60S

78
C. Biological role of miR-709 in liver
C.1. miR-709 gene targets do not regulate hepatocyte polarity
A coordinated role between Rab11 and Dync1li1 in membrane trafficking has
been described in A431 cells, a human epidermal carcinoma cell line131
. However, the
role of these proteins in hepatic function is unknown. The Rab family of proteins is a
group of small GTPases that regulate various facets of endosomal trafficking16,132
. Rab
proteins participate in vesicle formation, trafficking and fusion and are often associated
with cytoskeletal motor proteins133
. Rab11b is one of the widely studied members of the
Rab11 family and is ubiquitously expressed133
. It localizes to apical vesicles separated
from the Rab11a compartment in MDCK and gastric parietal cells132,134,135
. Rab11b plays
a critical role in apical recycling of epithelial sodium channel (ENaC) in mpkCCD
cells133
and has been shown to interact with its effector protein Rip11 in insulin granule
exocytosis136
. Cytoskeletal motor proteins are accountable for the trafficking of
endocytosed material between the surface of the cell and intracellular compartments137
.
Dynein cytoplasmic light chain 1 (Dync1li1) is a component of the Dynein-1 complex, a
minus-end-directed microtubule–based motor protein131,138-142
. Rab11 along with its
effector protein FIP3 acts together with Dync1li1 and guides membrane trafficking from
peripheral sorting endosomes to the endosomal recycling compartment (ERC)131
. Given
that Rab11b and Dync1li1 were among the top downregulated genes, we hypothesized
whether a role of miR-709 is to regulate hepatocyte polarization and trafficking.
To study if miR-709 affected the capacity of primary hepatocytes to maintain
polarity and form bile caniculi, a sandwich cell culture model was established to enable

79
adjacent hepatocytes to form bile canaliculi and mimic the 3D arrangement of the murine
liver (Figure 4). Primary hepatocytes were cultured on collagen-I coated glass coverslip
bottom 6-cm dishes, and the next day, cells were washed and overlaid with MatrigelTM
(see Methods: Primary hepatocyte isolation)77
. Bile canaliculi were apparent 24 hours
later and maintained for several days (Figure 23). Unlike primary hepatocytes cultured in
a conventional monolayer, which lose hepatocyte-specific functions as the result of
dedifferentiation, the sandwich model enables hepatocytes to form intact bile canaliculi
closed by tight junctions, retaining their function for several weeks12,143
. Cells cultured
under these conditions secrete albumin, urea, transferring, fibrinogen, and bile acids144
.
Next, we tested the capacity of these bile canaliculi to transport sodium fluorescein, a
substrate for Multidrug resistance-associated protein 2 (Mrp2), a protein found on the
membrane of the bile canaliculi. Within 30 minutes, sodium fluorescein dissappeared
from the cytoplasm of cells and became visible in the bile canaliculi (Figure 24).
To study if the alterations in gene expression affected the capacity of the
hepatocytes to maintain polarity and form bile canaliculi, primary hepatocytes were
transfected with miR-709 or Cel-239b, 4 hours after plating. The next day, cells were
covered with MatrigelTM
to allow contact between adjacent cells. miR-709 and Cel-239b
transfected cells could form bile canaliculi between cells within 24 hours that were
maintained for at least 4 days, without a noticeable difference between the two groups.
Furthermore, uptake and transport of sodium fluorescein into the bile canaliculi was
similar for both miR-709 and Cel-239b-treated hepatocytes (Figure 25). These data
indicate that miR-709 does not influence the establishment and maintenance of

80
hepatocyte polarity, the formation of bile canaliculi, and the intracellular transport of
Mrp2 substrates. Given that Rab11b was one of the highest downregulated genes, and its
function in liver is unknown, we tested whether knocking it down with siRNA would
lead to abnormal transport of sodium fluorescein. Similar results were obtained in
sandwich cultures of primary hepatocytes transfected with a combination of two siRNAs
against Rab11b (siRab11b-1 and siRab11b-2), or control siRNA (siNC) (Figure 26 and
Figure 27). Therefore, we concluded that Rab11b was not essential for the ability of
primary hepatocytes to be polarized nor did it alter the apical transport of an Mrp2
substrate.

81
Figure 23. Formation of bile canaliculi between primary hepatocytes cultured in a
sandwich configuration. Primary hepatocytes were plated on 35-mm glass bottom
collagen-coated dishes at 6x10⁵ cells/well. The following day, Matrigel
TM was added on
top of the cells. Images were acquired with a Nikon TE 2000 U inverted microscope 96
hours post-addition of MatrigelTM
. Images were acquired with a 20x or 40x Air EL WD
Plan Fluor 0.60NA Differential interference contrast objective (Melville, NY) and a Sony
DSCW170 16.1 MP digital camera. Arrows point at bile canaliculi.
20x
40x

82
Figure 24. Uptake and secretion of sodium fluorescein. Primary hepatocytes were
plated on 35-mm glass bottom collagen-coated dishes at 6x10⁵ cells/well. Matrigel
TM was
added to cells the following day. Cells were assayed for sodium fluorescein transport 96
hours post MatrigelTM
overlay. Na-F, sodium fluorescein.

83
Figure 25. Sodium fluorescein transport in primary hepatocytes transfected with
miR-709 or Cel-239b. Primary hepatocytes were plated on 35-mm glass bottom collagen
coated dishes at 6x10⁵ cells/well and transfected with 34 nM miR-709 or Cel-239b.
MatrigelTM
was added to cells the following day. Cells were assayed for sodium
fluorescein transport 72 hours post-transfection.

84
Figure 26. Rab11b silencing in mouse primary hepatocytes. (A) Primary hepatocytes
were plated on 6-well plates at 6x10⁵ cells/well and transfected with 30 nM of siRNAs to
knockdown Rab11b (siRab11b-1, siRab11b-2) or negative control siRNA (siNC) or a 1:1
complex of both siRab11b-1 and siRab11b-2. Media was replaced 24 hours post-
transfection and cells were harvested 24 hours later. Rab11b was quantified by Western
blot. Tubulin was used as normalizer (n=3). (B) Densitometry analysis of Western blot;
Rab11b expression was normalized to tubulin. * p-value <0.001.
(B)
(A)

85
Figure 27. Sodium fluorescein transport in primary hepatocytes treated with
siRab11b. Primary hepatocytes were plated on 35-mm glass bottom collagen-coated
dishes at 6x10⁵ cells/well and transfected with 30 nM of a combination of siRab11b-1
and siRab11b-2 (1:1 ratio) or negative control siRNA (siNC). MatrigelTM
was added to
cells the following day. Cells were assayed for sodium fluorescein transport 72 hours
post-transfection.

86
C.2. Intracellular localization of miR-709
Recently, miR-709 has been shown to regulate the processing of a miRNA cluster
in the nucleus of fibroblast cells145
. miR-709 binds to a miR-709 binding element in the
primary transcript of miR-15a/16-1 and prevents further processing into precursor or pre-
miR-15a/16-1145
. The same group reported that miR-709 was mostly localized in the
nucleus145
. In fibroblasts, apoptosis-inducing stimuli such as serum starvation, elicited
miR-709 translocation to the cytoplasm, without altering the total levels of the miRNA in
the cell145
. This change in localization resulted in loss of inhibition of miR-15a/16-1
processing and led to downregulation of a well-characterized miR-15a/16-1 target, B-cell
lymphoma 2 (Bcl-2)145
. Bcl-2 is an anti-apoptotic gene that prevents cell death by
blocking activation of caspases, downstream activators of apoptosis146
. The authors
concluded that miR-709 was sensitive to apoptotic stimuli and it indirectly affected
apoptosis through regulation of Bcl-2 levels145
.
To study the cellular localization of miR-709, primary hepatocytes were co-
transfected with a 3’-FAM-labeled miR-709 or Dy547-labeled miRIDIAN miRNA
Mimic Transfection Control (Thermo Fisher, CO). This control miRNA is cytoplasmic,
like the majority of mature miRNAs. Both, miR-709 and the control miRNA were found
localized only in the cytoplasm of primary hepatocytes (Figure 28). To determine
whether the intracellular localization of miR-709 depends on cell division, Hepa1c1c
cells were co-transfected with the two miRNA. Similar to what was observed in primary
hepatocytes, both miRNAs were located in the cytoplasm of Hepa1c1c cells (Figure 29).
Next, we tested if serum and glucose starvation would have an impact on the cellular

87
distribution of miR-709. For this, Hepa1c1c cells transfected with 3’-FAM-labeled miR-
709 and Dy547-labeled miRIDIAN microRNA Mimic Transfection Control were
subjected to serum and glucose starvation and observed 24 hours later. Both miRNAs
were seen only in the cytoplasm, co-localizing in the same area (Figure 29). Single
transfection of 3’-FAM-labeled miR-709 gave the same result, discarding the possibility
that the control miRNA infuences the localization of miR-709 (Figure 30). Thus, in
normal liver cells and in hepatoma cells, mature miR-709 is only localized in the
cytoplasm of the cells. Also, cellular stress such as starvation did not result in change in
localization of miR-709 in hepatoma cells.

88
Figure 28. Intracellular localization of miR-709 in primary hepatocytes. Primary
hepatocytes were plated on 35-mm glass bottom collagen-coated dishes at 6x10⁵
cells/well and co-transfected with 17 nM of 3’-FAM-labeled miR-709 and 17 nM of
Dy547-labeled miRIDIAN microRNA Mimic Transfection Control. Next day, media was
replaced and cells were imaged using confocal fluorescence microscopy. Nuclei were
stained with Hoechst 33342. Scale bar, 15 μm.

89
Figure 29. Intracellular localization of miR-709 in Hepa1c1c cells. Hepa1c1c cells
were plated on 35-mm glass bottom collagen coated dishes at 4x10⁵ cells/well and co-
transfected with 17 nM of 3’-FAM-labeled miR-709 and 17 nM of Dy547-labeled
miRIDIAN microRNA Mimic Transfection Control. Next day, media was replaced with
medium with/without glucose and FBS. Twenty-four hours later, cells were imaged using
confocal fluorescence microscopy. Nuclei were stained with Hoechst 33342. Scale bar,
15 μm.

90
Figure 30. Cytoplasmic miRNA localization in Hepa1c1c cells transfected with
miRNA-709. Hepa1c1c cells were plated on 35-mm glass bottom collagen coated dishes
at 4x10⁵ cells/well and transfected with 34 nM 3’-FAM-labeled miR-709. Next day,
media was replaced with medium with/without glucose and FBS. Twenty-four hours
later, cells were imaged using confocal fluorescence microscopy. Nuclei were stained
with Hoechst 33342. Scale bar, 15 μm

91
C.3. Pre-miR-709 accumulates in liver
To further gain an insight on the relative abundance of precursor and mature form
of miR-709, levels were analyzed by Northern blot. Remarkably, in normal liver, the
precursor miR-709 was present at high levels, while the mature form was scarce, contrary
to what is typically seen for most miRNAs147
, including miR-122 (Figure 31 and Figure
32). This suggested the possibility that pre-miR-709 is the major form of miR-709, and
only in the presence of appropriate signals, it is transported to the cytoplasm for Dicer
processing and production of the mature form. Consistently with these data, when
HEK293 and Hepa1c1c cells were transfected with plasmids expressing miR-709 primary
transcript (p.pri-miR-709), there was no increase in levels of mature miR-709 (Figure
33). This suggests that the majority of primary transcript expressed is not processed to
mature miR-709.
Given the nature of the gene targets of miR-709 (Tspan31, Rab11, Thbs1, Timp3,
Tagln, Cnn1, Krt19), we questioned whether this miRNA might be needed in liver cells
actively dividing. Thus, we tested the relative abundance of pre-miR-709 and mature
miR-709 in a mouse model of hepatocellular carcinoma, and in a model of liver
regeneration after partial hepatectomy148
. Cell proliferation, mitosis and expression of
cell cycle proteins in the model of partial hepatectomy peaks at 36 and 44 hrs148
. Hence,
these timepoints were used for this study. Remarkably, we found that the levels of mature
miR-709 were significantly increased in liver tumor and regenerating livers (Figures 31
and 34). Taqman real-time PCR was used to confirm the increase in levels of mature
miR-709 (Figure 35).

92
Several lines of evidence suggest that the half-life of a miRNA can be regulated at
the biosynthesis as well as decay level. Some miRNA are inherently unstable and have
short half-lives149
. In others, the stage of the cell cycle as well as the presence of growth
factors, influences miRNA stability without affecting transcription of the primary
transcript150
. MiR-709 is localized in intron 8 of the Rfx1 gene, which encodes for a
transcription factor with a function not well characterized in liver. Rfx1 inhibits c-Myc
and Proliferating Cell Nuclear Antigen (PCNA), both critical genes for cell
proliferation151-153
. To determine whether the increase of miR-709 is the result of
increased expression of Rfx1, its mRNA was analyzed by qPCR. Levels of Rfx-1 were
found 5.2-fold upregulated in tumor samples (Figure 35), indicating that the increased
levels of mature miR-709 are likely the result of increased transcription of the host gene.
These data link Rfx1 to liver cell proliferation.

93
Figure 31. Relative abundance of miR-709 in an animal model of hepatocellular
carcinoma. Northern blot analysis using 4 μg of small RNA fraction. A DIG-labeled
miR-709 LNA probe was used for detection of miR-709. LapMyc male (tumor and
adjacent normal tissue; n=5), LapMyc female (n=2), FVB female and Myc male mouse
liver RNA was used to probe for miR-709 by Northern blotting. The ribosomal RNA 5s
was used as loading control. The LapMyc mice are bi-transgenic. c-Myc oncogene
expression is conditionally regulated via Tet-Off system. The tetracycline-transactivator
(tTA) protein is driven by the liver-specific promoter, Liver Activator Protein (LAP), and
the c-Myc gene (in the Y chromosome) has a tetracycline response element. In the
absence of doxycycline, tTA can bind to the response element and cause c-Myc
expression in male mice. This causes the male mouse livers to develop spontaneous
tumors. c-Myc expression was induced at 4 weeks of age and animals were sacrificed at
14 weeks of age. LapMyc females are control mice that received doxycycline (and did

94
not express c-Myc). FVB are wild type female mice. Myc male mice are parents of
LapMyc mice. LapMyc female, FVB and Myc mice are negative controls.
Figure 32. Relative abundance of miR-122 in an animal model of hepatocellular
carcinoma. Northern blot analysis using 4 μg of the small RNA fraction. An
oligonucleotide probe was used for detection of miR-122. LapMyc male mouse liver
(tumor and adjacent normal tissue; n=5) RNA was used to probe for miR-122. The
ribosomal RNA 5s was used as loading control. For miR-122, the mature form is more
abundant than the pre-miR-122 in normal liver.

95
Figure 33. Levels of mature miR-709 in HEK293 and Hepa1c1c cells upon
transfection with plasmids expressing pri-miR-709 or pri-Cel-239b. HEK293 (A) or
Hepa1c1c (B) cells were transfected with 2 μg of p.pri-miR-709 or p.pri-Cel-239b and
harvested 24 later. Mature miR-709 was quantified by TaqMan assay (n = 3).

96
Figure 34. Relative abundance of miR-709 in an animal model of liver regeneration.
(A) Livers from normal animals and mice that underwent partial hepatectomy (24, 36 and
44 hours post-hepatectomy) were used to probe for miR-709 by Northern blotting using
an LNA probe. The ribosomal RNA 5s was used as loading control. (B) miR-709 bands
on blot were quantified by densitometry and results were normalized to 5s.

97
Figure 35. qPCR analysis of miR-709 and Rfx1 in an animal model of hepatocellular
carcinoma. LapMyc male (tumor and adjacent normal; n=5) and LapMyc female mouse
(n=2) livers (see legend of Figure 31 for details on genotype) were used to quantify
mature miR-709 by TaqMan assay (left). Rfx-1 mRNA was analyzed on the same
samples by qRT-PCR. *p<0.01 relative to normal male liver; #p<0.01 relative to normal
female liver.

98
C.4. miR-709 inhibition elicits cell death
Overall, the results suggested a role for miR-709 in cell proliferation. We
questioned what would be the impact of inhibiting miR-709 function in quiescent versus
actively dividing cells. The use of oligonucleotides complementary to the mature miRNA
sequence (antagomiR or anti-miRs) has been a useful tool to downregulate miRNA
activity and perform functional analysis. Thus, primary hepatocytes and Hepa1c1c cells
were transfected with miR-709 inhibitors.
Primary hepatocytes were transfected with 10, 17 and 25 nM miRIDIAN miR-709
hairpin inhibitor or a control miRNA Cel-239b (Dharmacon). Neither antagomiR was
toxic to cells, based on microscopic observation. Cells were harvested 24 hours later, and
total RNA was isolated for analysis of miR-709 targets. Interestingly, levels of Rab11b
and Ces1g barely increased even at the 25 nM dose (Figure 36). To confirm the data, a
second anti-miR-709 from a different company (Ambion) was tested. Cells were
transfected with 10 or 34 nM antagomiR, and RNA was isolated from cells 24 hours post-
transfection. Levels of miR-709 and snoRNA-202 (normalizer miRNA) were quantified
using TaqMan assays. Surprisingly, the mirVana miRNA inhibitor against miR-709
induced higher levels of miR-709 at a dose that was not toxic in cells that received the
equivalent amount of Cel-239b (Figure 36). Levels of targets followed a similar pattern to
those observed with the miRIDIAN inhibitor (data not shown). These data suggest that
miR-709 has an important role in normal hepatocyte function and it cannot be
downregulated.

99
Figure 36. miR-709, Rab11b, Ces1g and Rfx-1 expression in primary hepatocytes
transfected with anti-miR-709. Primary hepatocytes were transfected with 10, 17 or 25
nM of miRIDIAN miRNA inhibitor against miR-709 or control inhibitor, and harvested
24 hours post-transfection (n=2; error bars represent standard deviation). Real time RT-
PCR analysis of Rab11b, Ces1g and Rfx-1. Cyclophillin A was used as normalizer gene.
Primary hepatocytes were transfected with 10 or 34 nM of mirVana miRNA inhibitor
against miR-709 or control inhibitor, and harvested 24 hours later. Mature miR-709 was
quantified by TaqMan miRNA assay. Small nucleolar RNA 202 (snoRNA-202) was used
as normalizer.
We then analyzed the impact of inhibiting miR-709 in actively dividing cells.
Hepa1c1c cells were transfected with amounts of antagomiR that were not toxic: 25 and

100
50 nM. Cell viability was then tested over time using an LDH assay. Inhibition of miR-
709 in hepatoma cells resulted in reduced viable cells at 50 nM concentration 72 hours
post-transfection (Figure 37). As shown for quiescent cells, these data suggest that miR-
709 cannot be downregulated in actively dividing cells.

101
Figure 37. Cell viability assay in Hepa1c1c cells transfected with miR-709 inhibitor.
Hepa1c1c cells were transfected with 25 or 50 nM of mirVana miRNA inhibitor against
miR-709 or control inhibitor, and media was replaced 24 hours post-transfection. One-
hundred μl of media was collected 24, 48 and 72 hours post-transfection for LDH
analysis. (n=3; error bars represent standard deviation). NT, not transfected.
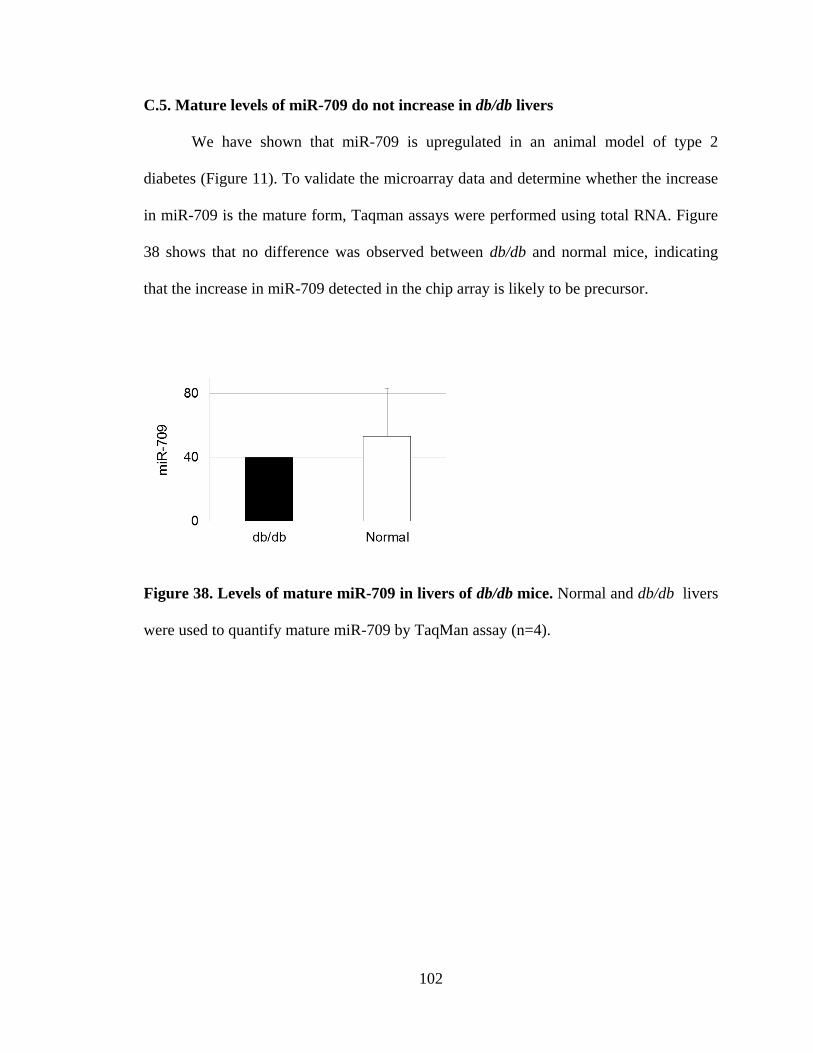
102
C.5. Mature levels of miR-709 do not increase in db/db livers
We have shown that miR-709 is upregulated in an animal model of type 2
diabetes (Figure 11). To validate the microarray data and determine whether the increase
in miR-709 is the mature form, Taqman assays were performed using total RNA. Figure
38 shows that no difference was observed between db/db and normal mice, indicating
that the increase in miR-709 detected in the chip array is likely to be precursor.
Figure 38. Levels of mature miR-709 in livers of db/db mice. Normal and db/db livers
were used to quantify mature miR-709 by TaqMan assay (n=4).
103
DISCUSSION
miRNAs play an important role in various cellular processes such as metabolism,
development and apoptosis154
. miRNAs are variably expressed across different tissues155
,
and the presence of abnormal profiles has been associated with various human
disorders154
. Despite emerging evidence of the role of miRNAs at regulating tissue
function, there is a scarcity of information on their role at controlling the complex
processes that take place in the liver. Therefore, we sought to identify miRNAs expressed
in this tissue. By miRNA profiling between normal and db/db mice, we found that miR-
709 was upregulated in livers of diabetic mice. This has been recently confirmed in
another study, in which many miRNAs were found dysregulated in type 2 diabetes156
. We
also observed that miR-709 was one of the most abundant miRNAs in murine liver, and
recent studies have also showed high abundance of miR-709 in this tissue97,145,157
.
However, the increase of miR-709 in db/db mice livers could not be validated by Taqman
PCR assay. This suggests that the increased miR-709 levels detected in db/db mice could
potentially be pre-miR-709, given that the chip assay detects both, precursor and mature
form, while the Taqman assay detects only mature miR-709. We have shown that the
levels of miR-709 precursor are highly abundant in liver. It has been shown that miR-709
has a function in the nucleus of fibroblasts, regulating levels of another miRNA (see next
page). Thus, it is possible that in hepatocytes, the precursor also has a role in this cellular
compartment, and the upregulation of miR-709 in db/db liver has implications for this
unknown function.

104
Given that miRNA are largely regulated by RNA polymerase II, we anticipated
that their levels would change to repress/derepress genes that are not required during the
physiological responses that take place between the fasted and refed conditions.
Remarkably, of all 61 miRNAs differentially expressed, all but one were downregulated
during the refed state, indicating that miRNA silence genes during fasting conditions, and
their role as inhibitors of gene expression is more important in this state than during
refeeding. Likewise, in the process of aging, it has been reported that hepatic miRNAs
increase, but none decreases97
. This phenomenon is also seen in aging-related Alzheimer
disease in human brains97
. Nevertheless, miR-709 was not influenced by the change in
hepatic nutritional/hormonal changes, suggesting it is not a critical miRNA for the
response that controls glucose, fatty acid and ketone body metabolism.
Post-transcriptionally, miRNAs are processed through multiple steps and
eventually form a linear miRNA:miRNA* duplex. Only one of these strands is selected to
be incorporated into RISC, based on the thermodynamic instability and weaker base-
pairing at the 5’ end of the strands158,159
. For some miRNAs, both strands can be loaded
into RISC. For miR-709, the 3p has been reported as the active strand (data from the
miRBase database). Our data confirms that this is also the case in liver, where the miR-
709-3p is the only strand used as guide.
Mammalian miRNAs can target multiple genes from various pathways160
. In
murine liver, miR-709 has been reported to increase with aging97
. Correlation of the
predicted targets with a proteome and transcriptome profile of aging liver suggested that

105
this miRNA impacts genes in cytoskeletal function97
. Thus, given the lack of knowledge
on validated targets of miR-709, and its high abundance in liver, we sought to find its
target genes. Our data indicates that miR-709 downregulates genes important in
cytoskeleton structure, endocytosis and cellular adhesion pathways, as well as lipid
metabolism. We confirmed that at least three of the identified genes, Rab11b, Ces1g and
Pctp, are direct targets of miR-709 and that the absence of miR-709 binding site/s in the
3’ UTR of these target genes leads to lack of inhibition. Downregulation of several
targets, including Rab11b, was confirmed at the protein level in murine liver cells and the
hepatoma cell line Hepa1c1c.
There has been a lot of disparity between the predicted targets of a miRNA across
various databases and the bona fide miRNA targets161
. Hence, we compared the results
from the microarray with the predicted targets of miR-709 across multiple databases to
evaluate the extent of overlap with observed gene targets. Of the 6 databases used, we
found that miRanda, miRWalk, DIANAmT and PICTAR5 had algorithms that best
predicted miR-709 targets, with 60-70% of gene predictions being identified by
microarray analysis. miRDB, TargetScan and RNA22 predicted less than 22% of the
genes that were found downregulated in the microarray analysis. Hence, using multiple
databases with good prediction score is a key to identifying miRNA targets.
In the three dimensional structure of the liver, hepatocytes must be polarized with
apical and basolateral membranes to be functional12
. The two domains are separated by
tight junctions8. Bile canaliculi are formed on the apical membrane of two adjacent

106
hepatocytes and bile acid transporters are confined to this area8,143
. Based on the
pathways targeted by miR-709, we hypothesized that this miRNA might regulate the
capacity of hepatocytes to polarize and form functional bile canaliculi. Our data suggests
that miR-709 does not affect the capacity of hepatocytes to maintain the apical-
basolateral polarity. Cells transfected with miR-709 and cultured in a sandwich culture
model were able to form bile canaliculi and transport sodium fluorescein in a similar
manner as Cel-239b-treated cells, implying that increased levels of mature miR-709 does
not compromise liver organization. In addition, miR-709 sandwich cultures had similar
survival times as Cel-239b-transfected cultures. Furthermore, primary hepatocytes
cultured in a monolayer and transfected with miR-709 did not have faster rates of cell
death over the course of 5 days relative to Cel-239b transfected hepatocytes (data not
shown). Thus, miR-709 regulates genes that in a quiescent tissue do not affect cell
survival or the capacity to maintain normal cellular architecture. Instead, our data
suggests that miR-709 may be needed to facilitate cellular detachment from the
extracellular matrix and cytoskeletal reorganization, processes that are needed after liver
injury and repopulation, or during tumorigenesis.
In fibroblasts, it was shown that miR-709 controls the maturation of miR-15a/16-
1145
. In humans, this miRNA cluster is most commonly found deleted in chronic
lymphocytic leukemia (CLL)162
. The miR-15a/16-1 cluster of miRNAs has been shown
to target the anti-apoptotic gene, Bcl-2145
as well as genes involved in cell cycle163
. Under
apoptotic stimuli, miR-709 changed its nuclear localization and was transported into the
cytoplasm in fibroblasts145
. This resulted in loss of inhibition of miR-15a/16-1 processing

107
and led to downregulation of Bcl-2145
. However, Bcl-2 is not expressed in murine
liver164,165
and therefore, it is unlikely that in this tissue miR-709 regulates apoptosis
through the same mechanism. Furthermore, miR-709 has been shown to control
expression of Brother Of the Regulator of Imprinted Sites (BORIS) in mouse testis166
.
BORIS is a testes-specific gene and an important regulator of DNA methylation and
imprinting, and regulates epigenetic reprogramming during differentiation of germ
cells167
. However, this gene is not expressed in liver167
. Thus, miR-709 may target
distinct genes in different tissues.
It has recently been reported that mature miR-709 is predominantly a nuclear
miRNA in various cell lines and tissues145
. The data were generated by analysis of RNA
from nuclear and cytoplasmic fractions, as well as by transfection of L929 fibroblasts
with a synthetic 5’-FAM-labeled miR-709 duplex probe145
. Tamminga and colleagues
have shown by in situ hybridization that miR-709 is predominantly located in the nucleus
in testis166
. Thus, we used a 3’-FAM-labeled synthetic miR-709 mimic to study the
cellular localization of the mature miR-709 in liver. Our data indicates that mature miR-
709 is localized only in the cytoplasm of primary hepatocytes and Hepa1c1c cells under
normal and metabolic stress culture conditions. It is possible that the location of mature
miR-709 is different depending on the tissue, and in fibroblasts it is more nuclear than
cytoplasmic. We have shown that in the liver, the precursor of miR-709 is significantly
more abundant than the mature form, opposite to what is typically observed for the
majority of miRNA. This has been reported to be the case across other mouse tissues,
including brain, spinal cord, and heart147
. The in situ hybridization study by Tamminga et

108
al.166
, is consistent with higher levels of precursor in the nucleus, as the probe is likely to
have detected the precursor and mature forms. The study showed the majority of the
signal was present in the nucleus. Interestingly, miR-709 is not the only miRNA
displaying this pattern: miR-690 and miR-720 also abundantly accumulate their
precursors, while the mature form is scarce. The biological significance of the large
accumulation of precursor, is currently unknown.
We have also shown that in mouse models of cancer and liver regeneration, the
levels of mature miR-709 increase significantly, suggesting a role in cell division.
Supporting these observations, inhibition of miR-709 in hepatoma cells, leads to
diminished cell survival. To determine the role of miR-709 in quiescent and actively
dividing cells, antagomiRs were used to deplete endogenous levels of miR-709.
Transfection of primary hepatocytes with antagomirs did not lead to a concomitant
upregulation of miR-709 targets Rab11b and Ces1g. Instead, we observed a dose
response increase in the expression of miR-709 as more antagomiR was used. This
suggests that miR-709 may have vital functions in the liver and cannot be inhibited in
hepatocytes, even though these cells seem to be able to tolerate a multiple-fold increase
of mature miR-709. In Hepa1c1c cells, depletion of miR-709 resulted in a decrease in cell
viability, which was not seen in primary hepatocytes at similar antagomiR concentration,
suggesting that appropriate levels of this miRNA may be more critical for proliferating
than quiescent cells.

109
The increase in miR-709 in liver tumors was accompanied by an increase in
transcription of its host gene, Rfx1. Rfx1 is a transcription factor with transcription
activation as well as repression activity. It is ubiquitously expressed, and is abundant in
liver, with expression levels similar to genes implicated in metabolic functions such as
insulin receptor substrate (Irs2), forkhead box protein O1 (Foxo1) or sirtuin 1 (Sirt1)
(data not shown). Lack of Rfx1 results in early embryonic lethality168
. Rfx1 inhibits its
own expression, as well as genes implicated in cell proliferation such as PCNA and c-
Myc151-153
. Although information on its function in liver is scarce, it has been recently
shown that Rfx1 binds to the promoters of silent genes, such as Cdx2, and inhibit their
activation by FoxA2. Cdx2 is a homeodomain transcription factor that determines
intestinal epithelium differentiation and its ectopic expression has been associated with
neoplastic processes. Indeed, Rfx1 downregulation is associated with esophageal
carcinoma169
. The same study showed that using siRNA to knockdown Rfx1, a maximum
of 50% silencing could be obtained in a mouse epithelial cell line. As the mRNA levels
were downregulated by the siRNA, Rfx1 gene transcription would increase169
. We have
observed that miR-709 downregulation with antagomiRs leads to an increase in miR-709
levels. Thus, miR-709 and Rfx1 seem to work in a coordinated manner, and depletion of
either one leads to feedback activation to compensate for the decrease in their levels.
Perhaps miR-709 accumulates in the nucleus to regulate expression of its own host gene.
Finally, it is possible that Rfx1 increases in our models of cell proliferation to inhibit
expression of epithelial non-hepatic genes and retain liver function.

110
MiR-709 is not a conserved miRNA; the human ortholog is hsa-miR-1827, and
shares the same seed sequence. Thus, an exciting study will be to determine whether the
pathways regulated by hsa-miR-1827 are the same as those regulated by miR-709. Many
of the predicted genes are the same or are within the same family. Thus, we predict that
the hsa-miR-1827 will have a similar role to mmu-miR-709. It will be interesting to
conduct studies in human samples and/or cell lines to establish its function in normal
liver, as well as pathological conditions.
In summary, miR-709 is most abundant in the pre-miR-709 form in the normal
liver and is processed further to mature miR-709 only under conditions requiring cell
division, such as cancer and liver regeneration. It is then that the mature miR-709 can
bind to targets such as Rab11b, Ces1g, Pctp and Timp3 and aid in cellular regeneration
perhaps by shutting down pathways that are not vital to the cell at that stage.

111
FUTURE DIRECTIONS
Our study identified miR-709 as one of the most abundant miRNAs in murine
liver and for the first time identified Rab11b, Ces1g and Pctp as direct targets. Recently,
miR-709 has been found upregulated by 3.6-fold in db/db mice, an animal model of type
2 diabetes mellitus156
, by ~7-fold in livers of aging mice97
, in X-ray irradiated mouse
testis166
, and during liver regeneration and hepatocellular carcinoma (this work). This
suggests a role for this miRNA in the response of liver to stress conditions. Future in vivo
studies are needed to address the physiological consequence of knocking down miR-709
in type 2 diabetes liver, aging liver and hepatocellular carcinoma to study its role in these
conditions. It is also intriguing that such high levels of precursor accumulate in the
nucleus, which suggests an additional role in this compartment. miR-709 is not a
conserved miRNA, and the ortholog miRNA in humans is hsa-mir-1827, which has the
same seed sequence. Given the role of miR-709 in hepatocellular carcinoma and its
potential role in liver regeneration, future studies should include characterizing its
function in normal human liver, as well as analyzing human carcinoma samples to
determine whether hsa-mir-1827 is dysregulated, and establishing its potential as a
therapeutic target.

112
LIST OF REFERENCES
1. Reinhart BJ, Slack FJ, Basson M, et al. The 21-nucleotide let-7 RNA regulates
developmental timing in Caenorhabditis elegans. Nature 2000;403:901-6.
2. Brennecke J, Hipfner DR, Stark A, Russell RB, Cohen SM. bantam encodes a
developmentally regulated microRNA that controls cell proliferation and regulates the
proapoptotic gene hid in Drosophila. Cell 2003;113:25-36.
3. Xu P, Vernooy SY, Guo M, Hay BA. The Drosophila microRNA Mir-14
suppresses cell death and is required for normal fat metabolism. Curr Biol 2003;13:790-5.
4. Chen CZ, Li L, Lodish HF, Bartel DP. MicroRNAs modulate hematopoietic
lineage differentiation. Science 2004;303:83-6.
5. Krutzfeldt J, Rajewsky N, Braich R, et al. Silencing of microRNAs in vivo with
'antagomirs'. Nature 2005;438:685-9.
6. Ambros V. Control of developmental timing in Caenorhabditis elegans. Curr Opin
Genet Dev 2000;10:428-33.
7. Lagos-Quintana M, Rauhut R, Yalcin A, Meyer J, Lendeckel W, Tuschl T.
Identification of tissue-specific microRNAs from mouse. Curr Biol 2002;12:735-9.
8. Treyer A, Musch A. Hepatocyte polarity. Compr Physiol 2013;3:243-87.
9. Boyer JL. Bile formation and secretion. Compr Physiol 2013;3:1035-78.
10. Jungermann K. Role of intralobular compartmentation in hepatic metabolism.
Diabete & metabolisme 1992;18:81-6.
11. Malarkey DE, Johnson K, Ryan L, Boorman G, Maronpot RR. New insights into
functional aspects of liver morphology. Toxicologic pathology 2005;33:27-34.

113
12. Dunn JC, Tompkins RG, Yarmush ML. Long-term in vitro function of adult
hepatocytes in a collagen sandwich configuration. Biotechnology progress 1991;7:237-
45.
13. Decaens C, Durand M, Grosse B, Cassio D. Which in vitro models could be best
used to study hepatocyte polarity? Biology of the cell / under the auspices of the
European Cell Biology Organization 2008;100:387-98.
14. Abu-Absi SF, Friend JR, Hansen LK, Hu WS. Structural polarity and functional
bile canaliculi in rat hepatocyte spheroids. Exp Cell Res 2002;274:56-67.
15. Watanabe N, Tsukada N, Smith CR, Phillips MJ. Motility of bile canaliculi in the
living animal: implications for bile flow. J Cell Biol 1991;113:1069-80.
16. Takahashi S, Kubo K, Waguri S, et al. Rab11 regulates exocytosis of recycling
vesicles at the plasma membrane. J Cell Sci 2012;125:4049-57.
17. Rahner C, Stieger B, Landmann L. Apical endocytosis in rat hepatocytes In situ
involves clathrin, traverses a subapical compartment, and leads to lysosomes.
Gastroenterology 2000;119:1692-707.
18. Enrich C, Pol A, Calvo M, Pons M, Jackle S. Dissection of the multifunctional
"Receptor-Recycling" endocytic compartment of hepatocytes. Hepatology 1999;30:1115-
20.
19. Saetrom P, Snove O, Nedland M, et al. Conserved microRNA characteristics in
mammals. Oligonucleotides 2006;16:115-44.
20. Jung HJ, Suh Y. MicroRNA in Aging: From Discovery to Biology. Current
genomics 2012;13:548-57.
21. Bentwich I, Avniel A, Karov Y, et al. Identification of hundreds of conserved and
nonconserved human microRNAs. Nat Genet 2005;37:766-70.
22. Friedman RC, Farh KK, Burge CB, Bartel DP. Most mammalian mRNAs are
conserved targets of microRNAs. Genome Res 2009;19:92-105.

114
23. Chekulaeva M, Filipowicz W. Mechanisms of miRNA-mediated post-
transcriptional regulation in animal cells. Curr Opin Cell Biol 2009;21:452-60.
24. Guo H, Ingolia NT, Weissman JS, Bartel DP. Mammalian microRNAs
predominantly act to decrease target mRNA levels. Nature 2010;466:835-40.
25. Behm-Ansmant I, Rehwinkel J, Doerks T, Stark A, Bork P, Izaurralde E. mRNA
degradation by miRNAs and GW182 requires both CCR4:NOT deadenylase and
DCP1:DCP2 decapping complexes. Genes Dev 2006;20:1885-98.
26. Borchert GM, Lanier W, Davidson BL. RNA polymerase III transcribes human
microRNAs. Nature structural & molecular biology 2006;13:1097-101.
27. Faller M, Guo F. MicroRNA biogenesis: there's more than one way to skin a cat.
Biochimica et biophysica acta 2008;1779:663-7.
28. Ceccarelli S, Panera N, Gnani D, Nobili V. Dual Role of MicroRNAs in NAFLD.
International journal of molecular sciences 2013;14:8437-55.
29. Cai X, Hagedorn CH, Cullen BR. Human microRNAs are processed from capped,
polyadenylated transcripts that can also function as mRNAs. Rna 2004;10:1957-66.
30. Filipowicz W, Bhattacharyya SN, Sonenberg N. Mechanisms of post-
transcriptional regulation by microRNAs: are the answers in sight? Nature reviews
Genetics 2008;9:102-14.
31. Bartel DP. MicroRNAs: genomics, biogenesis, mechanism, and function. Cell
2004;116:281-97.
32. Creighton CJ, Reid JG, Gunaratne PH. Expression profiling of microRNAs by
deep sequencing. Briefings in bioinformatics 2009;10:490-7.
33. Okamura K, Phillips MD, Tyler DM, Duan H, Chou YT, Lai EC. The regulatory
activity of microRNA* species has substantial influence on microRNA and 3' UTR
evolution. Nature structural & molecular biology 2008;15:354-63.
34. Ro S, Park C, Young D, Sanders KM, Yan W. Tissue-dependent paired
expression of miRNAs. Nucleic acids research 2007;35:5944-53.

115
35. Du T, Zamore PD. microPrimer: the biogenesis and function of microRNA.
Development 2005;132:4645-52.
36. Winter J, Jung S, Keller S, Gregory RI, Diederichs S. Many roads to maturity:
microRNA biogenesis pathways and their regulation. Nature cell biology 2009;11:228-
34.
37. Lynn FC. Meta-regulation: microRNA regulation of glucose and lipid
metabolism. Trends in endocrinology and metabolism: TEM 2009;20:452-9.
38. Mencia A, Modamio-Hoybjor S, Redshaw N, et al. Mutations in the seed region
of human miR-96 are responsible for nonsyndromic progressive hearing loss. Nat Genet
2009;41:609-13.
39. Hughes AE, Bradley DT, Campbell M, et al. Mutation altering the miR-184 seed
region causes familial keratoconus with cataract. American journal of human genetics
2011;89:628-33.
40. de Pontual L, Yao E, Callier P, et al. Germline deletion of the miR-17
approximately 92 cluster causes skeletal and growth defects in humans. Nat Genet
2011;43:1026-30.
41. Llave C, Xie Z, Kasschau KD, Carrington JC. Cleavage of Scarecrow-like mRNA
targets directed by a class of Arabidopsis miRNA. Science 2002;297:2053-6.
42. Yekta S, Shih IH, Bartel DP. MicroRNA-directed cleavage of HOXB8 mRNA.
Science 2004;304:594-6.
43. Huntzinger E, Izaurralde E. Gene silencing by microRNAs: contributions of
translational repression and mRNA decay. Nature reviews Genetics 2011;12:99-110.
44. Bhattacharyya SN, Habermacher R, Martine U, Closs EI, Filipowicz W. Relief of
microRNA-mediated translational repression in human cells subjected to stress. Cell
2006;125:1111-24.
45. Orom UA, Nielsen FC, Lund AH. MicroRNA-10a binds the 5'UTR of ribosomal
protein mRNAs and enhances their translation. Molecular cell 2008;30:460-71.

116
46. He A, Zhu L, Gupta N, Chang Y, Fang F. Overexpression of micro ribonucleic
acid 29, highly up-regulated in diabetic rats, leads to insulin resistance in 3T3-L1
adipocytes. Molecular endocrinology 2007;21:2785-94.
47. Kerr TA, Korenblat KM, Davidson NO. MicroRNAs and liver disease.
Translational research : the journal of laboratory and clinical medicine 2011;157:241-52.
48. Filipowicz W, Jaskiewicz L, Kolb FA, Pillai RS. Post-transcriptional gene
silencing by siRNAs and miRNAs. Current opinion in structural biology 2005;15:331-41.
49. Walker MD. Role of MicroRNA in pancreatic beta-cells: where more is less.
Diabetes 2008;57:2567-8.
50. Trajkovski M, Hausser J, Soutschek J, et al. MicroRNAs 103 and 107 regulate
insulin sensitivity. Nature 2011;474:649-53.
51. Zheng L, Lv GC, Sheng J, Yang YD. Effect of miRNA-10b in regulating cellular
steatosis level by targeting PPAR-alpha expression, a novel mechanism for the
pathogenesis of NAFLD. Journal of gastroenterology and hepatology 2010;25:156-63.
52. Hu J, Xu Y, Hao J, Wang S, Li C, Meng S. MiR-122 in hepatic function and liver
diseases. Protein & cell 2012;3:364-71.
53. Filipowicz W, Grosshans H. The liver-specific microRNA miR-122: biology and
therapeutic potential. Progress in drug research Fortschritte der Arzneimittelforschung
Progres des recherches pharmaceutiques 2011;67:221-38.
54. Girard M, Jacquemin E, Munnich A, Lyonnet S, Henrion-Caude A. miR-122, a
paradigm for the role of microRNAs in the liver. Journal of hepatology 2008;48:648-56.
55. Chang J, Nicolas E, Marks D, et al. miR-122, a mammalian liver-specific
microRNA, is processed from hcr mRNA and may downregulate the high affinity
cationic amino acid transporter CAT-1. RNA biology 2004;1:106-13.
56. Esau C, Davis S, Murray SF, et al. miR-122 regulation of lipid metabolism
revealed by in vivo antisense targeting. Cell metabolism 2006;3:87-98.

117
57. Callegari E, Elamin BK, Sabbioni S, Gramantieri L, Negrini M. Role of
microRNAs in hepatocellular carcinoma: a clinical perspective. OncoTargets and therapy
2013;6:1167-78.
58. Fan CG, Wang CM, Tian C, et al. miR-122 inhibits viral replication and cell
proliferation in hepatitis B virus-related hepatocellular carcinoma and targets NDRG3.
Oncology reports 2011;26:1281-6.
59. Hsu SH, Wang B, Kota J, et al. Essential metabolic, anti-inflammatory, and anti-
tumorigenic functions of miR-122 in liver. The Journal of clinical investigation
2012;122:2871-83.
60. Hoekstra M, van der Sluis RJ, Kuiper J, Van Berkel TJ. Nonalcoholic fatty liver
disease is associated with an altered hepatocyte microRNA profile in LDL receptor
knockout mice. The Journal of nutritional biochemistry 2012;23:622-8.
61. Najafi-Shoushtari SH, Kristo F, Li Y, et al. MicroRNA-33 and the SREBP host
genes cooperate to control cholesterol homeostasis. Science 2010;328:1566-9.
62. Hua X, Yokoyama C, Wu J, et al. SREBP-2, a second basic-helix-loop-helix-
leucine zipper protein that stimulates transcription by binding to a sterol regulatory
element. Proceedings of the National Academy of Sciences of the United States of
America 1993;90:11603-7.
63. Yokoyama C, Wang X, Briggs MR, et al. SREBP-1, a basic-helix-loop-helix-
leucine zipper protein that controls transcription of the low density lipoprotein receptor
gene. Cell 1993;75:187-97.
64. Horton JD, Goldstein JL, Brown MS. SREBPs: activators of the complete
program of cholesterol and fatty acid synthesis in the liver. The Journal of clinical
investigation 2002;109:1125-31.
65. Rayner KJ, Sheedy FJ, Esau CC, et al. Antagonism of miR-33 in mice promotes
reverse cholesterol transport and regression of atherosclerosis. The Journal of clinical
investigation 2011;121:2921-31.
66. Rayner KJ, Suarez Y, Davalos A, et al. MiR-33 contributes to the regulation of
cholesterol homeostasis. Science 2010;328:1570-3.

118
67. Davalos A, Goedeke L, Smibert P, et al. miR-33a/b contribute to the regulation of
fatty acid metabolism and insulin signaling. Proceedings of the National Academy of
Sciences of the United States of America 2011;108:9232-7.
68. Cheung O, Puri P, Eicken C, et al. Nonalcoholic steatohepatitis is associated with
altered hepatic MicroRNA expression. Hepatology 2008;48:1810-20.
69. Min HK, Kapoor A, Fuchs M, et al. Increased hepatic synthesis and dysregulation
of cholesterol metabolism is associated with the severity of nonalcoholic fatty liver
disease. Cell metabolism 2012;15:665-74.
70. Nakanishi N, Nakagawa Y, Tokushige N, et al. The up-regulation of microRNA-
335 is associated with lipid metabolism in liver and white adipose tissue of genetically
obese mice. Biochem Biophys Res Commun 2009;385:492-6.
71. Iliopoulos D, Drosatos K, Hiyama Y, Goldberg IJ, Zannis VI. MicroRNA-370
controls the expression of microRNA-122 and Cpt1alpha and affects lipid metabolism.
Journal of lipid research 2010;51:1513-23.
72. Ahn J, Lee H, Chung CH, Ha T. High fat diet induced downregulation of
microRNA-467b increased lipoprotein lipase in hepatic steatosis. Biochem Biophys Res
Commun 2011;414:664-9.
73. Kumar S, Zou Y, Bao Q, Wang M, Dai G. Proteomic analysis of immediate-early
response plasma proteins after 70% and 90% partial hepatectomy. Hepatology research :
the official journal of the Japan Society of Hepatology 2013;43:876-89.
74. Betel D, Wilson M, Gabow A, Marks DS, Sander C. The microRNA.org resource:
targets and expression. Nucleic acids research 2008;36:D149-53.
75. Park JS, Surendran S, Kamendulis LM, Morral N. Comparative nucleic acid
transfection efficacy in primary hepatocytes for gene silencing and functional studies.
BMC Res Notes 2011;4:8.
76. Kreamer BL, Staecker JL, Sawada N, Sattler GL, Hsia MT, Pitot HC. Use of a
low-speed, iso-density percoll centrifugation method to increase the viability of isolated
rat hepatocyte preparations. In vitro cellular & developmental biology : journal of the
Tissue Culture Association 1986;22:201-11.

119
77. Swift B, Pfeifer ND, Brouwer KL. Sandwich-cultured hepatocytes: an in vitro
model to evaluate hepatobiliary transporter-based drug interactions and hepatotoxicity.
Drug metabolism reviews 2010;42:446-71.
78. Schindelin J, Arganda-Carreras I, Frise E, et al. Fiji: an open-source platform for
biological-image analysis. Nat Methods 2012;9:676-82.
79. Wang X. miRDB: a microRNA target prediction and functional annotation
database with a wiki interface. Rna 2008;14:1012-7.
80. Wang X, El Naqa IM. Prediction of both conserved and nonconserved microRNA
targets in animals. Bioinformatics 2008;24:325-32.
81. Dweep H, Sticht C, Pandey P, Gretz N. miRWalk--database: prediction of
possible miRNA binding sites by "walking" the genes of three genomes. Journal of
biomedical informatics 2011;44:839-47.
82. Lewis BP, Burge CB, Bartel DP. Conserved seed pairing, often flanked by
adenosines, indicates that thousands of human genes are microRNA targets. Cell
2005;120:15-20.
83. Vlachos IS, Kostoulas N, Vergoulis T, et al. DIANA miRPath v.2.0: investigating
the combinatorial effect of microRNAs in pathways. Nucleic acids research
2012;40:W498-504.
84. Alexiou P, Vergoulis T, Gleditzsch M, et al. miRGen 2.0: a database of
microRNA genomic information and regulation. Nucleic acids research 2010;38:D137-
41.
85. Griffiths-Jones S. The microRNA Registry. Nucleic acids research
2004;32:D109-11.
86. Griffiths-Jones S, Grocock RJ, van Dongen S, Bateman A, Enright AJ. miRBase:
microRNA sequences, targets and gene nomenclature. Nucleic acids research
2006;34:D140-4.
87. Griffiths-Jones S, Saini HK, van Dongen S, Enright AJ. miRBase: tools for
microRNA genomics. Nucleic acids research 2008;36:D154-8.

120
88. Kozomara A, Griffiths-Jones S. miRBase: integrating microRNA annotation and
deep-sequencing data. Nucleic acids research 2011;39:D152-7.
89. Kozomara A, Griffiths-Jones S. miRBase: annotating high confidence
microRNAs using deep sequencing data. Nucleic acids research 2014;42:D68-73.
90. Meyers BC, Axtell MJ, Bartel B, et al. Criteria for annotation of plant
MicroRNAs. The Plant cell 2008;20:3186-90.
91. Ambros V, Bartel B, Bartel DP, et al. A uniform system for microRNA
annotation. Rna 2003;9:277-9.
92. Krek A, Grun D, Poy MN, et al. Combinatorial microRNA target predictions. Nat
Genet 2005;37:495-500.
93. Miranda KC, Huynh T, Tay Y, et al. A pattern-based method for the identification
of MicroRNA binding sites and their corresponding heteroduplexes. Cell 2006;126:1203-
17.
94. Kim SW, Li Z, Moore PS, et al. A sensitive non-radioactive northern blot method
to detect small RNAs. Nucleic acids research 2010;38:e98.
95. Takata A, Otsuka M, Yoshikawa T, Kishikawa T, Ohno M, Koike K. MicroRNAs
and liver function. Minerva gastroenterologica e dietologica 2013;59:187-203.
96. Sekine S, Ogawa R, Ito R, et al. Disruption of Dicer1 induces dysregulated fetal
gene expression and promotes hepatocarcinogenesis. Gastroenterology 2009;136:2304-15
e1-4.
97. Maes OC, An J, Sarojini H, Wang E. Murine microRNAs implicated in liver
functions and aging process. Mechanisms of ageing and development 2008;129:534-41.
98. Mullokandov G, Baccarini A, Ruzo A, et al. High-throughput assessment of
microRNA activity and function using microRNA sensor and decoy libraries. Nat
Methods 2012;9:840-6.

121
99. Zhang F, Xu X, Zhou B, He Z, Zhai Q. Gene expression profile change and
associated physiological and pathological effects in mouse liver induced by fasting and
refeeding. PloS one 2011;6:e27553.
100. Desert C, Duclos MJ, Blavy P, et al. Transcriptome profiling of the feeding-to-
fasting transition in chicken liver. BMC genomics 2008;9:611.
101. Zhou L, He J, Zhang Y. MicroRNA-22 expression in hepatocellular carcinoma
and its correlation with ezrin protein. The Journal of international medical research
2013;41:1009-16.
102. Shi C, Xu X. MicroRNA-22 is down-regulated in hepatitis B virus-related
hepatocellular carcinoma. Biomedicine & pharmacotherapy = Biomedecine &
pharmacotherapie 2013;67:375-80.
103. Zhang J, Yang Y, Yang T, et al. microRNA-22, downregulated in hepatocellular
carcinoma and correlated with prognosis, suppresses cell proliferation and
tumourigenicity. British journal of cancer 2010;103:1215-20.
104. Li LH, Gao Q, Wang XY, Guo ZJ. [miR-378 suppresses HBV-related
hepatocellular carcinoma tumor growth by directly targeting the insulin-like growth
factor 1 receptor]. Zhonghua gan zang bing za zhi = Zhonghua ganzangbing zazhi =
Chinese journal of hepatology 2013;21:609-13.
105. Chen DL, Wang ZQ, Zeng ZL, et al. Identification of MicroRNA-214 as a
negative regulator of colorectal cancer liver metastasis by way of regulation of fibroblast
growth factor receptor 1 expression. Hepatology 2014.
106. Zhang J, Jin H, Liu H, et al. MiRNA-99a directly regulates AGO2 through
translational repression in hepatocellular carcinoma. Oncogenesis 2014;3:e97.
107. Ding J, Huang S, Wang Y, et al. Genome-wide screening reveals that miR-195
targets the TNF-alpha/NF-kappaB pathway by down-regulating IkappaB kinase alpha
and TAB3 in hepatocellular carcinoma. Hepatology 2013;58:654-66.
108. Chen Z, Ma T, Huang C, et al. MiR-27a modulates the MDR1/P-glycoprotein
expression by inhibiting FZD7/beta-catenin pathway in hepatocellular carcinoma cells.
Cellular signalling 2013;25:2693-701.

122
109. Henry JC, Park JK, Jiang J, et al. miR-199a-3p targets CD44 and reduces
proliferation of CD44 positive hepatocellular carcinoma cell lines. Biochem Biophys Res
Commun 2010;403:120-5.
110. Ji J, Zhao L, Budhu A, et al. Let-7g targets collagen type I alpha2 and inhibits cell
migration in hepatocellular carcinoma. Journal of hepatology 2010;52:690-7.
111. Gong FX, Xia JL, Yang BW, Xu XJ, Wu WZ. [Effect of let-7c on the
proliferation of human hepatocellular carcinoma cell HCCLM3]. Zhonghua gan zang
bing za zhi = Zhonghua ganzangbing zazhi = Chinese journal of hepatology
2011;19:853-6.
112. Gramantieri L, Ferracin M, Fornari F, et al. Cyclin G1 is a target of miR-122a, a
microRNA frequently down-regulated in human hepatocellular carcinoma. Cancer
research 2007;67:6092-9.
113. Brockhausen J, Tay SS, Grzelak CA, et al. miR-181a mediates TGF-beta-induced
hepatocyte EMT and is dysregulated in cirrhosis and hepatocellular cancer. Liver
international : official journal of the International Association for the Study of the Liver
2014.
114. Duan X, Hu J, Wang Y, Gao J, Peng D, Xia L. MicroRNA-145: a promising
biomarker for hepatocellular carcinoma (HCC). Gene 2014;541:67-8.
115. Heo MJ, Kim YM, Koo JH, et al. microRNA-148a dysregulation discriminates
poor prognosis of hepatocellular carcinoma in association with USP4 overexpression.
Oncotarget 2014;5:2792-806.
116. Dang YW, Chen G, Liao Y, Wang L. [Expression of miR-191 and miR-221 in
hepatocellular carcinoma and its clinical significance]. Zhonghua bing li xue za zhi
Chinese journal of pathology 2013;42:397-8.
117. Giray BG, Emekdas G, Tezcan S, et al. Profiles of serum microRNAs; miR-125b-
5p and miR223-3p serve as novel biomarkers for HBV-positive hepatocellular
carcinoma. Molecular biology reports 2014.
118. Yang H, Zheng W, Zhao W, Guan C, An J. [Roles of miR-590-5p and miR-590-
3p in the development of hepatocellular carcinoma]. Nan fang yi ke da xue xue bao =
Journal of Southern Medical University 2013;33:804-11.

123
119. Li L, Guo Z, Wang J, Mao Y, Gao Q. Serum miR-18a: a potential marker for
hepatitis B virus-related hepatocellular carcinoma screening. Digestive diseases and
sciences 2012;57:2910-6.
120. Xu D, He XX, Chang Y, Sun SZ, Xu CR, Lin JS. Downregulation of MiR-93
expression reduces cell proliferation and clonogenicity of HepG2 cells. Hepato-
gastroenterology 2012;59:2367-73.
121. Li Y, Tan W, Neo TW, et al. Role of the miR-106b-25 microRNA cluster in
hepatocellular carcinoma. Cancer science 2009;100:1234-42.
122. Yuan B, Dong R, Shi D, et al. Down-regulation of miR-23b may contribute to
activation of the TGF-beta1/Smad3 signalling pathway during the termination stage of
liver regeneration. FEBS letters 2011;585:927-34.
123. Salvi A, Sabelli C, Moncini S, et al. MicroRNA-23b mediates urokinase and c-
met downmodulation and a decreased migration of human hepatocellular carcinoma cells.
The FEBS journal 2009;276:2966-82.
124. Roderburg C, Mollnow T, Bongaerts B, et al. Micro-RNA profiling in human
serum reveals compartment-specific roles of miR-571 and miR-652 in liver cirrhosis.
PloS one 2012;7:e32999.
125. Lee CG, Kim YW, Kim EH, et al. Farnesoid X receptor protects hepatocytes from
injury by repressing miR-199a-3p, which increases levels of LKB1. Gastroenterology
2012;142:1206-17 e7.
126. Li W, Wang J, Chen QD, et al. Insulin promotes glucose consumption via
regulation of miR-99a/mTOR/PKM2 pathway. PloS one 2013;8:e64924.
127. Wen F, Yang Y, Jin D, Sun J, Yu X, Yang Z. MiRNA-145 is involved in the
development of resistin-induced insulin resistance in HepG2 cells. Biochem Biophys Res
Commun 2014;445:517-23.
128. Jordan SD, Kruger M, Willmes DM, et al. Obesity-induced overexpression of
miRNA-143 inhibits insulin-stimulated AKT activation and impairs glucose metabolism.
Nature cell biology 2011;13:434-46.

124
129. Huang da W, Sherman BT, Lempicki RA. Bioinformatics enrichment tools: paths
toward the comprehensive functional analysis of large gene lists. Nucleic acids research
2009;37:1-13.
130. Huang da W, Sherman BT, Lempicki RA. Systematic and integrative analysis of
large gene lists using DAVID bioinformatics resources. Nature protocols 2009;4:44-57.
131. Horgan CP, Hanscom SR, Jolly RS, Futter CE, McCaffrey MW. Rab11-FIP3
links the Rab11 GTPase and cytoplasmic dynein to mediate transport to the endosomal-
recycling compartment. J Cell Sci 2010;123:181-91.
132. Lapierre LA, Dorn MC, Zimmerman CF, Navarre J, Burnette JO, Goldenring JR.
Rab11b resides in a vesicular compartment distinct from Rab11a in parietal cells and
other epithelial cells. Exp Cell Res 2003;290:322-31.
133. Butterworth MB, Edinger RS, Silvis MR, et al. Rab11b regulates the trafficking
and recycling of the epithelial sodium channel (ENaC). American journal of physiology
Renal physiology 2012;302:F581-90.
134. Casanova JE, Wang X, Kumar R, et al. Association of Rab25 and Rab11a with
the apical recycling system of polarized Madin-Darby canine kidney cells. Mol Biol Cell
1999;10:47-61.
135. Chen W, Feng Y, Chen D, Wandinger-Ness A. Rab11 is required for trans-golgi
network-to-plasma membrane transport and a preferential target for GDP dissociation
inhibitor. Mol Biol Cell 1998;9:3241-57.
136. Sugawara K, Shibasaki T, Mizoguchi A, Saito T, Seino S. Rab11 and its effector
Rip11 participate in regulation of insulin granule exocytosis. Genes to cells : devoted to
molecular & cellular mechanisms 2009;14:445-56.
137. Horgan CP, Hanscom SR, Jolly RS, Futter CE, McCaffrey MW. Rab11-FIP3
binds dynein light intermediate chain 2 and its overexpression fragments the Golgi
complex. Biochem Biophys Res Commun 2010;394:387-92.
138. Burkhardt JK. The role of microtubule-based motor proteins in maintaining the
structure and function of the Golgi complex. Biochimica et biophysica acta
1998;1404:113-26.

125
139. Burkhardt JK, Echeverri CJ, Nilsson T, Vallee RB. Overexpression of the
dynamitin (p50) subunit of the dynactin complex disrupts dynein-dependent maintenance
of membrane organelle distribution. J Cell Biol 1997;139:469-84.
140. Harada A, Takei Y, Kanai Y, Tanaka Y, Nonaka S, Hirokawa N. Golgi
vesiculation and lysosome dispersion in cells lacking cytoplasmic dynein. J Cell Biol
1998;141:51-9.
141. Palmer KJ, Hughes H, Stephens DJ. Specificity of cytoplasmic dynein subunits in
discrete membrane-trafficking steps. Mol Biol Cell 2009;20:2885-99.
142. Traer CJ, Rutherford AC, Palmer KJ, et al. SNX4 coordinates endosomal sorting
of TfnR with dynein-mediated transport into the endocytic recycling compartment.
Nature cell biology 2007;9:1370-80.
143. Marion TL, Perry CH, St Claire RL, 3rd, Brouwer KL. Endogenous bile acid
disposition in rat and human sandwich-cultured hepatocytes. Toxicology and applied
pharmacology 2012;261:1-9.
144. Shibukawa A, Sawada T, Nakao C, Izumi T, Nakagawa T. High-performance
frontal analysis for the study of protein binding of troglitazone (CS-045) in albumin
solution and in human plasma. Journal of chromatography A 1995;697:337-43.
145. Tang R, Li L, Zhu D, et al. Mouse miRNA-709 directly regulates miRNA-15a/16-
1 biogenesis at the posttranscriptional level in the nucleus: evidence for a microRNA
hierarchy system. Cell research 2012;22:504-15.
146. Earnshaw WC, Martins LM, Kaufmann SH. Mammalian caspases: structure,
activation, substrates, and functions during apoptosis. Annual review of biochemistry
1999;68:383-424.
147. Tang X, Gal J, Zhuang X, Wang W, Zhu H, Tang G. A simple array platform for
microRNA analysis and its application in mouse tissues. Rna 2007;13:1803-22.
148. Zou Y, Bao Q, Kumar S, Hu M, Wang GY, Dai G. Four waves of hepatocyte
proliferation linked with three waves of hepatic fat accumulation during partial
hepatectomy-induced liver regeneration. PloS one 2012;7:e30675.

126
149. Bail S, Swerdel M, Liu H, et al. Differential regulation of microRNA stability.
Rna 2010;16:1032-9.
150. Ruegger S, Grosshans H. MicroRNA turnover: when, how, and why. Trends in
biochemical sciences 2012;37:436-46.
151. Chen L, Smith L, Johnson MR, Wang K, Diasio RB, Smith JB. Activation of
protein kinase C induces nuclear translocation of RFX1 and down-regulates c-myc via an
intron 1 X box in undifferentiated leukemia HL-60 cells. The Journal of biological
chemistry 2000;275:32227-33.
152. Liu M, Lee BH, Mathews MB. Involvement of RFX1 protein in the regulation of
the human proliferating cell nuclear antigen promoter. The Journal of biological
chemistry 1999;274:15433-9.
153. Lubelsky Y, Reuven N, Shaul Y. Autorepression of rfx1 gene expression:
functional conservation from yeast to humans in response to DNA replication arrest.
Molecular and cellular biology 2005;25:10665-73.
154. Ha TY. MicroRNAs in Human Diseases: From Lung, Liver and Kidney Diseases
to Infectious Disease, Sickle Cell Disease and Endometrium Disease. Immune Netw
2011;11:309-23.
155. Miyoshi K, Miyoshi T, Siomi H. Many ways to generate microRNA-like small
RNAs: non-canonical pathways for microRNA production. Mol Genet Genomics
2010;284:95-103.
156. Kornfeld JW, Baitzel C, Konner AC, et al. Obesity-induced overexpression of
miR-802 impairs glucose metabolism through silencing of Hnf1b. Nature 2013;494:111-
5.
157. Zhang J, Zhang F, Didelot X, et al. Maternal high fat diet during pregnancy and
lactation alters hepatic expression of insulin like growth factor-2 and key microRNAs in
the adult offspring. BMC genomics 2009;10:478.
158. Schwarz DS, Hutvagner G, Du T, Xu Z, Aronin N, Zamore PD. Asymmetry in the
assembly of the RNAi enzyme complex. Cell 2003;115:199-208.

127
159. Khvorova A, Reynolds A, Jayasena SD. Functional siRNAs and miRNAs exhibit
strand bias. Cell 2003;115:209-16.
160. Lewis BP, Shih IH, Jones-Rhoades MW, Bartel DP, Burge CB. Prediction of
mammalian microRNA targets. Cell 2003;115:787-98.
161. Gennarino VA, Sardiello M, Avellino R, et al. MicroRNA target prediction by
expression analysis of host genes. Genome Res 2009;19:481-90.
162. Calin GA, Dumitru CD, Shimizu M, et al. Frequent deletions and down-
regulation of micro- RNA genes miR15 and miR16 at 13q14 in chronic lymphocytic
leukemia. Proceedings of the National Academy of Sciences of the United States of
America 2002;99:15524-9.
163. Klein U, Lia M, Crespo M, et al. The DLEU2/miR-15a/16-1 cluster controls B
cell proliferation and its deletion leads to chronic lymphocytic leukemia. Cancer cell
2010;17:28-40.
164. de la Coste A, Fabre M, McDonell N, et al. Differential protective effects of Bcl-
xL and Bcl-2 on apoptotic liver injury in transgenic mice. The American journal of
physiology 1999;277:G702-8.
165. Hockenbery DM, Zutter M, Hickey W, Nahm M, Korsmeyer SJ. BCL2 protein is
topographically restricted in tissues characterized by apoptotic cell death. Proceedings of
the National Academy of Sciences of the United States of America 1991;88:6961-5.
166. Tamminga J, Kathiria P, Koturbash I, Kovalchuk O. DNA damage-induced
upregulation of miR-709 in the germline downregulates BORIS to counteract aberrant
DNA hypomethylation. Cell cycle 2008;7:3731-6.
167. Loukinov DI, Pugacheva E, Vatolin S, et al. BORIS, a novel male germ-line-
specific protein associated with epigenetic reprogramming events, shares the same 11-
zinc-finger domain with CTCF, the insulator protein involved in reading imprinting
marks in the soma. Proceedings of the National Academy of Sciences of the United
States of America 2002;99:6806-11.
168. Feng C, Xu W, Zuo Z. Knockout of the regulatory factor X1 gene leads to early
embryonic lethality. Biochem Biophys Res Commun 2009;386:715-7.

128
169. Watts JA, Zhang C, Klein-Szanto AJ, et al. Study of FoxA pioneer factor at silent
genes reveals Rfx-repressed enhancer at Cdx2 and a potential indicator of esophageal
adenocarcinoma development. PLoS genetics 2011;7:e1002277.

CURRICULUM VITAE
Sneha Surendran
EDUCATION
2008-2014 Indiana University, Indianapolis, IN, USA
Ph.D. Medical and Molecular Genetics w/ Minor in Diabetes
Dissertation: Role of microRNA-709 in murine liver
Advisor: Núria Morral, PhD
2005-2007 University of Mumbai, Mumbai, India
M.Sc. Bioanalytical Sciences
2002-2005 University of Mumbai, Mumbai, India
B.Sc. Biochemistry and Zoology
HONORS AND AWARDS
2005 S.I.E.S College of Arts, Science & Commerce, affiliated to the University of
Mumbai 3rd
place in B.Sc. Biochemistry and Zoology examinations
2007 University of Mumbai 5th
place in M.Sc. Bioanalytical Sciences examinations
2008 Indiana University, School of Medicine Fellowship (Travel grant)
2011 Sigma Xi Graduate Research Competition (Third place)
GRANTS AND FELLOWSHIPS
2010-2012 Diabetes & Obesity DeVault Pre-doctoral Fellowship
2012-2014 American Heart Association Pre-doctoral Fellowship

PROFESSIONAL ACTIVITIES
06/12 Member of Sigma Xi through the Indiana University Medical Center Sigma Xi
chapter
01/11 Member of AAAS (American Association for the Advancement of Science)
through the Science Program for Excellence in Science
ABSTRACTS AND PRESENTATIONS
1. “Study of role of microRNAs in metabolism and type-2 diabetes”. Department of
Medical and Molecular Genetics poster session, 2010.
2. “Study of role of microRNAs in liver metabolism and type-2 diabetes”. Department of
Medical and Molecular Genetics Research Club, 2011.
3. “Role of microRNA-709 in hepatic insulin resistance”. Department of Medical and
Molecular Genetics poster session, 2011.
4. “Study of role of miR-709 in hepatic insulin resistance”. Sigma Xi research
competition, 2011.
5. “Role of microRNA-709 on hepatic metabolism”. Department of Medical and
Molecular Genetics poster session, 2012.
6. “Differential expression of microRNAs under different hepatic nutritional status”.
Department of Medical and Molecular Genetics poster session, 2013.
7. “Differential expression of microRNAs under different hepatic nutritional status” at
Metabolism Signaling & Disease: From cell to organism, Cold Spring Harbor
Laboratory, New York, 2013.

PUBLICATIONS
1. Park, JS., Surendran, S., Kamendulis, LM., Morral, N. Comparative nucleic acid
transfection efficacy in primary hepatocytes for gene silencing and functional studies.
BMC Research Notes 4:8 (2011).
2. Ahn, M., Gamble, A., Witting, SR., Magrisso, J., Surendran, S., Obici, S.,
Morral, N. Vector and helper genome rearrangements occur during production of helper-
dependent adenoviral vectors. Human Gene Therapy Methods 24:1-10 (2013).
3. Ruiz, R., Jideonwo, V., Ahn, M., Surendran, S., Hou, Y.,Tagliabracci, VS.,
Kerner, J., Gamble, A., Irimia-Dominguez, JM., Puchowicz, MA., DePaoli-Roach, A.,
Hoppel, C., Roach, P., Morral, N. Silencing Sterol Regulatory Element Binding Protein-1
In Mouse Liver Dissociates Hepatic Steatosis From Insulin Resistance. Journal of
Biological Chemistry 289(9):5510-7 (2014).
4. Surendran, S., Jideonwo, V., Merchun, C., Ahn, M., Murray, J., Ryan, J., Dunn,
K., Dai, G., Kota J., and Morral, N. miR-709 targets cystokeleton organization genes in
mouse liver and is up-regulated in proliferative states. Submitted.
5. Surendran, S., Goswami, C., Truitt, B., Lui, Y. and Morral, N. Differential
expression of microRNAs under different hepatic nutritional statuses. In preparation.
6. Surendran, S. and Morral, N. Role of microRNAs in Diabetes. In preparation.
RESEARCH AND TRAINING EXPERIENCE
2009 Molecular Biology workshop; Indiana University, School of Medicine.

2008-2009 Indiana University School of Medicine, Department of Medical and
Molecular Genetics. Research rotations (Mentors: Nuria Morral, Ph.D.,
Elliot Rosen, Ph.D. and David Gilley, Ph.D.).
2008 Observer in the Genetics laboratory of the Dept. of Assisted
Reproduction and Genetics, Jaslok Hospital & Research Centre, Mumbai,
India.
2006 Trained in ‘Chromatography and Spectroscopy’; Perkin Elmer Technical
Center.
2006 Training in Microbiology, Chemical and Analytical Section, Quality
Assurance Department, Johnson & Johnson Limited.
2006-2007 Trained in Animal Testing Centre (CPCSEA Approved), Ramnarain Ruia
College, Mumbai.
• Pharmacokinetic study of different formulations on rabbits.
• Anti-diabetic study on rats using Streptozotocin model.
• Anti-diabetic study on rats using Alloxan model.
• Efficacy study of oils for hair growth on rats.
• Anti-estrogenic activity of spice extracts on Albino Wistar rats.
• Acute toxicity studies on lice (LD50).
• Draize Skin irritancy study of formulation on Rabbits.
• Toxicity studies on rats and mice.
• Learned techniques like Retro-Orbital of rat; cervical dislocation;
intra-venous and intra-peritoneal mode of injection on rats; oral

dosing of rats, mice and rabbits; withdrawal of blood from rats and
rabbits; Cardiac puncture of rats and mice; etc.