role of human resource management approaches in … results indicated that the impact of hrm...
TRANSCRIPT
International Journal of Management Studies ISSN(Print) 2249-0302 ISSN (Online)2231-2528 http://www.researchersworld.com/ijms/
Vol.–V, Issue –2(4), April 2018 [103]
DOI : 10.18843/ijms/v5i2(4)/12
DOI URL :http://dx.doi.org/10.18843/ijms/v5i2(4)/12
Role of Human Resource Management Approaches in
Life Insurance Corporation, Arunachal Pradesh
Mr. Maw Sorum,
Research Scholar,
Department of Humanities and Social
Sciences, North Eastern Regional Institute of
Science and Technology, Deemed University,
Arunachal Pradesh, India.
Dr. Shyamalee Sinha,
Associate Professor,
Department of Humanities and Social
Sciences, North Eastern Regional Institute of
Science and Technology, Deemed University,
Arunachal Pradesh, India.
ABSTRACT
In order to establish the purpose of study which intends to show the impact of HRM approaches on
Life Insurance Corporation’s (LIC)performance, the researcher used multivariate analysis.
Multivariate analysis is known as a statistical process of simultaneously solving one or more
independent variables with more than one or multiple dependent variables and not only to
compare the difference among the multiple dependent variables in establishing causality with the
predictor variables. In the present study, the independent variables comprised of HRMapproaches
in terms of Alignment, Retention Strategies, Recruitment & Selection, Training & Development,
Compensation & Benefit, Performance Appraisal, Internal Communication, Career Planning, and
Job Design whereas the dependent variable comprised of measures of Life Insurance
Corporation’s (LIC)performance in terms of Rate of Productivity, Quality of services/products,
Customer Service and Sales Growth. The results of following null hypothesis will be analysed with
the findings of multivariate analysis.The study used multivariate analysis for the given objective of
the study. The results indicated that the impact of HRM approaches on Life Insurance Corporation
was significant. Given the above variables, the multiyear project designs and rollouts to fast
design strategy under the alignment approach of HRM approaches significantly influences Life
Insurance Corporation’s sales growth.
Keywords: Human Resource Management, Life Insurance Corporation, Arunachal Pradesh,
Performance indicators, Multivariate Analysis.
INTRODUCTION:
Human Resource Managementis one of the top topics since the last few decades. One of the most interesting
factors of the last two decades has been that the organizations across a large part of the world have changed
their pattern of working and management. The impact of globalization in this case cannot be minimalized. The
impact of the way that the new way of working opened was that the employers or companies had the
opportunity to acquire and become acquired by foreign companies; work along foreign companies and be
settled across country borders and in different regions as well(Irina, 2011). This not only opened the
opportunities for the companies, but the people working in them were able to take advantage of the increased
opportunities present. HR teams faced challenges with the retaining of employees in their present job because
they always could find better and more attractive packages. Today HRM is used as a tool to ensure that the
employees are provided the needed opportunities and benefits to attract and retain them. The essence of HRM is
that the concept of HRM embodies not only hiring and retaining employees but an overall approach to an
employee’s daily experiences and interactions within the organization(Collings, 2009). Presently the HRM
includes the maintaining of hiring processes, disciplinary actions required, handling payroll, quality
International Journal of Management Studies ISSN(Print) 2249-0302 ISSN (Online)2231-2528 http://www.researchersworld.com/ijms/
Vol.–V, Issue –2(4), April 2018 [104]
maintenance as well as handling the exit processes. The idea of the HRM is that the dual intentions of both the
employee and the employer can be realized by a strategic partnership. It is a proactive response and thus
requires a simple process to ensure that the procedures of the HRM can benefit and reach all and equally.
HRM over the years have modified its approach as per the dynamic changes in the business environment to
ensure stability in organisation’s overall performance (Byremo, 2015). The needs today is not only just hiring or
mediating employee salary and payroll. Today the HRM handles the whole alignment process. They align
employees and their goals with the growth plan of the company and ensure that employees can themselves have
professional growth opportunities(Gruman, 2011). The recruitment process today is also different than the
previous method. Then there is the selection process, the development of the employee from induction phase till
training and actual working. The HRM also investigates the amount of compensation provided to the
employees, the benefits for employees, the appraisals, performance assessment and communication internally.
While we talk about internal communication it would mean the way that the company communicates its
requirements, expectations and also communicated problems and comes to solutions with employees
HRM impacts the health of any company and especially in the Life Insurance Corporation it is required that the
employees can get the right benefits. The employees of the Life Insurance Corporations require to have
constant motivation to perform their best and to ensure that they bring in business owing to the significant
competition with the private sector companies and also their counterparts in other states(Little, 2011). The need
for constant motivation and the increasing number of companies in the field ensure that the employees always
have great offers around and are looking for the best opportunities for them. So, the HRM approaches need to
ensure that they make all the efforts to ensure that they use the Standard Operating Process and Procedures that
ensure that the organization functions properly and can maintain the expectation of the employees.
AIM OF THE STUDY:
This study aims to investigate the role of human resource management approaches in maintaining the
performance of Life Insurance Corporation of Arunachal Pradesh.
LITERATURE REVIEW:
About Life Insurance Corporation:
Nationalised in 1956, Life Insurance Corporation of India dominates the Indian market as the sole government
undertaking organisation in providing insurance products and services. Its variegated products ranges from
different life insurance schemes for individuals as well as groups like employers, societies and associations,
pensions, micro-insurance plans, social security schemes as well as health plans, to name a few(LIC, 2018).
Headquartered in Mumbai, the organisation has branches across 29 Indian states, amongst whom, Arunachal
Pradesh represents the eastern zone inspiring the researcher to investigate the performance of the organisation,
considering its human resource management approaches. In the state, the LIC has 9 offices of various purposes
namely– branch offices, satellite offices and mini offices in cities of Papum Pare, East Siang, Upper Subansiri,
Tezu and capital city of Itanagar(LIC, 2018).
One of the major objective of the LIC is to innovate and adopt to the continuous changing needs of the society
and to involve all of its workforce to guarantee competent and considerate services to its customers. It is here
that its HRM approaches holds prominence in ensuring efficient performance with the changing dynamics of
the society(Kumar, 2012). The LIC is witnessed to impart adequate training aimed to upgrade skills and
knowledge of its employees as well as preparing them for alternate growth of the organisation, as part of its
HRD approach. Training is imparted through zonal centers wherein experienced personnel training the
employees based on contemporary market dynamics. Other than these, external centres through collaboration
with established institutes such as, IIM Lucknow, MDI Gurgaon and IIST Pune, to name a few. Besides
training, there are promotion policies based on their overall professional attitude and performance(Purohit,
2013). However, there are negligible studies showing the role of these HRM policies on the overall performance
of the LIC in Arunachal Pradesh. Also, the various approaches of HRM with respect to alignment, retention
strategies, recruitment & selection, training & development, compensation & benefit, performance appraisal,
internal communication, career planning, and job design and performance of the LIC in terms of Rate of
Productivity, Quality of services/products, Customer Service and Sales Growth are also lagging, making this
study imperative to bring into light the position of the LIC in the eastern zone of India. Following the
imperativeness, the following section deals extensively of the various HRM approaches considered to
investigate the impact on performance in the study.
International Journal of Management Studies ISSN(Print) 2249-0302 ISSN (Online)2231-2528 http://www.researchersworld.com/ijms/
Vol.–V, Issue –2(4), April 2018 [105]
Human Resource Approaches: Understanding the processes and changes over the years:
There is a need to ensure that people can provide better services for their counterparts (Jahanshahi, et al., 2011).
The advantages of a better systematic and competitive strategy for HRM ensures that the company can ensure
that it stays a step ahead of the competition. This is found through a change in how people are managed within
the organization. Further itemphasises on the use of pay as a pointer to ensure that the organisationscan retain
employees. Surely the compensation provides all employees a reason to ensure that they check out new
opportunities, but not all employees put impetus on compensation as a measure of growth. It is here that the
HRM provides the tools to ensure that the employees find something unique in their company, they ensure
better results and that they become aware of how the company has ensured a better face value. The first thing
that ensures that a company is better seen as a good employer is first the different security as well as the care
towards the family and personal life of the employee. The employers who have the most satisfied employees
often include the option for employee’s health and other benefits which ensure that the employees feel that they
are being taken care of. An employee spends a good deal of their daily hours in the office, so it is a good idea
for the employers to provide high wages, better incentives and monetary as well as non-monetary benefits
(Zuffo, 2011). There are often many people who will ensure that they can provide the means to ensure better
innovation points. There are many roles that the HRM can take within a company as well as ensure that the
company can better innovate and make use of their facilitiesto harbor the best talents.
The processes used by the HRM for the better management of the data includes better perks, opportunities to
learn within the organization as well as providing chance of continuous education facilities and learning
opportunities within the company. There areseveral hiring options that ensure better results. The need to learn
and the ideas that make a difference come from people who are motivated and want to provide their best efforts
for the work they love; HRM ensures that they are provided the opportunities they deserve and ensure that they
can be retained within the company to ensure that it can make use of those innovative ideas(Peleckis, 2013).
Besides, its knowledge management capacityensures the continuous learning opportunities to the employees
thereby enhancing their knowledge either in the domain they are working in, in leadership or to learn a new
skill altogether. Overall, HRM approaches act conducive to innovative activities by allowing firms to ascertain
and employ understanding and expertise in the organisation(Chen & Huang, 2009).
Another very important aspect of the HRM is that it ensures that employees feel valued within the organization.
Sometimes only money or perks are not able to motivate employees, but they can become productive when they
feel needed and respected. HRM here essentially ensure that the diversity within the employees are treasured
and celebrated and that all feel valued and respected. For employees with special needs, the need for equal
treatment and acceptance within the company remains as one of the interesting features that still attract a lot of
talent. Differently-abled people need to be respected and provided the required means to ensure that they can
fulfil their targets(Maitra, 2016). The use of strategic HRM is that it ensures better management of the
employees within a global perspective. For employers which have offices throughout the globe and in different
countries that have employees from a diverse ethnic and regional backgrounds it is necessary that the people
become aware of the importance of the management of employees in that case as well.
Employee roles and the use of innovation within the company is the essence to a successful human resource
management, and especially so for the international employers. The use of innovation as an assessing medium
for employees surely suggest how much the importance of such innovators mean to employers.
HRMapproaches ensure that the employees receive proper training and are tested to ensure productivity and
speed. There is also the fact that the work-life balance can ensure that employees are satisfied of their jobs in
the organization. Rules and regulations and a transparent process ensures that the HRM process remains clear to
employees both outside and inside the organization(Edmondson & Harvey, 2017).
METHODOLOGY:
Research Design:
In this research the author endeavorsto establish a measurable method to know the HRM approaches taken in
the different companies and in different cities. There are many issues that the researcher shall investigate which
include the selection and shortlisting process of the employees, the way that the employees would be selected
and required for the same job role.
Participants:
Sampled size involved500 employees of LIC Arunachal Pradesh, considering its Itanagar, Papum Pare, East
Siang, Upper Subansiri, and Tezu branches. Employees who underwent or experienced some form of HRM
approaches in terms of training, appraisal, promotion and so on are considered for the study.=The study

International Journal of Management Studies ISSN(Print) 2249-0302 ISSN (Online)2231-2528 http://www.researchersworld.com/ijms/
Vol.–V, Issue –2(4), April 2018 [106]
furtherinvestigates the different compensation processes as well as the benefits provided to the employees in
each organization as well as tally withcity and job wise to ensure that the study can have a comparative value
for the same. For this, the researcher made sure that the respondents are employed in the concerned organisation
for at least 6 months. However, out of the total 500 employees, only 370 employees’ responses were complete
and valid, thereby gaining a response rate of 74%.
Measurement Instrument and Measures:
Measuring instrument involves close-ended and structured questionnaire involving various HRM practices and
generic perception of employees on the various HRM practices applied in their respective organisations.Life
Insurance Corporation branches across Arunachal Pradesh were approached wherein the questionnaire was
distributed following the random sampling plan. Ethical considerations of privacy and anonymity of the
respondents were maintained to safeguard their personal and professional information.
Data Analysis Procedure:
Upon collecting the data, it was numerically coded using the MS Excel software. Later, it was imported to SPSS
(v 23.0) spreadsheet following which tools of multivariate correlation and regression was carried out to
establish inferences on impact factors of HRM practices. Generic perception of respondents and their
demographic distribution was analysed using frequency tool. Data validity and reliability was established
through obtaining of Cronbach’s Alpha value on >.60.
FINDINGS:
Descriptive Statistics:
In this section, the demographic profile of the respondents from 5 branches of LIC has been represented and
analysed in the form of frequency distribution. The study has presented the results of frequency distribution
through pie- charts to make it easier for understanding of the readers.
Out of 370 candidates captured in the study, around 58% were males. Major respondents’ lied under the age
group 22-30 years and 30-40 years sharing around 28% and 22% of the total dataset respectively. In addition,
the educational qualification of respondents indicated around 28% post- doctoral, 27% with Professional
degree/diploma and 21% graduates in the present study. In addition to this the participants of the organizations
accounted majorly 35% Insurance Advisors, 23% Branch managers, 17% Relationship Managers and 16%
Consultants. In terms of work experience of these participants, mainly 36% and 25% respondents were
experienced for 5-10 years and less than 5 years respectively.
Gender Frequency Percent
Valid
Male 251 57.2
Female 119 27.1
Total 370 84.3
Missing System 69 15.7
Total 439 100.0
Age Frequency Percent
Valid
18-22 41 9.3
22-30 120 27.3
30-40 94 21.4
40-50 55 12.5
50-60 51 11.6
60+and above 9 2.1
Total 370 84.3
Missing System 69 15.7
Total 439 100.0
Educational Qualification Frequency Percent
Valid
Graduate 91 20.7
Post Graduate 42 9.6
Post-Doctoral 121 27.6
Professional degree/diploma 116 26.4
Total 370 84.3
System 69 15.7
International Journal of Management Studies ISSN(Print) 2249-0302 ISSN (Online)2231-2528 http://www.researchersworld.com/ijms/
Vol.–V, Issue –2(4), April 2018 [107]
Considering the objective of the study that is to identify the impact of HRM approaches on nonlife insurance
companies, the foremost agenda to identify the awareness of the HRM approaches was attempted. It was
identified that around 53% participants were aware of the same and 27% were unsure of it.
Given the general and background information of the respondents the next section will take into account the
inferential analysis including hypothesis testing for presented objective of the study thereby presenting several
insights and implications of the same.
Inferential Analysis
To identify that the vector of means of the groups are from the same sampling distribution or not, the researcher
has undertaken Willks’ Lambda test for this one-way MANOVA. If the Wilks’ Lambda value is closer to zero,
there is a significant discrimination between the groups(Simonite et al., 2000). Therefore for the present study
the results of one-way MANOVA revealed a significant influence with Wilks’ λ closer to 0 for few of the
variables significant at p<0.05.Thus we reject the null hypothesis stating the same means of the groups from the
dataset. In addition few of the variables were not significant as p>0.05 thus the null hypothesis was not rejected.
In that case the partial eta square indicates that the variables had approximately upto 10% chances of rejecting
the null hypothesis when it should have been rejected.
Levene's Test of Equality of Error Variancesa
F df1 df2 Sig.
Employees 2.896 165 204 .000
Employees 1.369 165 204 .017
Meeting more customer targets than
before in each quarter 1.171 165 204 .142
Intensity of new products .973 165 204 .571
Launches of services/products .763 165 204 .965
Lower defects .770 165 204 .960
Interaction counts 1.239 165 204 .073
Resolution rates .780 165 204 .951
Call volume 1.789 165 204 .000
Current sales revenue 3.253 165 204 .000
Previous period sales revenue 2.638 165 204 .000
Tests the null hypothesis that the error variance of the dependent variable is equal across groups.
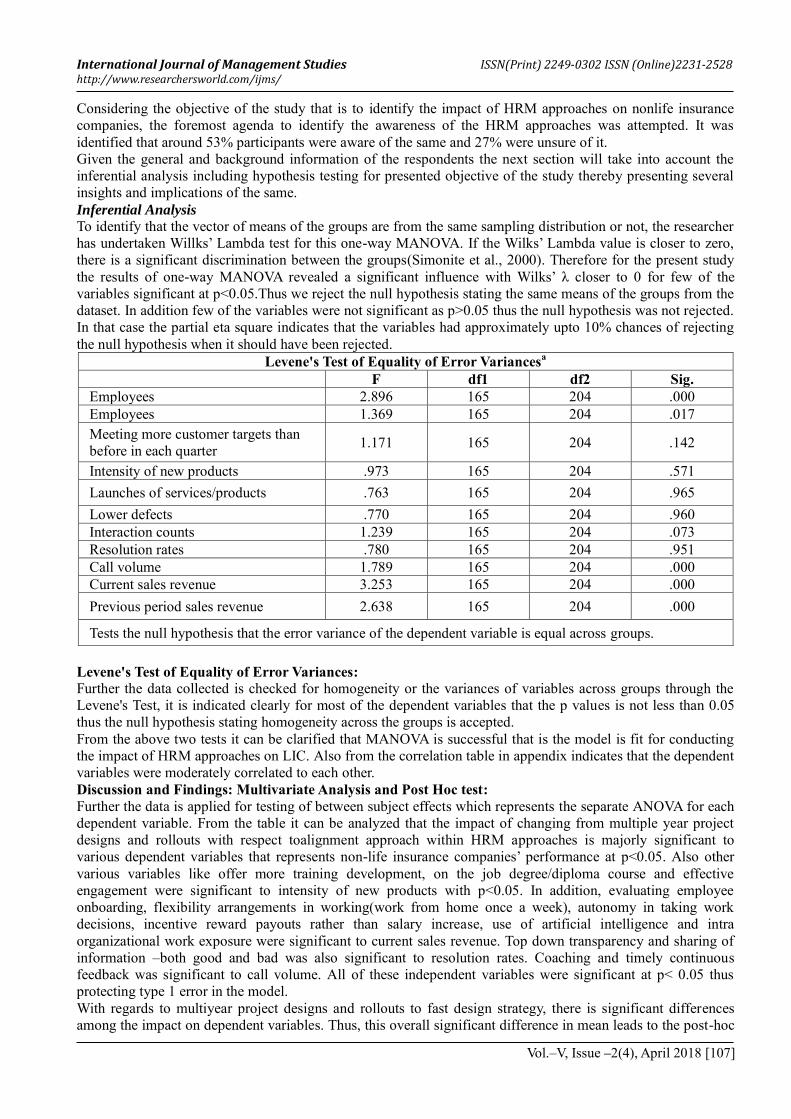
Levene's Test of Equality of Error Variances:
Further the data collected is checked for homogeneity or the variances of variables across groups through the
Levene's Test, it is indicated clearly for most of the dependent variables that the p values is not less than 0.05
thus the null hypothesis stating homogeneity across the groups is accepted.
From the above two tests it can be clarified that MANOVA is successful that is the model is fit for conducting
the impact of HRM approaches on LIC. Also from the correlation table in appendix indicates that the dependent
variables were moderately correlated to each other.
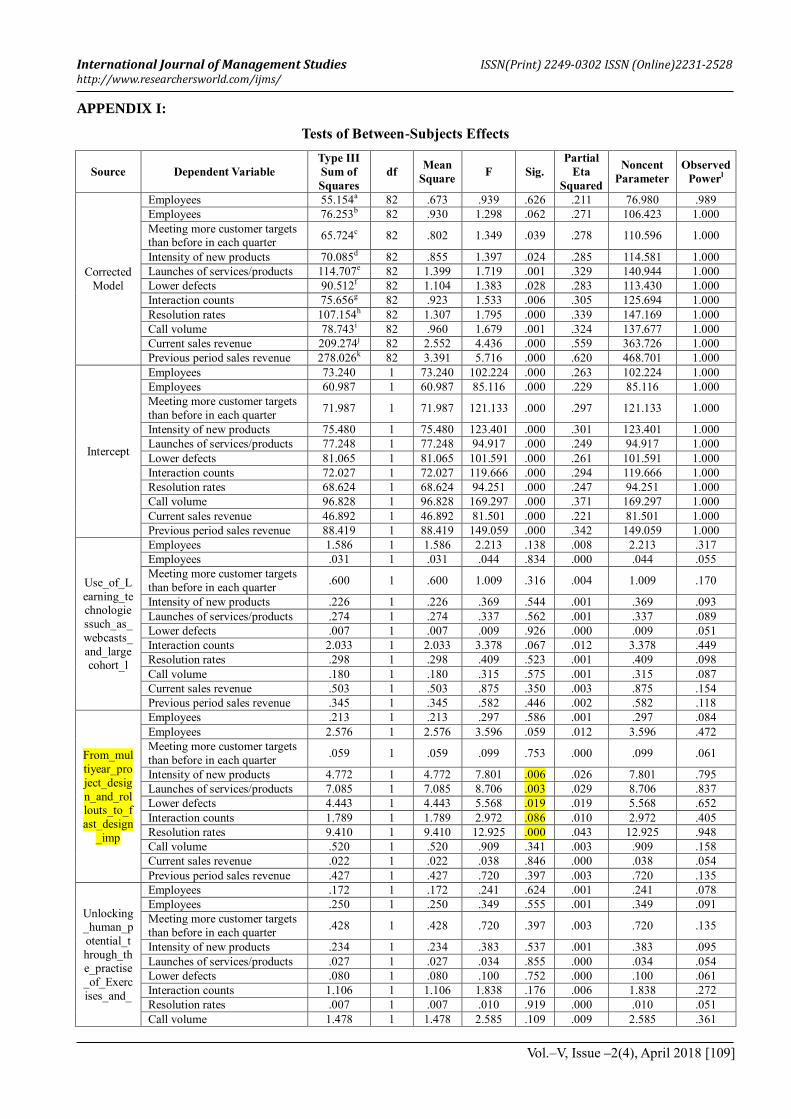
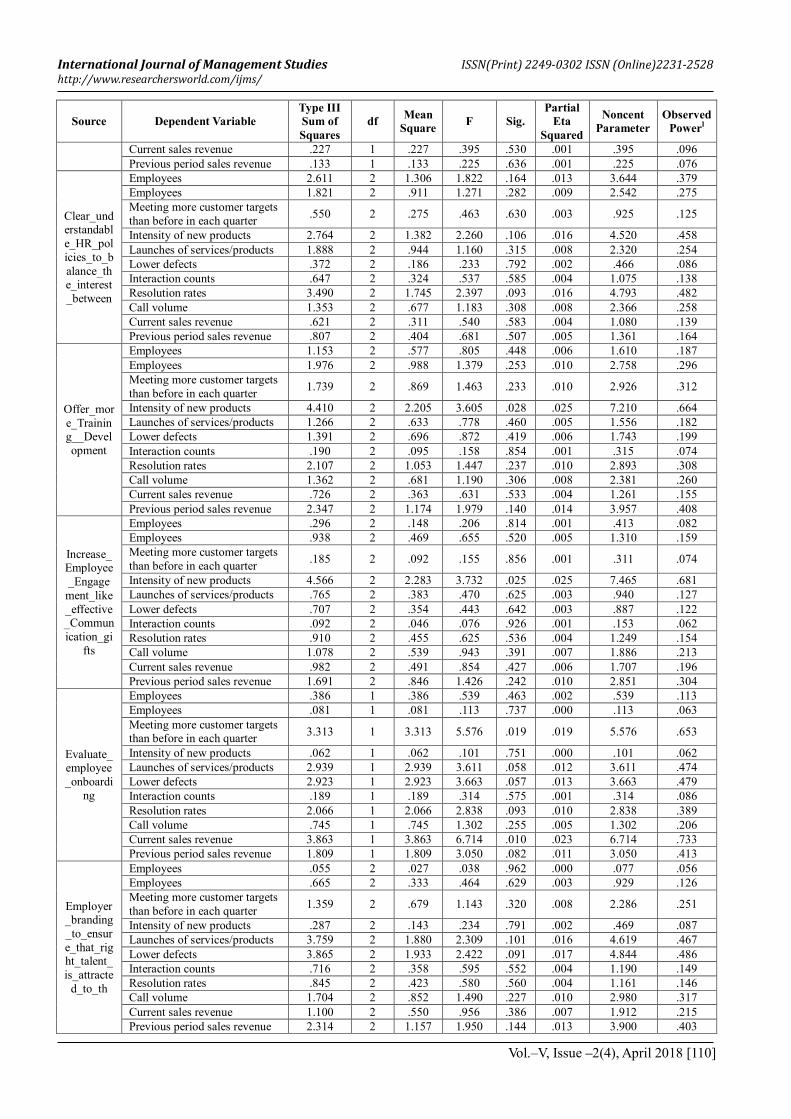
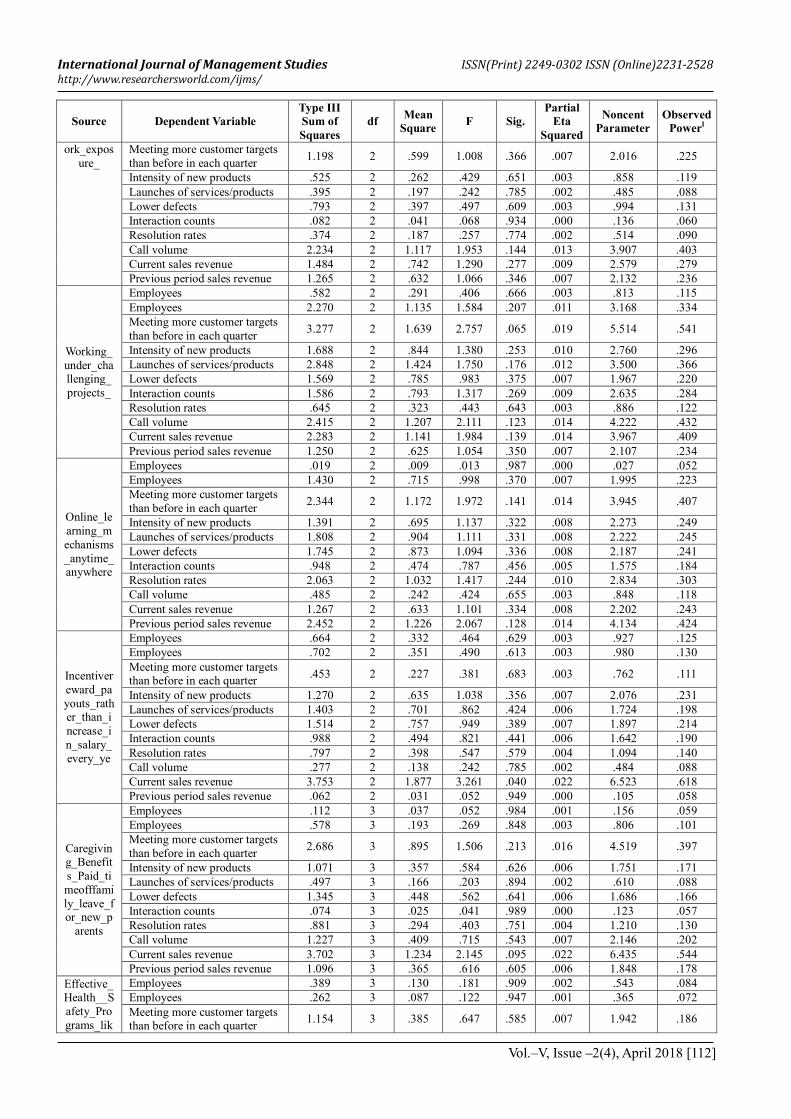
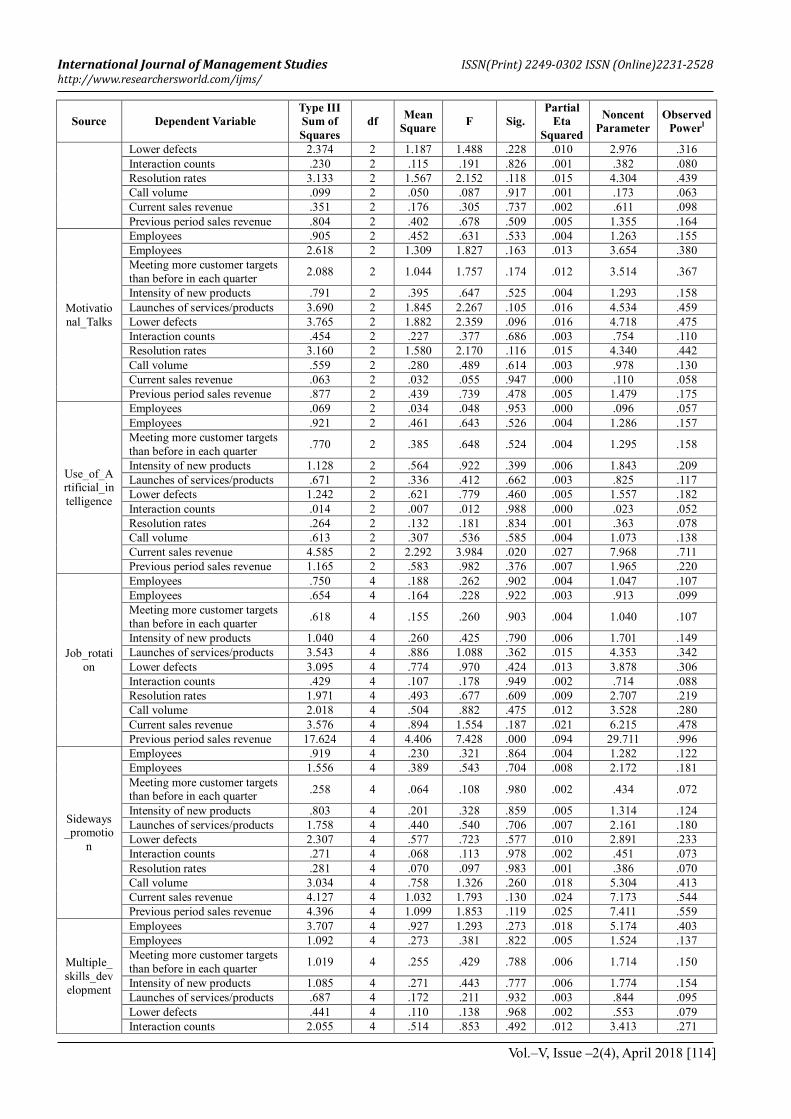
Discussion and Findings: Multivariate Analysis and Post Hoc test:
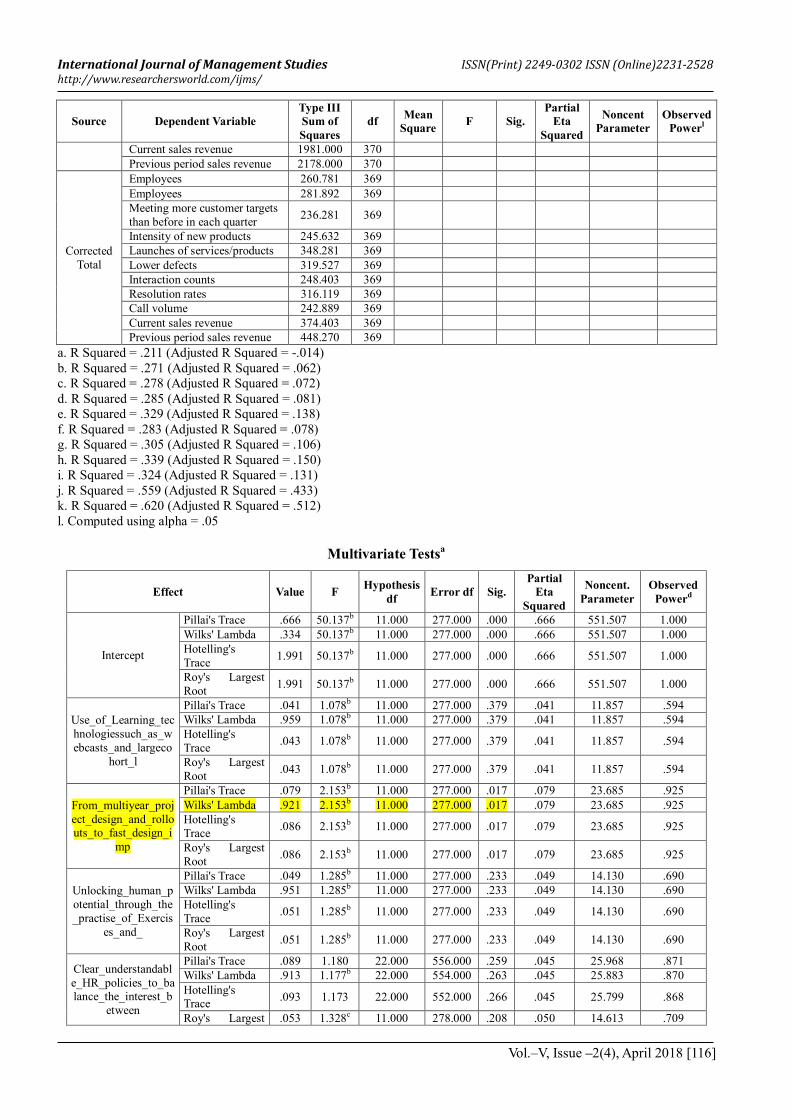
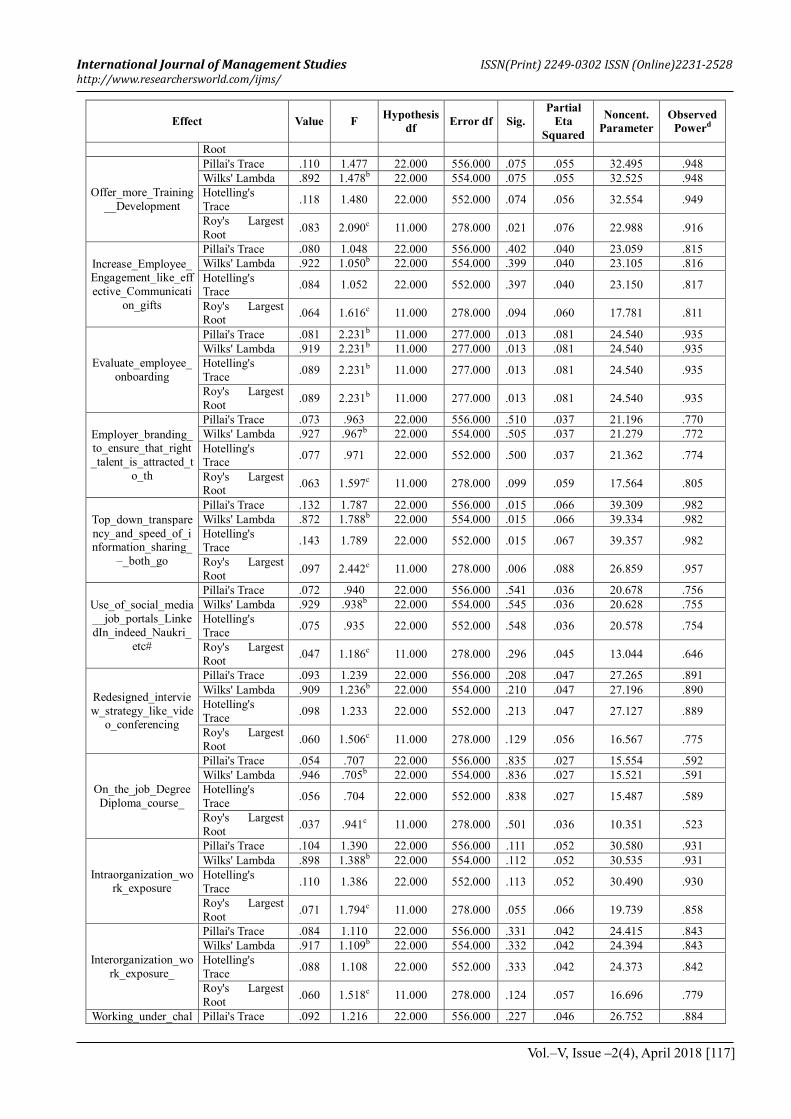
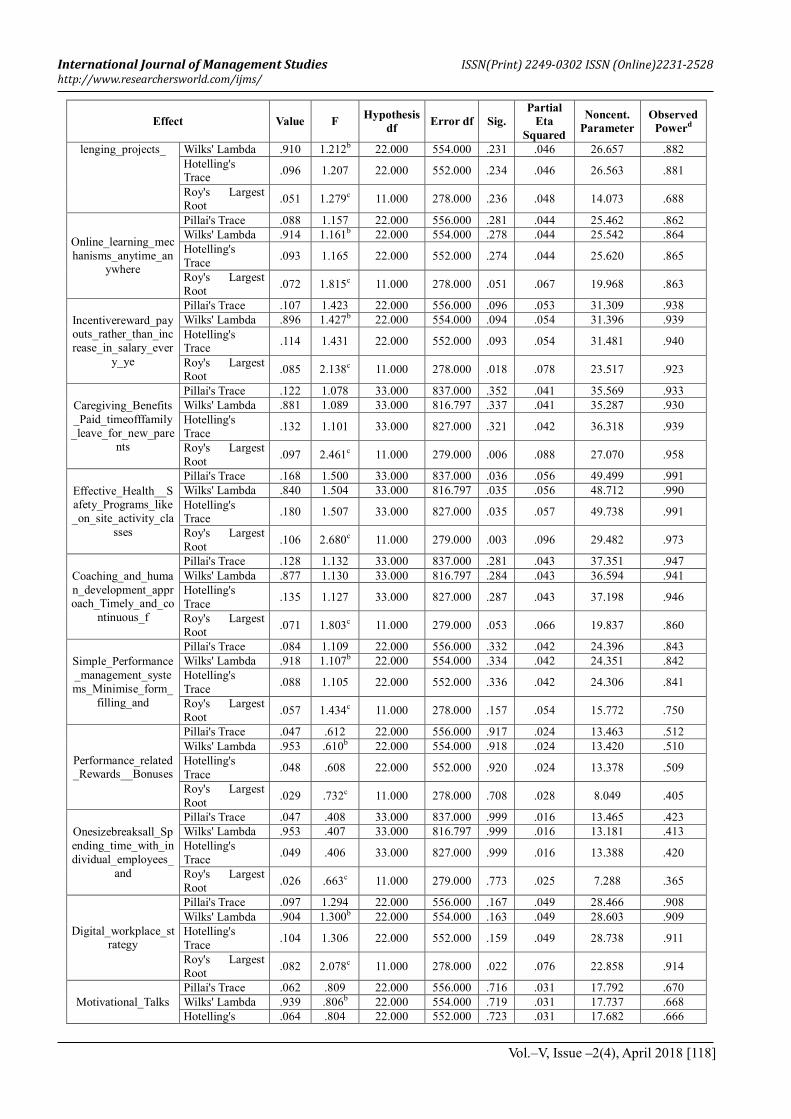
Further the data is applied for testing of between subject effects which represents the separate ANOVA for each
dependent variable. From the table it can be analyzed that the impact of changing from multiple year project
designs and rollouts with respect toalignment approach within HRM approaches is majorly significant to
various dependent variables that represents non-life insurance companies’ performance at p<0.05. Also other
various variables like offer more training development, on the job degree/diploma course and effective
engagement were significant to intensity of new products with p<0.05. In addition, evaluating employee
onboarding, flexibility arrangements in working(work from home once a week), autonomy in taking work
decisions, incentive reward payouts rather than salary increase, use of artificial intelligence and intra
organizational work exposure were significant to current sales revenue. Top down transparency and sharing of
information –both good and bad was also significant to resolution rates. Coaching and timely continuous
feedback was significant to call volume. All of these independent variables were significant at p< 0.05 thus
protecting type 1 error in the model.
With regards to multiyear project designs and rollouts to fast design strategy, there is significant differences
among the impact on dependent variables. Thus, this overall significant difference in mean leads to the post-hoc

International Journal of Management Studies ISSN(Print) 2249-0302 ISSN (Online)2231-2528 http://www.researchersworld.com/ijms/
Vol.–V, Issue –2(4), April 2018 [108]
test for comparison analysis between the dependent variables to test which of the specific mean differs. It is
clearly viewed from table that the pairs of measures of sales growth (Current sales growth and previous year
sales growth) were positive and significantly influenced by this alignment approach within HRM approaches
with p<0.05. In addition to this a similar finding is made in (Patanakul & Milosevic, 2009)wherein the
challenges in effectiveness of multiyear projects have been highlighted and role of fast environment and fast
time to market implementation are stressed.
Result: The null hypothesis stating that the impact of HRM approachesdoes not influence LIC’s performance is
rejected.
CONCLUSION:
Study Implications:
From the above analysis the study indicates about improving the organisation’s performance with respect to
HRM approaches and its implications. Thus a detailed analysis should be undertaken with respect to managerial
efficiency in implementing the same. As per the findings a multiyear project and rollouts to fast design strategy
is crucial and can be effective if competencies like multitasking, the management of interdependencies and
interactions, and leadership/simultaneous team management are undertaken.
Limitations and future scope of study:
The most important limitation of this study was that, no qualitative analysis was done amongst the participants
of LIC. Thus, for future scope of the study, it is suggested that qualitative studies including interviews and focus
group be implemented for qualitative data collection. This will allow assessment of perspectives of the
participants for better and in-depth implications of HRM approaches. Another limitation due to time constraint
and funding was that the survey was administered in a single state of Arunachal Pradesh in the Eastern zone,
henceforth for future scope it is suggested that the survey be conducted at a massive scale for insightful results.
REFERENCES
Collings, D., (2009). Strategic talent management: A review and research agenda. Human Resource
Management Review, 19(4), pp. 304-313.
Edmondson, A. C. & Harvey, J., (2017). Cross-boundary teaming for innovation: Integrating research on teams
and knowledge in organizations. Human Resource Management Review, Online(NA), p. NA.
Gruman, J., (2011). Performance management and employee engagement. Human Resource Management
Review, 21(2), pp. 123-136.
Irina, D., (2011). A CULTURE OF HUMAN RIGHTS AND THE RIGHT TO CULTURE. Journal for
Communication and Culture, 1(2), pp. 30-48.
Jahanshahi, A. A. et al., (2011). Study the Effects of Customer Service and Product Quality on Customer
Satisfaction and Loyalty. International Journal of Humanities and Social Science , 1(7), pp. 253-261.
Little, B., (2011). The principles of successful project management: It takes careful planning, skilful leadership
… and a little bit of luck. Human Resource Management International Digest, pp. 36-39.
Maitra, B., (2016). Investment in Human Capital and Economic Growth in Singapore. Global Business Review ,
17(2), pp. 425-437.
Padhi, D. P. K., (2016). The Rising Importance of Cross Cultural Communication in Global Business Scenario.
Journal of Research in Humanities and Social Science , 4(1), pp. 20-26.
Patanakul, P. and Milosevic, D. (2009). The effectiveness in managing a group of multiple projects: Factors of
influence and measurement criteria, International Journal of Project Management, 27(3), pp. 216–233.
doi: 10.1016/j.ijproman.2008.03.001.
Peleckis, K., (2013). International Business Negotiations: Culture, Dimensions, Context. International Journal
of Business, Humanities and Technology , 3(7), pp. 91-99.
Simonite et al. (2000). A comparison of the nursing competence of graduates and diplomates from UK nursing
programmes Analysis of variance (ANOVA) Wilks’ lambda, Journal of Clinical Nursing, 9, pp. 369–
381. Available at: https://core.ac.uk/download/pdf/32193.pdf (Accessed: 5 March 2018).
Ulrich, D. & Dulebohn, J. H., (2015). Are we there yet? What's next for HR?. Human Resource Management
Review, 25(2), pp. 188-204.
Zuffo, R., (2011). Taylor is Dead, Hurray Taylor! The “Human Factor” in Scientific Management: Between Ethics,
Scientific Psychology and Common Sense. Journal of Business and Management, 17(1), pp. 23-42.
International Journal of Management Studies ISSN(Print) 2249-0302 ISSN (Online)2231-2528 http://www.researchersworld.com/ijms/
Vol.–V, Issue –2(4), April 2018 [109]
APPENDIX I:
Tests of Between-Subjects Effects
Source Dependent Variable
Type III
Sum of
Squares
df Mean
Square F Sig.
Partial
Eta
Squared
Noncent
Parameter
Observed
Powerl
Corrected
Model
Employees 55.154a 82 .673 .939 .626 .211 76.980 .989
Employees 76.253b 82 .930 1.298 .062 .271 106.423 1.000
Meeting more customer targets than before in each quarter
65.724c 82 .802 1.349 .039 .278 110.596 1.000
Intensity of new products 70.085d 82 .855 1.397 .024 .285 114.581 1.000
Launches of services/products 114.707e 82 1.399 1.719 .001 .329 140.944 1.000
Lower defects 90.512f 82 1.104 1.383 .028 .283 113.430 1.000
Interaction counts 75.656g 82 .923 1.533 .006 .305 125.694 1.000
Resolution rates 107.154h 82 1.307 1.795 .000 .339 147.169 1.000
Call volume 78.743i 82 .960 1.679 .001 .324 137.677 1.000
Current sales revenue 209.274j 82 2.552 4.436 .000 .559 363.726 1.000
Previous period sales revenue 278.026k 82 3.391 5.716 .000 .620 468.701 1.000
Intercept
Employees 73.240 1 73.240 102.224 .000 .263 102.224 1.000
Employees 60.987 1 60.987 85.116 .000 .229 85.116 1.000
Meeting more customer targets
than before in each quarter 71.987 1 71.987 121.133 .000 .297 121.133 1.000
Intensity of new products 75.480 1 75.480 123.401 .000 .301 123.401 1.000
Launches of services/products 77.248 1 77.248 94.917 .000 .249 94.917 1.000
Lower defects 81.065 1 81.065 101.591 .000 .261 101.591 1.000
Interaction counts 72.027 1 72.027 119.666 .000 .294 119.666 1.000
Resolution rates 68.624 1 68.624 94.251 .000 .247 94.251 1.000
Call volume 96.828 1 96.828 169.297 .000 .371 169.297 1.000
Current sales revenue 46.892 1 46.892 81.501 .000 .221 81.501 1.000
Previous period sales revenue 88.419 1 88.419 149.059 .000 .342 149.059 1.000
Use_of_L
earning_technologie
ssuch_as_
webcasts_
and_largecohort_l
Employees 1.586 1 1.586 2.213 .138 .008 2.213 .317
Employees .031 1 .031 .044 .834 .000 .044 .055
Meeting more customer targets
than before in each quarter .600 1 .600 1.009 .316 .004 1.009 .170
Intensity of new products .226 1 .226 .369 .544 .001 .369 .093
Launches of services/products .274 1 .274 .337 .562 .001 .337 .089
Lower defects .007 1 .007 .009 .926 .000 .009 .051
Interaction counts 2.033 1 2.033 3.378 .067 .012 3.378 .449
Resolution rates .298 1 .298 .409 .523 .001 .409 .098
Call volume .180 1 .180 .315 .575 .001 .315 .087
Current sales revenue .503 1 .503 .875 .350 .003 .875 .154
Previous period sales revenue .345 1 .345 .582 .446 .002 .582 .118
From_mul
tiyear_pro
ject_desig
n_and_rollouts_to_f
ast_design
_imp
Employees .213 1 .213 .297 .586 .001 .297 .084
Employees 2.576 1 2.576 3.596 .059 .012 3.596 .472
Meeting more customer targets
than before in each quarter .059 1 .059 .099 .753 .000 .099 .061
Intensity of new products 4.772 1 4.772 7.801 .006 .026 7.801 .795
Launches of services/products 7.085 1 7.085 8.706 .003 .029 8.706 .837
Lower defects 4.443 1 4.443 5.568 .019 .019 5.568 .652
Interaction counts 1.789 1 1.789 2.972 .086 .010 2.972 .405
Resolution rates 9.410 1 9.410 12.925 .000 .043 12.925 .948
Call volume .520 1 .520 .909 .341 .003 .909 .158
Current sales revenue .022 1 .022 .038 .846 .000 .038 .054
Previous period sales revenue .427 1 .427 .720 .397 .003 .720 .135
Unlocking_human_p
otential_t
hrough_the_practise
_of_Exerc
ises_and_
Employees .172 1 .172 .241 .624 .001 .241 .078
Employees .250 1 .250 .349 .555 .001 .349 .091
Meeting more customer targets
than before in each quarter .428 1 .428 .720 .397 .003 .720 .135
Intensity of new products .234 1 .234 .383 .537 .001 .383 .095
Launches of services/products .027 1 .027 .034 .855 .000 .034 .054
Lower defects .080 1 .080 .100 .752 .000 .100 .061
Interaction counts 1.106 1 1.106 1.838 .176 .006 1.838 .272
Resolution rates .007 1 .007 .010 .919 .000 .010 .051
Call volume 1.478 1 1.478 2.585 .109 .009 2.585 .361
International Journal of Management Studies ISSN(Print) 2249-0302 ISSN (Online)2231-2528 http://www.researchersworld.com/ijms/
Vol.–V, Issue –2(4), April 2018 [110]
Source Dependent Variable
Type III
Sum of
Squares
df Mean
Square F Sig.
Partial
Eta
Squared
Noncent
Parameter
Observed
Powerl
Current sales revenue .227 1 .227 .395 .530 .001 .395 .096
Previous period sales revenue .133 1 .133 .225 .636 .001 .225 .076
Clear_understandabl
e_HR_pol
icies_to_b
alance_the_interest
_between
Employees 2.611 2 1.306 1.822 .164 .013 3.644 .379
Employees 1.821 2 .911 1.271 .282 .009 2.542 .275
Meeting more customer targets
than before in each quarter .550 2 .275 .463 .630 .003 .925 .125
Intensity of new products 2.764 2 1.382 2.260 .106 .016 4.520 .458
Launches of services/products 1.888 2 .944 1.160 .315 .008 2.320 .254
Lower defects .372 2 .186 .233 .792 .002 .466 .086
Interaction counts .647 2 .324 .537 .585 .004 1.075 .138
Resolution rates 3.490 2 1.745 2.397 .093 .016 4.793 .482
Call volume 1.353 2 .677 1.183 .308 .008 2.366 .258
Current sales revenue .621 2 .311 .540 .583 .004 1.080 .139
Previous period sales revenue .807 2 .404 .681 .507 .005 1.361 .164
Offer_mor
e_Training__Devel
opment
Employees 1.153 2 .577 .805 .448 .006 1.610 .187
Employees 1.976 2 .988 1.379 .253 .010 2.758 .296
Meeting more customer targets
than before in each quarter 1.739 2 .869 1.463 .233 .010 2.926 .312
Intensity of new products 4.410 2 2.205 3.605 .028 .025 7.210 .664
Launches of services/products 1.266 2 .633 .778 .460 .005 1.556 .182
Lower defects 1.391 2 .696 .872 .419 .006 1.743 .199
Interaction counts .190 2 .095 .158 .854 .001 .315 .074
Resolution rates 2.107 2 1.053 1.447 .237 .010 2.893 .308
Call volume 1.362 2 .681 1.190 .306 .008 2.381 .260
Current sales revenue .726 2 .363 .631 .533 .004 1.261 .155
Previous period sales revenue 2.347 2 1.174 1.979 .140 .014 3.957 .408
Increase_Employee
_Engage
ment_like
_effective_Commun
ication_gi
fts
Employees .296 2 .148 .206 .814 .001 .413 .082
Employees .938 2 .469 .655 .520 .005 1.310 .159
Meeting more customer targets
than before in each quarter .185 2 .092 .155 .856 .001 .311 .074
Intensity of new products 4.566 2 2.283 3.732 .025 .025 7.465 .681
Launches of services/products .765 2 .383 .470 .625 .003 .940 .127
Lower defects .707 2 .354 .443 .642 .003 .887 .122
Interaction counts .092 2 .046 .076 .926 .001 .153 .062
Resolution rates .910 2 .455 .625 .536 .004 1.249 .154
Call volume 1.078 2 .539 .943 .391 .007 1.886 .213
Current sales revenue .982 2 .491 .854 .427 .006 1.707 .196
Previous period sales revenue 1.691 2 .846 1.426 .242 .010 2.851 .304
Evaluate_employee
_onboardi
ng
Employees .386 1 .386 .539 .463 .002 .539 .113
Employees .081 1 .081 .113 .737 .000 .113 .063
Meeting more customer targets
than before in each quarter 3.313 1 3.313 5.576 .019 .019 5.576 .653
Intensity of new products .062 1 .062 .101 .751 .000 .101 .062
Launches of services/products 2.939 1 2.939 3.611 .058 .012 3.611 .474
Lower defects 2.923 1 2.923 3.663 .057 .013 3.663 .479
Interaction counts .189 1 .189 .314 .575 .001 .314 .086
Resolution rates 2.066 1 2.066 2.838 .093 .010 2.838 .389
Call volume .745 1 .745 1.302 .255 .005 1.302 .206
Current sales revenue 3.863 1 3.863 6.714 .010 .023 6.714 .733
Previous period sales revenue 1.809 1 1.809 3.050 .082 .011 3.050 .413
Employer_branding
_to_ensur
e_that_right_talent_
is_attracte
d_to_th
Employees .055 2 .027 .038 .962 .000 .077 .056
Employees .665 2 .333 .464 .629 .003 .929 .126
Meeting more customer targets
than before in each quarter 1.359 2 .679 1.143 .320 .008 2.286 .251
Intensity of new products .287 2 .143 .234 .791 .002 .469 .087
Launches of services/products 3.759 2 1.880 2.309 .101 .016 4.619 .467
Lower defects 3.865 2 1.933 2.422 .091 .017 4.844 .486
Interaction counts .716 2 .358 .595 .552 .004 1.190 .149
Resolution rates .845 2 .423 .580 .560 .004 1.161 .146
Call volume 1.704 2 .852 1.490 .227 .010 2.980 .317
Current sales revenue 1.100 2 .550 .956 .386 .007 1.912 .215
Previous period sales revenue 2.314 2 1.157 1.950 .144 .013 3.900 .403

International Journal of Management Studies ISSN(Print) 2249-0302 ISSN (Online)2231-2528 http://www.researchersworld.com/ijms/
Vol.–V, Issue –2(4), April 2018 [111]
Source Dependent Variable
Type III
Sum of
Squares
df Mean
Square F Sig.
Partial
Eta
Squared
Noncent
Parameter
Observed
Powerl
Top_down
_transpare
ncy_and_
speed_of_informatio
n_sharing
_–
_both_go
Employees .833 2 .416 .581 .560 .004 1.162 .146
Employees .862 2 .431 .602 .549 .004 1.203 .150
Meeting more customer targets
than before in each quarter .916 2 .458 .771 .464 .005 1.542 .181
Intensity of new products .147 2 .074 .120 .887 .001 .240 .068
Launches of services/products 2.208 2 1.104 1.356 .259 .009 2.713 .291
Lower defects .696 2 .348 .436 .647 .003 .873 .121
Interaction counts .009 2 .005 .008 .993 .000 .015 .051
Resolution rates 4.493 2 2.247 3.086 .047 .021 6.171 .592
Call volume 1.159 2 .579 1.013 .364 .007 2.026 .226
Current sales revenue .510 2 .255 .443 .642 .003 .886 .122
Previous period sales revenue 3.400 2 1.700 2.866 .059 .020 5.731 .559
Use_of_social_med
ia__job_p
ortals_Lin
kedIn_indeed_Nauk
ri_etc#
Employees .207 2 .103 .144 .866 .001 .289 .072
Employees 1.835 2 .917 1.280 .280 .009 2.561 .277
Meeting more customer targets
than before in each quarter 1.660 2 .830 1.397 .249 .010 2.793 .299
Intensity of new products 2.382 2 1.191 1.947 .145 .013 3.894 .402
Launches of services/products 2.982 2 1.491 1.832 .162 .013 3.664 .381
Lower defects 2.502 2 1.251 1.568 .210 .011 3.135 .331
Interaction counts 2.930 2 1.465 2.434 .090 .017 4.867 .488
Resolution rates 2.648 2 1.324 1.819 .164 .013 3.637 .378
Call volume 5.116 2 2.558 4.472 .012 .030 8.944 .763
Current sales revenue .125 2 .062 .109 .897 .001 .217 .067
Previous period sales revenue .529 2 .264 .446 .641 .003 .891 .122
Redesigne
d_interview_strateg
y_like_vi
deo_confe
rencing
Employees 2.982 2 1.491 2.081 .127 .014 4.161 .426
Employees 1.216 2 .608 .848 .429 .006 1.697 .195
Meeting more customer targets than before in each quarter
4.165 2 2.083 3.505 .031 .024 7.009 .651
Intensity of new products 2.312 2 1.156 1.890 .153 .013 3.779 .391
Launches of services/products .198 2 .099 .122 .885 .001 .243 .069
Lower defects .162 2 .081 .102 .903 .001 .203 .065
Interaction counts 1.232 2 .616 1.023 .361 .007 2.047 .228
Resolution rates .421 2 .210 .289 .749 .002 .578 .096
Call volume 3.226 2 1.613 2.820 .061 .019 5.640 .551
Current sales revenue .509 2 .254 .442 .643 .003 .884 .122
Previous period sales revenue 1.614 2 .807 1.360 .258 .009 2.720 .292
On_the_jo
b_Degree
Diploma_course_
Employees 1.214 2 .607 .847 .430 .006 1.694 .195
Employees 2.854 2 1.427 1.991 .138 .014 3.983 .410
Meeting more customer targets
than before in each quarter 1.636 2 .818 1.377 .254 .010 2.753 .295
Intensity of new products 4.666 2 2.333 3.814 .023 .026 7.629 .691
Launches of services/products 1.679 2 .840 1.032 .358 .007 2.064 .230
Lower defects 1.983 2 .992 1.243 .290 .009 2.485 .270
Interaction counts 1.648 2 .824 1.369 .256 .009 2.737 .294
Resolution rates 1.709 2 .855 1.174 .311 .008 2.347 .256
Call volume .420 2 .210 .367 .693 .003 .734 .109
Current sales revenue .078 2 .039 .068 .935 .000 .135 .060
Previous period sales revenue .066 2 .033 .056 .946 .000 .111 .058
Intraorganization_w
ork_expos
ure
Employees 2.588 2 1.294 1.806 .166 .012 3.613 .376
Employees 1.544 2 .772 1.078 .342 .007 2.155 .238
Meeting more customer targets than before in each quarter
1.311 2 .655 1.103 .333 .008 2.206 .243
Intensity of new products 2.367 2 1.183 1.935 .146 .013 3.870 .400
Launches of services/products .830 2 .415 .510 .601 .004 1.020 .134
Lower defects .607 2 .303 .380 .684 .003 .761 .111
Interaction counts .738 2 .369 .613 .542 .004 1.227 .152
Resolution rates .176 2 .088 .121 .886 .001 .242 .068
Call volume .603 2 .302 .527 .591 .004 1.055 .137
Current sales revenue 4.252 2 2.126 3.695 .026 .025 7.391 .676
Previous period sales revenue 2.291 2 1.146 1.931 .147 .013 3.862 .399
Interorgan
ization_w
Employees .072 2 .036 .050 .951 .000 .101 .058
Employees 1.292 2 .646 .901 .407 .006 1.803 .205
International Journal of Management Studies ISSN(Print) 2249-0302 ISSN (Online)2231-2528 http://www.researchersworld.com/ijms/
Vol.–V, Issue –2(4), April 2018 [112]
Source Dependent Variable
Type III
Sum of
Squares
df Mean
Square F Sig.
Partial
Eta
Squared
Noncent
Parameter
Observed
Powerl
ork_expos
ure_
Meeting more customer targets
than before in each quarter 1.198 2 .599 1.008 .366 .007 2.016 .225
Intensity of new products .525 2 .262 .429 .651 .003 .858 .119
Launches of services/products .395 2 .197 .242 .785 .002 .485 .088
Lower defects .793 2 .397 .497 .609 .003 .994 .131
Interaction counts .082 2 .041 .068 .934 .000 .136 .060
Resolution rates .374 2 .187 .257 .774 .002 .514 .090
Call volume 2.234 2 1.117 1.953 .144 .013 3.907 .403
Current sales revenue 1.484 2 .742 1.290 .277 .009 2.579 .279
Previous period sales revenue 1.265 2 .632 1.066 .346 .007 2.132 .236
Working_
under_challenging_
projects_
Employees .582 2 .291 .406 .666 .003 .813 .115
Employees 2.270 2 1.135 1.584 .207 .011 3.168 .334
Meeting more customer targets
than before in each quarter 3.277 2 1.639 2.757 .065 .019 5.514 .541
Intensity of new products 1.688 2 .844 1.380 .253 .010 2.760 .296
Launches of services/products 2.848 2 1.424 1.750 .176 .012 3.500 .366
Lower defects 1.569 2 .785 .983 .375 .007 1.967 .220
Interaction counts 1.586 2 .793 1.317 .269 .009 2.635 .284
Resolution rates .645 2 .323 .443 .643 .003 .886 .122
Call volume 2.415 2 1.207 2.111 .123 .014 4.222 .432
Current sales revenue 2.283 2 1.141 1.984 .139 .014 3.967 .409
Previous period sales revenue 1.250 2 .625 1.054 .350 .007 2.107 .234
Online_le
arning_m
echanisms
_anytime_anywhere
Employees .019 2 .009 .013 .987 .000 .027 .052
Employees 1.430 2 .715 .998 .370 .007 1.995 .223
Meeting more customer targets
than before in each quarter 2.344 2 1.172 1.972 .141 .014 3.945 .407
Intensity of new products 1.391 2 .695 1.137 .322 .008 2.273 .249
Launches of services/products 1.808 2 .904 1.111 .331 .008 2.222 .245
Lower defects 1.745 2 .873 1.094 .336 .008 2.187 .241
Interaction counts .948 2 .474 .787 .456 .005 1.575 .184
Resolution rates 2.063 2 1.032 1.417 .244 .010 2.834 .303
Call volume .485 2 .242 .424 .655 .003 .848 .118
Current sales revenue 1.267 2 .633 1.101 .334 .008 2.202 .243
Previous period sales revenue 2.452 2 1.226 2.067 .128 .014 4.134 .424
Incentiver
eward_pa
youts_rather_than_i
ncrease_i
n_salary_
every_ye
Employees .664 2 .332 .464 .629 .003 .927 .125
Employees .702 2 .351 .490 .613 .003 .980 .130
Meeting more customer targets than before in each quarter
.453 2 .227 .381 .683 .003 .762 .111
Intensity of new products 1.270 2 .635 1.038 .356 .007 2.076 .231
Launches of services/products 1.403 2 .701 .862 .424 .006 1.724 .198
Lower defects 1.514 2 .757 .949 .389 .007 1.897 .214
Interaction counts .988 2 .494 .821 .441 .006 1.642 .190
Resolution rates .797 2 .398 .547 .579 .004 1.094 .140
Call volume .277 2 .138 .242 .785 .002 .484 .088
Current sales revenue 3.753 2 1.877 3.261 .040 .022 6.523 .618
Previous period sales revenue .062 2 .031 .052 .949 .000 .105 .058
Caregiving_Benefit
s_Paid_ti
meofffami
ly_leave_for_new_p
arents
Employees .112 3 .037 .052 .984 .001 .156 .059
Employees .578 3 .193 .269 .848 .003 .806 .101
Meeting more customer targets
than before in each quarter 2.686 3 .895 1.506 .213 .016 4.519 .397
Intensity of new products 1.071 3 .357 .584 .626 .006 1.751 .171
Launches of services/products .497 3 .166 .203 .894 .002 .610 .088
Lower defects 1.345 3 .448 .562 .641 .006 1.686 .166
Interaction counts .074 3 .025 .041 .989 .000 .123 .057
Resolution rates .881 3 .294 .403 .751 .004 1.210 .130
Call volume 1.227 3 .409 .715 .543 .007 2.146 .202
Current sales revenue 3.702 3 1.234 2.145 .095 .022 6.435 .544
Previous period sales revenue 1.096 3 .365 .616 .605 .006 1.848 .178
Effective_Health__S
afety_Pro
grams_lik
Employees .389 3 .130 .181 .909 .002 .543 .084
Employees .262 3 .087 .122 .947 .001 .365 .072
Meeting more customer targets than before in each quarter
1.154 3 .385 .647 .585 .007 1.942 .186

International Journal of Management Studies ISSN(Print) 2249-0302 ISSN (Online)2231-2528 http://www.researchersworld.com/ijms/
Vol.–V, Issue –2(4), April 2018 [113]
Source Dependent Variable
Type III
Sum of
Squares
df Mean
Square F Sig.
Partial
Eta
Squared
Noncent
Parameter
Observed
Powerl
e_on_site
_activity_
classes
Intensity of new products 4.297 3 1.432 2.342 .073 .024 7.026 .585
Launches of services/products 5.474 3 1.825 2.242 .084 .023 6.726 .564
Lower defects 5.091 3 1.697 2.127 .097 .022 6.380 .540
Interaction counts .171 3 .057 .095 .963 .001 .285 .067
Resolution rates 6.810 3 2.270 3.118 .027 .032 9.353 .723
Call volume 1.317 3 .439 .767 .513 .008 2.302 .214
Current sales revenue 8.512 3 2.837 4.931 .002 .049 14.794 .909
Previous period sales revenue 2.538 3 .846 1.426 .235 .015 4.278 .377
Coaching
_and_hum
an_develo
pment_approach_Ti
mely_and
_continuo
us_f
Employees .500 3 .167 .233 .874 .002 .698 .094
Employees 3.912 3 1.304 1.820 .144 .019 5.460 .471
Meeting more customer targets
than before in each quarter 1.847 3 .616 1.036 .377 .011 3.109 .280
Intensity of new products 2.078 3 .693 1.132 .336 .012 3.397 .304
Launches of services/products 1.954 3 .651 .800 .495 .008 2.401 .222
Lower defects .501 3 .167 .209 .890 .002 .628 .089
Interaction counts 3.424 3 1.141 1.896 .130 .019 5.688 .489
Resolution rates 1.313 3 .438 .601 .615 .006 1.803 .175
Call volume 4.630 3 1.543 2.698 .046 .027 8.095 .653
Current sales revenue .534 3 .178 .309 .819 .003 .928 .110
Previous period sales revenue .047 3 .016 .026 .994 .000 .079 .055
Simple_P
erformance_manage
ment_syst
ems_Minimise_for
m_filling_
and
Employees .214 2 .107 .149 .862 .001 .298 .073
Employees .761 2 .381 .531 .588 .004 1.063 .137
Meeting more customer targets
than before in each quarter .192 2 .096 .162 .851 .001 .323 .075
Intensity of new products .176 2 .088 .144 .866 .001 .288 .072
Launches of services/products 6.009 2 3.004 3.692 .026 .025 7.383 .675
Lower defects 4.752 2 2.376 2.978 .052 .020 5.955 .576
Interaction counts 1.084 2 .542 .900 .408 .006 1.800 .205
Resolution rates 5.646 2 2.823 3.877 .022 .026 7.754 .698
Call volume 3.579 2 1.789 3.129 .045 .021 6.258 .599
Current sales revenue .667 2 .333 .579 .561 .004 1.159 .146
Previous period sales revenue 2.390 2 1.195 2.015 .135 .014 4.029 .414
Performan
ce_related_Rewards
__Bonuse
s
Employees .085 2 .043 .059 .942 .000 .119 .059
Employees .125 2 .063 .087 .916 .001 .175 .063
Meeting more customer targets than before in each quarter
.338 2 .169 .284 .753 .002 .569 .095
Intensity of new products .752 2 .376 .615 .542 .004 1.229 .152
Launches of services/products .097 2 .048 .059 .942 .000 .119 .059
Lower defects .037 2 .019 .023 .977 .000 .047 .054
Interaction counts .507 2 .253 .421 .657 .003 .842 .118
Resolution rates .053 2 .027 .036 .964 .000 .073 .055
Call volume .080 2 .040 .070 .933 .000 .139 .060
Current sales revenue 1.064 2 .532 .925 .398 .006 1.850 .209
Previous period sales revenue 1.738 2 .869 1.465 .233 .010 2.930 .312
Onesizebreaksall_S
pending_t
ime_with
_individual_employ
ees_and
Employees .473 3 .158 .220 .882 .002 .660 .091
Employees .665 3 .222 .309 .819 .003 .928 .110
Meeting more customer targets
than before in each quarter 1.055 3 .352 .592 .621 .006 1.775 .172
Intensity of new products .907 3 .302 .494 .686 .005 1.483 .150
Launches of services/products .330 3 .110 .135 .939 .001 .405 .075
Lower defects .161 3 .054 .067 .977 .001 .202 .062
Interaction counts 1.839 3 .613 1.018 .385 .011 3.055 .276
Resolution rates .244 3 .081 .112 .953 .001 .335 .070
Call volume .510 3 .170 .297 .828 .003 .891 .107
Current sales revenue 1.792 3 .597 1.038 .376 .011 3.115 .281
Previous period sales revenue 1.715 3 .572 .964 .410 .010 2.892 .262
Digital_workplace_
strategy
Employees .455 2 .227 .317 .728 .002 .635 .100
Employees 1.595 2 .797 1.113 .330 .008 2.226 .245
Meeting more customer targets than before in each quarter
1.328 2 .664 1.117 .329 .008 2.235 .246
Intensity of new products .102 2 .051 .083 .920 .001 .167 .063
Launches of services/products 5.604 2 2.802 3.443 .033 .023 6.886 .643
International Journal of Management Studies ISSN(Print) 2249-0302 ISSN (Online)2231-2528 http://www.researchersworld.com/ijms/
Vol.–V, Issue –2(4), April 2018 [114]
Source Dependent Variable
Type III
Sum of
Squares
df Mean
Square F Sig.
Partial
Eta
Squared
Noncent
Parameter
Observed
Powerl
Lower defects 2.374 2 1.187 1.488 .228 .010 2.976 .316
Interaction counts .230 2 .115 .191 .826 .001 .382 .080
Resolution rates 3.133 2 1.567 2.152 .118 .015 4.304 .439
Call volume .099 2 .050 .087 .917 .001 .173 .063
Current sales revenue .351 2 .176 .305 .737 .002 .611 .098
Previous period sales revenue .804 2 .402 .678 .509 .005 1.355 .164
Motivatio
nal_Talks
Employees .905 2 .452 .631 .533 .004 1.263 .155
Employees 2.618 2 1.309 1.827 .163 .013 3.654 .380
Meeting more customer targets
than before in each quarter 2.088 2 1.044 1.757 .174 .012 3.514 .367
Intensity of new products .791 2 .395 .647 .525 .004 1.293 .158
Launches of services/products 3.690 2 1.845 2.267 .105 .016 4.534 .459
Lower defects 3.765 2 1.882 2.359 .096 .016 4.718 .475
Interaction counts .454 2 .227 .377 .686 .003 .754 .110
Resolution rates 3.160 2 1.580 2.170 .116 .015 4.340 .442
Call volume .559 2 .280 .489 .614 .003 .978 .130
Current sales revenue .063 2 .032 .055 .947 .000 .110 .058
Previous period sales revenue .877 2 .439 .739 .478 .005 1.479 .175
Use_of_Artificial_in
telligence
Employees .069 2 .034 .048 .953 .000 .096 .057
Employees .921 2 .461 .643 .526 .004 1.286 .157
Meeting more customer targets
than before in each quarter .770 2 .385 .648 .524 .004 1.295 .158
Intensity of new products 1.128 2 .564 .922 .399 .006 1.843 .209
Launches of services/products .671 2 .336 .412 .662 .003 .825 .117
Lower defects 1.242 2 .621 .779 .460 .005 1.557 .182
Interaction counts .014 2 .007 .012 .988 .000 .023 .052
Resolution rates .264 2 .132 .181 .834 .001 .363 .078
Call volume .613 2 .307 .536 .585 .004 1.073 .138
Current sales revenue 4.585 2 2.292 3.984 .020 .027 7.968 .711
Previous period sales revenue 1.165 2 .583 .982 .376 .007 1.965 .220
Job_rotati
on
Employees .750 4 .188 .262 .902 .004 1.047 .107
Employees .654 4 .164 .228 .922 .003 .913 .099
Meeting more customer targets
than before in each quarter .618 4 .155 .260 .903 .004 1.040 .107
Intensity of new products 1.040 4 .260 .425 .790 .006 1.701 .149
Launches of services/products 3.543 4 .886 1.088 .362 .015 4.353 .342
Lower defects 3.095 4 .774 .970 .424 .013 3.878 .306
Interaction counts .429 4 .107 .178 .949 .002 .714 .088
Resolution rates 1.971 4 .493 .677 .609 .009 2.707 .219
Call volume 2.018 4 .504 .882 .475 .012 3.528 .280
Current sales revenue 3.576 4 .894 1.554 .187 .021 6.215 .478
Previous period sales revenue 17.624 4 4.406 7.428 .000 .094 29.711 .996
Sideways_promotio
n
Employees .919 4 .230 .321 .864 .004 1.282 .122
Employees 1.556 4 .389 .543 .704 .008 2.172 .181
Meeting more customer targets than before in each quarter
.258 4 .064 .108 .980 .002 .434 .072
Intensity of new products .803 4 .201 .328 .859 .005 1.314 .124
Launches of services/products 1.758 4 .440 .540 .706 .007 2.161 .180
Lower defects 2.307 4 .577 .723 .577 .010 2.891 .233
Interaction counts .271 4 .068 .113 .978 .002 .451 .073
Resolution rates .281 4 .070 .097 .983 .001 .386 .070
Call volume 3.034 4 .758 1.326 .260 .018 5.304 .413
Current sales revenue 4.127 4 1.032 1.793 .130 .024 7.173 .544
Previous period sales revenue 4.396 4 1.099 1.853 .119 .025 7.411 .559
Multiple_
skills_dev
elopment
Employees 3.707 4 .927 1.293 .273 .018 5.174 .403
Employees 1.092 4 .273 .381 .822 .005 1.524 .137
Meeting more customer targets
than before in each quarter 1.019 4 .255 .429 .788 .006 1.714 .150
Intensity of new products 1.085 4 .271 .443 .777 .006 1.774 .154
Launches of services/products .687 4 .172 .211 .932 .003 .844 .095
Lower defects .441 4 .110 .138 .968 .002 .553 .079
Interaction counts 2.055 4 .514 .853 .492 .012 3.413 .271

International Journal of Management Studies ISSN(Print) 2249-0302 ISSN (Online)2231-2528 http://www.researchersworld.com/ijms/
Vol.–V, Issue –2(4), April 2018 [115]
Source Dependent Variable
Type III
Sum of
Squares
df Mean
Square F Sig.
Partial
Eta
Squared
Noncent
Parameter
Observed
Powerl
Resolution rates .914 4 .229 .314 .869 .004 1.256 .120
Call volume 3.857 4 .964 1.686 .153 .023 6.744 .515
Current sales revenue 1.533 4 .383 .666 .616 .009 2.664 .216
Previous period sales revenue .461 4 .115 .194 .941 .003 .776 .091
Flexible_
working_
arrangeme
nts_Work_from_Ho
mesuitabl
e_location
_
Employees 1.518 4 .379 .530 .714 .007 2.118 .177
Employees 4.478 4 1.120 1.562 .184 .021 6.250 .481
Meeting more customer targets
than before in each quarter 2.037 4 .509 .857 .490 .012 3.428 .272
Intensity of new products 3.399 4 .850 1.389 .238 .019 5.557 .431
Launches of services/products 3.769 4 .942 1.158 .330 .016 4.631 .362
Lower defects 2.851 4 .713 .893 .468 .012 3.573 .283
Interaction counts .438 4 .110 .182 .948 .003 .729 .089
Resolution rates 2.392 4 .598 .821 .512 .011 3.286 .262
Call volume 2.124 4 .531 .928 .448 .013 3.714 .294
Current sales revenue 9.864 4 2.466 4.286 .002 .056 17.143 .927
Previous period sales revenue 4.692 4 1.173 1.977 .098 .027 7.909 .591
Autonom
y_in_taking_work_
decisions
Employees 1.021 4 .255 .356 .840 .005 1.424 .131
Employees .545 4 .136 .190 .943 .003 .761 .090
Meeting more customer targets than before in each quarter
.061 4 .015 .026 .999 .000 .103 .055
Intensity of new products .433 4 .108 .177 .950 .002 .708 .087
Launches of services/products 1.919 4 .480 .589 .671 .008 2.358 .194
Lower defects .508 4 .127 .159 .959 .002 .637 .083
Interaction counts .370 4 .093 .154 .961 .002 .615 .082
Resolution rates 2.195 4 .549 .754 .556 .010 3.015 .242
Call volume .795 4 .199 .347 .846 .005 1.390 .129
Current sales revenue 7.401 4 1.850 3.216 .013 .043 12.863 .826
Previous period sales revenue 5.995 4 1.499 2.526 .041 .034 10.106 .713
Say_in_organization
al_decisio
ns
Employees 2.312 4 .578 .807 .522 .011 3.226 .257
Employees 1.095 4 .274 .382 .821 .005 1.528 .138
Meeting more customer targets
than before in each quarter .981 4 .245 .412 .800 .006 1.650 .146
Intensity of new products .668 4 .167 .273 .895 .004 1.093 .110
Launches of services/products 3.046 4 .762 .936 .444 .013 3.743 .296
Lower defects 4.013 4 1.003 1.257 .287 .017 5.029 .392
Interaction counts .204 4 .051 .085 .987 .001 .339 .067
Resolution rates 3.268 4 .817 1.122 .346 .015 4.489 .352
Call volume .254 4 .064 .111 .979 .002 .444 .073
Current sales revenue 1.319 4 .330 .573 .682 .008 2.292 .190
Previous period sales revenue 6.705 4 1.676 2.826 .025 .038 11.304 .767
Error
Employees 205.627 287 .716
Employees 205.638 287 .717
Meeting more customer targets
than before in each quarter 170.557 287 .594
Intensity of new products 175.548 287 .612
Launches of services/products 233.574 287 .814
Lower defects 229.015 287 .798
Interaction counts 172.747 287 .602
Resolution rates 208.965 287 .728
Call volume 164.146 287 .572
Current sales revenue 165.129 287 .575
Previous period sales revenue 170.244 287 .593
Total
Employees 5121.000 370
Employees 4920.000 370
Meeting more customer targets than before in each quarter
4706.000 370
Intensity of new products 4242.000 370
Launches of services/products 3960.000 370
Lower defects 3925.000 370
Interaction counts 4739.000 370
Resolution rates 3978.000 370
Call volume 5855.000 370
International Journal of Management Studies ISSN(Print) 2249-0302 ISSN (Online)2231-2528 http://www.researchersworld.com/ijms/
Vol.–V, Issue –2(4), April 2018 [116]
Source Dependent Variable
Type III
Sum of
Squares
df Mean
Square F Sig.
Partial
Eta
Squared
Noncent
Parameter
Observed
Powerl
Current sales revenue 1981.000 370
Previous period sales revenue 2178.000 370
Corrected
Total
Employees 260.781 369
Employees 281.892 369
Meeting more customer targets
than before in each quarter 236.281 369
Intensity of new products 245.632 369
Launches of services/products 348.281 369
Lower defects 319.527 369
Interaction counts 248.403 369
Resolution rates 316.119 369
Call volume 242.889 369
Current sales revenue 374.403 369
Previous period sales revenue 448.270 369
a. R Squared = .211 (Adjusted R Squared = -.014)
b. R Squared = .271 (Adjusted R Squared = .062)
c. R Squared = .278 (Adjusted R Squared = .072)
d. R Squared = .285 (Adjusted R Squared = .081)
e. R Squared = .329 (Adjusted R Squared = .138)
f. R Squared = .283 (Adjusted R Squared = .078)
g. R Squared = .305 (Adjusted R Squared = .106)
h. R Squared = .339 (Adjusted R Squared = .150)
i. R Squared = .324 (Adjusted R Squared = .131)
j. R Squared = .559 (Adjusted R Squared = .433)
k. R Squared = .620 (Adjusted R Squared = .512)
l. Computed using alpha = .05
Multivariate Testsa
Effect Value F Hypothesis
df Error df Sig.
Partial
Eta
Squared
Noncent.
Parameter
Observed
Powerd
Intercept
Pillai's Trace .666 50.137b 11.000 277.000 .000 .666 551.507 1.000
Wilks' Lambda .334 50.137b 11.000 277.000 .000 .666 551.507 1.000
Hotelling's
Trace 1.991 50.137b 11.000 277.000 .000 .666 551.507 1.000
Roy's Largest
Root 1.991 50.137b 11.000 277.000 .000 .666 551.507 1.000
Use_of_Learning_tec
hnologiessuch_as_w
ebcasts_and_largeco
hort_l
Pillai's Trace .041 1.078b 11.000 277.000 .379 .041 11.857 .594
Wilks' Lambda .959 1.078b 11.000 277.000 .379 .041 11.857 .594
Hotelling's
Trace .043 1.078b 11.000 277.000 .379 .041 11.857 .594
Roy's Largest
Root .043 1.078b 11.000 277.000 .379 .041 11.857 .594
From_multiyear_proj
ect_design_and_rollouts_to_fast_design_i
mp
Pillai's Trace .079 2.153b 11.000 277.000 .017 .079 23.685 .925
Wilks' Lambda .921 2.153b 11.000 277.000 .017 .079 23.685 .925
Hotelling's
Trace .086 2.153b 11.000 277.000 .017 .079 23.685 .925
Roy's Largest
Root .086 2.153b 11.000 277.000 .017 .079 23.685 .925
Unlocking_human_p
otential_through_the
_practise_of_Exercis
es_and_
Pillai's Trace .049 1.285b 11.000 277.000 .233 .049 14.130 .690
Wilks' Lambda .951 1.285b 11.000 277.000 .233 .049 14.130 .690
Hotelling's
Trace .051 1.285b 11.000 277.000 .233 .049 14.130 .690
Roy's Largest
Root .051 1.285b 11.000 277.000 .233 .049 14.130 .690
Clear_understandabl
e_HR_policies_to_balance_the_interest_b
etween
Pillai's Trace .089 1.180 22.000 556.000 .259 .045 25.968 .871
Wilks' Lambda .913 1.177b 22.000 554.000 .263 .045 25.883 .870
Hotelling's Trace
.093 1.173 22.000 552.000 .266 .045 25.799 .868
Roy's Largest .053 1.328c 11.000 278.000 .208 .050 14.613 .709
International Journal of Management Studies ISSN(Print) 2249-0302 ISSN (Online)2231-2528 http://www.researchersworld.com/ijms/
Vol.–V, Issue –2(4), April 2018 [117]
Effect Value F Hypothesis
df Error df Sig.
Partial
Eta
Squared
Noncent.
Parameter
Observed
Powerd
Root
Offer_more_Training
__Development
Pillai's Trace .110 1.477 22.000 556.000 .075 .055 32.495 .948
Wilks' Lambda .892 1.478b 22.000 554.000 .075 .055 32.525 .948
Hotelling's
Trace .118 1.480 22.000 552.000 .074 .056 32.554 .949
Roy's Largest
Root .083 2.090c 11.000 278.000 .021 .076 22.988 .916
Increase_Employee_Engagement_like_eff
ective_Communicati
on_gifts
Pillai's Trace .080 1.048 22.000 556.000 .402 .040 23.059 .815
Wilks' Lambda .922 1.050b 22.000 554.000 .399 .040 23.105 .816
Hotelling's Trace
.084 1.052 22.000 552.000 .397 .040 23.150 .817
Roy's Largest Root
.064 1.616c 11.000 278.000 .094 .060 17.781 .811
Evaluate_employee_
onboarding
Pillai's Trace .081 2.231b 11.000 277.000 .013 .081 24.540 .935
Wilks' Lambda .919 2.231b 11.000 277.000 .013 .081 24.540 .935
Hotelling's
Trace .089 2.231b 11.000 277.000 .013 .081 24.540 .935
Roy's Largest
Root .089 2.231b 11.000 277.000 .013 .081 24.540 .935
Employer_branding_to_ensure_that_right
_talent_is_attracted_t
o_th
Pillai's Trace .073 .963 22.000 556.000 .510 .037 21.196 .770
Wilks' Lambda .927 .967b 22.000 554.000 .505 .037 21.279 .772
Hotelling's Trace
.077 .971 22.000 552.000 .500 .037 21.362 .774
Roy's Largest Root
.063 1.597c 11.000 278.000 .099 .059 17.564 .805
Top_down_transpare
ncy_and_speed_of_information_sharing_
–_both_go
Pillai's Trace .132 1.787 22.000 556.000 .015 .066 39.309 .982
Wilks' Lambda .872 1.788b 22.000 554.000 .015 .066 39.334 .982
Hotelling's
Trace .143 1.789 22.000 552.000 .015 .067 39.357 .982
Roy's Largest
Root .097 2.442c 11.000 278.000 .006 .088 26.859 .957
Use_of_social_media
__job_portals_Linke
dIn_indeed_Naukri_
etc#
Pillai's Trace .072 .940 22.000 556.000 .541 .036 20.678 .756
Wilks' Lambda .929 .938b 22.000 554.000 .545 .036 20.628 .755
Hotelling's
Trace .075 .935 22.000 552.000 .548 .036 20.578 .754
Roy's Largest
Root .047 1.186c 11.000 278.000 .296 .045 13.044 .646
Redesigned_intervie
w_strategy_like_video_conferencing
Pillai's Trace .093 1.239 22.000 556.000 .208 .047 27.265 .891
Wilks' Lambda .909 1.236b 22.000 554.000 .210 .047 27.196 .890
Hotelling's
Trace .098 1.233 22.000 552.000 .213 .047 27.127 .889
Roy's Largest
Root .060 1.506c 11.000 278.000 .129 .056 16.567 .775
On_the_job_Degree
Diploma_course_
Pillai's Trace .054 .707 22.000 556.000 .835 .027 15.554 .592
Wilks' Lambda .946 .705b 22.000 554.000 .836 .027 15.521 .591
Hotelling's
Trace .056 .704 22.000 552.000 .838 .027 15.487 .589
Roy's Largest
Root .037 .941c 11.000 278.000 .501 .036 10.351 .523
Intraorganization_work_exposure
Pillai's Trace .104 1.390 22.000 556.000 .111 .052 30.580 .931
Wilks' Lambda .898 1.388b 22.000 554.000 .112 .052 30.535 .931
Hotelling's
Trace .110 1.386 22.000 552.000 .113 .052 30.490 .930
Roy's Largest
Root .071 1.794c 11.000 278.000 .055 .066 19.739 .858
Interorganization_wo
rk_exposure_
Pillai's Trace .084 1.110 22.000 556.000 .331 .042 24.415 .843
Wilks' Lambda .917 1.109b 22.000 554.000 .332 .042 24.394 .843
Hotelling's
Trace .088 1.108 22.000 552.000 .333 .042 24.373 .842
Roy's Largest
Root .060 1.518c 11.000 278.000 .124 .057 16.696 .779
Working_under_chal Pillai's Trace .092 1.216 22.000 556.000 .227 .046 26.752 .884
International Journal of Management Studies ISSN(Print) 2249-0302 ISSN (Online)2231-2528 http://www.researchersworld.com/ijms/
Vol.–V, Issue –2(4), April 2018 [118]
Effect Value F Hypothesis
df Error df Sig.
Partial
Eta
Squared
Noncent.
Parameter
Observed
Powerd
lenging_projects_ Wilks' Lambda .910 1.212b 22.000 554.000 .231 .046 26.657 .882
Hotelling's Trace
.096 1.207 22.000 552.000 .234 .046 26.563 .881
Roy's Largest
Root .051 1.279c 11.000 278.000 .236 .048 14.073 .688
Online_learning_mec
hanisms_anytime_anywhere
Pillai's Trace .088 1.157 22.000 556.000 .281 .044 25.462 .862
Wilks' Lambda .914 1.161b 22.000 554.000 .278 .044 25.542 .864
Hotelling's
Trace .093 1.165 22.000 552.000 .274 .044 25.620 .865
Roy's Largest
Root .072 1.815c 11.000 278.000 .051 .067 19.968 .863
Incentivereward_pay
outs_rather_than_inc
rease_in_salary_ever
y_ye
Pillai's Trace .107 1.423 22.000 556.000 .096 .053 31.309 .938
Wilks' Lambda .896 1.427b 22.000 554.000 .094 .054 31.396 .939
Hotelling's Trace
.114 1.431 22.000 552.000 .093 .054 31.481 .940
Roy's Largest Root
.085 2.138c 11.000 278.000 .018 .078 23.517 .923
Caregiving_Benefits
_Paid_timeofffamily
_leave_for_new_parents
Pillai's Trace .122 1.078 33.000 837.000 .352 .041 35.569 .933
Wilks' Lambda .881 1.089 33.000 816.797 .337 .041 35.287 .930
Hotelling's
Trace .132 1.101 33.000 827.000 .321 .042 36.318 .939
Roy's Largest
Root .097 2.461c 11.000 279.000 .006 .088 27.070 .958
Effective_Health__Safety_Programs_like
_on_site_activity_cla
sses
Pillai's Trace .168 1.500 33.000 837.000 .036 .056 49.499 .991
Wilks' Lambda .840 1.504 33.000 816.797 .035 .056 48.712 .990
Hotelling's Trace
.180 1.507 33.000 827.000 .035 .057 49.738 .991
Roy's Largest
Root .106 2.680c 11.000 279.000 .003 .096 29.482 .973
Coaching_and_huma
n_development_appr
oach_Timely_and_co
ntinuous_f
Pillai's Trace .128 1.132 33.000 837.000 .281 .043 37.351 .947
Wilks' Lambda .877 1.130 33.000 816.797 .284 .043 36.594 .941
Hotelling's
Trace .135 1.127 33.000 827.000 .287 .043 37.198 .946
Roy's Largest
Root .071 1.803c 11.000 279.000 .053 .066 19.837 .860
Simple_Performance
_management_syste
ms_Minimise_form_
filling_and
Pillai's Trace .084 1.109 22.000 556.000 .332 .042 24.396 .843
Wilks' Lambda .918 1.107b 22.000 554.000 .334 .042 24.351 .842
Hotelling's
Trace .088 1.105 22.000 552.000 .336 .042 24.306 .841
Roy's Largest
Root .057 1.434c 11.000 278.000 .157 .054 15.772 .750
Performance_related_Rewards__Bonuses
Pillai's Trace .047 .612 22.000 556.000 .917 .024 13.463 .512
Wilks' Lambda .953 .610b 22.000 554.000 .918 .024 13.420 .510
Hotelling's
Trace .048 .608 22.000 552.000 .920 .024 13.378 .509
Roy's Largest
Root .029 .732c 11.000 278.000 .708 .028 8.049 .405
Onesizebreaksall_Sp
ending_time_with_in
dividual_employees_
and
Pillai's Trace .047 .408 33.000 837.000 .999 .016 13.465 .423
Wilks' Lambda .953 .407 33.000 816.797 .999 .016 13.181 .413
Hotelling's
Trace .049 .406 33.000 827.000 .999 .016 13.388 .420
Roy's Largest
Root .026 .663c 11.000 279.000 .773 .025 7.288 .365
Digital_workplace_strategy
Pillai's Trace .097 1.294 22.000 556.000 .167 .049 28.466 .908
Wilks' Lambda .904 1.300b 22.000 554.000 .163 .049 28.603 .909
Hotelling's
Trace .104 1.306 22.000 552.000 .159 .049 28.738 .911
Roy's Largest
Root .082 2.078c 11.000 278.000 .022 .076 22.858 .914
Motivational_Talks
Pillai's Trace .062 .809 22.000 556.000 .716 .031 17.792 .670
Wilks' Lambda .939 .806b 22.000 554.000 .719 .031 17.737 .668
Hotelling's .064 .804 22.000 552.000 .723 .031 17.682 .666

International Journal of Management Studies ISSN(Print) 2249-0302 ISSN (Online)2231-2528 http://www.researchersworld.com/ijms/
Vol.–V, Issue –2(4), April 2018 [119]
Effect Value F Hypothesis
df Error df Sig.
Partial
Eta
Squared
Noncent.
Parameter
Observed
Powerd
Trace
Roy's Largest Root
.038 .957c 11.000 278.000 .486 .036 10.528 .531
Use_of_Artificial_int
elligence
Pillai's Trace .097 1.282 22.000 556.000 .175 .048 28.211 .904
Wilks' Lambda .904 1.298b 22.000 554.000 .165 .049 28.545 .909
Hotelling's
Trace .105 1.313 22.000 552.000 .155 .050 28.876 .913
Roy's Largest
Root .093 2.350c 11.000 278.000 .009 .085 25.846 .948
Job_rotation
Pillai's Trace .213 1.430 44.000 1120.000 .036 .053 62.905 .997
Wilks' Lambda .800 1.448 44.000 1061.687 .031 .054 60.843 .996
Hotelling's Trace
.234 1.465 44.000 1102.000 .027 .055 64.455 .998
Roy's Largest Root
.145 3.684c 11.000 280.000 .000 .126 40.525 .997
Sideways_promotion
Pillai's Trace .139 .917 44.000 1120.000 .627 .035 40.365 .938
Wilks' Lambda .867 .914 44.000 1061.687 .632 .035 38.452 .922
Hotelling's
Trace .146 .912 44.000 1102.000 .638 .035 40.108 .936
Roy's Largest
Root .065 1.650c 11.000 280.000 .085 .061 18.151 .821
Multiple_skills_deve
lopment
Pillai's Trace .183 1.223 44.000 1120.000 .154 .046 53.809 .990
Wilks' Lambda .827 1.230 44.000 1061.687 .148 .046 51.692 .986
Hotelling's Trace
.197 1.236 44.000 1102.000 .142 .047 54.374 .990
Roy's Largest Root
.107 2.724c 11.000 280.000 .002 .097 29.965 .976
Flexible_working_ar
rangements_Work_from_Homesuitable_lo
cation_
Pillai's Trace .202 1.355 44.000 1120.000 .063 .051 59.614 .996
Wilks' Lambda .811 1.355 44.000 1061.687 .063 .051 56.954 .993
Hotelling's
Trace .216 1.354 44.000 1102.000 .063 .051 59.584 .996
Roy's Largest
Root .104 2.643c 11.000 280.000 .003 .094 29.069 .971
Autonomy_in_taking
_work_decisions
Pillai's Trace .115 .757 44.000 1120.000 .877 .029 33.296 .864
Wilks' Lambda .889 .757 44.000 1061.687 .876 .029 31.839 .841
Hotelling's
Trace .121 .758 44.000 1102.000 .876 .029 33.339 .864
Roy's Largest
Root .068 1.741c 11.000 280.000 .064 .064 19.156 .845
Say_in_organizational_decisions
Pillai's Trace .155 1.023 44.000 1120.000 .432 .039 45.011 .965
Wilks' Lambda .853 1.025 44.000 1061.687 .428 .039 43.105 .956
Hotelling's
Trace .164 1.027 44.000 1102.000 .424 .039 45.205 .966
Roy's Largest
Root .091 2.322c 11.000 280.000 .010 .084 25.538 .945
----