role of ct and mri in abdominal tuberculosis...abdominal ct imaging (a joshi, section editor) role...
TRANSCRIPT
ABDOMINAL CT IMAGING (A JOSHI, SECTION EDITOR)
Role of CT and MRI in Abdominal Tuberculosis
Anagha R. Joshi • Ashish S. Basantani •
Tapan C. Patel
Published online: 10 September 2014
� Springer Science+Business Media New York 2014
Abstract Abdominal tuberculosis is a grave infection
resulting in high morbidity and mortality if left untreated.
The diagnostic approach to this disease has drastically
changed since arrival of modern CT scan. Role of MRI for
the diagnosis is yet to be fully established and is in early
stages. In future, patient profile, diagnostic information
required, merits and demerits of both the technologies will
determine their utility. The purpose of this article is to
review CT and MR imaging findings in abdominal
tuberculosis.
Keywords CT � MRI � Tuberculosis
Introduction
Tuberculosis has high prevalence in densely populated
regions predominantly in developing countries. Immigra-
tion and HIV prevalence have led to its persistence in
developed countries. Factors which have led to its spread
and persistence are myriad in nature some of them which
include
(a) Age In our country 80 % of TB cases are seen in
15–54 age group [1]. While two-thirds of cases are
males, among females, TB is disproportionately seen
more in young with 50 % of cases seen before the age
34 years [2].
(b) Sex TB is more prevalent in males than females.
However, abdominal TB cases show female predom-
inance [3, 4] in some studies, whereas others suggest
equal incidence [3, 4].
(c) Concomitant medical conditions HIV is the most
important risk factor for developing active tuberculo-
sis. The risk is estimated to be between 21 and 34
times greater in people living with HIV than among
those without HIV infection [5].
Other disease states that increase the risk of developing
tuberculosis are diabetes mellitus, Hodgkin’s lymphoma,
end-stage renal disease, chronic lung disease, malnutrition,
and alcoholism [6], vitamin D deficiency, etc. [6–8]. Pro-
longed corticosteroid therapy and other immunosuppres-
sant drugs also increase the risk.
Computed Tomography (CT Scan)
The introduction of spiral (helical) CT in the late 1980s
revolutionized CT imaging of the gastrointestinal tract by
allowing faster scanning, thinner collimation (3–5 mm)
and faster reconstruction times, as well as volume acqui-
sition. For the first time, CT did not consist of merely a
series of slices, but as a complete volume of information.
This paradigm shift led to the introduction of 3D imaging
with images of equal spatial resolution to be obtained in
any plane which greatly expanded the clinical role of CT. It
was at this time in which CT began to play a more serious
This article is part of Topical Collection on Abdominal CT Imaging.
A. R. Joshi (&) � T. C. Patel
LTMMC & LTMGH, Sion, Mumbai, India
e-mail: [email protected]
T. C. Patel
e-mail: [email protected]
A. S. Basantani
Rajawadi Hospital, Ghatkopar, Mumbai, India
e-mail: [email protected]
123
Curr Radiol Rep (2014) 2:66
DOI 10.1007/s40134-014-0066-8
role in evaluation of gastrointestinal tract pathology,
although barium studies were still the first line of imaging
for most indications.
Today, the availability of MDCT along with advance-
ments in 3D CT imaging systems has greatly expanded the
role of CT in evaluation of suspected bowel pathology. CT
is now considered a first-line modality for the evaluation of
a wide variety of bowel diseases.
In contrast to barium studies, CT offers the unique
ability to evaluate extraluminal, peritoneal, nodal, and
visceral involvement in a single examination which proves
to be a major benefit in diagnosing abdominal tuberculosis.
Magnetic Resonance Imaging
MRI of abdomen has been primarily used for evaluation of
solid organs like liver, spleen, pancreas, kidney, and
adrenal glands because of its superior soft tissue resolution
and multiplanar acquisition. However, its role in evaluation
for bowel pathologies has been limited to assessment of
ano-rectal abnormalities. Severe artefacts related to intes-
tinal peristalsis, breathing and long acquisition time caused
degradation of images, thus impeding the evaluation of
intestinal pathologies. New advances, such as respiratory
compensation, breath hold acquisition, fat suppression, and
orally administered contrast agents allow us to obtain high
quality MR images through the entire abdomen. Recently,
some studies have investigated the value of MRI for the
evaluation of small and large intestines, and this modality
has become increasingly important in the diagnosis,
assessment, and exclusion of small and large bowel
diseases.
MRI studies of small bowel have been primarily done to
evaluate inflammatory bowel diseases like Crohn’s disease.
MRI provides good anatomic and functional evaluation of
bowel loops without any exposure to ionizing radiation.
Although, MRI study is routinely done to evaluate
tuberculosis of spine, brain, and extremity joints, very few
studies have been done to evaluate its role in abdominal
tuberculosis. Also, the imaging findings of gastrointestinal
tuberculosis using barium enema, ultrasound, and CT have
been well described [4, 5]. However, very few previous
reports have focused on the MR imaging findings of
tuberculosis of the gastrointestinal tract.
Abdominal Tuberculosis
Abdominal tuberculosis denotes involvement of the gas-
trointestinal tract, peritoneum, lymph nodes, and solid
viscera. It is the sixth common extra-pulmonary form of
TB after lymphatic, genitourinary, bone and joint, miliary
and meningeal tuberculosis [9, 10].
Infection by Mycobacterium tuberculosis causing
abdominal tuberculosis is acquired in following ways:
(1) Dissemination of primary pulmonary tuberculosis in
childhood.
(2) Swallowing of infected sputum in active pulmonary
tuberculosis.
(3) Hematogenous dissemination from a focus of active
pulmonary tuberculosis or miliary tuberculosis.
(4) Mycobacteria can spread from infected adjacent
organs like fallopian tubes.
(5) Intestinal infection can occur by lymphatic spread
from infected mesenteric lymph nodes.
(6) Mycobacteria can also get disseminated through bile
from tubercular granulomas of the liver.
Tuberculous Lymphadenitis
Tuberculous lymphadenopathy is the most common man-
ifestation of abdominal tuberculosis and occurs in 25–93 %
of cases [11]. The mesenteric, omental, peripancreatic and
upper paraaortic lymph nodes are frequently involved
which is explained by lymphatic drainage from the main
areas of infection: small bowel, ileocecum, right side of the
colon, liver and spleen. Lower paraaortic lymph nodes
involvement is very rare and is seen in systemic hema-
togenous spread or from direct spread from the reproduc-
tive organs.
Pathologically tuberculous infection of a lymph node
follows a spectrum from early exudative to caseous to late
fibro-calcification phases.
CT
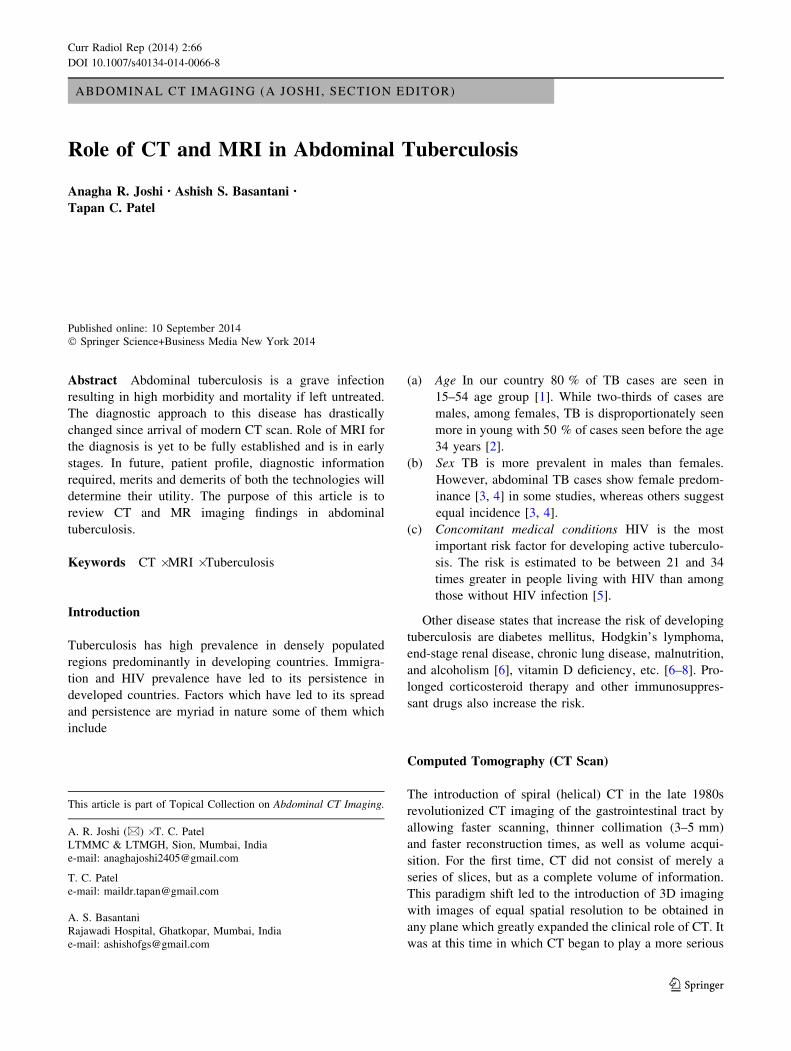
Four types of contrast patterns have been described by
Pombo et al. [12] on contrast-enhanced CT in patients of
abdominal tuberculosis:
(a) peripheral rim enhancement with hypodense centers,
(b) inhomogeneous enhancement,
(c) homogeneous enhancement and
(d) nonenhancing nodes
They concluded that, neither the nodal attenuation
values nor the patterns of enhancement are charac-
teristic of tuberculosis; however, adenopathy showing
peripheral rim-enhancement with relative low atten-
uation centers can suggest a diagnosis of tuberculo-
sis in appropriate clinical settings.
Lymph nodes showing peripheral enhancement with
hypodense centers, secondary to caseous and/or
66 Page 2 of 16 Curr Radiol Rep (2014) 2:66
123
liquefactive necrosis were the most common group.
Other patterns [13] include:
(e) Conglomerate lymph node masses with areas of
necrosis secondary to perinodal inflammation.
(f) Increased number ([3 in one CT section) of normal
sized or mildly enlarged mesenteric nodes of homo-
geneous density.
(g) Calcified lymph nodes (Fig. 1a–f)
Lymph nodes with hypodense centers are also seen in
metastatic malignancy, lymphoma after treatment, inflam-
matory conditions (such as Crohn’s disease), pyogenic
infection and Whipple’s disease, however, other imaging
findings and clinical features are helpful in diagnosis [13].
Similarly, calcified lymph nodes are also seen in
metastases from teratomatous testicular tumors and non-
Hodgkins lymphoma after treatment [14]. However, nodal
calcification in patients from endemic areas in the absence
of known primary malignancy suggests a tuberculous eti-
ology [15].
MRI
In 2005 De Backer et al. [16•] studied MRI features of
abdominal lymphadenopathy in 13 patients.
MR signal intensities of 41 lymph nodes studied were as
follows
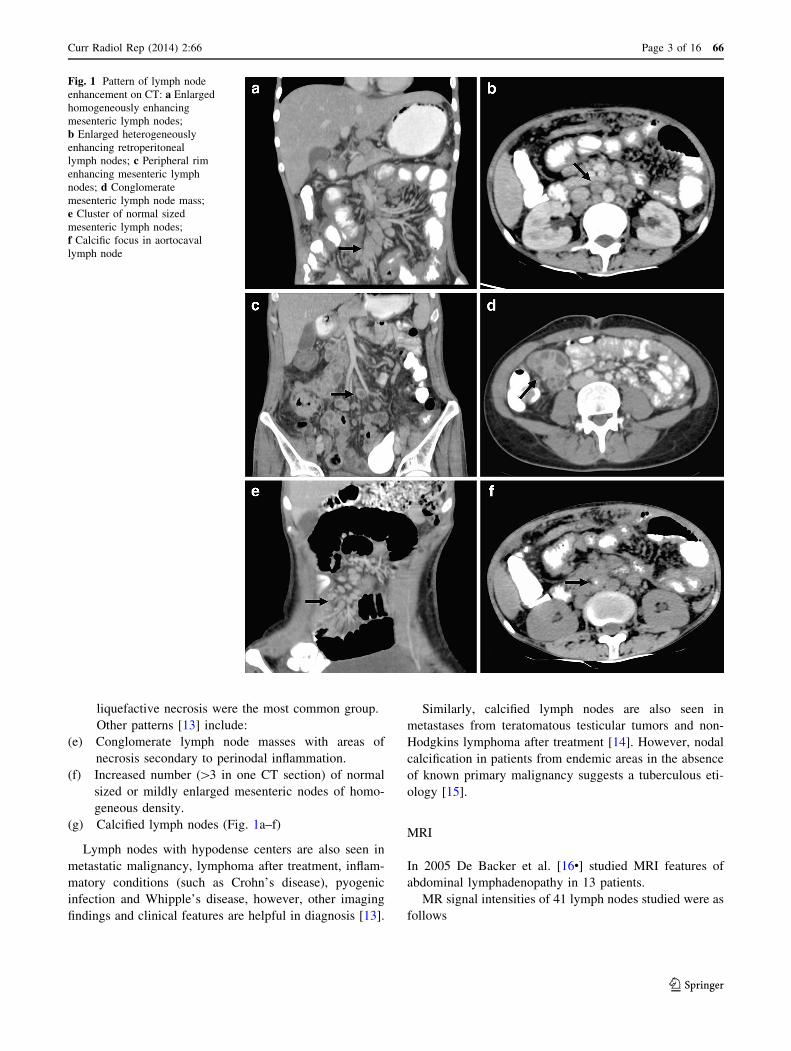
Fig. 1 Pattern of lymph node
enhancement on CT: a Enlarged
homogeneously enhancing
mesenteric lymph nodes;
b Enlarged heterogeneously
enhancing retroperitoneal
lymph nodes; c Peripheral rim
enhancing mesenteric lymph
nodes; d Conglomerate
mesenteric lymph node mass;
e Cluster of normal sized
mesenteric lymph nodes;
f Calcific focus in aortocaval
lymph node
Curr Radiol Rep (2014) 2:66 Page 3 of 16 66
123
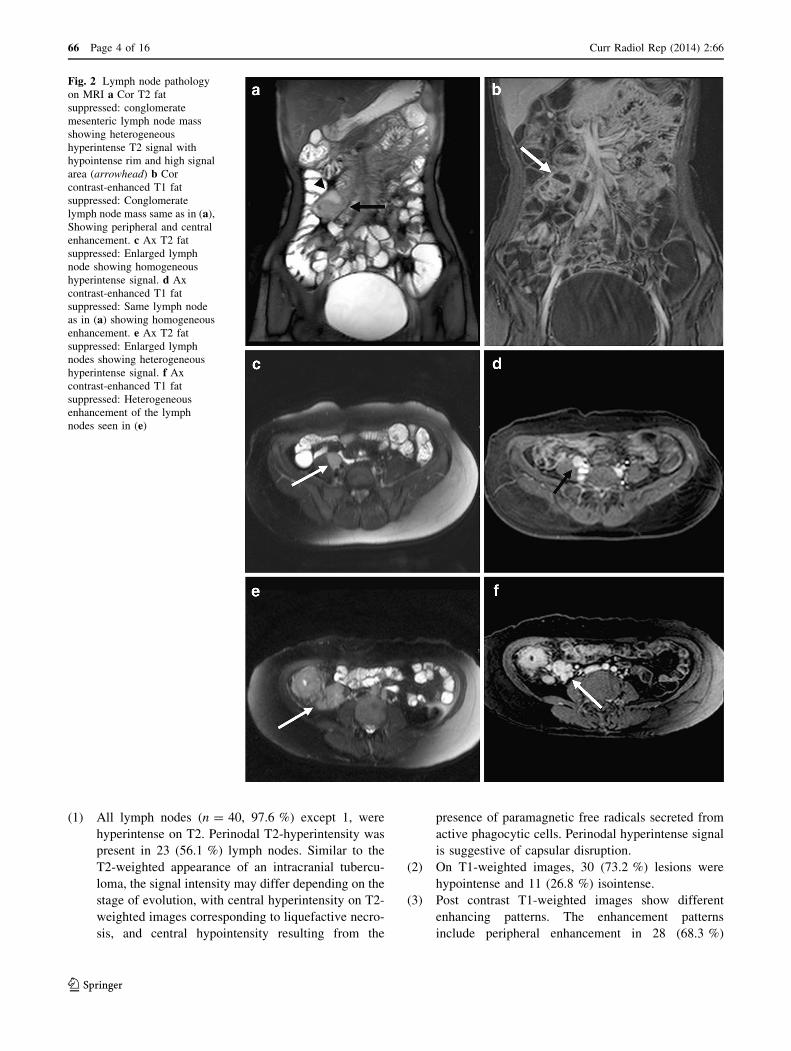
(1) All lymph nodes (n = 40, 97.6 %) except 1, were
hyperintense on T2. Perinodal T2-hyperintensity was
present in 23 (56.1 %) lymph nodes. Similar to the
T2-weighted appearance of an intracranial tubercu-
loma, the signal intensity may differ depending on the
stage of evolution, with central hyperintensity on T2-
weighted images corresponding to liquefactive necro-
sis, and central hypointensity resulting from the
presence of paramagnetic free radicals secreted from
active phagocytic cells. Perinodal hyperintense signal
is suggestive of capsular disruption.
(2) On T1-weighted images, 30 (73.2 %) lesions were
hypointense and 11 (26.8 %) isointense.
(3) Post contrast T1-weighted images show different
enhancing patterns. The enhancement patterns
include peripheral enhancement in 28 (68.3 %)
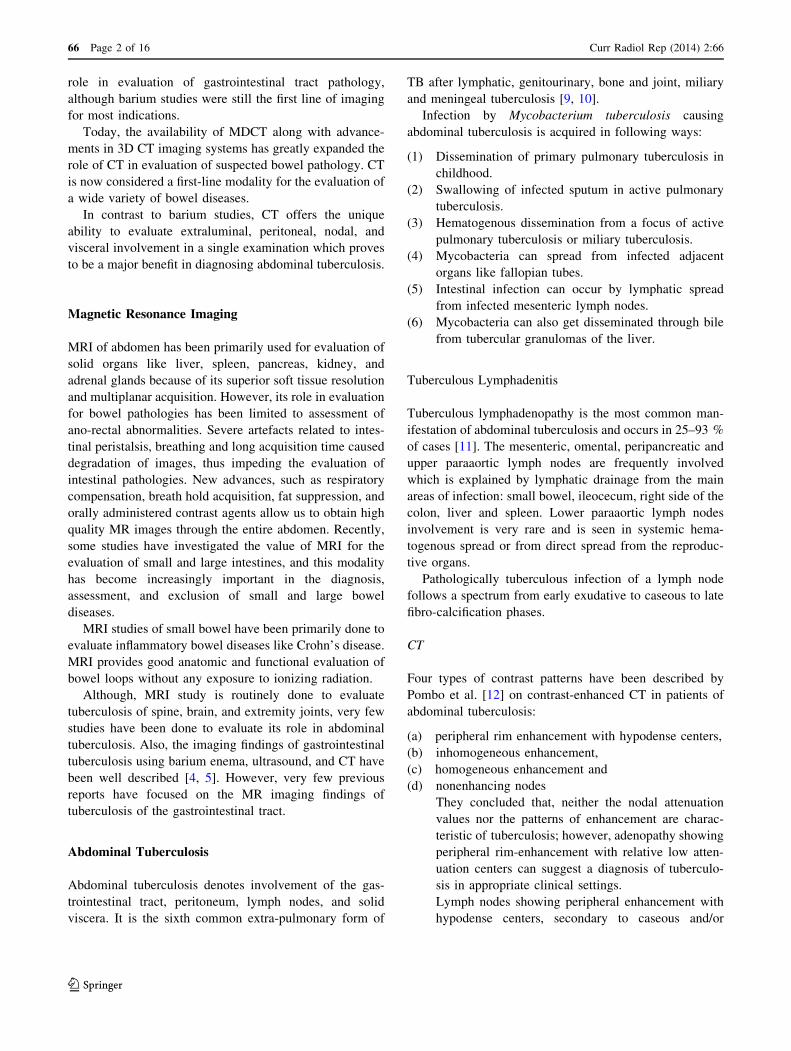
Fig. 2 Lymph node pathology
on MRI a Cor T2 fat
suppressed: conglomerate
mesenteric lymph node mass
showing heterogeneous
hyperintense T2 signal with
hypointense rim and high signal
area (arrowhead) b Cor
contrast-enhanced T1 fat
suppressed: Conglomerate
lymph node mass same as in (a),
Showing peripheral and central
enhancement. c Ax T2 fat
suppressed: Enlarged lymph
node showing homogeneous
hyperintense signal. d Ax
contrast-enhanced T1 fat
suppressed: Same lymph node
as in (a) showing homogeneous
enhancement. e Ax T2 fat
suppressed: Enlarged lymph
nodes showing heterogeneous
hyperintense signal. f Ax
contrast-enhanced T1 fat
suppressed: Heterogeneous
enhancement of the lymph
nodes seen in (e)
66 Page 4 of 16 Curr Radiol Rep (2014) 2:66
123

patients visible as uniform, thin or thick, complete or
incomplete rim like, and a conglomerate group of
nodes showing peripheral and central areas of
enhancement. Heterogeneous and homogeneous
enhancements were present in 10 (24.4 %) and 3
(7.3 %) lymph nodes, respectively.
In our experience, lymph nodes were involved in 90 %
patients and peripheral and heterogeneously enhancing
lymph node groups showed equal incidence. On MRI lymph
nodes showed predominantly heterogeneous hyperintense
signal with some of them showing perinodal hyperintnesity
suggestive of capsular disruption on T2W sequences
(Fig. 2). On T1 W sequence, hypointense lymph nodes
showed peripheral enhancement and isointense lymph nodes
showed homogeneous enhancement. (Fig. 2a–d)
Comparison of lymph nodes having necrosis was made
between MRI and CT. The largest lymph node showing
areas of necrosis was compared on plain, contrast CT and
plain, contrast MRI. Lymph nodes showing peripheral
enhancement with central nonenhancing necrotic area were
included for comparison. Findings are as follows:
Computed
tomography (CT)
Magnetic resonance imaging
(MRI)
Plain
CT
Contrast-
enhanced
CT
Plain
MRI (T2
weighted)
Contrast-enhanced
MRI (Post contrast
T1 fat suppressed)
No. of
patients
3
(25 %)
12
(100 %)
9 (75 %) 12 (100 %)
Thus, in our experience plain MRI is more sensitive than
plain CT, also lymph nodes with post contrast enhancement
are better visualized on MRI compared to CT due to better
soft tissue resolution.
Gastrointestinal TB
The gastrointestinal tract is involved in 65–78 % of the
abdominal TB cases [17].
Tuberculosis can involve any part of the gastrointestinal
tract from mouth to anus, the peritoneum and the pan-
creatico-biliary system. Clinical presentation is often con-
fusing with other common and rare diseases due to non-
specific symptoms.
Disease within any part of the GI tract itself has two
main forms: [1] an ulcerative process and [2] a hyperplastic
reaction.
By far, the commonest site of involvement in the bowel
is the terminal ileum and the ileocecal region, as shown by
the high incidence of involvement of these regions in the
different series [18–21]; possibly because of the increased
physiological stasis, increased rate of fluid and electrolyte
absorption, minimal digestive activity and an abundance of
lymphoid tissue at this site.
CT
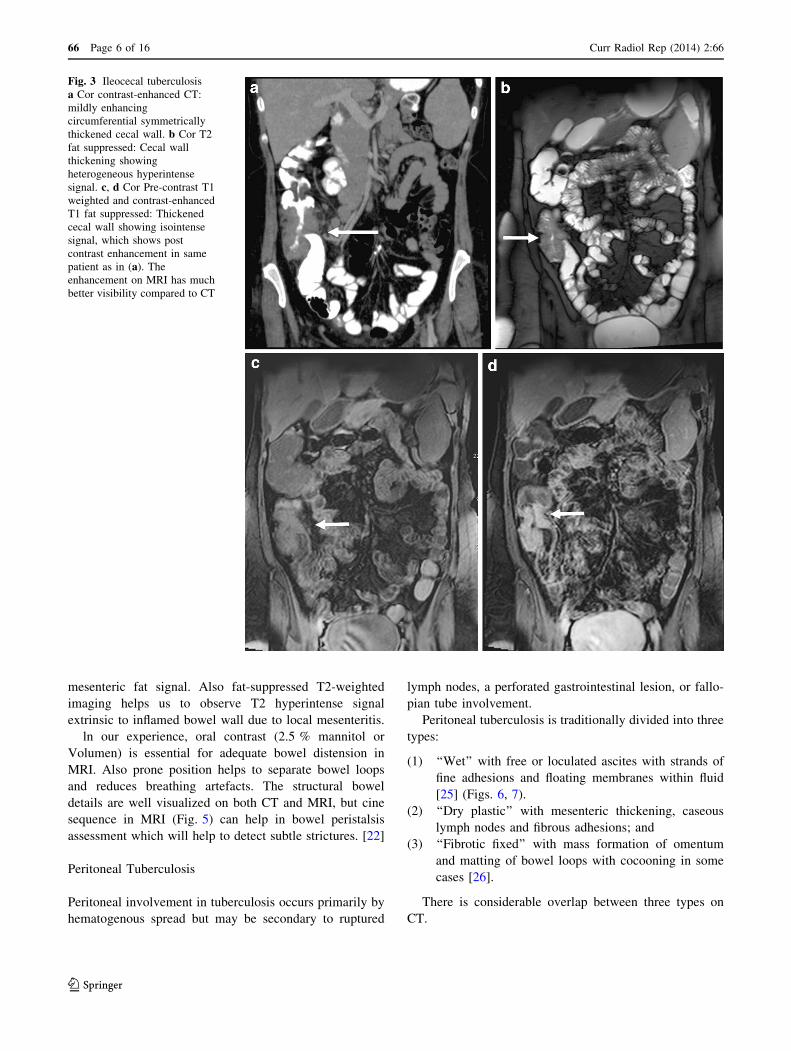
The most common CT finding is mural thickening affecting
the ileocecal region, either limited to the terminal ileum or
cecum or, more commonly, involving both regions simul-
taneously, associated with pericecal fat stranding. The
degree of bowel wall thickening may vary from slight at
early stage to severe resulting in acute obstruction at later
stages (Fig. 3). In more advanced disease, gross wall
thickening, adherent loops, large regional nodes, and
mesenteric thickening can together form a soft tissue mass
centered around the ileocecal junction. Also fibrosis may
result in pulled up cecum. In some cases, hypodense areas
most likely to represent necrosis may be noted within the
thickened wall [22].
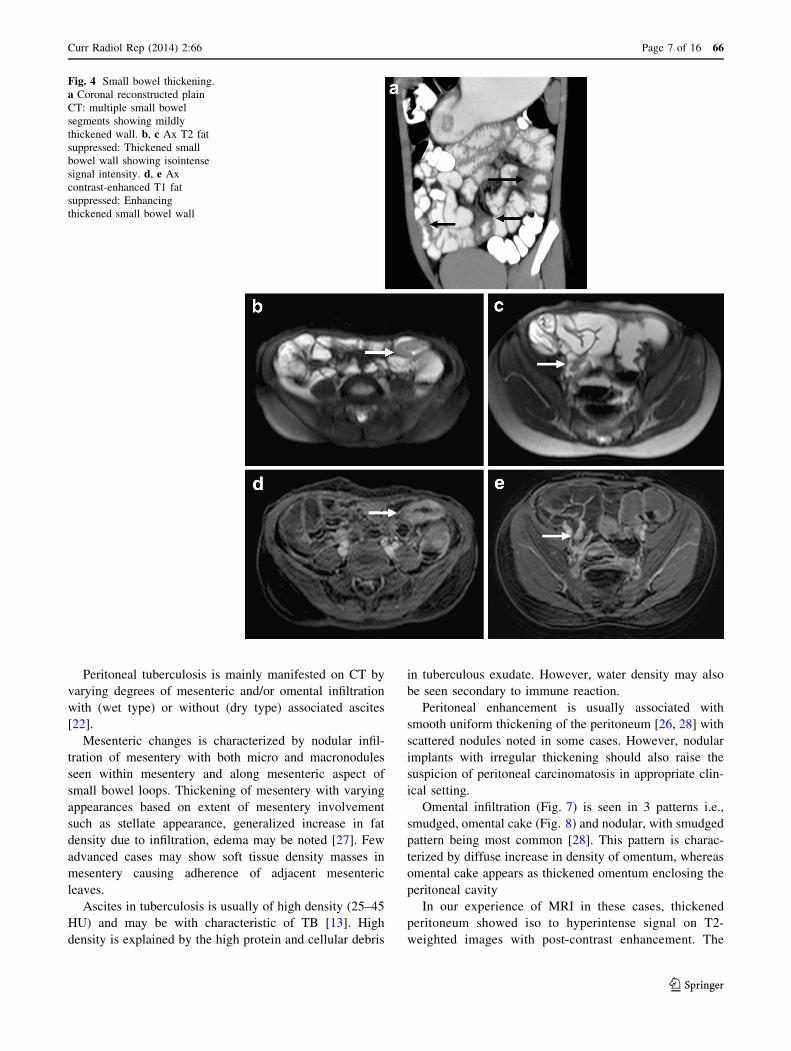
Skip areas of concentric mural thickening may be
seen in small bowel loops, usually affecting the ileal
loops (Fig. 4). These segments may also show luminal
narrowing, with or without proximal dilatation. In our
experience, oral contrast is helpful to gage the extent of
bowel thickness and mucosal irregularity in these cases
provided with acute bowel obstruction which is ruled
out. However, mucosal enhancement pattern recognition
is futile in cases with oral contrast. T1 W-MRI may
help in mucosal enhancement recognition due to supe-
rior contrast between enhancing bowel wall and lumen.
MRI
In 2006 De Backer et al. [23•], studied features of MRI in
gastrointestinal tuberculosis with CT correlation in 6
patients.
According to this study on MRI, abnormal bowel wall
showed decreased signal intensity compared to normal
bowel wall on unenhanced T1-weighted images and
slightly increased, and slight heterogeneous signal inten-
sities on T2-weighted images. Symmetric and asymmetric
thickening of cecum were visualized. T2-weighted imaging
is critical for characterizing the cause of wall thickening
because an area of high signal intensity is seen in the
presence of active inflammation, whereas fibrostenotic
disease is accompanied by areas of normal or lower signal
intensity [24].
T2-weighted sequences are very sensitive for detecting
inflammation of the bowel loop more so with negative oral
contrast agents like superparamagnetic iron oxide particles;
and fat-suppressed sequences which suppress the
Curr Radiol Rep (2014) 2:66 Page 5 of 16 66
123
mesenteric fat signal. Also fat-suppressed T2-weighted
imaging helps us to observe T2 hyperintense signal
extrinsic to inflamed bowel wall due to local mesenteritis.
ln our experience, oral contrast (2.5 % mannitol or
Volumen) is essential for adequate bowel distension in
MRI. Also prone position helps to separate bowel loops
and reduces breathing artefacts. The structural bowel
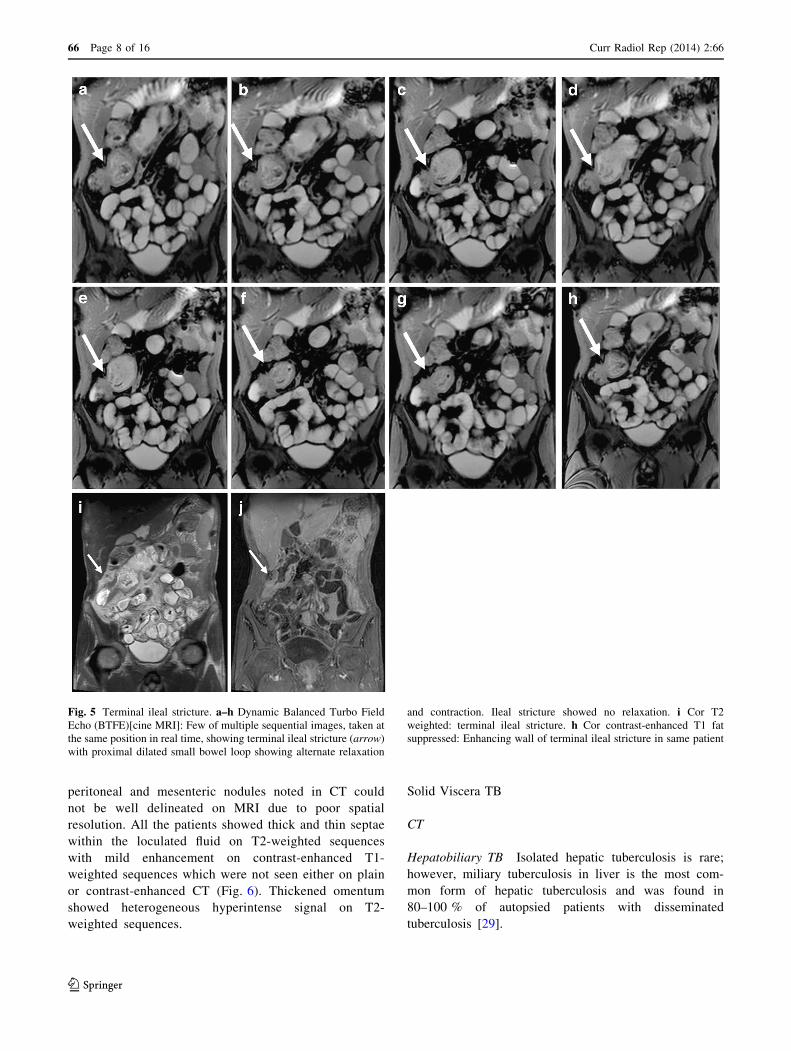
details are well visualized on both CT and MRI, but cine
sequence in MRI (Fig. 5) can help in bowel peristalsis
assessment which will help to detect subtle strictures. [22]
Peritoneal Tuberculosis
Peritoneal involvement in tuberculosis occurs primarily by
hematogenous spread but may be secondary to ruptured
lymph nodes, a perforated gastrointestinal lesion, or fallo-
pian tube involvement.
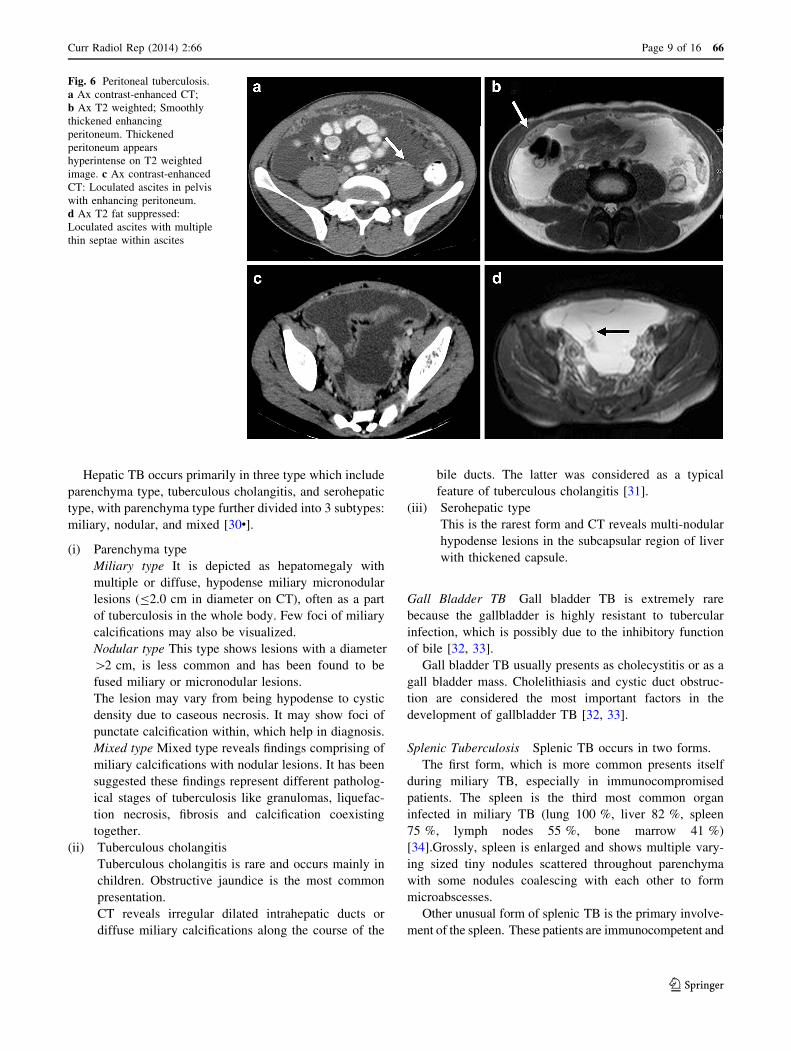
Peritoneal tuberculosis is traditionally divided into three
types:
(1) ‘‘Wet’’ with free or loculated ascites with strands of
fine adhesions and floating membranes within fluid
[25] (Figs. 6, 7).
(2) ‘‘Dry plastic’’ with mesenteric thickening, caseous
lymph nodes and fibrous adhesions; and
(3) ‘‘Fibrotic fixed’’ with mass formation of omentum
and matting of bowel loops with cocooning in some
cases [26].
There is considerable overlap between three types on
CT.
Fig. 3 Ileocecal tuberculosis
a Cor contrast-enhanced CT:
mildly enhancing
circumferential symmetrically
thickened cecal wall. b Cor T2
fat suppressed: Cecal wall
thickening showing
heterogeneous hyperintense
signal. c, d Cor Pre-contrast T1
weighted and contrast-enhanced
T1 fat suppressed: Thickened
cecal wall showing isointense
signal, which shows post
contrast enhancement in same
patient as in (a). The
enhancement on MRI has much
better visibility compared to CT
66 Page 6 of 16 Curr Radiol Rep (2014) 2:66
123
Peritoneal tuberculosis is mainly manifested on CT by
varying degrees of mesenteric and/or omental infiltration
with (wet type) or without (dry type) associated ascites
[22].
Mesenteric changes is characterized by nodular infil-
tration of mesentery with both micro and macronodules
seen within mesentery and along mesenteric aspect of
small bowel loops. Thickening of mesentery with varying
appearances based on extent of mesentery involvement
such as stellate appearance, generalized increase in fat
density due to infiltration, edema may be noted [27]. Few
advanced cases may show soft tissue density masses in
mesentery causing adherence of adjacent mesenteric
leaves.
Ascites in tuberculosis is usually of high density (25–45
HU) and may be with characteristic of TB [13]. High
density is explained by the high protein and cellular debris
in tuberculous exudate. However, water density may also
be seen secondary to immune reaction.
Peritoneal enhancement is usually associated with
smooth uniform thickening of the peritoneum [26, 28] with
scattered nodules noted in some cases. However, nodular
implants with irregular thickening should also raise the
suspicion of peritoneal carcinomatosis in appropriate clin-
ical setting.
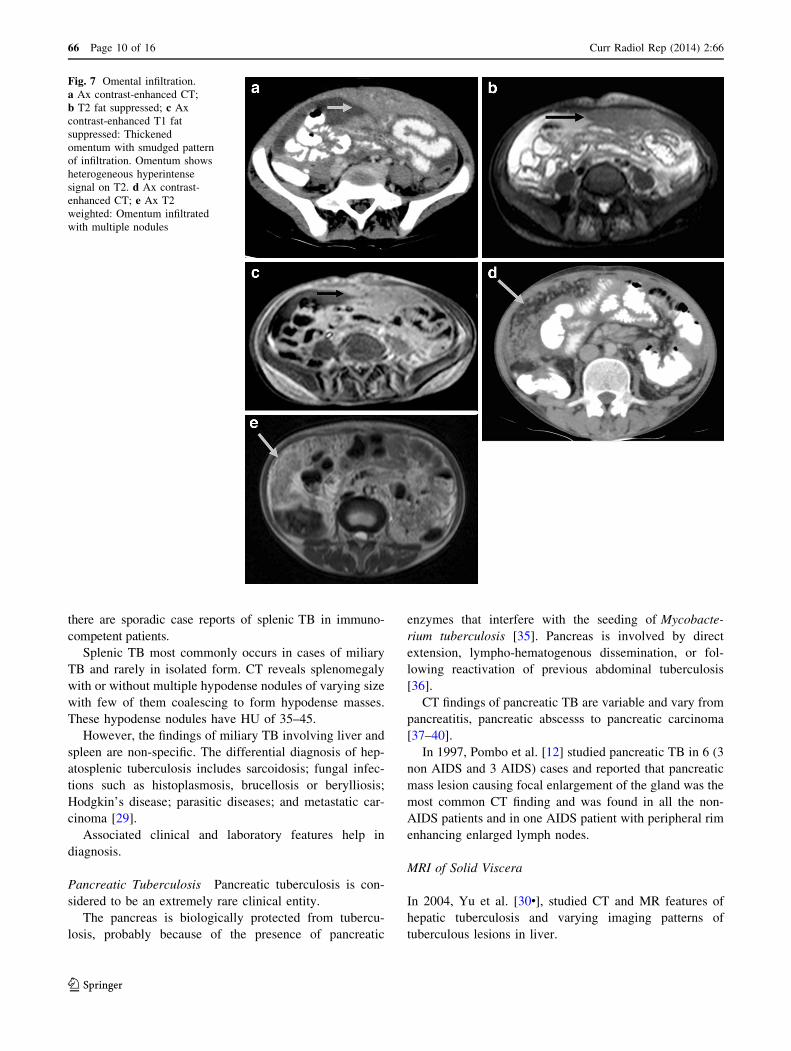
Omental infiltration (Fig. 7) is seen in 3 patterns i.e.,
smudged, omental cake (Fig. 8) and nodular, with smudged
pattern being most common [28]. This pattern is charac-
terized by diffuse increase in density of omentum, whereas
omental cake appears as thickened omentum enclosing the
peritoneal cavity
In our experience of MRI in these cases, thickened
peritoneum showed iso to hyperintense signal on T2-
weighted images with post-contrast enhancement. The
Fig. 4 Small bowel thickening.
a Coronal reconstructed plain
CT: multiple small bowel
segments showing mildly
thickened wall. b, c Ax T2 fat
suppressed: Thickened small
bowel wall showing isointense
signal intensity. d, e Ax
contrast-enhanced T1 fat
suppressed: Enhancing
thickened small bowel wall
Curr Radiol Rep (2014) 2:66 Page 7 of 16 66
123
peritoneal and mesenteric nodules noted in CT could
not be well delineated on MRI due to poor spatial
resolution. All the patients showed thick and thin septae
within the loculated fluid on T2-weighted sequences
with mild enhancement on contrast-enhanced T1-
weighted sequences which were not seen either on plain
or contrast-enhanced CT (Fig. 6). Thickened omentum
showed heterogeneous hyperintense signal on T2-
weighted sequences.
Solid Viscera TB
CT
Hepatobiliary TB Isolated hepatic tuberculosis is rare;
however, miliary tuberculosis in liver is the most com-
mon form of hepatic tuberculosis and was found in
80–100 % of autopsied patients with disseminated
tuberculosis [29].
Fig. 5 Terminal ileal stricture. a–h Dynamic Balanced Turbo Field
Echo (BTFE)[cine MRI]: Few of multiple sequential images, taken at
the same position in real time, showing terminal ileal stricture (arrow)
with proximal dilated small bowel loop showing alternate relaxation
and contraction. Ileal stricture showed no relaxation. i Cor T2
weighted: terminal ileal stricture. h Cor contrast-enhanced T1 fat
suppressed: Enhancing wall of terminal ileal stricture in same patient
66 Page 8 of 16 Curr Radiol Rep (2014) 2:66
123
Hepatic TB occurs primarily in three type which include
parenchyma type, tuberculous cholangitis, and serohepatic
type, with parenchyma type further divided into 3 subtypes:
miliary, nodular, and mixed [30•].
(i) Parenchyma type
Miliary type It is depicted as hepatomegaly with
multiple or diffuse, hypodense miliary micronodular
lesions (B2.0 cm in diameter on CT), often as a part
of tuberculosis in the whole body. Few foci of miliary
calcifications may also be visualized.
Nodular type This type shows lesions with a diameter
[2 cm, is less common and has been found to be
fused miliary or micronodular lesions.
The lesion may vary from being hypodense to cystic
density due to caseous necrosis. It may show foci of
punctate calcification within, which help in diagnosis.
Mixed type Mixed type reveals findings comprising of
miliary calcifications with nodular lesions. It has been
suggested these findings represent different patholog-
ical stages of tuberculosis like granulomas, liquefac-
tion necrosis, fibrosis and calcification coexisting
together.
(ii) Tuberculous cholangitis
Tuberculous cholangitis is rare and occurs mainly in
children. Obstructive jaundice is the most common
presentation.
CT reveals irregular dilated intrahepatic ducts or
diffuse miliary calcifications along the course of the
bile ducts. The latter was considered as a typical
feature of tuberculous cholangitis [31].
(iii) Serohepatic type
This is the rarest form and CT reveals multi-nodular
hypodense lesions in the subcapsular region of liver
with thickened capsule.
Gall Bladder TB Gall bladder TB is extremely rare
because the gallbladder is highly resistant to tubercular
infection, which is possibly due to the inhibitory function
of bile [32, 33].
Gall bladder TB usually presents as cholecystitis or as a
gall bladder mass. Cholelithiasis and cystic duct obstruc-
tion are considered the most important factors in the
development of gallbladder TB [32, 33].
Splenic Tuberculosis Splenic TB occurs in two forms.
The first form, which is more common presents itself
during miliary TB, especially in immunocompromised
patients. The spleen is the third most common organ
infected in miliary TB (lung 100 %, liver 82 %, spleen
75 %, lymph nodes 55 %, bone marrow 41 %)
[34].Grossly, spleen is enlarged and shows multiple vary-
ing sized tiny nodules scattered throughout parenchyma
with some nodules coalescing with each other to form
microabscesses.
Other unusual form of splenic TB is the primary involve-
ment of the spleen. These patients are immunocompetent and
Fig. 6 Peritoneal tuberculosis.
a Ax contrast-enhanced CT;
b Ax T2 weighted; Smoothly
thickened enhancing
peritoneum. Thickened
peritoneum appears
hyperintense on T2 weighted
image. c Ax contrast-enhanced
CT: Loculated ascites in pelvis
with enhancing peritoneum.
d Ax T2 fat suppressed:
Loculated ascites with multiple
thin septae within ascites
Curr Radiol Rep (2014) 2:66 Page 9 of 16 66
123
there are sporadic case reports of splenic TB in immuno-
competent patients.
Splenic TB most commonly occurs in cases of miliary
TB and rarely in isolated form. CT reveals splenomegaly
with or without multiple hypodense nodules of varying size
with few of them coalescing to form hypodense masses.
These hypodense nodules have HU of 35–45.
However, the findings of miliary TB involving liver and
spleen are non-specific. The differential diagnosis of hep-
atosplenic tuberculosis includes sarcoidosis; fungal infec-
tions such as histoplasmosis, brucellosis or berylliosis;
Hodgkin’s disease; parasitic diseases; and metastatic car-
cinoma [29].
Associated clinical and laboratory features help in
diagnosis.
Pancreatic Tuberculosis Pancreatic tuberculosis is con-
sidered to be an extremely rare clinical entity.
The pancreas is biologically protected from tubercu-
losis, probably because of the presence of pancreatic
enzymes that interfere with the seeding of Mycobacte-
rium tuberculosis [35]. Pancreas is involved by direct
extension, lympho-hematogenous dissemination, or fol-
lowing reactivation of previous abdominal tuberculosis
[36].
CT findings of pancreatic TB are variable and vary from
pancreatitis, pancreatic abscesss to pancreatic carcinoma
[37–40].
In 1997, Pombo et al. [12] studied pancreatic TB in 6 (3
non AIDS and 3 AIDS) cases and reported that pancreatic
mass lesion causing focal enlargement of the gland was the
most common CT finding and was found in all the non-
AIDS patients and in one AIDS patient with peripheral rim
enhancing enlarged lymph nodes.
MRI of Solid Viscera
In 2004, Yu et al. [30•], studied CT and MR features of
hepatic tuberculosis and varying imaging patterns of
tuberculous lesions in liver.
Fig. 7 Omental infiltration.
a Ax contrast-enhanced CT;
b T2 fat suppressed; c Ax
contrast-enhanced T1 fat
suppressed: Thickened
omentum with smudged pattern
of infiltration. Omentum shows
heterogeneous hyperintense
signal on T2. d Ax contrast-
enhanced CT; e Ax T2
weighted: Omentum infiltrated
with multiple nodules
66 Page 10 of 16 Curr Radiol Rep (2014) 2:66
123
MRI of hepatic tuberculosis showed a hypointense
nodule with a hypointense rim on T1-weighted imaging,
and hypointense, isointense or hyperintense with a less
intense rim on T2-weighted imaging, and peripheral
enhancement or internal septal enhancement on post-con-
trast MRI. MR findings were related to different patho-
logical stages of tuberculosis. At the early and medium
stages of granuloma with or without caseation or lique-
faction necrosis, the lesion showed low signal intensity on
T1-weighted imaging and high signal intensity on T2-
weighted imaging. Similar lesions with hypointense signal
on T1-weighted imaging and hypo- and isointense on T2-
weighted imaging were corresponding to fibrous stage of
tuberculosis or could be due to free radicals released by
active macrophages and may have slightly or no peripheral
enhancement. Tuberculous granuloma at early or medium
stage and fibro-proliferous lesions were all depicted as a
low-density area on CT but as various signal intensities on
T2-weighted imaging, which is the main advantage of MRI
in the diagnosis of hepatic tuberculosis. But MRI is of
limited value for detecting calcification. Calcific lesions on
CT may appear hypointense on T2-weighted MRI images.
Splenic TB
On MRI, tuberculous focal splenic lesions may show var-
iable signal intensities and enhancement patterns after IV
administration of gadolinium. This spectrum of variable
imaging findings may represent different phases of disease
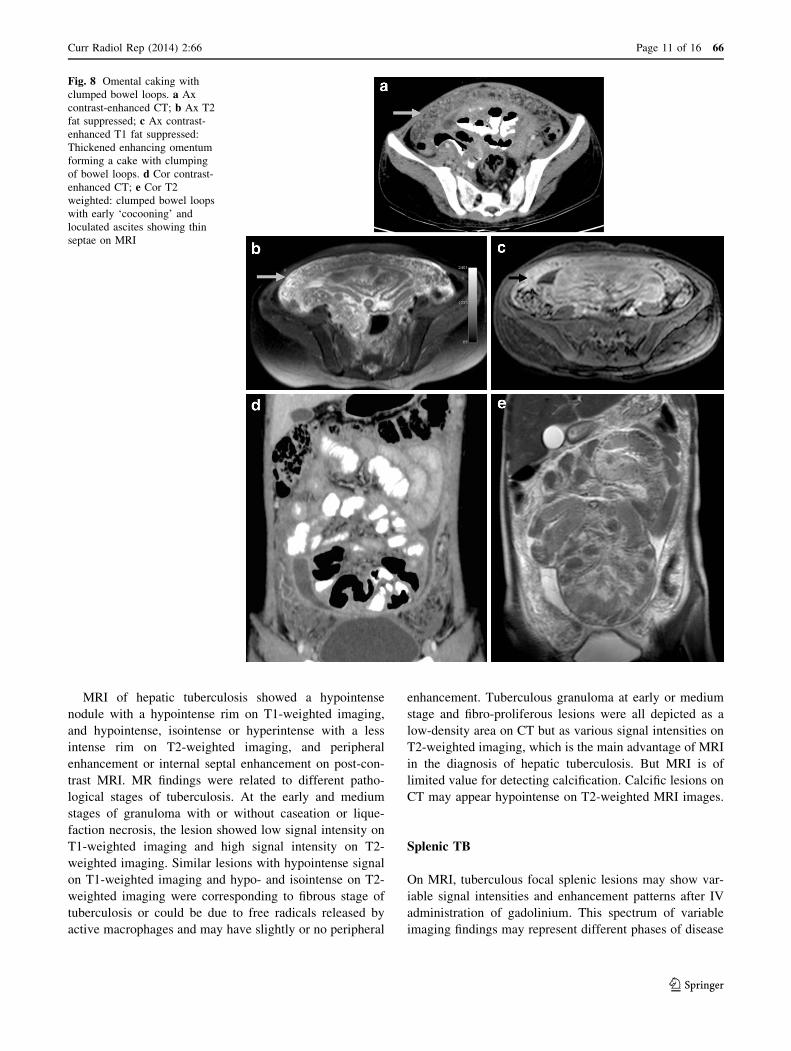
Fig. 8 Omental caking with
clumped bowel loops. a Ax
contrast-enhanced CT; b Ax T2
fat suppressed; c Ax contrast-
enhanced T1 fat suppressed:
Thickened enhancing omentum
forming a cake with clumping
of bowel loops. d Cor contrast-
enhanced CT; e Cor T2
weighted: clumped bowel loops
with early ‘cocooning’ and
loculated ascites showing thin
septae on MRI
Curr Radiol Rep (2014) 2:66 Page 11 of 16 66
123
progression corresponding to different degrees of fibrosis,
granuloma formation, caseation, and liquefaction necrosis
[41]. Lesion hypointensity on T2-weighted images is
thought to be due to the presence of free radicals produced
by macrophages during active phagocytosis, may be asso-
ciated with increased fibrosis and granulomatous tissue, or
may reflect the presence of calcifications [42], [43•]. The
finding of lesion hypointensity on T2-weighted images may
be a helpful characteristic for differentiating splenic
tuberculoma from other neoplastic or inflammatory lesions.
Furthermore, a hypointense nodule with a less hypointense
rim on T1- weighted images and a hyperintense central
area with a less intense rim on T2-weighted images have
also been reported. These findings reflect histologic dif-
ferences between the center and the periphery of the
tuberculous lesion [44]. These findings may reflect
caseating granuloma with a liquid center and peripheral
reactive fibrosis. Finally, a hyperintense mass without rim
hypointensity on T2-weighted images may also be noted.
The latter finding may reflect extensive central liquefaction
necrosis with only minimal peripheral granuloma forma-
tion or fibrosis (or both).
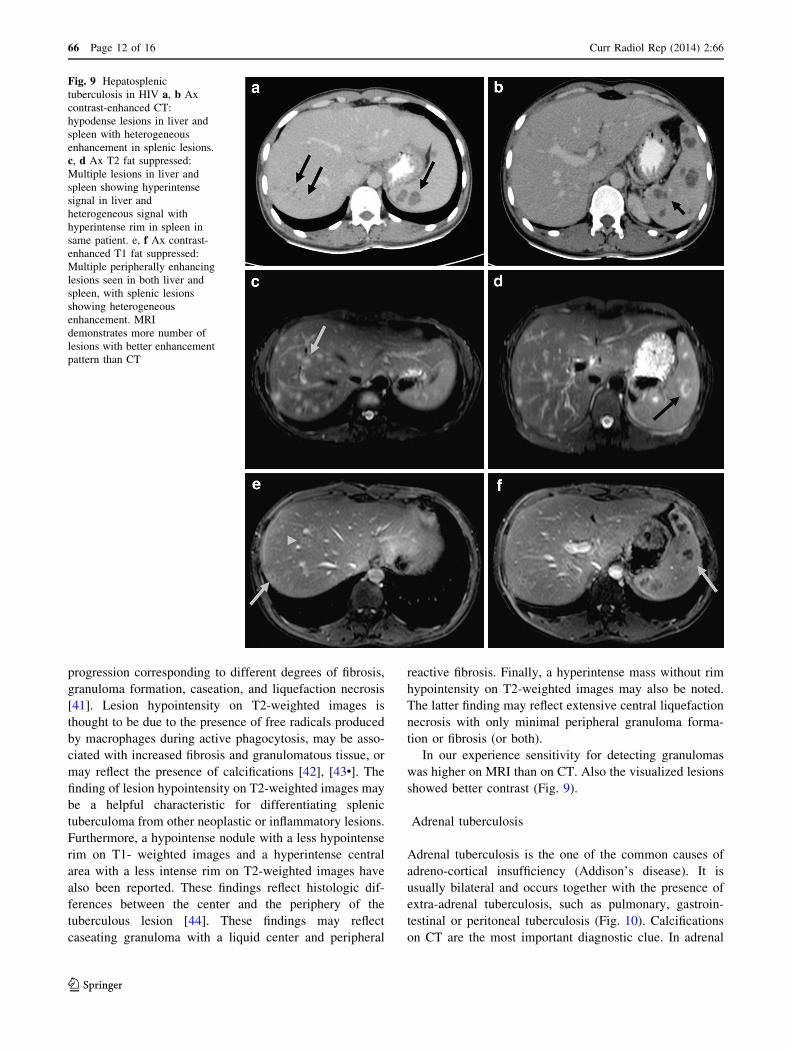
In our experience sensitivity for detecting granulomas
was higher on MRI than on CT. Also the visualized lesions
showed better contrast (Fig. 9).
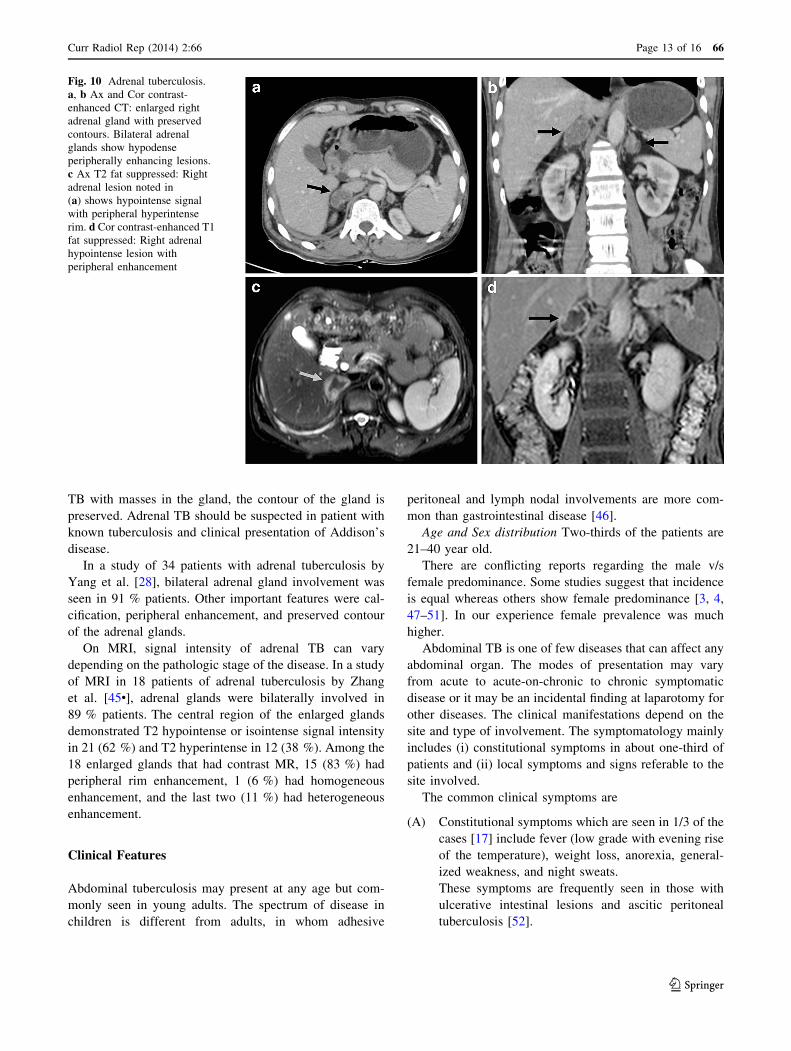
Adrenal tuberculosis
Adrenal tuberculosis is the one of the common causes of
adreno-cortical insufficiency (Addison’s disease). It is
usually bilateral and occurs together with the presence of
extra-adrenal tuberculosis, such as pulmonary, gastroin-
testinal or peritoneal tuberculosis (Fig. 10). Calcifications
on CT are the most important diagnostic clue. In adrenal
Fig. 9 Hepatosplenic
tuberculosis in HIV a, b Ax
contrast-enhanced CT:
hypodense lesions in liver and
spleen with heterogeneous
enhancement in splenic lesions.
c, d Ax T2 fat suppressed:
Multiple lesions in liver and
spleen showing hyperintense
signal in liver and
heterogeneous signal with
hyperintense rim in spleen in
same patient. e, f Ax contrast-
enhanced T1 fat suppressed:
Multiple peripherally enhancing
lesions seen in both liver and
spleen, with splenic lesions
showing heterogeneous
enhancement. MRI
demonstrates more number of
lesions with better enhancement
pattern than CT
66 Page 12 of 16 Curr Radiol Rep (2014) 2:66
123
TB with masses in the gland, the contour of the gland is
preserved. Adrenal TB should be suspected in patient with
known tuberculosis and clinical presentation of Addison’s
disease.
In a study of 34 patients with adrenal tuberculosis by
Yang et al. [28], bilateral adrenal gland involvement was
seen in 91 % patients. Other important features were cal-
cification, peripheral enhancement, and preserved contour
of the adrenal glands.
On MRI, signal intensity of adrenal TB can vary
depending on the pathologic stage of the disease. In a study
of MRI in 18 patients of adrenal tuberculosis by Zhang
et al. [45•], adrenal glands were bilaterally involved in
89 % patients. The central region of the enlarged glands
demonstrated T2 hypointense or isointense signal intensity
in 21 (62 %) and T2 hyperintense in 12 (38 %). Among the
18 enlarged glands that had contrast MR, 15 (83 %) had
peripheral rim enhancement, 1 (6 %) had homogeneous
enhancement, and the last two (11 %) had heterogeneous
enhancement.
Clinical Features
Abdominal tuberculosis may present at any age but com-
monly seen in young adults. The spectrum of disease in
children is different from adults, in whom adhesive
peritoneal and lymph nodal involvements are more com-
mon than gastrointestinal disease [46].
Age and Sex distribution Two-thirds of the patients are
21–40 year old.
There are conflicting reports regarding the male v/s
female predominance. Some studies suggest that incidence
is equal whereas others show female predominance [3, 4,
47–51]. In our experience female prevalence was much
higher.
Abdominal TB is one of few diseases that can affect any
abdominal organ. The modes of presentation may vary
from acute to acute-on-chronic to chronic symptomatic
disease or it may be an incidental finding at laparotomy for
other diseases. The clinical manifestations depend on the
site and type of involvement. The symptomatology mainly
includes (i) constitutional symptoms in about one-third of
patients and (ii) local symptoms and signs referable to the
site involved.
The common clinical symptoms are
(A) Constitutional symptoms which are seen in 1/3 of the
cases [17] include fever (low grade with evening rise
of the temperature), weight loss, anorexia, general-
ized weakness, and night sweats.
These symptoms are frequently seen in those with
ulcerative intestinal lesions and ascitic peritoneal
tuberculosis [52].
Fig. 10 Adrenal tuberculosis.
a, b Ax and Cor contrast-
enhanced CT: enlarged right
adrenal gland with preserved
contours. Bilateral adrenal
glands show hypodense
peripherally enhancing lesions.
c Ax T2 fat suppressed: Right
adrenal lesion noted in
(a) shows hypointense signal
with peripheral hyperintense
rim. d Cor contrast-enhanced T1
fat suppressed: Right adrenal
hypointense lesion with
peripheral enhancement
Curr Radiol Rep (2014) 2:66 Page 13 of 16 66
123

(B) Local symptoms
(1) Abdominal pain is the most common symptom. Pain
can be either colicky due to luminal compromise, or
dull and continuous when the mesenteric lymph nodes
are involved.
(2) Symptoms of intestinal obstruction which include
vomiting, constipation, distension of abdomen.
(3) Distension of abdomen in patients with ascites.
(4) Diarrhea, in cases with ulcerative lesions which may
lead to malabsorption.
(5) Altered bowel habits with alternating diarrhea and
constipation.
(6) Hematemesis in gastroduodenal lesions occurs
occasionally.
(7) Hematochezia in colonic lesions.
(8) Jaundice as a very rare presentation in patients with
hepatic, pancreatic and periportal lymph node
involvement.
(9) Addison’s disease in cases of adrenal tuberculosis
characterized by dizziness due to persistent hypoten-
sion, weakness, fatigue, weight loss.
Diagnosis
The isolation of acid fast bacilli (AFB) is the gold standard
for diagnosis of pulmonary tuberculosis but may not be
possible for establishing the diagnosis of various forms of
abdominal tuberculosis. So far, the diagnosis of abdominal
tuberculosis has been made either on the histological evi-
dence of TB in the tissue (e.g., evidence of tubercles with
caseation or demonstration of AFB in a lesion) or typical
operative findings suggestive of TB or animal inoculation
or tissue culture yielding the growth of M. tuberculosis.
Now, with the advent of better radio-imaging procedures,
new criteria for the diagnosis suggested by Lingenfelser
[53] were as follows:
i. Clinical manifestations suggestive of TB
ii. Imaging evidence indicative of abdominal TB
iii. Histopathological or microbiological evidence of TB
and/or
iv. Therapeutic response to treatment.
Abdominal tuberculosis is a great mimicker. It can
mimic a variety of other abdominal conditions/diseases and
only a high degree of suspicion can help in the diagnosis
otherwise it is likely to be missed or delayed, resulting in
high morbidity and mortality.
It should be included in the differential diagnosis of
pyrexia of unknown origin, unexplained weight loss, and
hepatosplenomegaly. Abdominal tuberculosis should be
considered in any patient with unexplained and chronic
abdominal symptoms and should be thought of whenever a
diagnosis of Crohn’s disease or gastrointestinal malignancy
is being entertained [17].
Advantages of CT
(1) It gives good anatomic and pathological information
regarding different aspects of abdominal tuberculosis.
(2) It helps in assessment of both the intestinal and
extraintestinal tuberculosis.
(3) It has high sensitivity and specificity for detecting
lymphadenopathy and peritonitis
(4) Use of MDCT scanners can generate near isotropic
dataset, which can be post-processed and viewed in
various ways using MIP, MPR, and 3D Volume-
rendered techniques.
Limitations of CT
(1) It requires intravenous iodinated contrast.
(2) The radiation dose is high.
(3) It gives no information regarding bowel peristalsis.
The advantages of MRI are
(1) The lack of ionizing radiation which is particularly
important since many of these patients are young.
(2) Better soft tissue contrast resolution in depiction of
inflammation and higher visibility of contrast
enhancement, safer i.v. contrast agent.
(3) Functional and anatomic assessment of bowel loops
can be carried out unlike CT which gives only
anatomic information.
(4) In patients with raised creatinine, plain MRI gives much
more diagnostic information compared to plain CT.
The disadvantages are
(1) Poor spatial resolution as compared to CT
(2) Long acquisition time requiring good patient
compliance
(3) Expensive test with lesser availability.
(4) Is less reliable to detect calcifications and calcium.
Conclusion
Abdominal tuberculosis is a curable infectious disease with
high morbidity and mortality if left untreated. Early diag-
nosis with adequate anti-tuberculous treatment is impera-
tive. Radiological investigations have become mainstay for
the diagnosis of abdominal tuberculosis and to differentiate
it from other diseases with similar clinical picture. Both CT
and MRI can diagnose abdominal tuberculosis with high
sensitivity and specificity. Each have their pros and cons.
66 Page 14 of 16 Curr Radiol Rep (2014) 2:66
123
CT scores over MRI in being a quicker, cheaper investi-
gation with better spatial resolution, lesser artefacts and
one which can simultaneously evaluate chest, abdomen and
pelvis in a single examination.
MRI scores over CT in having no radiation hazard,
which is particularly important for young patients and due
to its superior soft tissue resolution which gives much more
information even without contrast as compared to CT.
Thus, in patients with contraindication for intravenous
contrast, non-contrast MRI is far better than plain CT.
Also, CT gives no information regarding functional
assessment of the bowel loops which can be assessed by
dynamic cine MRI. In future, technological breakthroughs
which can make MRI quicker, improve its spatial resolu-
tion will be highly desirable and MRI can substitute CT in
many cases and reduce radiation hazard.
The investigation of choice in an individual patient
depends on multiple factors like cost, availability, patient
compliance, clinical acuity, renal function, need for
simultaneous chest evaluation and whether functional
assessment of bowel is required.
Compliance with Ethics Guidelines
Conflict of Interest Dr. Ashish S. Basantani and Dr. Tapan C. Patel
each declare no potential conflicts of interest.
Human and Animal Rights and Informed Consent This article
does not contain any studies with human or animal subjects
performed by any of the authors.
References
Articles of importance have been highlighted as:• Of importance
1. Park K. Preventive and Social Medicine: Bhanot; 2011.
2. GOI. TB INDIA 2012. RNTCP Status Report. New Delhi: Cen-
tral TB Division, Ministry Of Health and Family Welfare; 2010.
3. Ihekwaba FN. Abdominal tuberculosis: a study of 881 cases. J R
Coll Surg Edinb. 1993;38(5):293–5.
4. Uygur-Bayramicli O, Dabak G, Dabak R. A clinical dilemma:
abdominal tuberculosis. World J Gastroenterol. 2003;9(5):
1098–101.
5. WHO. GLOBAL TUBERCULOSIS REPORT. 2012.
6. Ustianowski A, Shaffer R, Collin S, Wilkinson RJ, Davidson RN.
Prevalence and associations of vitamin D deficiency in foreign-
born persons with tuberculosis in London. J Infect. 2005;50(5):
432–7.
7. Nnoaham KE, Clarke A. Low serum vitamin D levels and
tuberculosis: a systematic review and meta-analysis. Int J Epi-
demiol. 2008;37(1):113–9.
8. Kumar V, Abbas AK, Fausto N, Mitchell RN. Robbins basic
pathology. 8th ed. Philadelphia: Elsevier; 2007.
9. Sharma M, Bhatia V. Abdominal tuberculosis. Indian J Med Res.
2004;120:305–15.
10. Sarrami AH, Sharifi M, Ahsan M, Afsharmoghaddam N. Multiple
intestinal perforations as a primary manifestation of abdominal
tuberculosis in a HIV-infected patient. JSCR. 2010;10:7.
11. Bhansali S. Abdominal tuberculosis. Experiences with 300 cases.
Am J Gastroenterol. 1977;67:324–37.
12. Pombo F, DiazCandamio M, Rodriguez E, Pombo S. Pancreatic
tuberculosis: CT findings. Abdom Imaging. 1998;23(4):394–7.
13. Leder RA, Low VH. Tuberculosis of the abdomen. Radiol Clin
North Am. 1995;33(4):691–705.
14. Cohan RHDN. The retroperitoneum. In: Haaga JR, editor.
Computed tomography and magnetic resonance imaging of the
whole body. 3rd ed. St. Louis: Mosby; 1994. p. 1292–326.
15. Sood R. Diagnosis of abdominal tuberculosis: role of imaging.
J Indian Acad Clin Med. 2001;2(3):169–77.
16. • De Backer AI, Mortele KJ, Deeren D, Vanschoubroeck IJ, De
Keulenaer BL. Abdominal tuberculous lymphadenopathy: MRI
features. Eur Radiol. 2005;15(10):2104–9. This article describes
MRI appearance of abdominal tuberculous lymphadenopathy in
detail.
17. Kapoor VK. Abdominal tuberculosis. Postgrad Med J.
1998;74(874):459–67.
18. Abrams JS, Holden WD. Tuberculosis of the gastrointestinal
tract. Arch Surg. 1964;89(2):282–93.
19. Hancock D. Hyperplastic tuberculosis of the distal colon. Br J
Surg. 1958;46(195):63–8.
20. Bentley G, Webster J. Gastro-intestinal tuberculosis. A 10-year
review. Br J Surg. 1967;54(2):90–6.
21. Bockus H. Tuberculosis of the intestines. Gastroenterology.
1964;2:327–9.
22. Suri S, Gupta S, Suri R. Computed tomography in abdominal
tuberculosis. Br J Radiol. 1999;72(853):92–8.
23. • De Backer AI, Mortele KJ, De Keulenaer BL, Henckaerts L,
Verhaert L. CT and MR imaging of gastrointestinal tuberculosis.
JBR-BTR. 2006;89(4):190–4. This is a study of CT and MRI
abdominal tuberculosis which compares both modalities in sim-
ple manner.
24. Fidler JL, Guimaraes L, Einstein DM. MR imaging of the small
bowel. Radiographics. 2009;29(6):1811–25.
25. Aston NO. Abdominal tuberculosis. World J Surg.
1997;21(5):492–9.
26. Jadvar H, Mindelzun RE, Olcott EW, Levitt DB. Still the great
mimicker: abdominal tuberculosis. AJR Am J Roentgenol.
1997;168(6):1455–60.
27. Ha HK, Jung JI, Lee MS, Choi BG, Lee MG, Kim YH, et al. CT
differentiation of tuberculous peritonitis and peritoneal carcino-
matosis. AJR Am J Roentgenol. 1996;167(3):743–8.
28. Yang ZG, Guo YK, Li Y, Min PQ, Yu JQ, Ma ES. Differentiation
between tuberculosis and primary tumors in the adrenal gland: eval-
uation with contrast-enhanced CT. Eur Radiol. 2006;16(9):2031–6.
29. Thoeni RF, Margulis AR, editors. Gastrointestinal tuberculosis.
Seminars in roentgenology; 1979.
30. • Yu RS, Zhang SZ, Wu JJ, Li RF. Imaging diagnosis of 12
patients with hepatic tuberculosis. World J Gastroenterol.
2004;10(11):1639–42. This study gives CT and MRI details of
hepatic tuberculosis in different forms.
31. Gibson MS, Puckett ML, Shelly ME. Renal tuberculosis. Ra-
diographics. 2004;24(1):251–6.
32. Jain R, Sawhney S, Bhargava D, Berry M. Gallbladder tuberculosis:
sonographic appearance. J Clin Ultrasound. 1995;23(5):327–9.
33. Abu-Zidan FM, Zayat I. Gallbladder tuberculosis (case report and
review of the literature). Hepatogastroenterology. 1999;46(29):
2804–6.
34. Nayyar V, Ramakrishna B, Mathew G, Williams RR, Khanduri P.
Response to antituberculous chemotherapy after splenectomy.
J Intern Med. 1993;233(1):81–3.
Curr Radiol Rep (2014) 2:66 Page 15 of 16 66
123
35. Franco-Paredes C, Leonard M, Jurado R, Blumberg HM, Smith
RM. Tuberculosis of the pancreas: report of two cases and review
of the literature. Am J Med Sci. 2002;323(1):54–8.
36. Ray S, Das K, Mridha AR. Pancreatic and peripancreatic nodal
tuberculosis in immunocompetent patients: report of three cases.
JOP. 2012;13(6):667–70.
37. Gupta RK, Pandey R, Khan EM, Mittal P, Gujral RB, Chhabra
DK. Intracranial tuberculomas: MRI signal intensity correlation
with histopathology and localised proton spectroscopy. Magn
Reson Imaging. 1993;11(3):443–9.
38. Jung YY, Kim JK, Cho KS. Genitourinary tuberculosis: com-
prehensive cross-sectional imaging. AJR Am J Roentgenol.
2005;184(1):143–50.
39. Buxi TB, Sud S, Vohra R. CT and MRI in the diagnosis of
tuberculosis. Indian J Pediatr. 2002;69(11):965–72.
40. Kapoor R, Ansari MS, Mandhani A, Gulia A. Clinical presenta-
tion and diagnostic approach in cases of genitourinary tubercu-
losis. Indian J Urol. 2008;24(3):401–5.
41. Fan ZM, Zeng QY, Huo JW, Bai L, Liu ZS, Luo LF, et al.
Macronodular multi-organs tuberculoma: CT and MR appear-
ances. J Gastroenterol. 1998;33(2):285–8.
42. Pettengell K, Garb M, Houlder A, Becker P, Simjee A. Radio-
nuclide scintigraphy in tuberculous enteritis. Gastrointest Radiol.
1990;15(2):148–50.
43. • Vanhoenacker FM, De Backer AI, Op de BB, Maes M, Van
Altena R, Van Beckevoort D, et al. Imaging of gastrointestinal
and abdominal tuberculosis. Eur Radiol. 2004;14(Suppl
3):E103–15. This article summarises salient imaging features of
abdominal tuberculosis.
44. De Backer AI, Vanhoenacker FM, Mortele KJ, Vanschoubroeck
IJ, De Keulenaer BL, Parizel PM. MRI features of focal splenic
lesions in patients with disseminated tuberculosis. AJR Am J
Roentgenol. 2006;186(4):1097–102.
45. • Zhang XC, Yang ZG, Li Y, Min PQ, Guo YK, Deng YP, et al.
Addison’s disease due to adrenal tuberculosis: MRI features.
Abdom Imaging. 2008;33(6):689–94. This study describes MRI
features in adrenal tuberculosis causing Addisons disease.
46. Sharma AK, Agarwal LD, Sharma CS, Sarin YK. Abdominal
tuberculosis in children: experience over a decade. Indian Pediatr.
1993;30(9):1149–53.
47. Khan R, Abid S, Jafri W, Abbas Z, Hameed K, Ahmad Z.
Diagnostic dilemma of abdominal tuberculosis in non-hiv
patients: an ongoing challenge for physicians. World J Gastro-
enterol. 2006;12(39):6371–5.
48. Sircar S, Taneja VA, Kansra U. Epidemiology and clinical pre-
sentation of abdominal tuberculosis: a retrospective study.
J Indian Med Assoc. 1996;94(9):342–4.
49. Amarapurkar DN, Patel ND, Amarapurkar AD, Agal S, Baigal R,
Gupte P. Tissue polymerase chain reaction in diagnosis of
intestinal tuberculosis and Crohn’s disease. J Assoc Physicians
India. 2004;52:863–7.
50. Rajput MJ, Memon AS, Rani S, Memon AH. Clinicopathological
profile and surgical management outcomes in patients suffering
from intestinal tuberculosis. JLUMHS. 2005;4:113–8.
51. Skopin MS, Batyrov FA, Kornilova Z. The prevalence of
abdominal tuberculosis and the specific features of its detection.
Probl Tuberk Bolezn Legk. 2007;1:22–6.
52. Bandyopadhyay S. Tuberculosis in gastroenterology practice:
clinical challenges. Med Update. 2011;21.
53. Lingenfelser T, Zak J, Marks I, Steyn E, Halkett J, Price S.
Abdominal tuberculosis: still a potentially lethal disease. Am J
Gastroenterol. 1993;88:744.
66 Page 16 of 16 Curr Radiol Rep (2014) 2:66
123