roel vanhout | policy lab cyprus 2015
TRANSCRIPT
P.O. Box 463
6200 AL Maastricht
The Netherlands
www.riks.nl
Spatial Decision Support Systems for policy support in
urban planning contexts
Roel Vanhout

Research Institute for Knowledge Systems
2
About RIKS
Independent research institute Founded in the 1980’s to focus on
Artificial intelligence E-learning Geographic information systems
… which eventually led to land use modeling Focus areas
Land use modeling Model integration Integrated modeling for policy support
RIKS

3
Content
Spatial Decision Support Systems and Integrated Spatial Planning: what and how?
Land use modeling as a central component of the (I)SDSS
Application through traditional scenarios and “storyline and simulation” approach
Case studies: Province of Utrecht, the Netherlands PRELUDE (EEA) New infrastructure in Puerto Rico

4
Content
Spatial Decision Support Systems and Integrated Spatial Planning: what and how?
Land use modeling as a central component of the (I)SDSS
Application through traditional scenarios and “storyline and simulation” approach
Case studies: Province of Utrecht, the Netherlands PRELUDE (EEA) New infrastructure in Puerto Rico

5
Integrated Spatial Planning is …
An explicitly spatial - temporal domain
Multi-disciplinary, multi-sectoral, and multiple spatial agents
Policy-interventions cause irreversible change
Policy-interventions require resources
… this requires a set of models, methods, techniques, data, …, available in an
integrated environment rather than in isolation
6
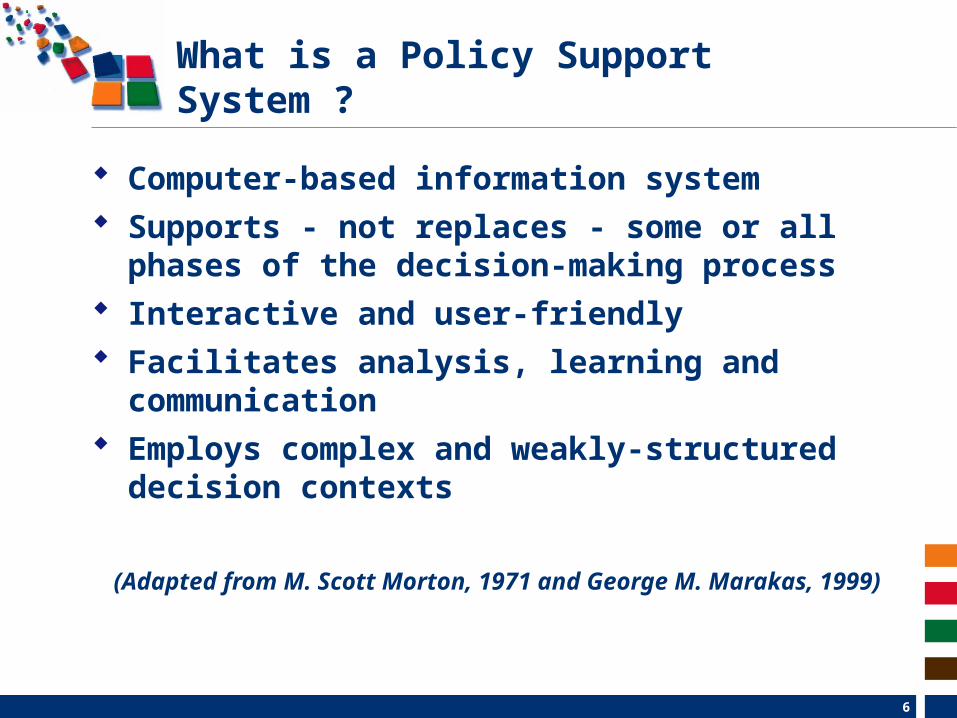
What is a Policy Support System ?
Computer-based information system Supports - not replaces - some or all
phases of the decision-making process Interactive and user-friendly Facilitates analysis, learning and
communication Employs complex and weakly-structured
decision contexts
(Adapted from M. Scott Morton, 1971 and George M. Marakas, 1999)

7
Weakly-structured decision context
weakly structuredproblem
structured problem
weakly structuredproblem
unstructured problem
Uncertainty
Conflicts
(After Hoppe and Peterse, 1998 in Van Delden, 2000)
Water resourcesStructured problem: What is the diameter of the aqueducts required if we want to transfer 50.000 hectoliters per day ?Weakly structured problem: Can we guarantee enough water of high quality at every day of the year for the next 15 years ?Unstructured problem: How should we manage the water resources among the different actors under climatic change?

8
Content
Spatial Decision Support Systems and Integrated Spatial Planning: what and how?
Land use modeling as a central component of the (I)SDSS
Application through traditional scenarios and “storyline and simulation” approach
Case studies: Province of Utrecht, the Netherlands PRELUDE (EEA) New infrastructure in Puerto Rico

9
Local,356000 cells 25ha
Regional,5 NUTS 2 regions
National, Portugal in EU
Land use modelling with MetronamicaModels at 3 coupled spatial scales

10
Land use change over time
Time Loop
Land use& Interaction
weights
&
Suitability
Zoning
&
&
Accessibility
Potential for change
=
Transition RuleCells change to land-
use with highest potential until
regional demands are met.
Land use at time T+1
Regional demands

11

12
The single run is not what counts: Working with uncertainty
Probability that the cell is occupied by particular land use as the result of uncertainty in parameter(s).
Not 1, but 10, 100, …, runsFluctuating 1, 2, …, all parameters
Milieu- en Natuureffecten Nota RuimteRIVM, May 2004
Prepared for VROM (Ministry of public housing and Spatial Planning and the Environment

13
Content
Spatial Decision Support Systems and Integrated Spatial Planning: what and how?
Land use modeling as a central component of the (I)SDSS
Application through traditional scenarios and “storyline and simulation” approach
Case studies: Province of Utrecht, the Netherlands PRELUDE (EEA) New infrastructure in Puerto Rico

14
Traditional scenario approach
Preparation Interviews Construction of preference and zoning maps
Workshop 1: Design of alternatives Interactive software tool application Discussion and choice of alternative locations
Workshop 2: Calculation of the alternatives Different growth figures Chosen alternatives and LOV-alternative Indicators Analysis of results and discussion

15
Story and Simulation approach
Problem definition
Development of draft narrative
scenarios
Model development
and/or application
Quantification of narrative scenarios
Model runs and analysis of results
Feedback to stakeholder group
(From van Delden, Riddell, Maier, “A methodology for linking exploratory storylines and quantitative modelling in support of long-term integrated
planning”, Environmental Modeling and Software, upcoming)

16
Content
Spatial Decision Support Systems and Integrated Spatial Planning: what and how?
Land use modeling as a central component of the (I)SDSS
Application through traditional scenarios and “storyline and simulation” approach
Case studies: Province of Utrecht, the Netherlands PRELUDE (EEA) New infrastructure in Puerto Rico

17
Utrecht - different sectors and their criteria
Environmental hygiene Social coherence Economics Cultural history Landscape Traffic and transportation Ecology & nature Water resources Soil
18
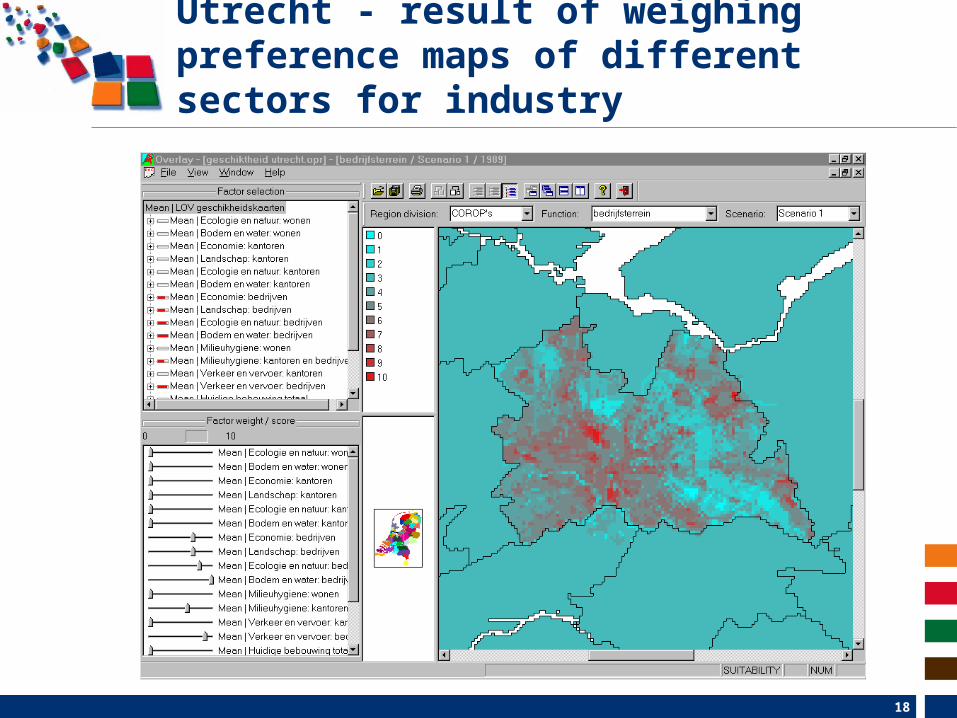
Utrecht - result of weighing preference maps of different sectors for industry
19
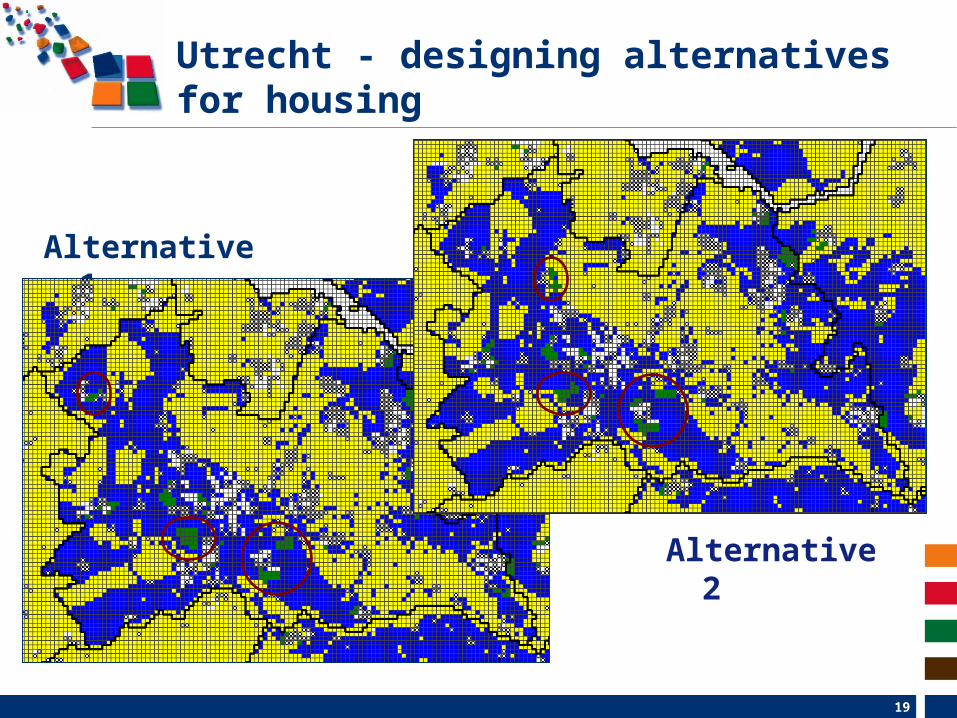
Utrecht - designing alternatives for housing
Alternative 1
Alternative 2

20
Utrecht - calculation of alternatives
Alternative 1 Alternative 2
AlternativeEnvironment Explorer

21
Utrecht - indicators
Job potential
Open space

22
Story and Simulation approach (SAS) for EEA (in PRELUDE)
Qualitative scenarioswritten by
stakeholders
Scenarios translatedin qualitative driving forces
and model parameters
Qualitative scenariooutput translated into
quantitative description
Quantitative modellingof scenario’s
EU-level
Quantitative modellingof scenario’s
Regional-level
1st meeting
Comparison by stakeholdersof the storylines with
the model output
2nd meeting
Consistent storylinesand
model calculations
3rd meeting

Research Institute for Knowledge Systems
23
SAS in PRELUDE - storylines
RIKS

Research Institute for Knowledge Systems
24
SAS in PRELUDE - storylines
RIKS

Research Institute for Knowledge Systems
25
SAS in PRELUDE – modeling results
RIKS

Research Institute for Knowledge Systems
26
SAS in PRELUDE – modeling results
RIKS

274 October 2007

28
Puerto Rico: construction PR66
19902015
2015 – PR66

Puerto Rico: probability for urbanization

30
Others…
Other examples: Assessment of desertification risks in the
Mediterranean Natural hazard (bush fires, flooding,
earthquakes, …) risks in Australia (South Australia) and New Zealand (Christchurch, Auckland, Wellington)
Effects of the Common Agricultural Policy in the EU (LUMOCAP)
More transport / land use interaction in Saudi Arabia, South Africa, Australia, …


Research Institute for Knowledge Systems
32RIKS

33
Utrecht - the preference mapsFactor map
Giving a value to the legend items
Preference of the sector
List of factor maps
Land use function

34
Utrecht - combining the preference maps
Housing Services Industry
35
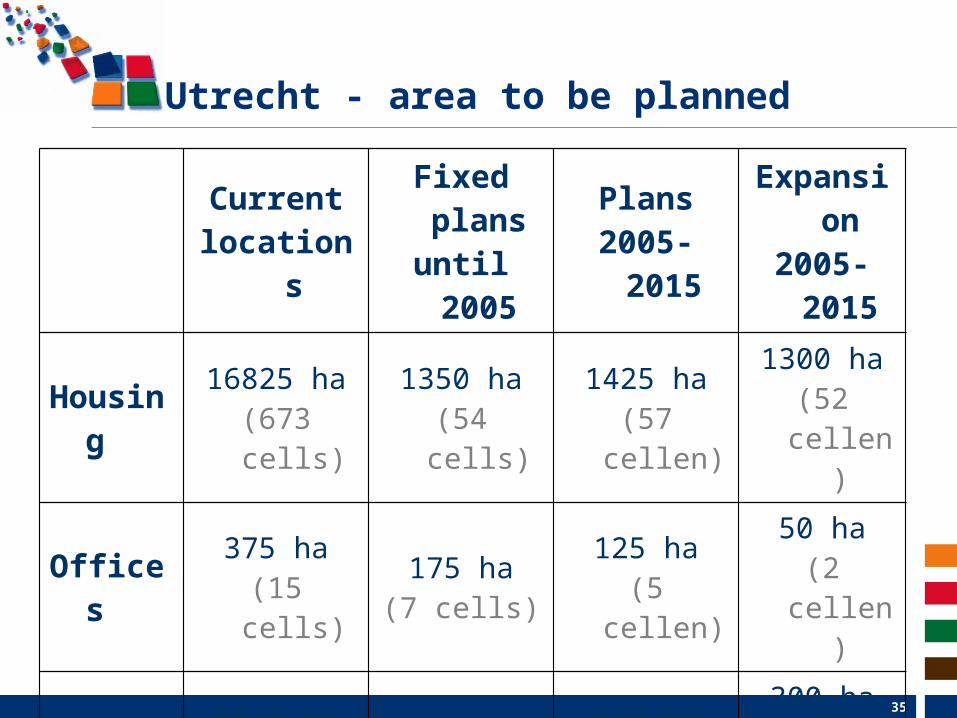
Utrecht - area to be planned
Currentlocations
Fixed plansuntil 2005
Plans2005-2015
Expansion2005-2015
Housing 16825 ha(673 cells)
1350 ha(54 cells)
1425 ha(57 cellen)
1300 ha(52 cellen)
Offices 375 ha(15 cells)
175 ha(7 cells)
125 ha(5 cellen)
50 ha(2 cellen)
Industry 3625 ha(145 cells)
175 ha(7 cells)
375 ha(15 cellen)
300 ha(12 cellen)