robust pricing of fixed income securities - netspar · robust pricing of fixed income securities...
TRANSCRIPT

Robust Pricing of Fixed Income
Securities
Ferenc Horvath, Frank de Jong, and Bas J.M. Werker
DP 08/2016-057

Robust Pricing of Fixed Income Securities∗
Ferenc Horvath† ‡, Frank de Jong‡, and Bas J.M. Werker‡
‡Tilburg University
August 23, 2016
∗We thank Anne Balter, Zsolt Bihary, Jakob Bosma, Joost Driessen, Hans Schumacher,and Mitja Stadje for useful comments on an earlier version of this paper, seminar par-ticipants at Corvinus University of Budapest, Tilburg University, Vrije Universiteit Am-sterdam, as well as participants of the Netspar Pension Day (Utrecht), the MAF 2016International Conference (Paris), and the Financial Econometrics and Empirical AssetPricing Conference (Lancaster). Financial support from Netspar is gratefully acknowl-edged.†Corresponding author. Tilburg University, Department of Finance, P.O. Box 90153,
5000 LE Tilburg, the Netherlands. Tel.: +31 13 466 4056. E-mail ad-dress: [email protected]

Robust Pricing of Fixed Income Securities
Abstract
We analyze a dynamic investment problem with interest rate risk andambiguity. After deriving the optimal terminal wealth and investment pol-icy, we expand our model into a robust general equilibrium model and cal-ibrate it to U.S. data. We confirm the bond premium puzzle, i.e., we needan unreasonably high relative risk-aversion parameter to explain excess re-turns on long-term bonds. Our model with robust investors reduces thisrisk-aversion parameter substantially: a relative risk aversion of less thanfour suffices to match market data. Additionally we provide a novel formu-lation of robust dynamic investment problems together with an alternativesolution technique: the robust version of the martingale method.
JEL classification: C61, G11, G12.Keywords: dynamic asset allocation, robustness, uncertainty, ambiguity,bond premium puzzle.
1 Introduction
Similarly to the equity premium puzzle, there exists a bond premium puz-
zle. The risk premium on long-term bonds is higher than predicted by
mainstream models using reasonable parameter values. This phenomenon
was first described in Backus, Gregory and Zin (1989), who show that in
bond markets “... the representative agent model with additively separable
preferences fails to account for the sign or the magnitude of risk premiums”.
Although the bond premium puzzle has received much less attention in the
literature than the equity premium puzzle, it is by no means of less impor-
tance. As Rudebusch and Swanson (2008) remark, the value of outstanding
long-term bonds in the U.S. is much larger than the value of outstanding
equity. The present literature about equilibrium bond pricing estimates an
unreasonably high relative risk aversion parameter. For instance Piazzesi
and Schneider (2007) estimate the relative risk-aversion parameter to be 57;
van Binsbergen, Fernandez-Villaverde, Koijen and Rubio-Ramrez (2012) es-
timate a value of relative risk-aversion in their model around 80; while Rude-
busch and Swanson (2012) estimate it to be 110. Although several potential
explanations can be found in the literature, none of the provided solutions
are generally accepted – just as in the case of the equity premium puzzle.
In this paper, we approach the bond premium puzzle from a new angle.
A key parameter in any investment allocation model is the risk premium
earned on investing in bonds or, equivalently, the prices of risk in a factor
model. However, given a limited history of data, the investor faces substan-
tial uncertainty about the magnitude of these risk premiums. We build on
1

the literature on robust decision making and asset pricing and formulate a
dynamic investment problem under robustness in a market for bonds and
stocks. Our model features stochastic interest rates driven by a two-factor
Gaussian affine term structure model. The investor chooses optimal portfo-
lios of bonds and stocks taking into account the uncertainty about the bond
and stock risk premiums. We solve the representative investor’s optimiza-
tion problem and give an explicit solution to the optimal terminal wealth,
the least-favorable physical probability measure, and the optimal investment
policy.
We calibrate the risk aversion and robustness parameters by equating
the optimal portfolio weights implied by the model to weights observed in
actual aggregate portfolio holdings. This is different from the existing litera-
ture, which typically calibrates first-order conditions of a consumption-based
asset pricing model to the observed expected returns. Given the very low
volatility of consumption, and the low correlation of stock and bond returns
with consumption growth, that approach requires high levels of risk aversion
to fit the observed risk premiums. Our approach only uses the optimal asset
demands, which do not directly involve the volatility of or correlations with
consumption; only the volatilities of the returns and intertemporal hedging
demands for the assets are required. We then use the concept of detection
error probabilities to disentangle the risk- and uncertainty-aversion param-
eters.
We estimate the parameters of our model using 42 years of U.S. market
data by Maximum Likelihood. We find that matching the optimal equity
demand to market data gives reasonable values for the risk-aversion param-
2

eter. If we assume that the financial market consists of only a stock market
index and a money market account, the calibrated risk-aversion parameter
in the non-robust version of our terminal wealth utility model is reasonable,
1.92 (see Table 5). For the bond demand the situation is very different:
reasonable values of the risk-aversion parameter imply far too low bond risk
premiums. The reason for this are the high bond risk premiums relative
to the bond price volatilities. Only with robustness we can find reasonable
values for the risk-aversion parameter to match observed demands. When
calibrating the non-robust version of our model to U.S. market data, we
need a value between 7.9 and 69.1 (depending on the investment horizon of
the representative investor) for the risk-aversion parameter to explain the
market data. After accounting for robustness, these values decrease to 2.9
and 25.5, respectively (see Table 6). Thus, our model can to a large extent
resolve the bond premium puzzle.
Apart from our results on the bond premium puzzle, another contribu-
tion of our paper is of a more technical nature. We develop a novel method
to solve the robust portfolio problem, the robust martingale method. We
show in Theorem 1 that the robust dynamic investment problem can be in-
terpreted as a non-robust dynamic investment problem with so-called least-
favorable risk premiums, which are time-dependent but deterministic. This
means that, based on our Theorem 1, we can formulate the objective func-
tion of the investor at time zero non-recursively. The importance of this
contribution is stressed by Maenhout (2004), who writes: ”Using the value
function V itself to scale θ may make it difficult to formulate a time-zero
problem, as V is only known once the problem is solved.” In Theorem 1 we
3

prove that the time-zero robust dynamic investment problem can be formu-
lated ex ante, before solving for the value function itself, and we also provide
this alternative (but equivalent) formulation of the investment problem in
closed form. Since without this non-recursive formulation the problem can
only be solved recursively, the literature so far had to rely exclusively on
the Hamilton-Jacobi-Bellman differential equation to solve robust dynamic
investment problems. Our alternative formulation of the problem makes it
possible to apply an alternative technique to solve robust dynamic invest-
ment problems, namely a robust version of the martingale method. This
method is likely also applicable in other settings.
Our paper relates to the literature on the bond premium puzzle. Backus,
Gregory and Zin (1989) use a consumption-based endowment economy to
study the behavior of risk premiums. They conclude that in order for their
model to match the risk premium observed in market data, the coefficient
of relative risk aversion must be at least around 8-10. This value for the rel-
ative risk-aversion parameter is considered too high by the majority of the
literature to reconcile with both economic intuition and economic experi-
ments. Further early discussion on the bond premium puzzle can be found in
Donaldson, Johnsen and Mehra (1990) and Den Haan (1995). They demon-
strate that the bond premium puzzle is not a peculiarity of the consumption-
based endowment economy, but it is also present in real business-cycle mod-
els. This remains true even if one allows for variable labor and capital or
for nominal rigidities. Rudebusch and Swanson (2008) examine whether
the bond premium puzzle is still present if they use a more sophisticated
macroeconomic model instead of either the consumption-based endowment
4

economy or the real business-cycle model. They use several DSGE setups
and find that the bond premium puzzle remains even if they extend their
model to incorporate large and persistent habits and real wage bargaining
rigidities. However, Wachter (2008) provides a resolution to the puzzle by
incorporating habit-formation into an endowment economy. Piazzesi and
Schneider (2006) use Epstein-Zin preferences, but to match market data,
they still need a relative risk aversion of 59.
Our paper obviously relates to the literature on robust dynamic asset
allocation. Investors are uncertain about the parameters of the distribu-
tions that describe returns. In robust decision making, the investor makes
decisions that “not only work well when the underlying model for the state
variables holds exactly, but also perform reasonably well if there is some
form of model misspecification” (Maenhout (2004)). We use the minimax
approach to robust decision making. A comparison of the minimax approach
with other approaches, such as the recursive smooth ambiguity preferences
approach, can be found in Peijnenburg (2010). The minimax approach as-
sumes that the investor considers a set of possible investment paths regarding
the parameters she is uncertain about. She chooses the worst case scenario,
and then she makes her investment decision using this worst case scenario to
maximize her value function. To determine the set of possible parameters
we use the penalty approach. This means that we do not set an explicit
constraint on the parameters about which the investor is uncertain, but we
introduce a penalty term for these parameters. Deviations of the parameters
from a so-called base model are penalized by this function. Then the investor
solves her unconstrained optimization problem using this new goal function.
5

The penalty approach was introduced into the literature first by Anderson,
Hansen and Sargent (2003), and it was applied by Maenhout (2004) and
Maenhout (2006) to analyze equilibrium equity prices. Maenhout (2004)
finds that in the case of a constant investment opportunity set robustness
increases the equilibrium equity premium and it decreases the risk-free rate.
Concretely, a robust Duffie-Epstein-Zin representative investor with reason-
able risk-aversion and uncertainty-aversion parameters generate a 4% to 6%
equity premium. Furthermore, Maenhout (2006) finds that, if the invest-
ment opportunity set is stochastic, robustness increases the importance of
intertemporal hedging compared to the non-robust case. We confirm this
result in our setting (see Corollary 1). While our paper sheds light on the im-
portance of parameter uncertainty for asset prices, several papers analyzed
the effects of parameter uncertainty on asset allocation. Branger, Larsen,
and Munk (2013) solve a stock-cash allocation problem with a constant risk-
free rate and uncertainty aversion. The model of Flor and Larsen (2014)
features a stock-bond-cash allocation problem with stochastic interest rates
and ambiguity, while Munk and Rubtsov (2014) also account for inflation
ambiguity. Feldhutter, Larsen, Munk, and Trolle (2012) investigate the im-
portance of parameter uncertainty for bond investors empirically.
The paper is organized as follows. Section 2 introduces our model, i.e.,
the financial market and the robust dynamic optimization problem. Sec-
tion 2 also provides the solution to the robust investment problem, using
the martingale method. In Section 3 we calibrate our model to our data.
In Section 4 we solve for the equilibrium prices and in Section 5 we disen-
tangle the risk aversion from the uncertainty aversion using detection error
6

probabilities. Section 6 concludes.
2 Robust Investment Problem
We consider agents that have access to an arbitrage-free complete financial
market consisting of a money market account, constant maturity bond funds,
and a stock market index. The short rate rt is assumed to be affine in an
N -dimensional factor Ft, i.e.,
rt = A0 + ι′Ft, (1)
where ι denotes a column vector of ones. The factors Ft follow anN -dimensional
Ornstein-Uhlenbeck process, i.e.,
dFt = −κ(Ft − µF )dt+ σFdWQF,t. (2)
Here µF is an N -dimensional column vector of long-term averages, κ is an
N × N diagonal mean-reversion matrix, σF is an N × N lower triangular
matrix with strictly positive elements in its diagonal, and WQF,t is an N -
dimensional column vector of independent standard Wiener processes under
the risk-neutral measure Q. The value of the available stock market index
is denoted by St and satisfies
dSt = Strtdt+ St
(σ′FSdWQ
F,t + σN+1dWQN+1,t
), (3)
7

where σN+1 is strictly positive, σFS is an N -dimensional column vector
governing the covariance between stock and bond returns, and WQN+1,t is
a standard Wiener process (still under the risk-neutral measure Q) that is
independent ofWQF,t. As our financial market is arbitrage-free and complete,
such a risk-neutral measure Q indeed exists and is unique.
Although we will study the effect of ambiguity on investment decisions
and equilibrium prices below, it is important to note that, due to the mar-
ket completeness, the risk-neutral measure Q is unique and agents cannot
be ambiguous about it. Indeed, the risk-neutral measure Q is uniquely de-
termined by market prices and, thus, if all investors accept that there is
no arbitrage opportunity on the market and they observe the same market
prices, then they all have to agree on the risk-neutral measure Q as well.
Investors will be ambiguous in our model about the physical probability
measure or, equivalently, about the prices of risk of the Wiener processes
WQF,t and WQ
N+1,t. We denote WQF,t and WQ
N+1,t jointly as
WQt =
WQF,t
WQN+1,t
. (4)
Now consider an investor with investment horizon T . She derives utility
from terminal wealth. This investor is ambiguous about the physical proba-
bility measure. She has a physical probability measure B in mind which she
considers the most probable, but she is uncertain about whether this is the
true physical probability measure or not. This measure B is called the base
measure. As the investor is not certain that the measure B is the true phys-
8
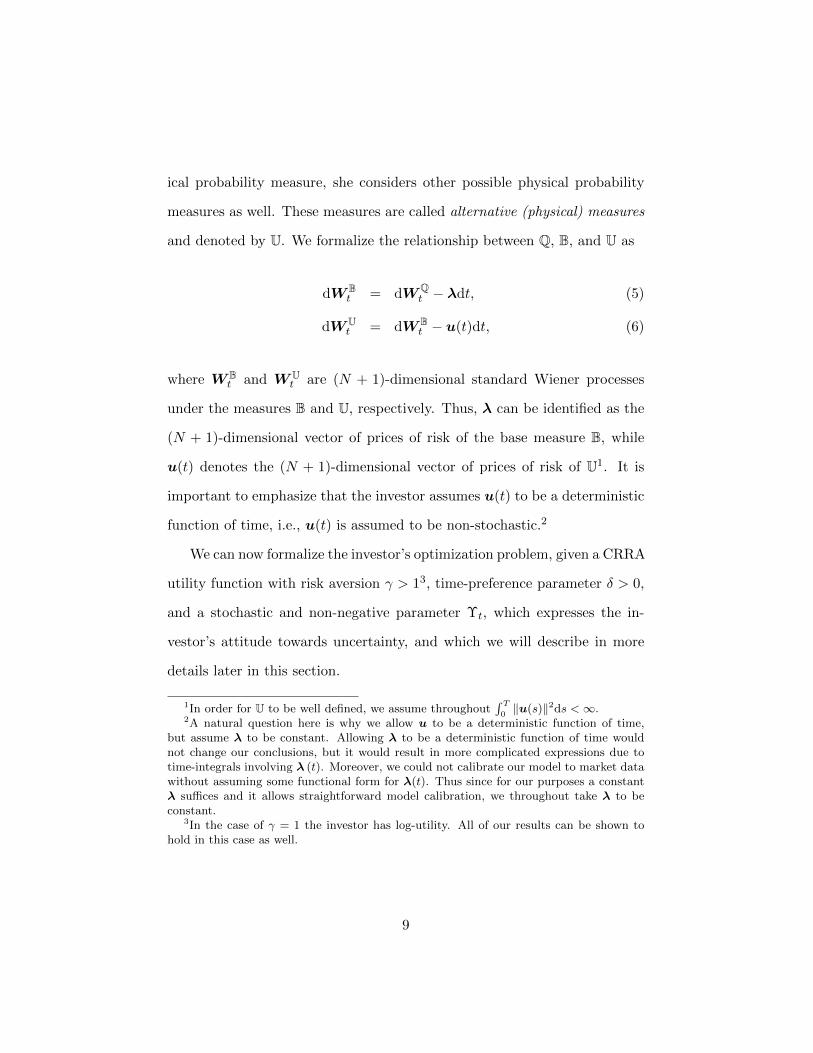
ical probability measure, she considers other possible physical probability
measures as well. These measures are called alternative (physical) measures
and denoted by U. We formalize the relationship between Q, B, and U as
dW Bt = dWQ
t − λdt, (5)
dW Ut = dW B
t − u(t)dt, (6)
where W Bt and W U
t are (N + 1)-dimensional standard Wiener processes
under the measures B and U, respectively. Thus, λ can be identified as the
(N + 1)-dimensional vector of prices of risk of the base measure B, while
u(t) denotes the (N + 1)-dimensional vector of prices of risk of U1. It is
important to emphasize that the investor assumes u(t) to be a deterministic
function of time, i.e., u(t) is assumed to be non-stochastic.2
We can now formalize the investor’s optimization problem, given a CRRA
utility function with risk aversion γ > 13, time-preference parameter δ > 0,
and a stochastic and non-negative parameter Υt, which expresses the in-
vestor’s attitude towards uncertainty, and which we will describe in more
details later in this section.
1In order for U to be well defined, we assume throughout∫ T0
‖u(s)‖2ds <∞.2A natural question here is why we allow u to be a deterministic function of time,
but assume λ to be constant. Allowing λ to be a deterministic function of time wouldnot change our conclusions, but it would result in more complicated expressions due totime-integrals involving λ (t). Moreover, we could not calibrate our model to market datawithout assuming some functional form for λ(t). Thus since for our purposes a constantλ suffices and it allows straightforward model calibration, we throughout take λ to beconstant.
3In the case of γ = 1 the investor has log-utility. All of our results can be shown tohold in this case as well.
9

Problem 1. Given initial wealth x, find an optimal pair (XT ,U) for the
robust utility maximization problem
V0(x) = infU
supXT
EU
{exp(−δT )
X1−γT
1− γ
+
∫ T
0Υs exp(−δs)
∂EU [log(dUdB)s
]∂s
ds
}, (7)
subject to the budget constraint
EQ[exp
(−∫ T
0rsds
)XT
]= x. (8)
The investor’s optimization problem as it is formulated here follows the
so-called martingale method. Given that our financial market is complete,
the martingale method maximization is over terminal wealth XT only. It
is not necessary, mathematically, to consider optimization of the portfolio
strategy as the optimal strategy will simply be that one that achieves the op-
timal terminal wealth XT . For (mathematical) details we refer to Karatzas
and Shreve (1998).
The outer inf in Problem 1 adds robustness to the investment prob-
lem as the investor considers the worst case scenario, i.e., she chooses the
measure U which minimizes the value function (evaluated at the optimal ter-
minal wealth). The investor considers all alternative probability measures
U which are equivalent4 to the base measure B.
4Two probability measures are said to be equivalent if and only if each is absolutelycontinuous with respect to the other. That is, the investor may be uncertain about theexact probability of events, but she is certain about which events happen for sure (i.e., withprobability 1) or with probability zero. This is a common, sometimes implicit, assumptionin this literature.
10

The first part of the expression in brackets in (7) expresses that the in-
vestor cares about her discounted power utility from terminal wealth XT .
The second term represents a penalty: if the investor calculates her value
function using a measure U which is very different from B, then the penalty
term will be high. We will be more explicit about what we mean by two
probability measures being very different from each other in the next para-
graph. The fact that the investor considers a worst-case scenario, including
the penalty term, ensures that she considers “pessimistic” probability mea-
sures (which result in low expected utility), but at the same time she only
considers “reasonable” probability measures (that are not too different from
the base measure).
Following Anderson, Hansen and Sargent (2003), we quantify how dif-
ferent probability measures are by their Kullback-Leibler divergence, which
is also known as the relative entropy. The reason why we use the Kullback-
Leibler divergence as the penalty function lies not only in its intuitive inter-
pretation (see, e.g., Cover and Thomas (2006), Chapter 2), but also in its
mathematical tractability.
We now rewrite Problem 1 and, following Maenhout (2004), introduce
a concrete specification for Υt. In view of (6) and Girsanov’s theorem, we
obtain
∂EU [log(dUdB)t
]∂t
=∂
∂tEU[
1
2
∫ t
0‖u(s)‖2ds−
∫ t
0u(s)dW U
s
](9)
=1
2‖u(t)‖2, (10)
where ‖u(t)‖ denotes the Euclidean norm of u(t). Furthermore, in order to
11

ensure homotheticity of the investment rule5, we use the following specifi-
cation of Υt, introduced in Maenhout (2004)6.
Υt = exp (δt)1− γθ
Vt(Xt), (11)
where Xt denotes optimal wealth at time t. Substituting (10) and (11)
into (7), the value function becomes
V0(x) = infU
supXT
EU
{exp(−δT )
X1−γT
1− γ
+
∫ T
0
(1− γ) ‖u(t)‖2
2θVt(Xt)dt
}. (12)
This expression of the value function is recursive, in the sense that the right-
hand side contains future values of the same value function. The following
theorem gives a non-recursive expression. All proofs are in the appendix.
Theorem 1. The solution to (12) with initial wealth x is given by
V0(x) = infU
supXT
EU
{exp
(−δT +
1− γ2θ
∫ T
0‖u(t)‖2dt
)X1−γT
1− γ
}. (13)
subject to the budget constraint
EQ[exp
(−∫ T
0rsds
)XT
]= x. (14)
Theorem 1 gives an alternative interpretation to the robust investment
5Homotheticity of the investment rule means that the optimal ratio of wealth to beinvested in a particular asset at time t does not depend on the wealth at time t itself.
6This specification has been criticized in, e.g., Pathak (2012) for its recursive nature.Alternatively we could have specified the robust investment problem directly as in Theo-rem 1.
12

Problem 1, with parameterization (11). Effectively, the investor maximizes
her expected discounted utility of terminal wealth, under the least-favorable
physical measure U, using an adapted subjective discount factor
δ − 1− γ2θ
1
T
∫ T
0‖u(t)‖2dt. (15)
As θ > 0, we obtain, for γ > 1, that the subjective discount rate increases in
the time-average of ‖u(t)‖2, i.e., in deviations of the least-favorable physical
measure U from the base measure B. The investor thus becomes effectively
more impatient. However, this is not the reason why the robustness affects
the asset allocation, as the subjective time preference does not affect the
asset allocation in this standard terminal wealth problem. Rather, the effect
of robustness is that the prices of risk that the robust investor uses are
affected by the least-favorable measure U in the value function in (13). We
show this formally in the following section.
2.1 Optimal terminal wealth
We now solve Problem 1 using the reformulation in Theorem 1. In the
present literature, dynamic robust investment problems are mostly solved
by making use of a “twisted” Hamilton-Jacobi-Bellman (HJB) differential
equation. Solving this HJB differential equation determines both the opti-
mal investment allocation and the optimal final wealth. However, we pro-
pose to use the so-called martingale method. This approach has not only
mathematical advantages (one does not have to solve higher-order partial
differential equations), but it also provides economic intuition and insights
13

into the decision-making of the investor. We provide this intuition at the
end of this section, directly after Theorem 2. The martingale method was
developed by Cox and Huang (1989) for complete markets, and a detailed
description can be found in Karatzas and Shreve (1998). The basic idea
is to first determine the optimal terminal wealth XT (Theorem 2) and to
subsequently determine the asset allocation that the investor has to choose
in order to achieve that optimal terminal wealth (Corollary 1).
In our setting of robust portfolio choice, we can still follow this logic.
It is important to note that the budget constraint (8) is, obviously, not
subject to uncertainty, i.e., Q is given. The value function in Theorem 1
contains an inner (concerningXT ) and an outer (concerning U) optimization.
Solving these in turn leads to the following result, whose proof is again in
the appendix.
Theorem 2. The solution to the robust investment Problem 1 under (11)
is given by
XT = xexp
(1γ
∫ T0 (u(t) + λ)′ dWQ
t + 1γ
∫ T0 rtdt
)EQ exp
(1γ
∫ T0 (u(t) + λ)′ dWQ
t + 1−γγ
∫ T0 rtdt
) , (16)
with the least-favorable distortions
u(t)F = − θ
γ + θ
[λF + σ′FB(T − t)′ι
], (17)
u(t)N+1 = − θ
γ + θλN+1, (18)
where B(·) is defined in (54).
14

Equation (16) shows the stochastic nature of the optimal terminal wealth.
The denominator is a scaling factor, and the numerator can be interpreted
as the exponential of a (stochastic) yield on the investment horizon T . The
investor achieves this yield on her initial wealth x if she invests optimally
throughout her life-cycle.
The absolute value of the least-favorable distortions (17) and (18) in-
crease as θ increases. This is in line with the intuition that a more uncertainty-
averse investor considers alternative measures that are “more different” from
the base measure. If the investor is not uncertainty-averse, i.e., θ = 0, the
least-favorable distortions are all zero. This means that the investor consid-
ers only the base measure and she makes her investment decision based on
that measure. On the other hand, if the investor is infinitely uncertainty-
averse, i.e., θ =∞, the least-favorable distortions are
u(t)F = −[λF + σ′FB(T − t)′ι
], (19)
u(t)N+1 = −λN+1. (20)
An infinitely uncertainty-averse investor thus uses −σ′FB(T − t)′ι as the
market price of risk induced by W UF,t and 0 as the market price of risk
induced by WUN+1,t.
2.2 Optimal portfolio strategy
The final step in our theoretical analysis is to derive the investment strategy
that leads to the optimal final wealth XT derived in Theorem 2. The fol-
lowing theorem gives the optimal exposures to the driving Brownian motion
15

WQt . The proof can be found in the appendix.
Theorem 3. Under the conditions of Theorem 2, the optimal final wealth
XT is achievable using the wealth evolution
dXt = . . . dt+
[λ′Fγ + θ
+1− (γ + θ)
γ + θι′B(T − t)σF ;
λN+1
γ + θ
]XtdW
Qt , (21)
starting from X0 = x.
Introducing the notation
B (τ) = [B (τ1) ι; . . . ;B (τN ) ι] , (22)
where τj denotes the maturity of bond fund j, we can state the following
corollary (proved in the appendix).
Corollary 1. Under the conditions of Theorem 2, the optimal investment
is a continuous re-balancing strategy where the fraction of wealth invested in
the constant maturity bond funds is
πB,t =− 1
γ + θB (τ)−1
(σ′F)−1(
λF −λN+1
σN+1σFS
)− 1− γ − θ
γ + θB (τ)−1B (T − t) (23)
and the fraction of wealth invested in the stock market index is
πS,t =λN+1
(γ + θ)σN+1. (24)
Equations (23) and (24) provide closed-form solutions for the optimal
16

fractions of wealth to be invested in the bond and stock markets. For the
latter one, this fraction is time independent and it is equal to the market
price of the idiosyncratic risk of the stock market (i.e., λN+1) divided by
(γ + θ) and by the volatility of the unspanned stock market risk σN+1. So
even though the return on the stock market is influenced by all of the N + 1
sources of risk, only the stock market specific risk matters when the investor
decides how much to invest in the stock market. This investment policy
closely resembles the solution to Merton’s problem (Merton (1969)), the
main difference being that γ is replaced by γ + θ in the denominator.
The optimal fraction to be invested in the bonds has two components
(similarly to Merton’s intertemporal consumption model (Merton (1973)).
The first component is the myopic demand, and its form is similar to that of
(24). The second component represents the intertemporal hedging demand,
and it is present due to the stochastic nature of the investment opportunity
set: the investor holds this component in order to protect herself against
unfavorable changes of the N factors. The main difference to the solution
to Merton’s problem is again γ being replaced by γ + θ. This means that if
we compare a robust and a non-robust investor’s optimal investment policy
(with the same level of relative risk-aversion), the only difference between
them is that in the robust investor’s case the risk-aversion parameter γ is
replaced by the sum of the risk-aversion and the uncertainty aversion pa-
rameters, γ+ θ. In (23) we find that robustness increases the intertemporal
hedging demand of the investor. This finding is in accordance with Maen-
hout (2006).
17

3 Model calibration
In this section we calibrate our model to market data. We use weekly ob-
servations from 5 January 1973 to 29 January 2016. We use continuously
compounded zero-coupon yields with maturities of 3 months, 1 year, 5 years,
and 10 years. The zero-coupon yields for maturities of 1 year, 5 years, and
10 years were obtained from the US Federal Reserve Data Releases, while
the yields for maturity of 3 months are the 3-month T-bill secondary mar-
ket rates from the St. Louis Fed Fred Economic Data.7 The spot rates of
1 and 2 months of maturity sometimes show extremely large changes within
one period, so the shortest maturity that we used is 3 months. Regarding
the sample period we did not go back further than 1973, because yield curve
estimations from earlier years contain relatively high standard errors due to
the many missing values. Moreover, the monetary policy before the 1970s
was very different from the period afterwards. As stock market index we
use the continuously compounded total return index of Datastream’s US-DS
Market.8
To utilize both cross-sectional and time-series bond market data, we fol-
low the estimation methodology of de Jong (2000) based on the Kalman filter
and Maximum Likelihood. The error terms in the observation equation are
allowed to be cross-sectionally correlated, but they are assumed to be seri-
ally uncorrelated. We initialize the Kalman filter recursions by conditioning
on the first observations and the initial MSE matrix equals the covariance
7These 3-month yields assumed quarterly compounding, so we manually transformedthem into continuously compounded yields.
8Datastream code: TOTMKUS(RI).
18

matrix of the observation errors. The initial factor values are set equal to
their long-term mean. For identification purposes µF is assumed to be a
zero vector. The standard errors of the estimated parameters are obtained
as the square roots of the diagonal elements of the inverted Hessian matrix.
Table 1 contains our estimates9.
Table 1. Parameter estimates and standard errorsEstimated parameters and standard errors using Maximum Likelihood withweekly observations. At each time we observed four points on the U.S. zero-coupon, continuously compounded yield curve, corresponding to maturitiesof 3 months, 1 year, 5 years and 10 years; and the total return index ofDatastream’s US-DS Market. The observation period is from 5 January 1973to 29 January 2016.
Estimated parameter Standard errorκ1 0.0763∗∗∗ 0 .0024
κ2 0.3070∗∗∗ 0 .0108
A0 0.0862∗∗∗ 0 .0013
λF,1 −0.1708−∗∗∗ 0 .1528
λF,2 −0.5899∗∗∗− 0 .1528
λN+1 0.3180∗∗∗ 0 .1528σF,11 0.0208∗∗∗ 0 .0009σF,21 −0.0204∗∗∗− 0 .0012σF,22 0.0155∗∗∗ 0 .0003σFS,1 −0.0035−∗∗∗ 0 .0038σFS,2 −0.0121∗∗∗− 0 .0035σN+1 0.1659∗∗∗ 0 .0025
One of the two factors exhibits reasonably strong mean reversion as κ2
is higher than 0.3, while the mean-reversion parameter of the other factor
is quite small (around 0.08), however still statistically significantly different
9As a robustness check, we also estimated the parameters using monthly and quarterlydata. Our estimates are very similar to the ones we obtained using weekly data, whichverifies that our model is indeed a good description of the behaviour of returns. All ourobservations are on the last trading day of the particular period.
19

from zero. The long-term mean of the short rate, under the risk-neutral
measure, A0 is estimated to be around 9%. The negative sign of σF,21
shows that there is a negative correlation between the two factors. The two
elements of σFS are economically not significant and only one of them is
statistically significantly different from zero. σN+1, on the other hand, is
both statistically and economically significant: it is around 17% per annum.
The market prices of the two risk sources that influence the factors, λF , are
both negative.
Table 2. Model implied instantaneous excess returns, volatilitiesand Sharpe ratiosThe model implied instantaneous expected excess returns, volatilities of re-turns and Sharpe ratios using the estimates in Table 1.
Expected Volatility Sharpe
excess return of return ratioConstant maturity (1 y.) bond fund 0.83% 01.36% 0.61Constant maturity (5 y.) bond fund 2.93% 15.25% 0.56Constant maturity (10 y.) bond fund 4.25% 9.53% 0.45
Stock market index 6.05% 16.64% 0.36
Using these estimates, we calculate the model-implied instantaneous ex-
pected excess returns, volatilities and Sharpe ratios for the constant ma-
turity bond funds with maturities of 1 year, 5 years, and 10 years and for
the stock market index fund (Table 2). The stock market index fund has
the highest expected excess return (6.05%), but also the highest volatil-
ity (16.64%). Regarding the constant maturity bond funds, the expected
excess returns are lower than for the stock market index fund: for 10 years
of maturity, the expected excess return is slightly higher than 4%. At the
same time, the lower expected excess returns come with lower volatilities,
20

which are 1.36%, 5.25% and 9.53% for the three bond funds, respectively.
The highest Sharpe ratio is produced by the constant maturity bond fund
with 1 year of maturity: its volatility is relatively low (only 1.36%) given its
expected excess return of 0.83%.
For comparison purposes, we also estimated the expected excess returns,
the volatilities and the Sharpe ratios directly using excess return data. We
used the 3 month T-bill rate as a proxy for the risk-free rate10. We used the
same stock market index data that we used when estimating the parameters,
with weekly observations. To directly estimate the returns, the volatilities
and the Sharpe ratios of constant maturity bond funds, we assumed that the
investor buys the bond fund at the beginning of the quarter and sells it at
the end of the quarter, when its maturity is already 3 months less. To this
end we used the same continuously compounded, zero-coupon yield curve
observations that before, now with quarterly frequency, plus we observed
three additional points on the yield-curve, namely for maturities of 6 months,
4 years and 9 years. These three additional maturities were used – together
with the maturities of 1 year, 5 years and 10 years – to obtain our estimates
by linear interpolation for the continuously compounded, zero coupon yields
for 9 months, 4.75 years and 9.75 years. Our direct estimates of the expected
excess returns, the volatilities, and the Sharpe ratios can be found in Table 3.
The directly estimated Sharpe ratio of the stock market index fund
is 0.37, which is practically the same as the model-implied value. The es-
timated expected excess returns of the constant maturity bond funds with
10We compared the model implied risk-free rates and the 3 month T-bill rates for theentire estimation period, and they are very close to each other. So the 3 month T-bill rateis a good proxy for the risk-free rate.
21

Table 3. Directly estimated excess returns, volatilities andSharpe ratiosThe directly estimated excess returns, volatilities and Sharpe ratios, usingthe same observation period as for estimating the parameters in Table 1,assuming 3 months holding period.
Expected Volatility Sharpe
excess return ratioConstant maturity (1 y.) bond fund 1.53% 11.64% 0.94Constant maturity (5 y.) bond fund 2.85% 17.08% 0.40Constant maturity (10 y.) bond fund 4.40% 12.86% 0.34
Stock market index 6.07% 16.58% 0.37
maturities of 5 and 10 years are very close to their model implied counter-
parts: they are 2.85% and 4.40%. The directly estimated expected excess
return for the constant maturity bond fund with 1 year of maturity is some-
what higher than its model-implied counterpart. The directly estimated
volatilities of the bond funds are slightly higher than what the model im-
plies, which leads to lower values of the directly estimated Sharpe ratios for
maturities of 5 years and 10 years.
We can clearly recognize the bond premium puzzle in Tables 2 and 3. The
Sharpe ratios of all of the constant maturity bond funds are higher than the
Sharpe ratio of the stock market index, the only exception being the directly
estimated Sharpe ratio of the constant maturity bond fund with 10 years
of maturity. Even without considering the supply side, these Sharpe ratios
of long-term bonds seem very high given a reasonable level of risk aversion.
Interestingly, the puzzle is stronger in the case of the shorter maturity bond
funds: the Sharpe ratio of the 1-year constant maturity bond fund is 0.61,
while that of the 10-year constant maturity bond fund is 0.45. We now
22

proceed to show that ambiguity aversion can explain this bond-premium
puzzle to a large extent.
4 Robust general equilibrium
In Section 2 we obtained the optimal investment policy of the representative
investor: if she would like to maximize her value function (7) subject to her
budget constraint (8), she has to invest according to (23) and (24). In this
section we introduce the concept of robust general equilibrium and we esti-
mate the sum of the risk-aversion and uncertainty-aversion parameters γ+θ.
Section 5 will be devoted to separately identifying γ and θ using the concept
of detection error probabilities.
Definition 1. The market is in robust general equilibrium if the following
conditions are satisfied:
1. The representative investor solves Problem 1 with parameterization (11).
2. All of the security markets (the bond markets, the stock market and –
as a consequence – the money market) clear continuously, i.e., for all
t ∈ [0, T ],
πB,t = π∗B ∀ t ∈ [0, T ] , (25)
πS,t = π∗S ∀ t ∈ [0, T ] , (26)
where π∗B and π∗S denote the exogenously given supply of the N constant
maturity bond funds and of the stock market index as a fraction of the total
wealth of the economy.
If we substitute the optimal investment ratios for the bonds and the stock
23

into the market clearing equations (25)-(26), we obtain that the market is
in robust equilibrium if, for all t ∈ [0, T ], we have
π∗B =− 1
γ + θB (τ)−1
(σ′F)−1(
λF −λN+1
σN+1σFS
)− 1− γ − θ
γ + θB (τ)−1B (T − t) ι, (27)
π∗S =λN+1
(γ + θ)σN+1. (28)
We perform the calibration assuming different exogenous supply sides
and several different sets of market clearing conditions, which will be sub-
sets of the market clearing conditions (25)-(26). To calibrate γ + θ, we use
our estimates from Table 1. In (27)-(28), γ and θ appear only as a sum, so
they cannot be separately identified. Moreover, since the system (27)-(28)
is overidentified, an exact solution of γ + θ does not exist, hence we min-
imize the sum of squared differences to estimate γ + θ. I.e., we calculate
‖π∗B − πB‖2 + (π∗S − πS)2 for several T − t and γ + θ combinations, and
then, for each T − t, we select that value of γ + θ that minimizes this sum
of squared differences.
Since our model has two factors driving the short rate, we need two
constant maturity bond funds with different maturities to assure market
completeness. To determine the maturities of these two bond funds, we
use the data of U.S. government debt (Table 4). Since we have data avail-
able only for the clustered maturities as shown in Column 1, we assume
that the distribution of maturities within the clusters is uniform. This way
we can calculate the average maturities for each cluster (Column 4). For
24

Table 4. U.S. government debt by maturitiesThe government debt of the U.S. by maturities as of 1 September 2015and the average maturities of the maturity-clusters. When calculating theaverage maturities, we assumed that the distribution of the debts withinthe clusters is uniform. Moreover, we assumed that the average maturity ofdebts with more than 20 years of maturity is 25 years. Source: Datastream.
Maturity Debt outstanding Ratio of total Average(million USD) debt outstanding maturity
<1 year 2,890,796 0.2824 -
1-5 years 4,335,287 0.4235 3 years
5-10 years 2,035,095 0.1988 7.5 years
10-20 years 187,318 0.0183 15 years
>20 years 789,260 0.0771 25 years
bonds with more than 20 years of maturity we assume that their average
maturity is 25 years. Because the shortest maturity cluster is less than one
year, we treat this cluster of bonds as the money market account. Besides
the money market account our model needs two zero-coupon bonds with
different maturities in order to have a complete market. Since bonds with
1-5 years of maturity make up more then 42% of all government debt, we
assume in the calibration that one of the available zero-coupon bonds has
a maturity of 3 years. To determine the maturity of the other zero-coupon
bond, we calculate the weighted average of the maturities of bonds with
maturities of more than 5 years, where the weights are determined by their
amount outstanding. This way we obtain an average 12.55 years maturity
for the coupon bonds. As the duration of these coupon bonds is shorter
than their maturity, in the calibration we assume that a zero-coupon bond
with a maturity of 10 years is available.
Table 5 shows the calibrated γ+θ values for different investment horizons
25

Table 5. Calibrated values of the sum of the risk and uncertaintyaversion parametersCalibrated γ + θ values for several investment horizons and market clearingconditions. Estimates for all of the other parameters are from Table 1 andthe maturities of the available zero-coupon bonds are τ1 = 3 years andτ2 = 10 years. The market is assumed to be in equilibrium according toDefinition 1.
T − tγ + θ
πS = 1 00πS = 1 00πS = 0.67πBτ1 = 0 πBτ1 = 0 πBτ1 = 0.14πBτ2 = 0 πBτ2 = 0 πBτ2 = 0.10
10 1.92 154.20 97.78 69.14
15 1.92 019.17 18.09 16.90
20 1.92 011.85 11.48 011.00
25 1.92 109.44 09.23 08.92
30 1.92 108.32 08.16 07.92
50 1.92 106.96 06.86 06.70
100 1.92 106.68 06.59 06.44∞ 1.92 106.67 06.58 06.43
and market clearing conditions. As a first experiment, we only impose that
the stock market is in equilibrium, π∗S = 1. In this case, the required γ + θ
parameter is reasonable, 1.92, regardless of the investment horizon. Second,
we only impose the restrictions on the bond markets, assuming it is in zero
net supply, π∗B = 0. The calibrated γ+θ value now depends on the assumed
investment horizon T − t. The values for γ + θ are more than 150 for
T − t = 10 years and gradually decrease to 6.67 as T − t approaches infinity.
In the next experiment, we combine both restrictions on the stock and
26

bond market and assume the following exogenous stock and bond supply
π∗S = 1, (29)
π∗B = 0. (30)
The reasoning behind (29)-(30) is that if an agent in the economy borrows
money either by buying a long-term bond or by investing in the money-
market account, another player has to lend that money to her. As a result,
in general equilibrium the bond holdings of the representative agent will be
zero and she keeps all of her wealth invested in the stock market. Thus
in general equilibrium the representative investor’s holdings of long-term
bonds is zero, and all of her wealth is invested in the stock market. The
results of this experiment are shown in Column 4 of Table 5. If the investor’s
investment horizon is 10 years, she needs a risk-aversion plus uncertainty-
aversion parameter of nearly 100 in order to match market data. As the
investment horizon increases, the calibrated γ + θ value decreases to 6.58.
The first paper which described the bond premium puzzle, Backus, Gre-
gory and Zin (1989), calibrates the risk-aversion parameter to be around 8,
which is what we find using a reasonable investment horizon of 30 years.
Hence, our results confirm the bond premium puzzle: if we calibrate our our
model in the absence of ambiguity aversion (i.e., setting θ = 0), we need an
unreasonably high risk-aversion parameter.
Although the assumption that long-term government bonds are in zero
net supply is customary in the literature11, it is by no means innocuous,
11Note that several authors, e.g., Gomes and Michaelides (2008), assume that long-term
27

as noted in Donaldson and Mehra (2008). One may argue that the bond
supply is exogenously determined by the government (since we only consider
government bonds). Then the market clearing conditions are (25)-(26) with
π∗B and π∗S equal to the weights in a value-weighted market portfolio of stocks
and bonds. The U.S. stock market capitalization on 1 September 2015 was
20, 885, 920 million USD (using Datastream’s TOTMKUS index). Adding
up the amounts of debt outstanding in Table 4, we find that the total amount
of government debt of the U.S. is 10, 237, 756 million USD. According to our
model the financial market constitutes of the stock market, the bond market,
and the money market (assumed to be in zero net supply), thus the total
financial market capitalization is 31, 123, 676 million USD. This leads to
actual aggregate supply portfolio weights equal to
π∗S =20, 885, 920
31, 123, 676= 0.67, (31)
π∗Bτ1=
4, 335, 287
31, 123, 676= 0.14, (32)
π∗Bτ2=
3, 011, 673
31, 123, 676= 0.10. (33)
Using these market clearing conditions, the calibrated values of γ + θ are
very close to the previous calibration. For T −t = 10, the calibrated value of
γ+ θ is 69.14, and it decreases gradually for longer investment horizons. At
T − t = 30 it is 7.92 and as the investment horizon increases to infinity, γ+θ
converges to 6.43. Hence, also if we use the more realistic market clear-
ing conditions of (32)-(31) instead of (30)-(29), the bond-premium puzzle
government bonds are in strictly positive net supply.
28

remains with similar magnitude.
Figure 1 illustrates the behavior of the calibrated γ + θ values as the
time horizon changes. We assume the market clearing condition (31)–(33).
The white line shows the minimized sum of squared differences for given
investment horizons up to 100 years. As T − t approaches infinity, the
minimizing γ+θ converges to 6.43. If we decrease the investment horizon, the
minimizing γ+ θ is increasing. So the presence of the bond premium puzzle
is robust to the investment horizon: given any reasonable investment horizon
for our representative investor, if we calibrate our model in the absence of
uncertainty aversion (i.e., setting θ = 0), the risk-aversion parameter γ is
large. For example, for a 15 years investment horizon, the value of γ is 16.90
and for a 25 years horizon it is 8.92.We have illustrated above that the bond risk-premium puzzle is also
present in the sample period we consider, in the absence of uncertainty
aversion, i.e., for θ = 0. In the next section, we will identify the risk-aversion
parameter γ separately from the uncertainty-aversion parameter θ.
5 Separating risk and uncertainty aversion
In Section 4 we calibrated the sum of the risk and uncertainty aversion pa-
rameters (γ+θ) to market data, but without further assumptions we cannot
identify them separately. In this section we recall the concept of detection
error probability (Anderson, Hansen and Sargent (2003)) in order to iden-
tify the risk-aversion parameter γ and the uncertainty-aversion parameter θ
separately.
29

Figure 1. Sum of squared differences between supply and demandof the securitiesSum of squared differences between supply and demand of the two long-termbonds and the stock for different investment horizons T − t. The maturitiesof the two long-term bonds are 3 years and 10 years. The white line showsthe minimized sum of squared differences for given investment horizons T−tup to 100 years.
We assume that the investor observes the prices of N constant maturity
bond funds and of the stock market index. As assumed in Section 2, the
investor can observe these stock and bond prices continuously. The obser-
vation period is from t−H to t, where t is the moment of observation and
H > 0. We assume that she then performs a likelihood-ratio test to decide
whether the true physical probability measure is B or the least-favorable U as
derived in Theorem 2. To be more precise: we assume that she calculates the
ratio of the likelihoods of the physical probability measure being B and U,
respectively, and accepts the measure with the larger likelihood. If the true
30

measure is B, then the probability that the investor will be wrong is
PB(
logdBdU
< 0
). (34)
Similarly, if the true measure is U, the probability that the investor will be
wrong when determining the probability measure given a sample of data is
PU(
logdBdU
> 0
). (35)
We now define the detection error probability, following Anderson, Hansen
and Sargent (2003).
Definition 2. The detection error probability (DEP) is defined as
DEP =1
2PB(
logdBdU
< 0
)+
1
2PU(
logdBdU
> 0
). (36)
In the following theorem we give the detection error probability for any
arbitrary U. Then, in Corollary 2 we give the detection error probability for
the least favorable U as derived in Theorem 2. Both proofs again are in the
appendix.
Theorem 4. Assume that the investor (continuously) observes the prices
of N constant maturity bond funds and of the stock market index. The
observation period lasts from t−H to the moment of observation, t. Then,
the detection error probability of the investor for given U is
DEP = 1− Φ
(1
2
√∫ t
t−H‖u (s) ‖2ds
), (37)
31

where u (·) is defined in (6).
Plugging in the least-favorable U as derived in Theorem 2 leads to the
following corollary.
Corollary 2. Assume that the conditions of Theorem 4 hold. Then, the
detection error probability of the investor for the least-favorable U is
DEP = 1− Φ
(θ
2 (γ + θ)
√H(λ2N+1 + ‖λF ‖2
)+ ∆1 + ∆2
), (38)
with
∆1 = 2λ′Fσ′F
[(exp (−κ (T − t+H))− exp (−κ (T − t)))κ−2
+Hκ−1]ι, (39)
∆2 =N∑i=1
N∑j=1
(σFσ′F )ij
κiκj[Bii (T − t) +Bjj (T − t)−Bii (T − t+H)
−Bjj (T − t+H)−Cij (T − t) +Cij (T − t+H) +H] (40)
If the investor is not uncertainty-averse at all, her θ parameter is 0,
thus her detection error probability is 12 . This means that when solving
Problem 1, she chooses the alternative measure U which is exactly the same
as the base measure B, hence it is impossible to distinguish between them
based on a sample of data. This is reflected in her detection error probability
as well: in 50% of the cases she will be wrong when basing her decision on
the likelihood-ratio test described above, so she might as well just flip a coin
instead of basing her decision on a sample of data.
The more uncertainty-averse the investor is, that is, the larger θ, the
32

larger the distance between the chosen least-favorable U measure and the
base B measure. And the larger this distance between U and B, the easier it
is to determine (based on a sample of data) which of the two measures is the
true one. This is reflected in the detection error probability of the investor:
if θ is larger, Φ (·) is larger, and her detection error probability is lower.
That is, she will make the correct decision when distinguishing between the
two measures in a higher proportion of the cases.
The detection error probability also depends on the observation span H:
the longer time period the investor observes, the higher H will be and, thus,
ceteris paribus Φ(·) will be higher and the detection error probability will be
lower. If the observation span goes to infinity, the detection error probability
goes to zero.
Anderson, Hansen and Sargent (2003) argue that the largest amount of
uncertainty that should be entertained as reasonable corresponds to a de-
tection error probability of approximately 10%. Since we have 42 years of
data available to estimate our model, it is reasonable to assume that our
representative investor also has access to 42 years of data to distinguish be-
tween the base model and the alternative model. Given that her observation
period of 42 years is relatively long and that she can observe the data in
continuous time, we can reasonably assume that the detection error prob-
ability equals 10%. Table 6 presents the induced calibrated values for the
γ and θ separately, based on the estimates in Table 5. Besides the γ and θ
values, Column 5 of Table 6 shows by how much the risk-aversion parameter
decreases by the introduction of an uncertainty-averse representative agent.
33

Table 6. Disentangled risk- and uncertainty-aversion parametersCalibrated γ + θ values and their disentangled γ and θ components, basedon the estimates in Table 5. The detection error probability is 10%. Theobservation period is 42 years. The last column shows by how much robust-ness decreases the risk-aversion parameter that we need to match marketdata compared to the non-robust model.T − t γ + θ γ θ Decrease in γ due to robustness
10 69.1 25.5 43.6 63%
15 16.9 16.2 10.7 63%
20 11.0 14.1 16.9 63%
25 18.9 13.3 15.6 63%
30 17.9 12.9 15.0 63%
As Table 6 shows, regardless of the investment horizon of the represen-
tative investor, the required risk-aversion parameter to match market data
is decreased by about 63% as a result of the introduction of robustness in
our model. The relative risk aversion of the robust investor is much more
reasonable than that of a non-robust investor: for investment periods be-
tween 15 and 30 years, it is between about 2.9 and 6.2, compared to it being
between 7.9 and 16.9 in the case of a non-robust investor.
As a robustness check of our results, we also disentangle the sum of risk-
and uncertainty aversion parameters using higher (i.e., more conservative)
detection error probability values, concretely 15% and 20%. The results
are shown in Table 7 and Table 8, respectively. We see that assuming
a detection error probability of 15% still reduces the originally required
risk-aversion parameter by more than half of its original value, and even a
rather conservative assumption of 20% detection error probability results in
a decrease of 41.5% in the required risk-aversion parameter. This reinforces
the robustness of our findings that parameter uncertainty can explain a large
34

fraction of the bond premium puzzle.
Table 7. Disentangled risk- and uncertainty-aversion parametersCalibrated γ + θ values and their disentangled γ and θ components, basedon the estimates in Table 5. The detection error probability is 15%. Theobservation period is 42 years. The last column shows by how much robust-ness decreases the risk-aversion parameter that we need to match marketdata compared to the non-robust model.T − t γ + θ γ θ Decrease in γ due to robustness
10 69.1 33.9 35.2 51%
15 16.9 18.3 18.6 51%
20 11.0 15.4 15.6 51%
25 18.9 14.4 14.5 51%
30 17.9 13.9 14.0 51%
Table 8. Disentangled risk- and uncertainty-aversion parametersCalibrated γ + θ values and their disentangled γ and θ components, basedon the estimates in Table 5. The detection error probability is 20%. Theobservation period is 42 years. The last column shows by how much robust-ness decreases the risk-aversion parameter that we need to match marketdata compared to the non-robust model.T − t γ + θ γ θ Decrease in γ due to robustness
10 69.1 40.5 28.6 41%
15 16.9 19.9 17.0 41%
20 11.0 16.4 14.6 41%
25 18.9 15.2 13.7 41%
30 17.9 14.6 13.3 41%
6 Conclusion
We have shown that the introduction of uncertainty aversion in a standard
financial market offers a potential solution to the bond-premium puzzle. In
the presence of uncertainty aversion, the risk aversion of the representative
35

agent decreases to levels consistent with both economic intuition and exper-
iments. At the same time, our paper offers the methodological contribution
to formulate and solve the robust investment problem an uncertainty-averse
investor faces using the martingale method.
To disentangle risk aversion from uncertainty aversion, we assumed a
detection error probability of 10%, and we used 15% and 20% detection error
probability values as robustness checks of our findings. Assuming detection
error probability values between 10% and 20% is common in the literature,
but there is little research on what determines the level of the detection
error probability. This can be a fruitful line of future research. We also
assumed that the investor is not uncertain about the volatility. Relaxing
this assumption leads us out of the realm of the framework of Anderson,
Hansen and Sargent (2003). Extending the penalty approach of dynamic
robust asset allocation in a direction that allows for uncertainty about the
volatility is another potential area of future research.
Appendix
Proof of Theorem 1. From (12) the value function at time t satisfies
Vt(Xt) = EUt
{exp(−δT )
X1−γT
1− γ+
∫ T
t
(1− γ) ‖u (s) ‖2
2θVs(Xs)ds
}
= EUt
{exp(−δT )
X1−γT
1− γ
}+ EU
t
{∫ T
0
(1− γ) ‖u (s) ‖2
2θVs(Xs)ds
}−∫ t
0
(1− γ) ‖u (s) ‖2Vs(Xs)
2θds, (41)
36

where XT and U denote the optimal terminal wealth and least-favorable
physical measure, respectively. Introduce the square-integrable martingales,
under U,
M1,t = EUt
{exp(−δT )
X1−γT
1− γ
}, (42)
M2,t = EUt
{∫ T
0
(1− γ) ‖u (s) ‖2
2θVs(Xs)ds
}. (43)
According to the martingale representation theorem (see, e.g., Karatzas
and Shreve (1991), pp. 182, Theorem 3.4.15), there exist square-integrable
stochastic processes Z1,t and Z2,t such that
M1,t = EU0
{exp(−δT )
X1−γT
1− γ
}+
∫ t
0Z ′1,sdW
Us , (44)
M2,t = EU0
{∫ T
0
(1− γ) ‖u (s) ‖2
2θVs(Xs)ds
}+
∫ t
0Z ′2,sdW
Us . (45)
Substituting in (41), we can express the dynamics of the value function as
dVt(Xt) = −(1− γ) ‖u (t) ‖2
2θVt(Xt)dt+ (Z1,t + Z2,t)
′ dW Ut . (46)
This is a linear backward stochastic differential equation, that (together with
the terminal condition VT (XT ) = exp(−δT )X1−γT /(1 − γ)) can be solved
explicitly; see Pham (2009), pp. 141-142. The unique solution to (46) is
given by
ΓtVt(Xt) = EUt
{ΓT exp(−δT )
X1−γT
1− γ
}, (47)
37

where Γt solves the linear differential equation
dΓt = Γt(1− γ) ‖u (t) ‖2
2θdt; Γ0 = 1, (48)
i.e.,
Γt = exp
(∫ t
0
(1− γ) ‖u (s) ‖2
2θds
). (49)
Substituting into (47), we obtain the value function in closed form as
Vt(Xt) = EUt
{exp
(∫ T
t
(1− γ) ‖u (s) ‖2
2θds− δT
)X1−γT
1− γ
}. (50)
Recall that Xt and U represent the optimal wealth and least-favorable phys-
ical measure. As a result, we obtain (13).
Before continuing with the proofs of the remaining theorems, we recall
some well-known results.
Lemma 1. Under (1) and (2), we have
rt =A0 + ι′ [µF + exp (−κt) (F0 − µF )]
+
∫ t
0ι′ exp (−κ(t− s))σFdWQ
F,s. (51)
Proof. The proof directly follows from the solution of the stochastic differ-
ential equation of the Ornstein-Uhlenbeck process, for which see, e.g., Chin,
Nel and Olafsson (2014), pp. 132–133.
38

Lemma 2. Under (1) and (2), we have
∫ t
0rsds =
[A0 + ι′µF
]t+ι′B(t) (F0 − µF )+
∫ t
0ι′B(t−v)σFdWQ
F,v, (52)
with B defined as the matrix integral
B(t) =
∫ t
0exp (−κs) ds. (53)
Since κ is a matrix whose elements are constants, B (t) can be expressed in
the more compact form
B(t) = (I − exp {−κt})κ−1. (54)
Proof. From Lemma 1 we find
∫ t
0rsds =
[A0 + ι′µF
]t+ ι′B(t) (F0 − µF ) +
∫ t
0
∫ s
0ι′ exp (−κ(s− v))σFdWQ
F,vds
=[A0 + ι′µF
]t+ ι′B(t) (F0 − µF ) +
∫ t
0
∫ t
vι′ exp (−κ(s− v))σFdWQ
F,vds
=[A0 + ι′µF
]t+ ι′B(t) (F0 − µF ) +
∫ t
0ι′B(t− v)σFdWQ
F,v.
This completes the proof.
Lemma 2 immediately leads to the price of bonds in our financial market.
We briefly recall this for completeness. The price at time t of a nominal bond
39

with remaining maturity τ is given by
Pt(τ) = EQt exp
(−∫ t+τ
trsds
)= EQ
t exp
(−[A0 + ι′µF
]τ − ι′B(τ) (Ft − µF )−
∫ t+τ
tι′B(t+ τ − s)σFdWQ
F,s
)= exp
(−[A0 + ι′µF
]τ − ι′B(τ) (Ft − µF ) +
1
2
∫ τ
0‖ι′B(τ − s)σF ‖2ds
). (55)
As a result, the exposure of a constant τ -maturity bond fund to the factors
Ft is given by −ι′B(τ).
We now continue with the proofs of Theorem 2, 3, and 4.
Proof of Theorem 2. The first step of the optimization is to determine the
optimal terminal wealth, given the budget constraint. In order to determine
the optimal terminal wealth, we form the Lagrangian from (13) and (14).
This Lagrangian is given by
L(x) = infU
supXT
{EU exp
(1− γ
2θ
∫ T
0‖u(t)‖2dt− δT
)X1−γT
1− γ
−y[EQ exp
(−∫ T
0rtdt
)XT − x
]}= inf
UsupXT
{EQ exp
(∫ T
0(u(t) + λ)′ dWQ
t −1
2
∫ T
0‖u(t) + λ‖2dt
+1− γ
2θ
∫ T
0‖u(t)‖2dt− δT
)X1−γT
1− γ
−y[EQ exp
(−∫ T
0rtdt
)XT − x
]}, (56)
where y is the Lagrange-multiplier and the second equality uses the Girsanov
transformation (6).
40

We first consider the inner optimization, i.e., the optimal choice of the
final wealth XT given U. The first order condition for optimal final wealth,
denoted by XT , is
exp
(∫ T
0(u(t) + λ)′ dWQ
t −1
2
∫ T
0‖u(t) + λ‖2dt+
1− γ2θ
∫ T
0‖u(t)‖2dt− δT
)X−γT
= y exp
(−∫ T
0rtdt
). (57)
As the Lagrange multiplier y is still to be determined by the budget con-
straint, we can subsume all deterministic terms in a new Lagrange multiplier
y1 and solve
exp
(∫ T
0(u(t) + λ)′ dWQ
t
)X−γT = y1 exp
(−∫ T
0rtdt
), (58)
i.e.,
XT = y−1/γ1 exp
(1
γ
∫ T
0rtdt+
1
γ
∫ T
0(u(t) + λ)′ dWQ
t
), (59)
We can now substitute this optimal terminal wealth into the budget con-
straint (14) in order to obtain the optimal value of the Lagrange multiplier
(denoted by y1).
y−1/γ1 =
x
EQ exp(1−γγ
∫ T0 rtdt+ 1
γ
∫ T0 (u(t) + λ)′ dWQ
t
) . (60)
Substituting (60) into (59), the optimal terminal wealth given Q is obtained
explicitly. This yields (16).
We proceed by solving the outer optimization in (13), i.e., we find the
least-favorable distortions u. Substituting the optimal final wealth (59) into
41

the value function leads to
V0(x) = infU
EU
{exp
(−δT +
1− γ2θ
∫ T
0‖u(t)‖2dt
)X1−γT
1− γ
}
=x1−γ
1− γinfU
EU{
exp
(−δT +
1− γ2θ
∫ T
0‖u(t)‖2dt+
1− γγ
∫ T
0rtdt
+1− γγ
∫ T
0(u(t) + λ)′ dWQ
t
)}×[EQ exp
(1− γγ
∫ T
0rtdt+
1
γ
∫ T
0(u(t) + λ)′ dWQ
t
)]γ−1. (61)
We now use the Girsanov transforms (5)–(6) to obtain
V0(x) =x1−γ
1− γinfU
EQ{
exp
(−δT +
1− γ2θ
∫ T
0‖u(t)‖2dt+
1− γγ
∫ T
0rtdt
+1− γγ
∫ T
0(u(t) + λ)′ dWQ
t
)dUdQ
}×[EQ exp
(1− γγ
∫ T
0rtdt+
1
γ
∫ T
0(u(t) + λ)′ dWQ
t
)]γ−1=
x1−γ
1− γinfU
EQ{
exp
(−δT +
1− γ2θ
∫ T
0‖u(t)‖2dt+
1− γγ
∫ T
0rtdt
+1
γ
∫ T
0(u(t) + λ)′ dWQ
t −1
2
∫ T
0‖u(t) + λ‖2dt
)}×[EQ exp
(1− γγ
∫ T
0rtdt+
1
γ
∫ T
0(u(t) + λ)′ dWQ
t
)]γ−1=
x1−γ
1− γinfU
exp
(−δT +
1− γ2θ
∫ T
0‖u(t)‖2dt− 1
2
∫ T
0‖u(t) + λ‖2dt
)×[EQ exp
(1− γγ
∫ T
0rtdt+
1
γ
∫ T
0(u(t) + λ)′ dWQ
t
)]γ. (62)
42

Using Lemma 2 we find
V0(x) =x1−γ
1− γinfU
exp
(−δT +
1− γ2θ
∫ T
0‖u(t)‖2dt− 1
2
∫ T
0‖u(t) + λ‖2dt
)× exp
((1− γ)
[A0 + ι′µF
]T + (1− γ)ι′B(T ) (F0 − µF )
)×[EQ exp
(1− γγ
∫ T
0ι′B(T − t)σFdWQ
F,tdt+1
γ
∫ T
0(u(t) + λ)′ dWQ
t
)]γ=
x1−γ
1− γinfU
exp
(−δT +
1− γ2θ
∫ T
0‖u(t)‖2dt− 1
2
∫ T
0‖u(t) + λ‖2dt
)× exp
((1− γ)
[A0 + ι′µF
]T + (1− γ)ι′B(T ) (F0 − µF )
)× exp
(1
2γ
∫ T
0‖(1− γ)ι′B(T − t)σF + (uF (t) + λF )′ ‖2dt
+1
2γ
∫ T
0(uN+1(t) + λN+1)
2 dt
). (63)
Recall that uF (t) is an N -dimensional column vector containing the first
N elements of u(t) and uN+1(t) is its last element. Similarly, λF is the
N -dimensional column vector containing the first N elements of λ and λN+1
denotes its last element.
This expression of the value function allows to perform the outer mini-
mization with respect to U, i.e., with respect to u. The first-order condition
of this minimization reads, with respect to uF (t),
0 =1− γθuF (t)− uF (t)− λF +
1
γ
((1− γ)σ′FB(T − t)′ι+ uF (t) + λF
)=
1− γθuF (t) +
1− γγ
(uF (t) + λF ) +1− γγ
σ′FB(T − t)′ι
= (1− γ)γ + θ
γθuF (t) +
1− γγ
[σ′FB(T − t)′ι+ λF
]. (64)
This proves (17). Finally, minimizing the value function V0(x) with respect
43

to uN+1(t) we find the first-order condition
0 =1− γθ
uN+1(t)− uN+1(t)− λN+1 +1
γ(uN+1(t) + λN+1)
=
[1− γθ
+1− γγ
]uN+1(t) +
1− γγ
λN+1. (65)
This proves (18) and completes the proof.
Proof of Theorem 3. Theorem 2 has actually a fairly simple form in the
driving Brownian motion WQt . Using Lemma 2 we find
exp
(−∫ T
0rtdt
)XT
∝ exp
(∫ T
0
u(t)′ + λ′
γdWQ
t +1− γγ
∫ T
0
[ι′B(T − t)σF ; 0
]dWQ
t
)= exp
(∫ T
0
[λ′Fγ + θ
+1− (γ + θ)
γ + θι′B(T − t)σF ;
λN+1
γ + θ
]dWQ
t
). (66)
As exp(−∫ t0 rsds
)Xt = EQ
t exp(−∫ T0 rtdt
)XT , the wealth evolution (21)
is easily obtained.
Proof of Corollary 1. This is a direct consequence of Theorem 3 and the
martingale representation theorem (see, e.g., Karatzas and Shreve (1991),
pp. 182, Theorem 3.4.15).
Proof of Theorem 4. The investor observes the prices of N constant ma-
turity bond funds and of the stock market index in continuous time from
44

t−H to t. The moment of observation is t. Using (6) we have
log
(dBdU
)H
=− 1
2
∫ t
t−H‖u (s) ‖2ds+
∫ t
t−Hu (s) dWU
s
U∼N(−1
2
∫ t
t−H‖u (s) ‖2ds,
∫ t
t−H‖u (s) ‖2ds
). (67)
This implies
PU(
log
(dBdU
)H
> 0
)= 1− Φ
(1
2
√∫ t
t−H‖u (s) ‖2ds
). (68)
Due to symmetry, we have
PB(
log
(dBdU
)H
< 0
)= PB
(log
(dUdB
)H
> 0
)= PU
(log
(dBdU
)H
> 0
). (69)
Thus, using Definition 2, the detection error probability is
DEP = 1− Φ
(1
2
√∫ t
t−H‖u (s) ‖2ds
). (70)
Proof of Corollary 2. Substituting (19) and (20) into (70) and working out
the integrals, (38) follows directly.
45

References
Anderson, E.W. – Hansen, L.P. – Sargent, T.J. [2003]: A Quartet
of Semigroups for Model Specification, Robustness, Prices of Risk, and
Model Detection. Journal of the European Economic Association, Vol. I,
No. 1, pp. 68-123.
Backus, D. – Gregory, A. – Zin, S. [1989]: Risk Premiums in the Term
Structure. Journal of Monetary Economics, Vol. XXIV, No. 3, pp. 371-399.
van Binsbergen, J.H. – Fernandez-Villaverde, J. – Koijen, R.S.J.
– Rubio-Ramırez, J. [2012]: The term structure of interest rates in a
DSGE model with recursive preferences. Journal of Monetary Economics,
Vol. LIX, No. 7, pp. 634-648.
Branger, N. – Larsen, L.S. – Munk, C. [2013]: Robust Portfolio
Choice with Ambiguity and Learning about Return Predictability. Journal
of Banking & Finance, Vol. XXXVII, No. 5, pp. 1397–1411.
Brennan, M.J. - Schwartz, E.S. - Lagnado, R. [1997]: Strategic
Asset Allocation. Journal of Economic Dynamics and Control, Vol. XXI,
No. 8-9, pp. 1377-1403.
Brennan, M.J. – Xia, Y. [2000]: Stochastic Interest Rates and the Bond-
Stock Mix. Review of Finance, Vol. IV, No. 2, pp. 197-210.
Cagetti, M. - Hansen, L.P. - Sargent, T. - Williams, N. [2002]:
Robustness and Pricing with Uncertain Growth. The Review of Financial
Studies, Vol. XV, No. 2, pp. 363-404.
46

Campbell, J.Y. - Viceira, L.M. [2001]: Who Should Buy Long-Term
Bonds? The American Economic Review, Vol. XCI, No. 1, pp. 99-127.
Chin, E. – Nel, D. – Olafsson, S. [2014]: Problems and Solutions in
Mathematical Finance. Volume 1: Stochastic Calculus. Chichester: John
Wiley & Sons, Ltd.
Cox, J.C. – Huang, C.F. [1989]: Optimal consumption and portfolio
policies when asset prices follow a diffusion process. Journal of Economic
Theory, Vol. XLIX, No. 1, pp. 33-83.
Cover, T.M. – Thomas, J.A. [2006]: Elements of Information Theory.
2nd edition. Hoboken, New Jersey: John Wiley & Sons, Inc.
Deelstra, G. - Grasselli, M. - Koehl, P.-F. [2000]: Optimal In-
vestment Strategies in a CIR Framework. Journal of Applied Probability,
Vol. XXXVII, No. 4, pp. 936-946.
Donaldson, J.B. – Johnsen, T. – Mehra, R. [1990]: On the term
structure of interest rates. Journal of Economic Dynamics and Control,
Vol. XIV, No. 3-4, pp. 571-596.
Donaldson, J. – Mehra, R.[2008]: Risk-Based Explanations of the Eq-
uity Premium. In: R. Mehra, ed. 2008. Handbook of the Equity Risk Pre-
mium. Oxford: Elsevier B.V. Ch.2.
47

Feldhutter, P. – Larsen, L.S. – Munk, C. – Trolle, A.B. [2012]:
Keep it Simple: Dynamic Bond Portfolios Under Parameter Uncertainty.
Working Paper. Available at: http://papers.ssrn.com/sol3/papers.
cfm?abstract_id=2018844 Date of download: 3 December 2015
Flor, C.R. – Larsen, L.S. [2014]: Robust Portfolio Choice with Stochas-
tic Interest Rates. Annals of Finance, Vol. X, No. 2, pp. 243–265.
Gagliardini, P. - Porchia, P. - Trojani, F. [2009]: Ambiguity Aver-
sion and the Term Structure of Interest Rates. The Review of Financial
Studies, Vol. XXII, No. 10, pp. 4157-4188.
Garlappi, L. - Uppal, R. - Wang, T. [2007]: Portfolio Selection with
Parameter and Model Uncertainty: A Multi-Prior Approach. The Review
of Financial Studies, Vol. XX, No. 1, pp. 41-81.
Gomes, F. – Michaelides, A. [2008]: Asset Pricing with Limited
Risk Sharing and Heterogeneous Agents. The Review of Financial Stud-
ies, Vol. XXI, No. 1, pp. 415-448.
den Haan, W.J. [1995]: The term structure of interest rates in real
and monetary economies. Journal of Economic Dynamics and Control,
Vol. IXX, No. 5-7, pp. 909-940.
de Jong, F. [2000]: Time Series and Cross-section Information in
Affine Term-Structure Models. Journal of Business & Economic Statistics,
Vol. XVIII, No. 3, pp. 300-314.
48

Karatzas, I. – Shreve, S.E. [1991]: Brownian Motion and Stochastic
Calculus. New York City: Springer-Verlag New York, Inc.
Karatzas, I. – Shreve, S.E. [1998]: Methods of Mathematical Finance.
New York City: Springer-Verlag New York, Inc.
Lei, C.I. [2001]: Why Dont Investors Have Large Positions in Stocks? A
Robustness Perspective. Ph.D. Dissertation. University of Chicago, Depart-
ment of Economics
Leippold, M. - Trojani, F. - Vanini, P. [2008]: Learning and Asset
Pricing Under Ambiguous Information. The Review of Financial Studies,
Volume XXI, No. 6, pp. 2565-2597.
Liu, J. - Pan, J. - Wang, T. [2005]: An Equilibrium Model of Rare-Event
Premia and Its Implication for Option Smirks. The Review of Financial
Studies, Vol. XVIII, No. 1, pp. 131-164.
Maenhout, P.J. [2004]: Robust Portfolio Rules and Asset Pricing.
The Review of Financial Studies, Vol. XVII, No. 4, pp. 951-983.
Maenhout, P.J. [2006]: Robust Portfolio Rules and Detection-Error
Probabilities for a Mean-Reverting Risk Premium. Journal of Economic
Theory, Vol. CXXVII, No. 1, pp. 136-163.
Mehra, R. – Prescott, E.C. [1985]: The equity premium: A puzzle.
Journal of Monetary Economics, Vol. XV, No. 2, pp. 145-161.
49

Merton, R.C. [1969]: Portfolio Selection under Uncertainty: The
Continuous-Time Case. The Review of Economics and Statistics, Vol. LI,
No. 3, pp. 247-257.
Merton, R.C. [1971]: Optimum Consumption and Portfolio Rules in a
Continuous-Time Model. Journal of Economics Theory, Vol. III, No. 4,
pp. 373-413.
Merton, R.C. [1973]: An Intertemporal Capital Asset Pricing Model.
Econometrica, Vol. XLI, No. 5, pp. 867-887.
Munk, C. – Rubtsov, A. [2014]: Portfolio Management with Stochastic
Interest Rates and Inflation Ambiguity. Annals of Finance, Vol. X, No. 3,
pp. 419–455.
Munk, C. - Sørensen, C. [2004]: Optimal consumption and investment
strategies with stochastic interest rates. Journal of Banking & Finance,
Vol. XXVIII, No. 8, pp. 1987-2013.
Liu, J. [2010]: Portfolio Selection in Stochastic Environments. The Review
of Financial Studies, Vol. XX, No. 1, pp. 1-39.
Pathak, P.A. [2012]: Notes on Robust Portfolio Choice. Working pa-
per. Available at: http://citeseerx.ist.psu.edu/viewdoc/download?
doi=10.1.1.201.8289&rep=rep1&type=pdf Date of download: 31 Jan-
uary 2016
50

Peijnenburg, K. [2010]: Life-Cycle Asset Allocation with Ambiguity-
Aversion and Learning. Working Paper. Available at: http://papers.
ssrn.com/sol3/papers.cfm?abstract_id=1785321 Date of download:
19 November 2015
Pham, H. [2009]: Continuous-time Stochastic Control and Optimization
with Financial Applications. Berlin: Springer-Varlag Berlin Heidelberg
Piazzesi, M. – Schneider, M. [2006]: Expectations and Asset
Prices with Heterogeneous Households. Society for Economic Dynamics,
2006 Meeting Papers, Number 828.
Piazzesi, M. – Schneider, M. [2007]: Equilibrium Yield-Curves. In:
Acemoglu, D. – Rogoff, K., eds. [2007]: NBER Macroeconomics An-
nual 2006, Vol. XXI, Cambridge, MA: MIT Press. Ch. 6, pp. 389-472.
Rudebusch, G.D. – Swanson, E.T. [2008]: Examining the bond
premium puzzle with a DSGE model. Journal of Monetary Economics,
Vol. LV, Supplement, pp. S111-S126.
Rudebusch, G.D. – Swanson, E.T. [2012]: The Bond Premium in a
DSGE Model with Long-Run Real and Nominal Risks. American Economic
Journal: Macroeconomics, Vol. IV, No. 1, pp. 105-143.
Samuelson, P.A. [1969]: Lifetime Portfolio Selection by Dynamic
Stochastic Programming. The Review of Economics and Statistics, Vol. LI,
No. 3, pp. 239-246.
51

Sangvinatsos, A. - Wachter, J.A. [2005]: Does the Failure of the
Expectations Hypothesis Matter for Long-Term Investors? The Journal of
Finance, Vol. LX, No. 1, pp. 179-230.
Sion, M. [1958]: On General Minimax Theorems. Pacific Journal of Math-
ematics, Vol. VIII, No. 1, pp. 171-176.
Sørensen, C. [1999]: Dynamic Asset Pricing and Fixed Income Manage-
ment. The Journal of Financial and Quantitative Analysis, Vol. XXXIV,
No. 4, pp. 513-531.
Trojani, F. - Vanini, P. [2002]: A note on robustness in Merton’s model
of intertemporal consumption and portfolio choice. Journal of Economic
Dynamics and Control, Vol. XXVI, No. 3, pp. 423-435.
Uppal, R. - Wang, T. [2003]: Model Misspecification and Underdiversi-
fication. The Journal of Finance, Vol. LVIII, No. 6, pp. 2465-2486.
Wachter, J.A. [2008]: A consumption-based model of the term struc-
ture of interest rates. Journal of Financial Economics, Vol. LXXIX, No. 2,
pp. 365-399.
52