robust health monitoring - lustre.ornl.gov
TRANSCRIPT

ORNL is managed by UT-Battelle for the US Department of Energy
Robust Health Monitoring
• Lustre • InfiniBand • Storage Arrays
Blake Caldwell HPC Operations NCCS/ORNL March 3rd, 2015
2 Robust Monitoring
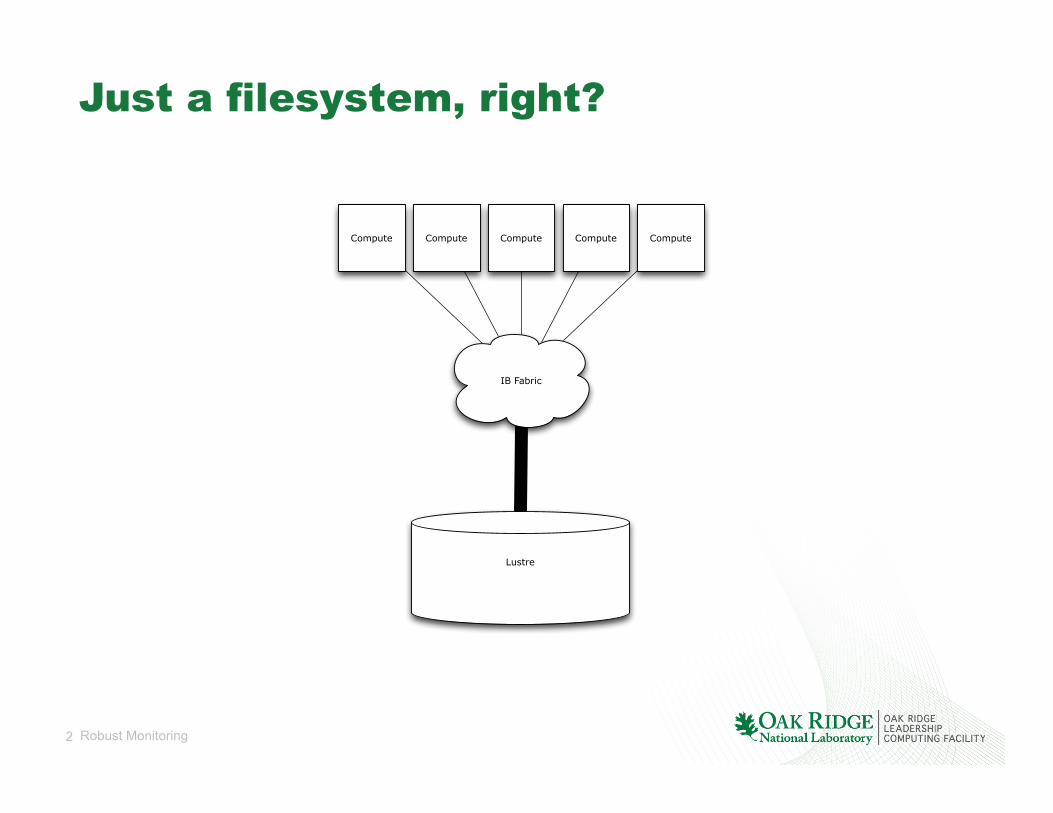
Just a filesystem, right?
Compute Compute Compute Compute Compute
Lustre
IB Fabric
3 Robust Monitoring
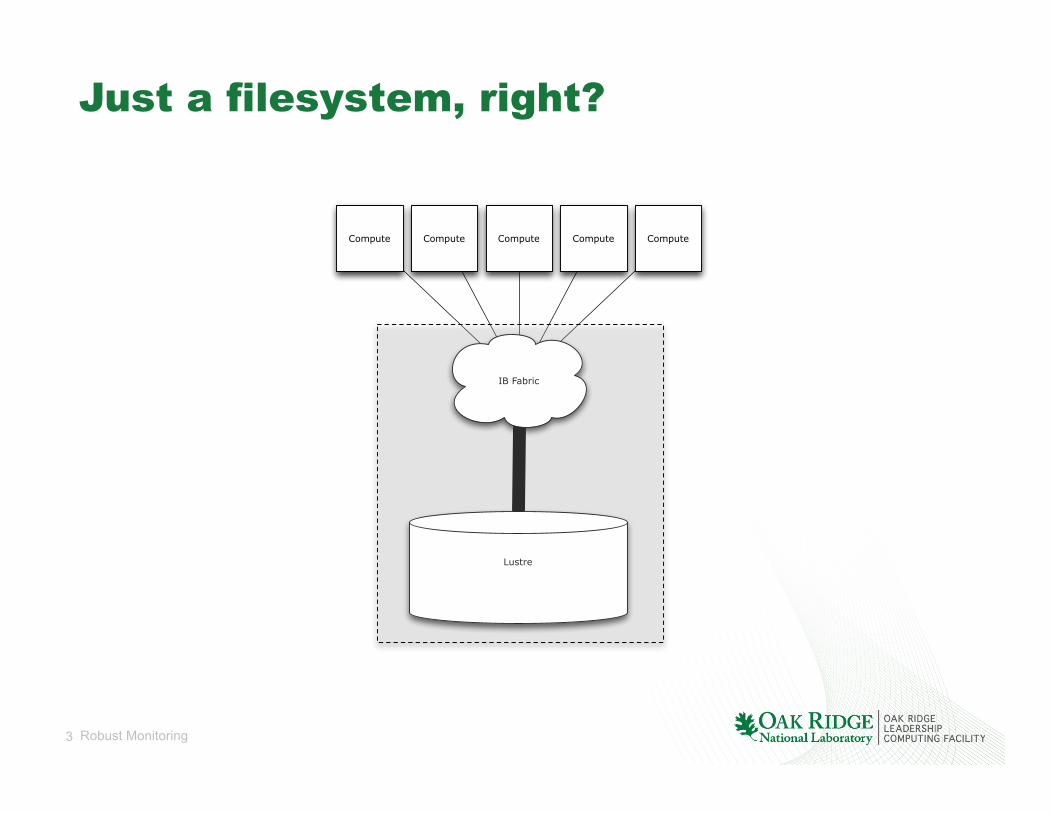
Just a filesystem, right?
Compute Compute Compute Compute Compute
Lustre
IB Fabric
4 Robust Monitoring
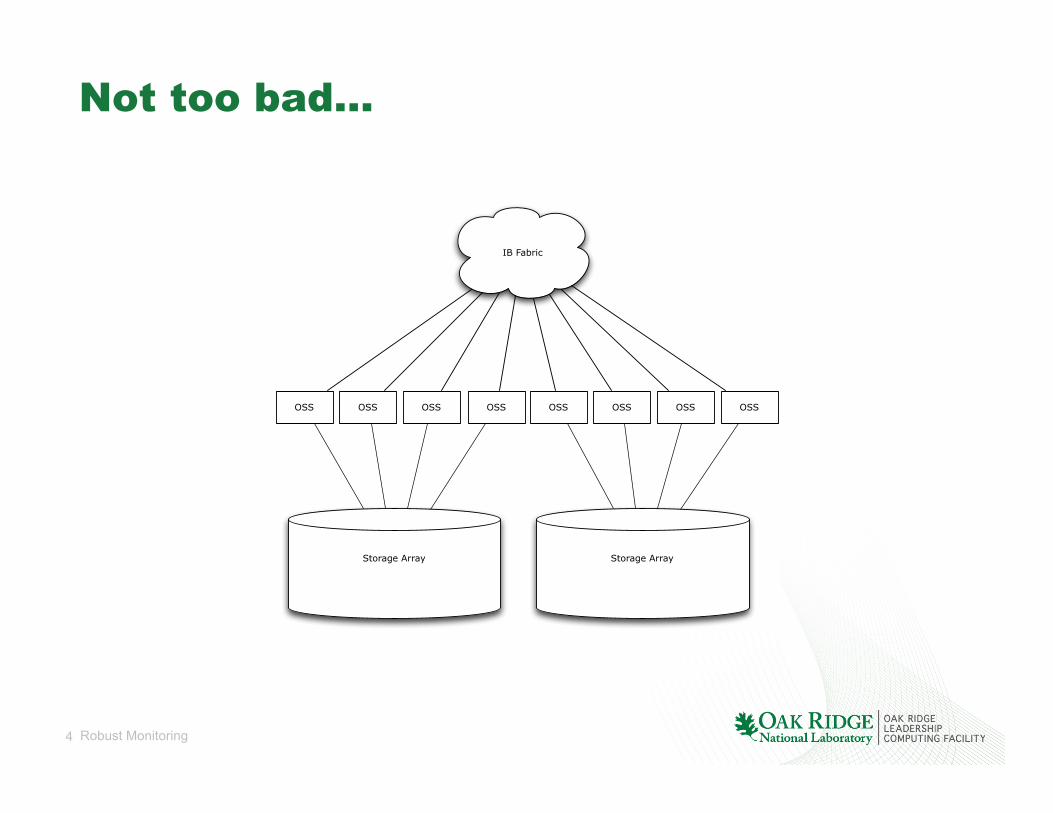
Not too bad…
Storage Array
OSS OSS OSS OSS OSSOSSOSSOSS
Storage Array
IB Fabric
5 Robust Monitoring
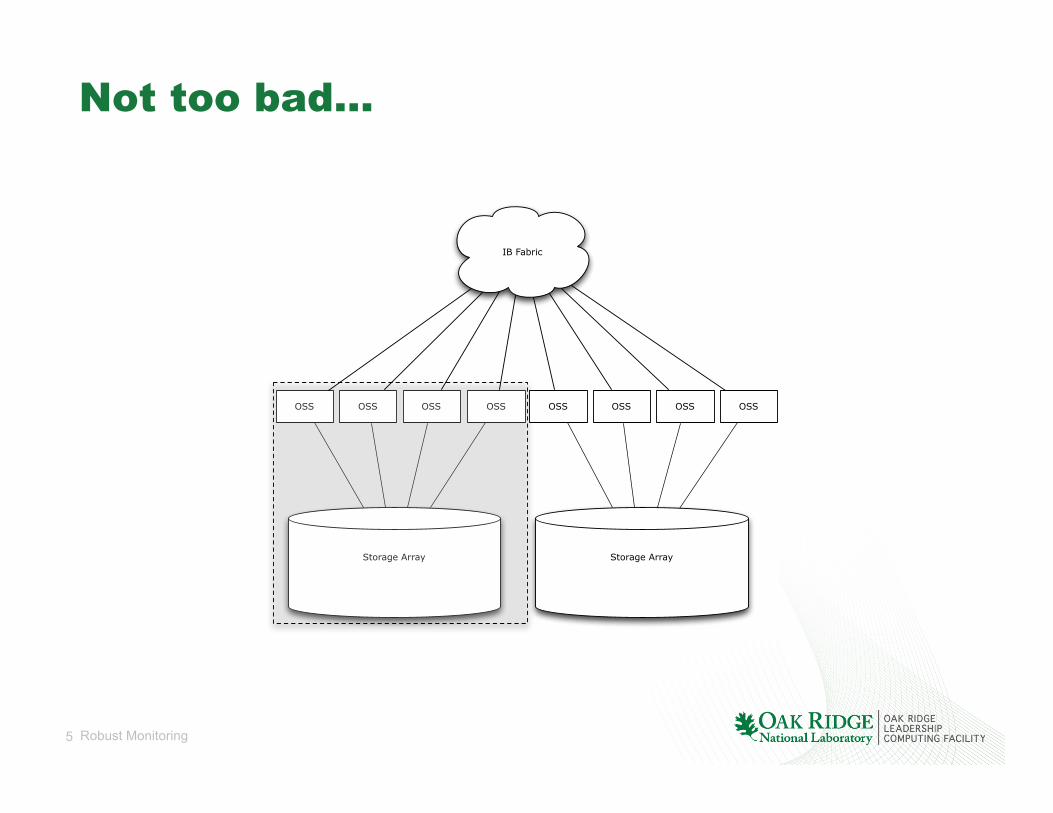
Not too bad…
Storage Array
OSS OSS OSS OSS OSSOSSOSSOSS
Storage Array
IB Fabric

6 Robust Monitoring
More than we thought…
Storage Controller
OSSOSSOSSOSS
Storage Controller
IB Links

7 Robust Monitoring
More than we thought…
Storage Controller
OSSOSSOSSOSS
Storage Controller
IB Links
8 Robust Monitoring
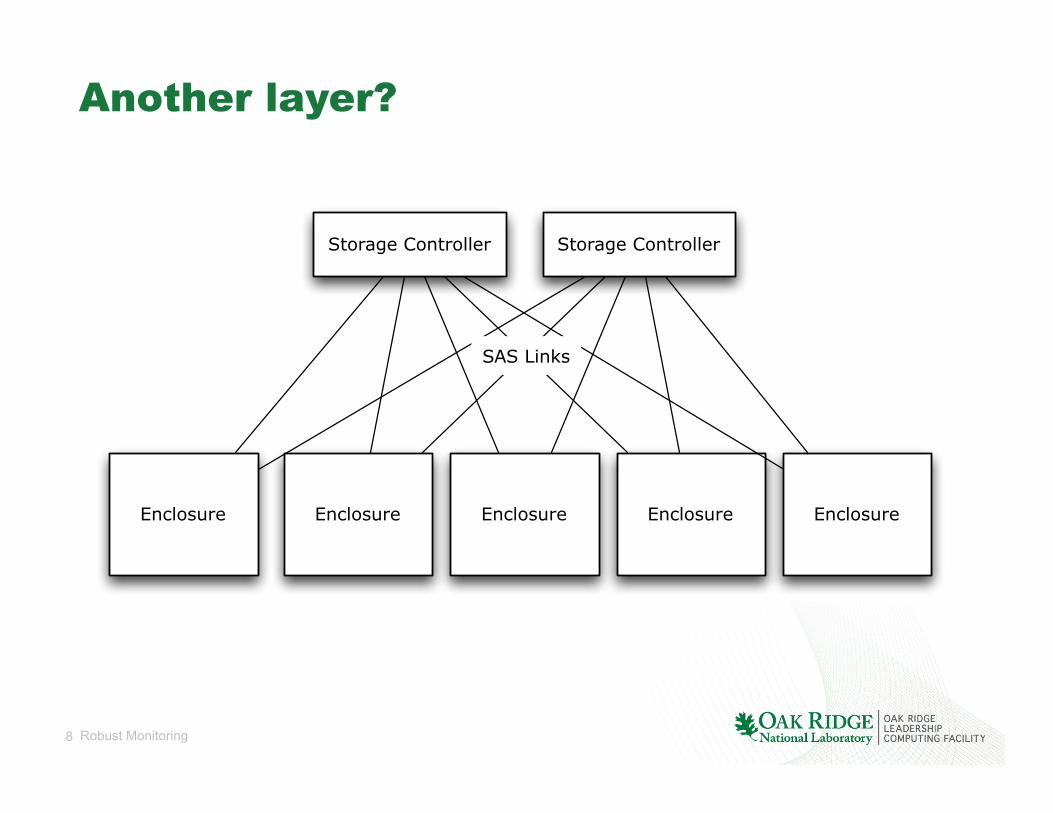
Another layer?
Storage Controller Storage Controller
Enclosure Enclosure Enclosure EnclosureEnclosure
SAS Links

9 Robust Monitoring
Another layer?
Storage Controller Storage Controller
Enclosure Enclosure Enclosure EnclosureEnclosure
SAS Links

10 Robust Monitoring
We need some help!
Disk Disk Disk Disk Disk Disk Disk Disk Disk Disk
Pool
VD
Disk Disk Disk Disk Disk Disk Disk Disk Disk Disk
Pool
VD
Disk Disk Disk Disk Disk Disk Disk Disk Disk Disk
Pool
VD
IOM IOM IOM IOM IOM IOM IOM IOM IOM IOM
Enclosure Enclosure Enclosure Enclosure Enclosure
PSU PSU PSU PSU PSU PSU PSU PSU PSU PSU

11 Robust Monitoring
This talk will cover…
• A monitoring infrastructure for Lustre • Tools used for monitoring layers
– DDN SFA check (block) – IB health check (network) – Custom scripts (Lustre)
• How common kernel LustreError log messages correlate with monitored events

12 Robust Monitoring
Monitoring Infrastructure
• Nagios: for alerting • Splunk: for information to be investigated
– Send out snippets of syslog to filesystem admins – Interesting DDN SFA logs
• SCSI sense errors (predict PD failure) • RAID parity mismatches
– Rebooted OSS/MDS – Read-only LUN – Memory errors
• LMT/others: for performance monitoring

13 Robust Monitoring
Nagios Infrastructure
• All Lustre hosts and DDN controllers are hosts • Service checks: sfa_check, ib_health, custom
scripts – 13,000 in OLCF – Check commands:
• check_snmp_sfa_health.sh • check_snmp_extend.pl
• Hosts run scripts via snmp extend extend monitor_ib_health /opt/bin/monitor_ib_health.sh!
14 Robust Monitoring
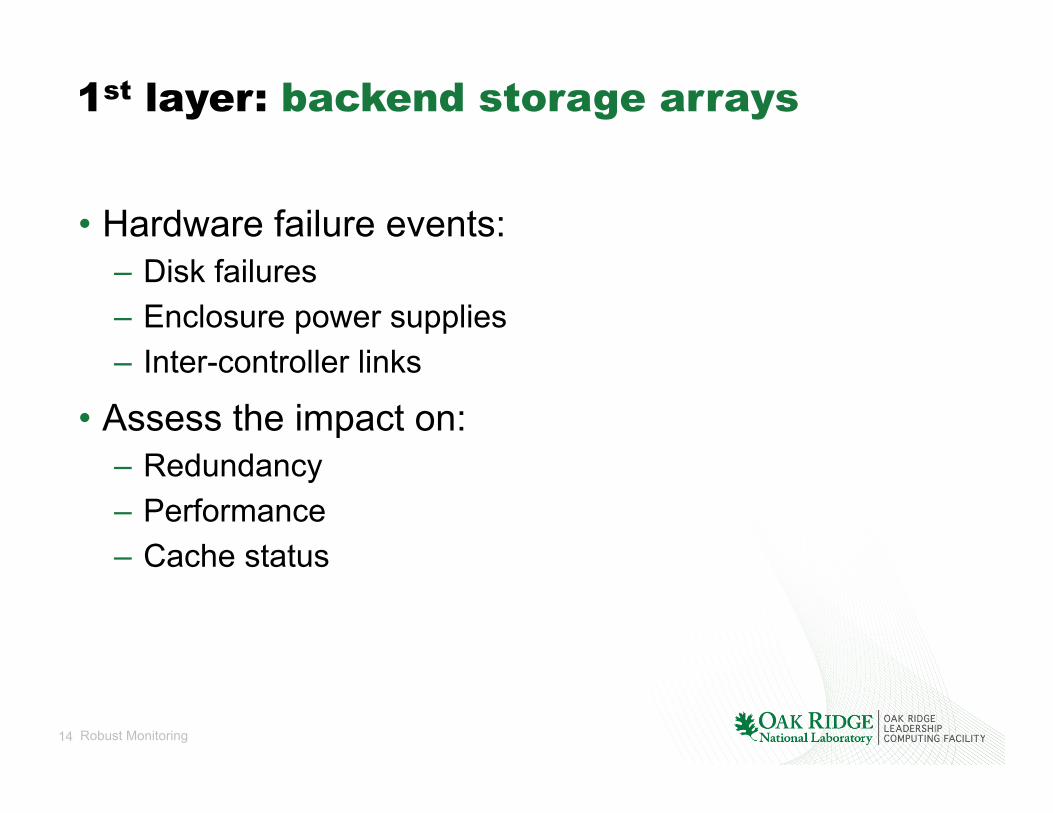
1st layer: backend storage arrays
• Hardware failure events: – Disk failures – Enclosure power supplies – Inter-controller links
• Assess the impact on: – Redundancy – Performance – Cache status

15 Robust Monitoring
SFA Check
• Periodic execution of API commands on all DDN arrays – Asynchronous from Nagios polling
• Python multiprocessing library – Manages a pool of workers (one per SFA couplet) – Times out stuck workers and propagates error to SNMP
• Modular design – All component checks perform doHealthCheck() for overall component status
(OK, NON_CRITICAL, CRITICAL) – Additional component-specific checks (e.g. ICLChannelCheck)
• InfinibandPortState == ACTIVE • InfinibandCurrentWidth == 4 • ErrorStatisticCounts[SymbolErrorCounter] < 20
• Checks configuration of pools (caching, parity/integrity checks)

16 Robust Monitoring
SFA Check (2)
• Physical disks (PD)
• Virtual disk (VD) objects (made up of PDs)
• Pools (made up of VDs)
• Inter-controller links (ICL)
• Power supplies
• Host channels (HCAs)
• Internal configuration disks
• SAS expanders
• SAS expander processor (SEP)
• UPS units (external)
• IO Controllers (IOC)
• Fans
• RAID processors
• Voltage sensors
• Temperature sensors
Classes that return health status (OK, NON_CRITICAL, CRITICAL):

17 Robust Monitoring
poolCheck() example
• Top-level generic check: doHealthCheck() • Specific checks:
– State: degraded, no redundancy, critical – Rebuild state – Ownership by controller – Bad block count (*)
(*) only in CLI extended mode (-x)

18 Robust Monitoring
SFA check design
Nagios
check_sfa
ornl_sfa_check_pp_daemon
ornl_sfa_check(DDN 1)
ornl_sfa_check(DDN 2)
ornl_sfa_check(DDN 3)
snmppass_persist
base_oid.ddn1.1base_oid.ddn1.2base_oid.ddn1.3
base_oid.ddn2.1base_oid.ddn2.2base_oid.ddn2.3
base_oid.ddn3.1base_oid.ddn3.2base_oid.ddn3.3
DDN 1
Python API
DDN 2
Python API
DDN 3
Python API
Every 5min
Every 5min
Once
snmpd
SFA Monitoring Host
Nagios Host

19 Robust Monitoring
SNMP OID structure
# snmpwalk -v2c –c public monitor_host .1.3.6.1.4.1.341.49.1!
SNMPv2-SMI::enterprises.341.49.1.12.97.116.108.97.115.45.100.100.110.49.97.49.1 = INTEGER: 0!
SNMPv2-SMI::enterprises.341.49.1.12.97.116.108.97.115.45.100.100.110.49.97.49.2 = STRING: "All Checks OK"!
SNMPv2-SMI::enterprises.341.49.1.12.97.116.108.97.115.45.100.100.110.49.97.49.3 = STRING: "1424574807"!
SNMPv2-SMI::enterprises.341.49.1.12.97.116.108.97.115.45.100.100.110.49.97.50.1 = INTEGER: 0!
SNMPv2-SMI::enterprises.341.49.1.12.97.116.108.97.115.45.100.100.110.49.97.50.2 = STRING: "All Checks OK"!
SNMPv2-SMI::enterprises.341.49.1.12.97.116.108.97.115.45.100.100.110.49.97.50.3 = STRING: "1424574807"!
SNMPv2-SMI::enterprises.341.49.1.12.97.116.108.97.115.45.100.100.110.49.98.49.1 = INTEGER: 0!
SNMPv2-SMI::enterprises.341.49.1.12.97.116.108.97.115.45.100.100.110.49.98.49.2 = STRING: "All Checks OK"!
SNMPv2-SMI::enterprises.341.49.1.12.97.116.108.97.115.45.100.100.110.49.98.49.3 = STRING: "1424574807"!
SNMPv2-SMI::enterprises.341.49.1.12.97.116.108.97.115.45.100.100.110.49.98.50.1 = INTEGER: 0!
SNMPv2-SMI::enterprises.341.49.1.12.97.116.108.97.115.45.100.100.110.49.98.50.2 = STRING: "All Checks OK"!
SNMPv2-SMI::enterprises.341.49.1.12.97.116.108.97.115.45.100.100.110.49.98.50.3 = STRING: "1424574807"!
SNMPv2-SMI::enterprises.341.49.1.12.97.116.108.97.115.45.100.100.110.49.99.49.1 = INTEGER: 0!
SNMPv2-SMI::enterprises.341.49.1.12.97.116.108.97.115.45.100.100.110.49.99.49.2 = STRING: "All Checks OK"!
SNMPv2-SMI::enterprises.341.49.1.12.97.116.108.97.115.45.100.100.110.49.99.49.3 = STRING: "1424574807”!

20 Robust Monitoring
Other block-level OSS checks
• Multipath – 2 paths to each LUN
• SRP daemon – 2 processes (for each IB port)
• Block tuning – Udev rules correctly set for each block AND dm device
• max_sectors_kb = max_hw_sectors_kb • scheduler = “noop” • nr_requests, read_ahead_kb

21 Robust Monitoring
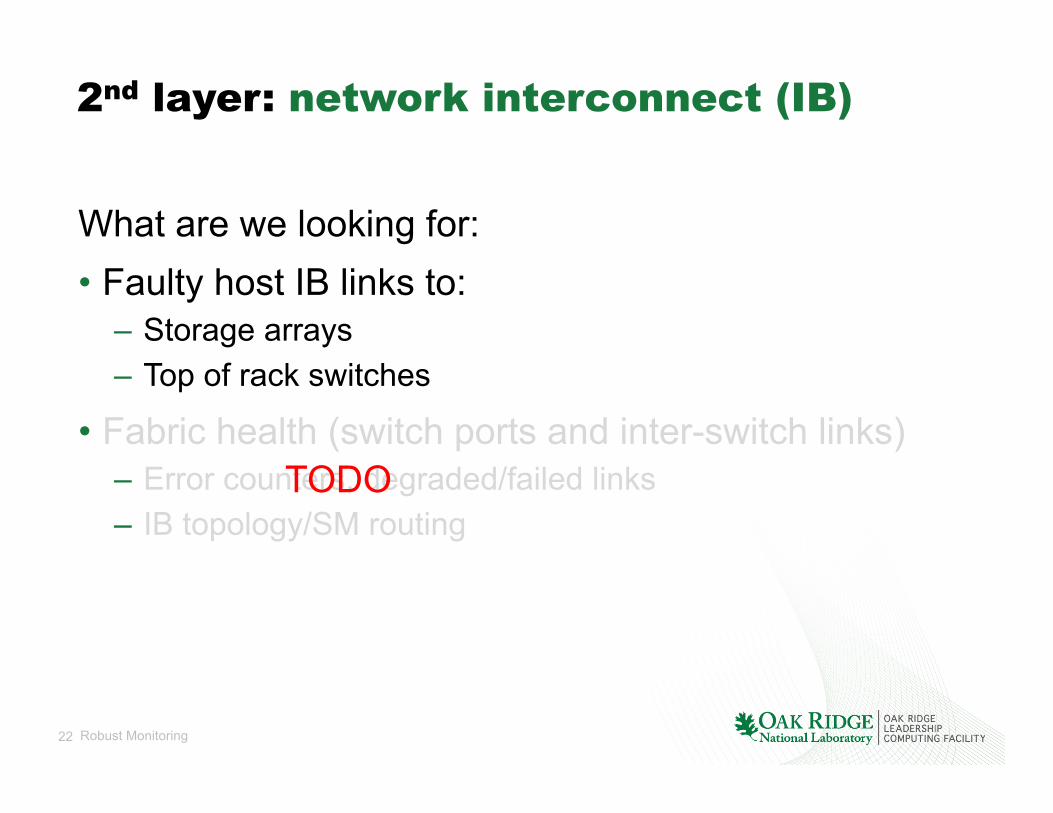
2nd layer: network interconnect (IB)
What we’re looking for: • Faulty host IB links to:
– Storage arrays – Top of rack switches
• Fabric health (switch ports and inter-switch links) – Error counters, degraded/failed links – IB topology/forwarding routing
22 Robust Monitoring
2nd layer: network interconnect (IB)
What are we looking for: • Faulty host IB links to:
– Storage arrays – Top of rack switches
• Fabric health (switch ports and inter-switch links) – Error counters, degraded/failed links – IB topology/SM routing
TODO

23 Robust Monitoring
IB Health Check
• HCA and local link health – Local errors check (HCA port) – Remote errors check (switch port)
• PCI width/speed of each HCA – Identify failed hardware or firmware issues – Appropriate slot placement
• Port in up/active state • Link speed/width matches capability • SM lid is set
24 Robust Monitoring
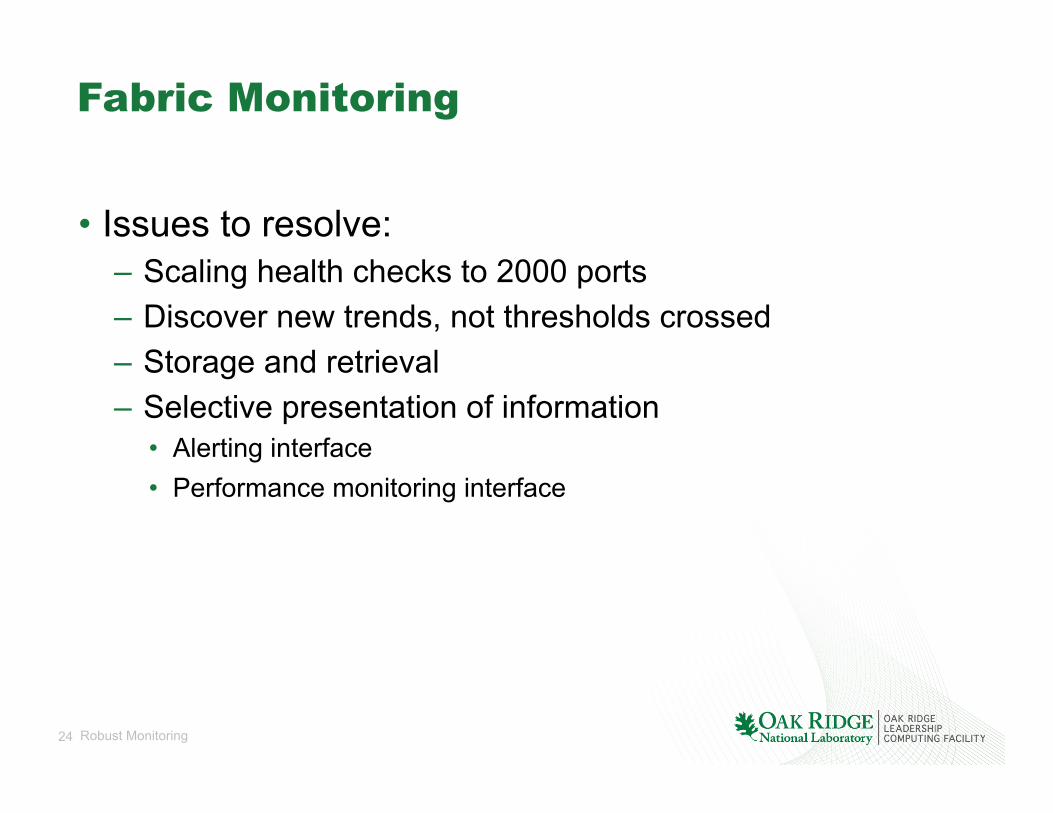
Fabric Monitoring
• Issues to resolve: – Scaling health checks to 2000 ports – Discover new trends, not thresholds crossed – Storage and retrieval – Selective presentation of information
• Alerting interface • Performance monitoring interface

25 Robust Monitoring
3rd layer: Lustre monitoring
• /proc/fs/lustre/health_check • /proc/mounts
• /proc/fs/lustre/devices – osd, osp, mgc, mds, mdt in UP state
• /proc/sys/lnet/stats – queued LNET messages
• /proc/sys/lnet/peers – connection state and queued messages to other servers
• lfs check servers
• llstat

26 Robust Monitoring
Lustre monitoring tools
• Capturing monitoring metrics in database for analysis – Robinhood (changelogs) – LMT (collectl)
• Scripts to collect using llstat, plot with gnuplot or matplotlib – See “Monitoring the Lustre file system to maintain optimal
performance,” by Gabriele Paciucci, LAD 2013

27 Robust Monitoring
How monitoring helps with these kernel messages
• Read-only OST • OST unreachable • Bulk I/O failure and LNET timeouts • Client eviction/reconnection cycle • Request took longer than estimated

28 Robust Monitoring
Conclusion
• OLCF monitoring best practices • Tools used at each layer
– DDN SFA check (block) – IB health check (network) – Custom scripts (Lustre)
• Applicability to common filesystem problems
