roberts bank container expansion coastal geomorphology ... · this report is included as appendix a...
TRANSCRIPT

ROBERTS BANK CONTAINER EXPANSION COASTAL GEOMORPHOLOGY STUDY
Appendix A
Prepared for: Vancouver Port Authority
Prepared by: northwest hydraulic consultants
30 Gostick Place North Vancouver, B. C.
V7M 3G2
In association with: Triton Consultants Ltd.
3530 West 43rd St. Vancouver, B. C.
V6N 3J9
November 2004 33863

Vancouver Port Authority Northwest Hydraulic Consultants Ltd/Triton Consultants Ltd. Roberts Bank Container Expansion File: 33863 Wind and Wave Climate – Appendix A - i - November 2004
EXECUTIVE SUMMARY
This appendix describes the wind and wave climate at Roberts Bank, BC. It is intended to
provide background information to support the draft report of the Coastal Geomorphology Study
concerning the Deltaport Third Berth Project. The information and analysis in this report
characterize the wind and wave climate of the southern Strait of Georgia in general, and the
Roberts Bank portion of the Fraser River delta in particular. This appendix incorporates a review
of existing information, as well as analysis of available data. Triton’s Coastal Engineering
Analysis Package (CEAPack) was used to fill data gaps in the available datasets and to generate
wave data for the Roberts Bank site.
The winds across the Vancouver region consist of westerly winds from the Strait of Georgia,
outflow and easterly winds from Howe Sound and the Fraser Valley, and southerly winds from
the Juan de Fuca Strait and Puget Sound. The easterly winds occur most frequently, but some of
the strongest and most dangerous winds are from the west. Easterly winds are generally backed
into the east and northeast near the North Shore Mountains, but are more frequently from the
southeast over the southern sections of the region. The frequency of westerly winds in Burrard
Inlet is much less than over more southern areas.
Although there are no continuous long-term wind measurements recorded at the Roberts Bank
port site, it is fortunate that there exists a database of measured overwater or near-coast wind
data in the Strait sufficient to preclude the need for detailed mesoscale atmospheric modelling.
Given this, a reliable estimate of site wind conditions was developed using measured MSC data
in the southern Strait of Georgia.
The wave model, which was developed using Triton’s WaveHind software, was calibrated and
verified against the measured offshore data for a range of driving wind conditions. Once
calibrated, the model was used to generate a time series of incident offshore Strait of Georgia
wave conditions coincident with the wind database
The propagation of offshore Strait of Georgia waves inshore to the site was computed using
Triton’s implementation of the numerical model SWAN (Simulating WAves Nearshore). This

Vancouver Port Authority Northwest Hydraulic Consultants Ltd/Triton Consultants Ltd. Roberts Bank Container Expansion File: 33863 Wind and Wave Climate – Appendix A - ii - November 2004
model is based on the wave-action balance equation in the presence of currents, or energy
balance in their absence (present application) with the inclusion of all significant wave energy
source and sink terms using first-, second- and third-generation wave physics.
Thus a detailed computation of the expected wave climate in the project area has been generated
using numerical models verified against a reliable dataset.

Vancouver Port Authority Northwest Hydraulic Consultants Ltd/Triton Consultants Ltd. Roberts Bank Container Expansion File: 33863 Wind and Wave Climate – Appendix A - iii - November 2004
TABLE OF CONTENTS
1.0 INTRODUCTION............................................................................................................. 1
1.1 SCOPE OF WORK ...................................................................................................... 1
1.2 METHODOLOGY ....................................................................................................... 1
2.0 LOCAL WIND PATTERNS............................................................................................ 2
2.1 GENERAL ................................................................................................................. 2
2.2 LOCAL WINDS ..................................................................................................... 3
2.2.1 Outflow Winds – Northeasterly pressure-slope...........................................3
2.2.2 East to Southeast Winds – Easterly and Southeasterly pressure-slope........5
2.2.3 Southerly to Southwesterly Winds – Southerly and Southwesterly
pressure-slope ..............................................................................................8
2.2.4 Westerly Winds – Southwesterly and westerly pressure-slope ...................8
3.0 WAVE CLIMATE.......................................................................................................... 13
3.1 WIND ..................................................................................................................... 13
3.2 WAVES .................................................................................................................. 16
3.2.1 Offshore Waves .........................................................................................16
3.2.1.1 Measured Offshore Waves ............................................................ 16
3.2.1.2 Numerically-Predicted Offshore Waves ....................................... 20
3.2.2 Nearshore Wave Transformation...............................................................25
4.0 CONCLUSION ............................................................................................................... 34
5.0 REFERENCES................................................................................................................ 35

Vancouver Port Authority Northwest Hydraulic Consultants Ltd/Triton Consultants Ltd. Roberts Bank Container Expansion File: 33863 Wind and Wave Climate – Appendix A - iv - November 2004
List of Tables
Table A2-1: General Trends in Wind Direction ............................................................................. 2
Table A3-1: MSC Wind Stations.................................................................................................. 13
Table A3-2: Wind Speed versus Wind Direction ......................................................................... 15
Table A3-3: Wind Speed versus Calendar Month ........................................................................ 15
Table A3-4: MEDS Wave Station Listing .................................................................................... 17
Table A3-5: MEDS Measured Wave Height versus Period - Roberts Bank .............................. 18
Table A3-6: MEDS Measured Wave Height versus Period – Halibut Bank................................ 19
Table A3-7: MEDS Measured Wave Height versus Direction – Halibut Bank ........................... 19
Table A3-8: MEDS Measured Wave Height versus Month – Halibut Bank................................ 20
Table A3-9: Overwater Fetches – Operational Model.................................................................. 23
Table A3-10: Offshore Wave Height versus Period for All Directions - Hindcast ...................... 24
Table A3-11: Offshore Wave Height versus Direction - Hindcast............................................... 24
Table A3-12: Offshore Wave Height versus Calendar Month - Hindcast.................................... 25
Table A3-13: Modelled Wind and Wave Conditions ................................................................... 28
List of Figures
Figure A2-1: Outflow Winds – Northeasterly pressure-slope ........................................................ 3
Figure A2-2: Outflow Winds – Northeasterly pressure-slope (2) .................................................. 4
Figure A2-3: East to Southeast Winds – Easterly and Southeasterly pressure-slope ..................... 6

Vancouver Port Authority Northwest Hydraulic Consultants Ltd/Triton Consultants Ltd. Roberts Bank Container Expansion File: 33863 Wind and Wave Climate – Appendix A - v - November 2004
Figure A2-4: East to Southeast Winds – Easterly and Southeasterly pressure-slope (2) ............... 7
Figure A2-5: East to Southeast Winds – Easterly and Southeasterly pressure-slope (3) ............... 7
Figure A2-6: Westerly Winds – Southwesterly and westerly pressure-slope................................. 9
Figure A2-7: Westerly Winds – Southwesterly and westerly pressure-slope (2) ......................... 10
Figure A2-8: Westerly Winds – Southwesterly and westerly pressure-slope (3) ......................... 11
Figure A3-1: Roberts Bank Wind Rose, All Months.................................................................... 14
Figure A3-2: MEDS Wave Station Plot........................................................................................ 16
Figure A3-3: Example of Wave Hindcast Calibration/Verification ............................................. 22
Figure A3-4: Offshore Wave Rose – Hindcast Data .................................................................... 23
Figure A3-5: SWAN Existing Conditions Bathymetry – Outer and Nested Grid........................ 26
Figure A3-6: Typical Wave Conditions – 10 knot SE wind, mean water level............................ 30
Figure A3-7: Typical Wave Conditions – 20 knot SE wind, mean water level............................ 30
Figure A3-8: Typical Wave Conditions – 30 knot SE wind, mean water level............................ 30
Figure A3-9: Typical Wave Conditions – 20 knot SE wind, low water level .............................. 31
Figure A3-10: Typical Wave Conditions – 20 knot SE wind, mean water level.......................... 31
Figure A3-11: Typical Wave Conditions – 20 knot SE wind, high water level ........................... 31
Figure A3-12: Typical Wave Conditions – 20 knot NW wind, mean water level........................ 32
Figure A3-13: Typical Wave Conditions – 20 knot west wind, mean water level ....................... 32
Figure A3-14: Typical Wave Conditions – 20 knot SW wind, mean water level ........................ 33

Vancouver Port Authority Northwest Hydraulic Consultants Ltd/Triton Consultants Ltd. Roberts Bank Container Expansion File: 33863 Wind and Wave Climate – Appendix A - vi - November 2004
Figure A3-15: Typical Wave Conditions – 20 knot south wind, mean water level...................... 33
Figure A3-16: Typical Wave Conditions – 20 knot SE wind, mean water level.......................... 33

Vancouver Port Authority Northwest Hydraulic Consultants Ltd/Triton Consultants Ltd. Roberts Bank Container Expansion File: 33863 Wind and Wave Climate – Appendix A - 1 - November 2004
1.0 INTRODUCTION
1.1 SCOPE OF WORK
This report is included as Appendix A of the DRAFT Coastal Geomorphology Study (Northwest
Hydraulic Consultants and Triton Consultants Ltd., 2004). The appendix is intended to provide
background information to support the draft report of the Coastal Geomorphology Study
concerning the Deltaport Third Berth Project. The information and analysis in this report
characterize the wind and wave climate of the southern Strait of Georgia in general, and the
Roberts Bank portion of the Fraser River delta in particular. The information that has been
compiled provides a good basis for understanding and predicting potential impacts from the
planned Third Berth Project.
1.2 METHODOLOGY
This appendix incorporates a review of existing information, as well as analysis of available data.
Existing information about the local winds was extracted from the CD ROM Coastal Weather
for British Columbia Mariners prepared by the Meteorological Service of Canada (MSC, 2000).
Although there are no continuous long-term wind measurements recorded at the Roberts Bank
port site, a reliable estimate of site wind conditions was developed using measured MSC data in
the southern Strait of Georgia. Triton’s Coastal Engineering Analysis Package (CEAPack) was
used to fill data gaps in the MSC datasets and generate wave data for the Roberts Bank site.

Vancouver Port Authority Northwest Hydraulic Consultants Ltd/Triton Consultants Ltd. Roberts Bank Container Expansion File: 33863 Wind and Wave Climate – Appendix A - 2 - November 2004
2.0 LOCAL WIND PATTERNS
The information in this section was extracted from the CD ROM Coastal Weather for British
Columbia Mariners prepared by the Meteorological Service of Canada (MSC, 2000).
2.1 GENERAL
The winds across the Vancouver region consist of westerly winds from the Strait of Georgia,
outflow and easterly winds from Howe Sound and the Fraser Valley, and southerly winds from
the Juan de Fuca Strait and Puget Sound. The easterly winds occur most frequently, but some of
the strongest and most dangerous winds are from the west. Easterly winds are generally backed
into the east and northeast near the North Shore Mountains, but are more frequently from the
southeast over the southern sections of the region. The frequency of westerly winds in Burrard
Inlet is much less than over more southern areas. Table A2-1 summarises the general trends in
wind direction.
Table A2-1: General Trends in Wind Direction
The region covered in this section is the southern section of the official Strait of Georgia, as it is
used in the marine forecast. It is separated from the rest of the Strait of Georgia for the wind
patterns are somewhat different from the rest of the strait.
Jan Apr Jul OctNortheast N, NE 1, 2 14 11 5 11Easterly E, SE 2, 3, 4, 5, 6 54 39 44 45Southerly S, SW 4, 5, 6 11 17 14 10Westerly W, NW 1, 6, 7, 8 15 28 30 27Calm 6 5 7 7*Based on: Sand Heads, Vancouver Airport and First Narrows
Basic Winds
Wind Directions
Regional Patterns
Seasonal Frequencies

Vancouver Port Authority Northwest Hydraulic Consultants Ltd/Triton Consultants Ltd. Roberts Bank Container Expansion File: 33863 Wind and Wave Climate – Appendix A - 3 - November 2004
2.2 LOCAL WINDS
2.2.1 Outflow Winds – Northeasterly pressure-slope
When a ridge of high pressure develops over the British Columbia Interior, outflow conditions
spread through Howe Sound, the Fraser Canyon and Harrison Lake. The pressure-slope direction
is northeasterly. The Vancouver region is affected by flow that moves across the Fraser Valley.
The plume of strong winds extends from the narrow confines of the upper part of the valley,
across Sumas Prairie, south of the river near Matsqui and then is steered by the mountains to the
south, to move out across Birch Bay and into the strait. The more northerly parts of greater
Vancouver will only have light easterly winds. When outflow winds rise to gale force 35 to 45
knots in Howe Sound and in the upper reaches of the valley, the easterly winds that move into
Vancouver Harbour are usually only 5 to 10 knots, or at most 15 knots. However, from southern
Vancouver to Bellingham the winds may be easterly, near 20 to 25 knots, and with a very strong
outflow, can reach gale force. The same pattern of winds can happen, though with much reduced
speeds, at any time of the year, as a result of night-time drainage from the mountains.
Figure A2-1: Outflow Winds – Northeasterly pressure-slope
The winds from Howe Sound usually end within one or two kilometres south of its entrance, off
Point Atkinson. Squamish outflow winds can, in a very specific pattern, extend out to Point

Vancouver Port Authority Northwest Hydraulic Consultants Ltd/Triton Consultants Ltd. Roberts Bank Container Expansion File: 33863 Wind and Wave Climate – Appendix A - 4 - November 2004
Grey, and can even move south of Tsawwassen Beach to the Gulf Islands. This occurs when the
ridge of high pressure rotates more toward the north. In this case, northwest winds move all the
way down the Strait of Georgia, to just west of Vancouver where they converge with the easterly
winds coming out of the Fraser Valley. The northerly winds in Howe Sound are drawn into this
convergence zone and move southward out of the sound. Wind speeds of 40 knots can be
reached. Only the westernmost anchorages of English Bay will receive any of this northerly
wind. Northerly swells, which bend into the bay, may be more important. The tides can help to
hold off, or carry in, the swell.
Figure A2-2: Outflow Winds – Northeasterly pressure-slope (2)
Indian Arm also experiences outflow winds, but they do not occur with every Squamish outflow,
and even when they do, they are usually not as strong as the peak wind in Howe Sound. In order
for strong northerly winds to pour into Indian Arm the cold air must be sufficiently deep, so that
when it reaches Squamish it will be able to flow southeastward through the Stawamus and Indian
River valleys. Since the ability of the air to flow down into Indian Arm is linked to the air
temperature, the winds may show more of a diurnal afternoon decrease when the air temperature
of Squamish increases. The winds in Howe Sound, which are not as restricted by temperature
variations, will not show such a marked afternoon decrease. Perhaps the winds passing Squamish
must also be more northerly, in order for them to flow down the river valleys. The path of winds

Vancouver Port Authority Northwest Hydraulic Consultants Ltd/Triton Consultants Ltd. Roberts Bank Container Expansion File: 33863 Wind and Wave Climate – Appendix A - 5 - November 2004
into Indian Arm is not as direct as it is in Howe Sound, therefore the winds are generally less. If
the winds at Pam Rock are near gale force 35 knots, the maximum winds in Indian Arm will be
about 25 knots. The strongest winds occur near the narrowest parts of the channel and near the
major bends in Indian Arm. Generally there are more places to shelter in along the west side of
Indian Arm, but this will change as the flow meanders past the turns of the inlet. The winds that
move into Deep Cover are lifted up by the hill behind the cover, so that the winds on the water
become lower the closer you go towards the shore. The winds become light close to the opening
of Burrard Inlet.
2.2.2 East to Southeast Winds – Easterly and Southeasterly pressure-slope
Easterly winds, ranging from just north of east to southeast, are the most common winds in the
Vancouver area. With the approach of a front, the pressure-slope direction will back into the east.
The winds across the region will vary considerably, depending on the direction from which the
front approaches.
When a front approaches from the west or northwest, and the pressure-slope direction is south of
east, then the southeast winds first appear in the northern part of the Strait of Georgia and
gradually spread south toward the Vancouver area as the front draws closer. The strongest
southeast winds cut a swath across the city, from the southwestern areas near White Rock and
Tsawwassen over to near Point Atkinson. However, the winds will usually be much lighter in the
Vancouver area than the peak winds in the Strait of Georgia. To the northeast of this swath,
particularly closer to the Coast Mountains, with wind tends to back more into the east, and even
northeast, and are much lighter.

Vancouver Port Authority Northwest Hydraulic Consultants Ltd/Triton Consultants Ltd. Roberts Bank Container Expansion File: 33863 Wind and Wave Climate – Appendix A - 6 - November 2004
Figure A2-3: East to Southeast Winds – Easterly and Southeasterly pressure-slope
When a front approaches from the southwest, the pressure-slope direction will back to north of
east. This rotation of the pressure-slope moves the plume of strong southeast winds farther away
from Vancouver, and closer to Vancouver Island. Places like East Point on Saturna Island, will
wobble from east to southeast. Most parts of the region northeast of Sand Heads will have east or
northeast winds, and generally less than 15 knots. In this situation the flow patter is more like an
outflow condition. The strongest winds do not begin in the northern part of the Strait of Georgia,
but will arise, more or less equally, in the southwest area close to Vancouver Island. Once
established, the plume of strong southeast winds extends from the mouth of Puget Sound
northward, hugging close to the Vancouver Island shore. The winds spread out across the Strait
of Georgia farther to the north. As the pressure-slope direction veers more toward the southeast
the strong plume of southeast winds will move northward across most of greater Vancouver. The
winds at Point Atkinson will be strengthened and backed into the east by channeling along the
North Shore Mountains. Their speed can be 5 knots stronger than at Sand Heads. When the
pressure-slope direction veers more toward the south, the winds at Point Atkinson will ease
considerable and will become much lighter than at Sand Heads. The winds in Indian Arm will
remain from the north, though not normally very strong, throughout these different frontal
scenarios.

Vancouver Port Authority Northwest Hydraulic Consultants Ltd/Triton Consultants Ltd. Roberts Bank Container Expansion File: 33863 Wind and Wave Climate – Appendix A - 7 - November 2004
Figure A2-4: East to Southeast Winds – Easterly and Southeasterly pressure-slope (2)
When a ridge of high pressure develops to the south or southeast of the region, the winds will be
from the east or southeast, even without a front approaching. This would be a ‘pushed’ southeast
wind. Such a wind can develop at any time of the year, but is quite common during the summer
when a ridge of high pressure lies west of Vancouver Island. The ridge only needs to rotate
slightly, so that the pressure-slope direction turns toward the south, for Juan de Fuca return flow
winds to move north across western Vancouver.
Figure A2-5: East to Southeast Winds – Easterly and Southeasterly pressure-slope (3)

Vancouver Port Authority Northwest Hydraulic Consultants Ltd/Triton Consultants Ltd. Roberts Bank Container Expansion File: 33863 Wind and Wave Climate – Appendix A - 8 - November 2004
2.2.3 Southerly to Southwesterly Winds – Southerly and Southwesterly pressure-slope
South or southwest winds are not common winds, but result during a transition from southeast to
westerly winds. The strongest southwest winds usually accompany the passage of a front over
the region. These winds will be strongest closer to Vancouver Island but tend to weaken and
back into the southeast near Vancouver. Along the North Shore mountains the winds remain
from the east or southeast until they turn fully into the west. Southwest winds can also occur in
different parts of the area with sea breeze winds during the summer. Indian Arm experiences
southerly winds during sunny summer afternoons when upslope winds develop through the inlet.
The strongest southerly winds will develop when a deep low passes directly over the south coast
and into the Interior to the north of the region.
2.2.4 Westerly Winds – Southwesterly and westerly pressure-slope
On a typical summer day, northwest winds will spread down the Strait of Georgia during the
night to reach Entrance Island near dawn. These winds generally ease a short distance southeast
of Entrance Island without making it all the way to Vancouver. This occurs due to the opening
out of the strait in that area, causing the channelling effect to be reduced. But perhaps more
importantly, the northwest winds stop when they encounter the east to southeast winds which are
over the Vancouver area. The southeast winds are the result of the westerly winds in Juan de
Fuca Strait turning northward overnight and backing into the southeast due to topographical
channelling. The convergence line between the northwest winds from the Strait of Georgia and
the westerlies from Jan de Fuca Strait frequently lies in this area between Vancouver and
Entrance Island. When the line of convergence is close to Vancouver, a mariner might find light
southeast winds near the coast but just a little farther offshore the winds will be from the
northwest.
The northwest winds will spread all the way to Vancouver when the pressure slope rotates to
west of about 240o. The black line, marking the edge of the northwesterlies, will be seen
gradually approaching Burrard Inlet.
Vancouver Port Authority Northwest Hydraulic Consultants Ltd/Triton Consultants Ltd. Roberts Bank Container Expansion File: 33863 Wind and Wave Climate – Appendix A - 9 - November 2004
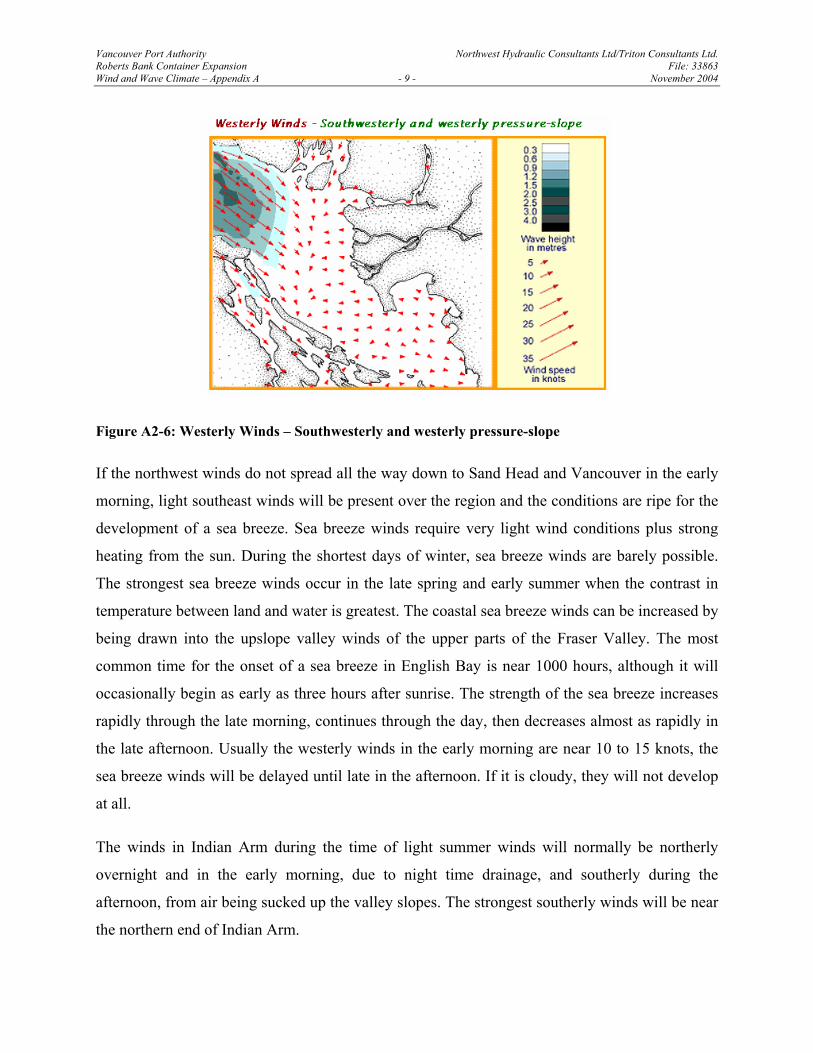
Figure A2-6: Westerly Winds – Southwesterly and westerly pressure-slope
If the northwest winds do not spread all the way down to Sand Head and Vancouver in the early
morning, light southeast winds will be present over the region and the conditions are ripe for the
development of a sea breeze. Sea breeze winds require very light wind conditions plus strong
heating from the sun. During the shortest days of winter, sea breeze winds are barely possible.
The strongest sea breeze winds occur in the late spring and early summer when the contrast in
temperature between land and water is greatest. The coastal sea breeze winds can be increased by
being drawn into the upslope valley winds of the upper parts of the Fraser Valley. The most
common time for the onset of a sea breeze in English Bay is near 1000 hours, although it will
occasionally begin as early as three hours after sunrise. The strength of the sea breeze increases
rapidly through the late morning, continues through the day, then decreases almost as rapidly in
the late afternoon. Usually the westerly winds in the early morning are near 10 to 15 knots, the
sea breeze winds will be delayed until late in the afternoon. If it is cloudy, they will not develop
at all.
The winds in Indian Arm during the time of light summer winds will normally be northerly
overnight and in the early morning, due to night time drainage, and southerly during the
afternoon, from air being sucked up the valley slopes. The strongest southerly winds will be near
the northern end of Indian Arm.
Vancouver Port Authority Northwest Hydraulic Consultants Ltd/Triton Consultants Ltd. Roberts Bank Container Expansion File: 33863 Wind and Wave Climate – Appendix A - 10 - November 2004
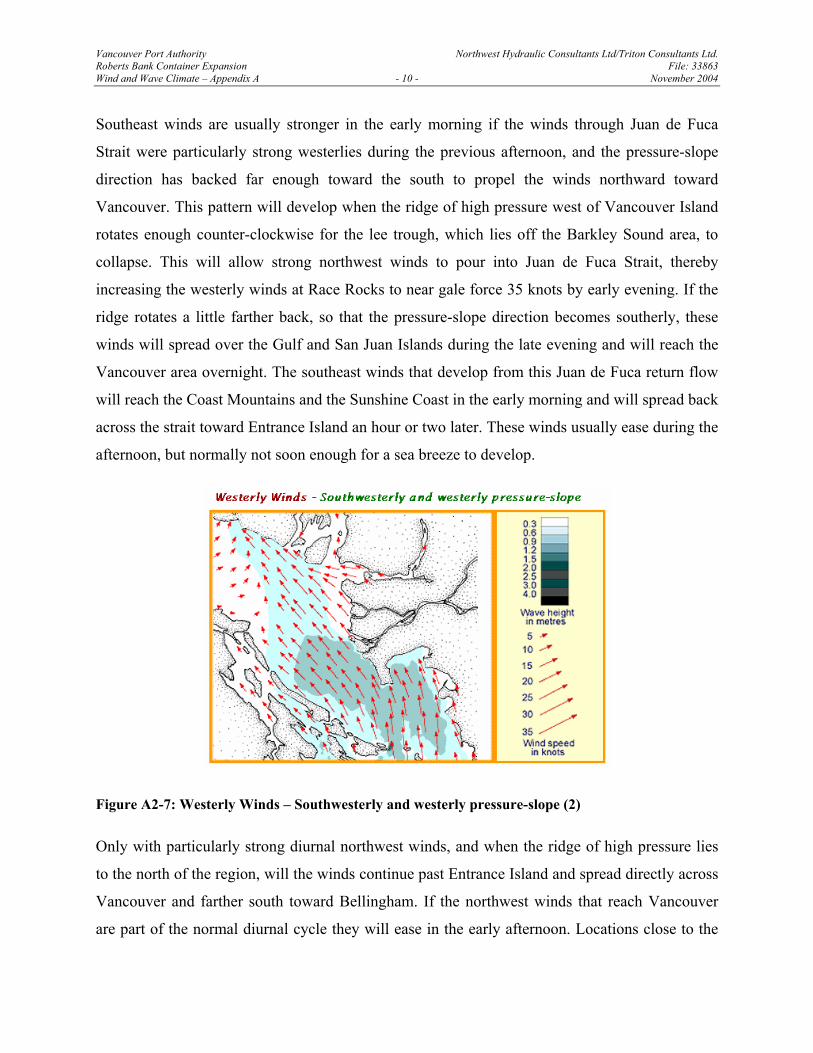
Southeast winds are usually stronger in the early morning if the winds through Juan de Fuca
Strait were particularly strong westerlies during the previous afternoon, and the pressure-slope
direction has backed far enough toward the south to propel the winds northward toward
Vancouver. This pattern will develop when the ridge of high pressure west of Vancouver Island
rotates enough counter-clockwise for the lee trough, which lies off the Barkley Sound area, to
collapse. This will allow strong northwest winds to pour into Juan de Fuca Strait, thereby
increasing the westerly winds at Race Rocks to near gale force 35 knots by early evening. If the
ridge rotates a little farther back, so that the pressure-slope direction becomes southerly, these
winds will spread over the Gulf and San Juan Islands during the late evening and will reach the
Vancouver area overnight. The southeast winds that develop from this Juan de Fuca return flow
will reach the Coast Mountains and the Sunshine Coast in the early morning and will spread back
across the strait toward Entrance Island an hour or two later. These winds usually ease during the
afternoon, but normally not soon enough for a sea breeze to develop.
Figure A2-7: Westerly Winds – Southwesterly and westerly pressure-slope (2)
Only with particularly strong diurnal northwest winds, and when the ridge of high pressure lies
to the north of the region, will the winds continue past Entrance Island and spread directly across
Vancouver and farther south toward Bellingham. If the northwest winds that reach Vancouver
are part of the normal diurnal cycle they will ease in the early afternoon. Locations close to the

Vancouver Port Authority Northwest Hydraulic Consultants Ltd/Triton Consultants Ltd. Roberts Bank Container Expansion File: 33863 Wind and Wave Climate – Appendix A - 11 - November 2004
coast may develop westerly sea breeze winds during the late afternoon. If the northwest winds
have developed due to a northerly pressure-slope, the winds will not die down during the
afternoon, but will in fact increase a little with the addition of a sea breeze wind. The strength of
the afternoon winds will be 20 to 25 knot and will ease slightly to 15 to 20 knots overnight.
These winds will continue into the next day, and can persist for several days if the pressure-slope
direction remains from the north. In this situation the winds will be particularly strong at Sand
heads, where the seas can build sharply, especially when against a strong river outflow. In this
situation a small boat may have difficulty moving out of the river and getting past the green light
at the mouth of the jetty. The westerly winds that move into English Bay and Burrard Inlet are
strongest on the southern side of the bay. This can make the wave conditions rather
uncomfortable, if not dangerous, with an ebb tide near First Narrow. During these windy days in
the Vancouver area the winds tend to be light farther up the strait, north of Ballenas Island.
Figure A2-8: Westerly Winds – Southwesterly and westerly pressure-slope (3)
Northwest winds which develop after the passage of a front can produce the strongest of all the
winds in the Vancouver region. They do not usually last as long as the east or southeast winds,
but often have a much greater impact. March is often a time of strong northwest winds. The
strongest northwest winds occur behind a front that has approached from the northwest, or
behind a deep low which has passed eastward over southern Vancouver Island. The latter of
Vancouver Port Authority Northwest Hydraulic Consultants Ltd/Triton Consultants Ltd. Roberts Bank Container Expansion File: 33863 Wind and Wave Climate – Appendix A - 12 - November 2004
these two scenarios is usually the worst. In both cases the winds can shift from east or southeast
ahead of the front or low, and rise to strong northwest winds very quickly. IN extreme events,
shifts can occur in minutes, from southeast 30 to 35 knots to northwest 45 to 50 knots.
Fortunately, this does not occur often, but shifts like this, although with much less wind speed,
usually happen every winter. Even if northwest winds only rise to 25 or 30 knots behind a front,
they can still be quite powerful, for the air is cold and therefore carries more of a punch than
warmer air. Northwest winds that develop behind a front spread quit uniformly across the entire
region.

Vancouver Port Authority Northwest Hydraulic Consultants Ltd/Triton Consultants Ltd. Roberts Bank Container Expansion File: 33863 Wind and Wave Climate – Appendix A - 13 - November 2004
3.0 WAVE CLIMATE
3.1 WIND
Although there are no continuous long-term wind measurements recorded at the Roberts Bank
port site, it is fortunate that there exists a database of measured overwater or near-coast wind
data in the Strait sufficient to preclude the need for detailed mesoscale atmospheric modelling.
Given this, a reliable estimate of site wind conditions was developed using measured MSC data
in the southern Strait of Georgia.
Table A3-1 summarizes MSC hourly data sets that are most relevant to the project and that were
obtained for this study.
Table A3-1: MSC Wind Stations
The three stations shown in bold text were analyzed in detail using Triton’s Coastal Engineering
Analysis Package (CEAPack). The CEAPack software suite contains analysis routines that were
used to fill data gaps in the MSC datasets and generate a single-element triangular irregular
network (TIN) linking the three sites. The TIN was used to linearly interpolate the wind speed
and direction vectors spatially and temporally near the southwest corner of the existing Robert
Bank Superport; differences between conditions there, the proposed Deltaport Expansion (DPE)
berth, and offshore cannot be resolved so have been neglected throughout this study. The final
Lat Long(N) (W)
1108290 Tsawwassen Ferry
Feb 1976 to Jul 1997 49o00’ 123 o 08’ 3
1107010 Sand Heads May 1967 to present 49 o 06’ 123 o 18’ 01106200 Point Atkinson Jan 1969 to present 49 o 20’ 123 o 16’ 9102BFHH Entrance Island Dec 1969 to May 1997 49 o 12’ 123 o 49’ 8
1027403 Sisters Island Jan 1995 to present 49 o 29’ 124 o 26’ 51108447 Vancouver
Airport Jan 1953 to present 49 o 18’ 123 o 07’ 0
1017101 Saturna Island Mar 1968 to present 48 o 47’ 123 o 03’ 38
ID Station Name Period of Record Elev. (m)

Vancouver Port Authority Northwest Hydraulic Consultants Ltd/Triton Consultants Ltd. Roberts Bank Container Expansion File: 33863 Wind and Wave Climate – Appendix A - 14 - November 2004
product of this analysis was a time series of hourly wind speed and direction data at 10 m
elevation spanning the interval January, 1963 to present.
Figure A3-1 and Table A3-2 summarize the wind climate at the site derived from this dataset in
wind rose and bivariate histogram format respectively.
Figure A3-1: Roberts Bank Wind Rose, All Months
The numbers tabulated in Table A3-2 indicate the number of hours in the period of record that
sustained wind speeds were within the speed and direction ranges shown. For example, the data
indicate that wind speeds were between 1 and 5 knots from the north during 10066 of the 347985
hours for which there are valid data (i.e., 2.9% of the time).

Vancouver Port Authority Northwest Hydraulic Consultants Ltd/Triton Consultants Ltd. Roberts Bank Container Expansion File: 33863 Wind and Wave Climate – Appendix A - 15 - November 2004
Table A3-2: Wind Speed versus Wind Direction
Note that hourly wind speeds in excess of 30 knots are rare, occurring 1372 hours in the period
of record (1027+277+60+7+1) or 0.4% of the time on average. Table A3-3 shows the variation
of wind speed by month.
Table A3-3: Wind Speed versus Calendar Month
Note that the highest frequency of winds greater than 30 knots occurs during December followed
by March.
N NE E SE S SW W NW0 - 1 72531 - 5 102830 10066 9218 13550 16604 15314 9587 11790 167015 - 10 124668 5147 5960 21735 30468 16580 8829 9798 2615110 - 15 68620 905 2637 13664 18039 9442 4884 5028 1412115 - 20 29760 132 1077 5077 8280 5797 2019 1943 543520 - 25 10152 28 290 1269 3758 2127 355 653 167225 - 30 3330 8 41 248 1653 707 52 171 45030 - 35 1027 0 0 25 660 171 11 32 12835 - 40 277 0 0 2 202 44 3 2 2440 - 45 60 0 0 3 41 10 0 0 645 - 50 7 0 0 0 4 1 0 0 250 - 55 1 0 0 0 0 0 0 0 1Total 347985 16286 19223 55573 79709 50193 25740 29417 64591
Direction (from)Speed (knots) Total
Jan Feb Mar Apr May Jun Jul Aug Sep Oct Nov Dec
0 - 1 72531 - 5 102830 6796 7118 7717 8287 9852 9048 10385 11191 10697 9278 6385 60765 - 10 124668 9578 8925 9635 10616 11996 12582 12069 11654 10599 9501 8662 8851
10 - 15 68620 6867 6040 6428 6236 5341 5571 5247 4687 4321 5048 6215 661915 - 20 29760 3835 3134 3286 2572 1604 1369 1416 1084 1282 2373 3652 415320 - 25 10152 1445 1251 1213 710 435 283 197 147 236 790 1603 184225 - 30 3330 514 446 477 170 122 47 14 12 53 257 516 70230 - 35 1027 134 141 181 46 24 0 0 0 11 75 148 26735 - 40 277 40 38 44 2 3 0 0 0 0 13 52 8540 - 45 60 7 12 10 0 0 0 0 0 0 5 14 1245 - 50 7 1 2 1 0 0 0 0 0 0 1 2 050 - 55 1 0 0 1 0 0 0 0 0 0 0 0 0Total 347985 29217 27107 28993 28639 29377 28900 29328 28775 27199 27341 27249 28607
Calendar MonthSustained Speed (knots)
Total(observations)

Vancouver Port Authority Northwest Hydraulic Consultants Ltd/Triton Consultants Ltd. Roberts Bank Container Expansion File: 33863 Wind and Wave Climate – Appendix A - 16 - November 2004
3.2 WAVES
3.2.1 Offshore Waves
3.2.1.1 Measured Offshore Waves
The entire Marine Environmental Data Service (MEDS) database of measured wave data in
Southern BC was obtained for this study. Figure A3-2 shows wave data buoy locations and Table
A3-4 shows the period of record coverage of these deployments.
Figure A3-2: MEDS Wave Station Plot

Vancouver Port Authority Northwest Hydraulic Consultants Ltd/Triton Consultants Ltd. Roberts Bank Container Expansion File: 33863 Wind and Wave Climate – Appendix A - 17 - November 2004
Table A3-4: MEDS Wave Station Listing
The stations shown in bold are of primary interest to this study and were reviewed in detail.
Table A3-5 is a summary of measured wave conditions at Roberts Bank (MEDS 108) expressed
in terms of significant wave height (Hs)1 and peak spectral period (Tp)2. Note that the
observations showing wave periods in excess of 10 seconds are thought to be erroneous since
these low frequency waves cannot be generated within a relatively small body of water such as
1 Average trough-to-crest height of the highest 1/3rd of all waves. 2 The wave period corresponding to the peak of the wave energy spectrum.
LAT LONG°N °W
C46206 11/22/1988 8/24/2003 48.83 126 73 4530 La Perouse BankMEDS303 9/17/1998 5/7/1999 49.03 125.8 40 199 Tofino DWRMEDS103 6/26/1970 6/17/1998 48.99 125.74 40 8958 TofinoMEDS336 10/1/1997 12/19/1997 50 125.19 999 77 Cape Mudge
C46131 10/20/1992 8/24/2003 49.91 124.99 18 3359 Sentry ShoalMEDS117 10/12/1977 3/25/1978 49.98 124.77 37 150 LundMEDS111 12/10/1976 3/14/1977 49.84 124.53 6 95 Powell River (Inner)MEDS112 12/10/1976 3/14/1977 49.84 124.53 9 90 Powell River (Outer)MEDS114 11/24/1976 2/24/1977 49.35 124.35 4 83 French Creek (Inner)MEDS115 11/24/1976 3/15/1977 49.35 124.35 7 92 French Creek (Outer)MEDS273 7/19/1989 7/19/1989 49.26 124.05 52 0 NanaimoMEDS097 1/11/1974 5/16/1974 49.34 123.74 53 115 Halibut Bank
C46146 3/13/1992 8/24/2003 49.34 123.73 40 3515 Halibut BankMEDS123 4/5/1979 3/27/1980 49.35 123.7 50 350 Fishermans CoveMEDS285 11/27/1990 4/30/1991 48.33 123.55 14 98 Pedder BayMEDS121 3/30/1978 4/3/1979 49.4 123.5 37 358 Gibsons LandingMEDS259 4/10/1987 6/18/1987 49.66 123.48 54 50 Patricia BayMEDS317 10/29/1992 1/5/1994 48.43 123.45 11 421 Esquimalt Harbour
C46134 2/19/2001 7/9/2003 48.66 123.45 68 661 Pat Bay Test BuoyMEDS004 3/10/1976 3/24/1977 48.42 123.39 5 356 Victoria HarbourMEDS095 12/3/1975 7/28/1976 48.43 123.39 4 140 Victoria (K)MEDS108 6/25/1981 6/29/1981 49.07 123.38 250 5 Roberts BankMEDS102 2/7/1974 4/3/1976 49.17 123.31 110 643 Sturgeon Bank
C46182 9/8/1989 11/21/1991 49.48 123.29 88 462 Pam RocksMEDS108 2/7/1974 4/3/1976 49.02 123.27 139 531 Roberts BankMEDS122 7/5/1978 7/30/1979 49.28 123.27 11 357 Point GreyMEDS124 4/6/1979 3/29/1980 49.35 123.27 6 314 Fishermans CoveMEDS106 12/19/1972 5/18/1974 49.35 123.23 40 487 West VancouverMEDS107 10/22/1973 3/24/1974 49.33 122.93 7 147 Deep CoveMEDS116 10/14/1977 3/3/1978 49.01 122.83 13 103 White Rock
GOOD DAYS
STATION NAMEID START DATE
END DATE
Depth (m)

Vancouver Port Authority Northwest Hydraulic Consultants Ltd/Triton Consultants Ltd. Roberts Bank Container Expansion File: 33863 Wind and Wave Climate – Appendix A - 18 - November 2004
the Strait of Georgia, nor can they effectively propagate into the Strait from the deep ocean. Note
also that the instrument used to acquire these observations was a Datawell Waverider buoy
which does not measure wave direction.
Table A3-5: MEDS Measured Wave Height versus Period - Roberts Bank
Table A3-5 demonstrates that large waves are rare within this sample; offshore significant wave
heights are greater than 1.5 m only about 0.5% of the time.
A similar analysis was made using the more reliable, although distant from the site, dataset from
Halibut Bank. Table A3-6 through Table A3-7 show the relationship between significant wave
height and peak period, dominant direction, and calendar month respectively. The Halibut Bank
data indicate that the most frequent and largest measured waves at that location are from the
southeast, with significant wave heights exceeding 1.5 m just over 0.5% of the time. The most-
probable peak wave period associated with the larger waves is 6 to 8 seconds.
2 - 4 4 - 6 6 - 8 8 - 10 10 - 20
0.0 - 0.10 3770.10 - 0.25 1730 1374 282 62 2 100.25 - 0.50 1142 959 142 29 2 100.50 - 0.75 480 281 186 10 0 30.75 - 1.00 233 44 178 4 1 61.00 - 1.25 96 3 91 0 1 11.25 - 1.50 48 1 44 1 1 11.50 - 1.75 12 0 10 2 0 01.75 - 2.00 4 0 2 1 0 12.00 - 2.25 1 0 1 0 0 02.25 - 2.50 0 0 0 0 0 02.50 - 2.75 2 0 0 2 0 02.75 - 3.00 1 0 0 1 0 03.00 - 3.25 1 0 0 1 0 0
Total 4127 2662 936 113 7 32
Significant Height (m) Total
Peak Spectral Period (s)
(observations)

Vancouver Port Authority Northwest Hydraulic Consultants Ltd/Triton Consultants Ltd. Roberts Bank Container Expansion File: 33863 Wind and Wave Climate – Appendix A - 19 - November 2004
Table A3-6: MEDS Measured Wave Height versus Period – Halibut Bank
Table A3-7: MEDS Measured Wave Height versus Direction – Halibut Bank
2 - 4 4 - 6 6 - 8 8 - 10
0.0 - 0.10 397350.10 - 0.25 10172 3141 3455 3403 1730.25 - 0.50 4158 3714 238 161 450.50 - 0.75 4082 3473 602 7 00.75 - 1.00 1565 645 916 3 11.00 - 1.25 1073 93 976 4 01.25 - 1.50 296 0 294 2 01.50 - 1.75 194 0 177 17 01.75 - 2.00 66 0 50 16 02.00 - 2.25 42 0 31 11 02.25 - 2.50 12 0 8 4 02.50 - 2.75 12 0 3 9 02.75 - 3.00 1 0 0 1 03.00 - 3.25 0 0 0 0 03.25 - 3.50 0 0 0 0 0
Total 61408 11066 6750 3638 219
Significant Height (m) Total
Peak Spectral Period (s)
(observations)
N NE E SE S SW W NW
0.0 - 0.10 397350.10 - 0.25 10172 962 604 1640 2247 789 558 1645 17270.25 - 0.50 4158 191 77 686 977 190 122 1079 8360.50 - 0.75 4082 66 47 1118 824 140 62 1161 6640.75 - 1.00 1565 4 7 486 370 41 6 379 2721.00 - 1.25 1073 1 2 461 271 36 7 152 1431.25 - 1.50 296 0 0 134 106 5 1 14 361.50 - 1.75 194 0 0 87 75 3 0 6 231.75 - 2.00 66 0 0 32 30 1 1 0 22.00 - 2.25 42 0 0 18 18 0 0 0 62.25 - 2.50 12 0 0 7 5 0 0 0 02.50 - 2.75 12 0 0 8 4 0 0 0 02.75 - 3.00 1 0 0 0 1 0 0 0 03.00 - 3.25 0 0 0 0 0 0 0 0 03.25 - 3.50 0 0 0 0 0 0 0 0 0
Total 61408 1224 737 4677 4928 1205 757 4436 3709
Direction (from)Significant Height (m) Total
(observations)

Vancouver Port Authority Northwest Hydraulic Consultants Ltd/Triton Consultants Ltd. Roberts Bank Container Expansion File: 33863 Wind and Wave Climate – Appendix A - 20 - November 2004
Table A3-8: MEDS Measured Wave Height versus Month – Halibut Bank
At the time of writing, VPA have installed a directional wave and current sensor offshore of the
site which is intended to remain in place for the foreseeable future. Measured data from this
sensor were not available for inclusion in this analysis.
3.2.1.2 Numerically-Predicted Offshore Waves
In order to develop a statistically meaningful long-term record of wave conditions at the DPE
site and in the local area of interest, a numerical model of offshore wave conditions was
developed for this study. The wave model, which was developed using Triton’s WaveHind
software, was calibrated and verified against the measured offshore data described previously for
a range of driving wind conditions. Once calibrated, the model was used to generate a time series
of incident offshore Strait of Georgia wave conditions coincident with the wind database.
WaveHind is a variable-fetch single-station parametric wave model that is a well-tested, practical
engineering tool based on the wave prediction equations described in the Shore Protection
Manual (US Army, 1977). It is based on the assumption that winds are relatively uniform over
the water body of interest, and that wave conditions may be described by only three parameters;
Jan Feb Mar Apr May Jun Jul Aug Sep Oct Nov Dec
0.0 - 0.10 39735 3032 3309 3926 4591 3985 2965 2606 2415 2598 3566 3289 34530.10 - 0.25 10172 337 561 725 663 938 1139 1146 1411 1441 880 473 4580.25 - 0.50 4158 250 148 227 165 270 373 429 804 584 379 276 2530.50 - 0.75 4082 311 208 258 179 239 340 406 575 442 376 399 3490.75 - 1.00 1565 152 67 119 55 122 124 167 111 101 167 185 1951.00 - 1.25 1073 96 72 129 27 58 49 24 33 57 126 193 2091.25 - 1.50 296 19 47 30 12 5 11 4 0 11 24 74 591.50 - 1.75 194 9 28 41 1 1 2 0 0 1 21 38 521.75 - 2.00 66 5 12 15 0 0 0 0 0 0 6 13 152.00 - 2.25 42 2 2 11 0 0 0 0 0 1 6 5 152.25 - 2.50 12 0 1 1 0 0 0 0 0 0 5 0 52.50 - 2.75 12 0 1 4 0 0 0 0 0 0 2 4 12.75 - 3.00 1 0 0 0 0 0 0 0 0 0 0 1 03.00 - 3.25 0 0 0 0 0 0 0 0 0 0 0 0 03.25 - 3.50 0 0 0 0 0 0 0 0 0 0 0 0 0
Total 61408 4213 4456 5486 5693 5618 5003 4782 5349 5236 5558 4950 5064
Significant Height (m) Total
Calendar Month
(observations)

Vancouver Port Authority Northwest Hydraulic Consultants Ltd/Triton Consultants Ltd. Roberts Bank Container Expansion File: 33863 Wind and Wave Climate – Appendix A - 21 - November 2004
significant wave height, spectral peak period and dominant direction. The model uses the best
available estimate of overwater winds in the form of hourly wind speed and direction data in
conjunction with overwater fetch distances in each of the eight compass point directions. It
computes wave conditions by stepping hour-by-hour through the wind time series. At each hour,
the model looks backwards in time to find the number of hours that the wind direction was
unchanged (i.e., within a constant compass-point sector) and was non-calm. The model then
determines which combination of average wind speed and duration yields the largest wave height
(e.g., the largest of 40 knots for one hour, 38 knots for two hours, 35 knots for three hours, etc.);
this largest height is then considered to be the best estimate of the actively-generated sea wave
component.
When the wind direction changes, the previously computed sea conditions are allowed to decay
based on the rate of wave energy flux out of the previous sea (now the swell) sector and the
number of hours since the wind direction last changed. Wave conditions in the new sea sector are
computed as described above, and the total wave condition is found by combining sea and swell
wave parameters. The combined condition is computed by summing sea and swell wave
energies, and assigning the total peak period and direction to that of the larger of the sea and
swell components. The final output of the model is an hourly time series of total offshore wave
parameters that can be analysed to yield operational and extreme wave statistics, and transformed
by applying transformation coefficients that modify the dataset to reflect conditions elsewhere
(e.g., at locations of interest inshore).
The model was verified by hindcasting wave conditions at the Halibut Bank wave sensor
(49.34oN, 123.73oW) in approximately 40 m of water. Figure A3-3 shows a comparison of
measured and predicted wave conditions for several representative time periods; the comparison
is considered good.

Vancouver Port Authority Northwest Hydraulic Consultants Ltd/Triton Consultants Ltd. Roberts Bank Container Expansion File: 33863 Wind and Wave Climate – Appendix A - 22 - November 2004
Figure A3-3: Example of Wave Hindcast Calibration/Verification
Following verification of the model, a hindcast location nearer to and offshore of the site was
chosen for the production model runs. The site was located directly offshore of the existing
Roberts Bank Terminal in 85 m CD of water at 49.0oN, 123.18oW. This point lies at the
intersection of the International Boundary and the approximate bearing of the existing causeway
alignment.
Table A3-9 lists the overwater fetch distances were used in the production model.

Vancouver Port Authority Northwest Hydraulic Consultants Ltd/Triton Consultants Ltd. Roberts Bank Container Expansion File: 33863 Wind and Wave Climate – Appendix A - 23 - November 2004
Table A3-9: Overwater Fetches – Operational Model
The resulting wave timeseries produced by the model was analysed and summarised. Figure A3-
4 shows the dataset in wave rose format. Table A3-10 through Table A3-12 show the same
information in bivariate histogram format; observations represent the number of hours in the
period of record.
Figure A3-4: Offshore Wave Rose – Hindcast Data
Direction Fetch (Nm) DescriptionNorth 4.9 to Westham IslandNortheast 3.8 between two causewaysEast 3.4 Passing just south of Tsawwassen FerrySoutheast 33 just beyond Lummi IslandSouth 12 to Saturna IslandSouthwest 9 to southern Galiano IslandWest 15 to northern Galiano IslandNorthwest 62 to Hornby Island

Vancouver Port Authority Northwest Hydraulic Consultants Ltd/Triton Consultants Ltd. Roberts Bank Container Expansion File: 33863 Wind and Wave Climate – Appendix A - 24 - November 2004
Table A3-10: Offshore Wave Height versus Period for All Directions - Hindcast
Table A3-11: Offshore Wave Height versus Direction - Hindcast
0.0-1.0 1.0-2.0 2.0-3.0 3.0-4.0 4.0-5.0 5.0-6.0 6.0-7.0 7.0-8.0 8.0-9.0 9.0-10.0
0.0 - 0.10 99389 99389 0 0 0 0 0 0 0 0 00.10 - 0.50 171328 0 37758 92715 36581 3621 537 108 8 0 00.50 - 1.00 58355 0 0 973 29391 25777 1795 368 46 5 01.00 - 1.50 13456 0 0 0 128 3467 9190 611 51 9 01.50 - 2.00 3973 0 0 0 3 6 717 3096 137 14 02.00 - 2.50 1107 0 0 0 0 0 1 401 689 16 02.50 - 3.00 300 0 0 0 0 0 0 0 244 56 03.00 - 3.50 62 0 0 0 0 0 0 0 0 62 03.50 - 4.00 13 0 0 0 0 0 0 0 0 4 94.00 - 4.50 2 0 0 0 0 0 0 0 0 0 2
Total 347985 99389 37758 93688 66103 32871 12240 4584 1175 166 11
Tp (s)
Total Observations (count)Hs (m) Total
N NE E SE S SW W NW
0.0 - 0.10 993890.10 - 0.50 171328 3429 6662 34046 44134 21619 10975 11919 385440.50 - 1.00 58355 96 1001 3917 18427 8675 3070 3500 196691.00 - 1.50 13456 2 21 122 5488 1693 73 575 54821.50 - 2.00 3973 1 1 6 2161 149 4 43 16082.00 - 2.50 1107 0 0 1 651 16 0 0 4392.50 - 3.00 300 0 0 0 207 0 0 0 933.00 - 3.50 62 0 0 0 26 0 0 0 363.50 - 4.00 13 0 0 0 1 0 0 0 124.00 - 4.50 2 0 0 0 0 0 0 0 2
Total 347985 3528 7685 38092 71095 32152 14122 16037 65885
Significant Height (m) Total
Dominant Direction (from)
(observations)

Vancouver Port Authority Northwest Hydraulic Consultants Ltd/Triton Consultants Ltd. Roberts Bank Container Expansion File: 33863 Wind and Wave Climate – Appendix A - 25 - November 2004
Table A3-12: Offshore Wave Height versus Calendar Month - Hindcast
3.2.2 Nearshore Wave Transformation
The propagation of offshore Strait of Georgia waves inshore to the site was computed using
Triton’s implementation of the numerical model SWAN (Delft University, 2003). SWAN
(Simulating WAves Nearshore) is used to obtain realistic estimates of wave parameters in coastal
areas, lakes and estuaries given wind, bottom and current conditions. The model is based on the
wave-action balance equation in the presence of currents, or energy balance in their absence
(present application) with the inclusion of all significant wave energy source and sink terms
using first-, second- and third-generation wave physics.
The following wave propagation processes are represented:
• rectilinear propagation through geographic space;
• refraction and shoaling due to spatial variations in water depth;
• refraction and shoaling due to spatial variations in current speed and direction (not used in present application);
• blocking and reflections by opposing currents (not used in present application); and,
• transmission, blockage, or reflection from sub-grid obstacles.
The following wave generation and dissipation processes are represented in SWAN:
Jan Feb Mar Apr May Jun Jul Aug Sep Oct Nov Dec
0.0 - 0.10 99389 7479 7225 7800 8115 9304 8321 9006 10209 9354 9035 6739 68020.10 - 0.50 171328 14769 13275 13929 14553 15463 15782 15283 14394 13868 13145 13003 138640.50 - 1.00 58355 5331 5365 5535 4972 4094 4338 4529 4243 3963 4620 5688 56771.00 - 1.50 13456 1469 1195 1644 1166 774 660 869 576 709 1085 1618 16911.50 - 2.00 3973 465 443 523 303 198 244 207 76 118 304 467 6252.00 - 2.50 1107 139 105 139 86 79 58 10 2 43 63 147 2362.50 - 3.00 300 45 42 47 0 13 0 0 0 0 14 36 1033.00 - 3.50 62 7 6 30 0 0 0 0 0 0 2 7 103.50 - 4.00 13 1 5 0 0 0 0 0 0 0 0 5 24.00 - 4.50 2 0 2 0 0 0 0 0 0 0 0 0 0
Total 347985 29705 27663 29647 29195 29925 29403 29904 29500 28055 28268 27710 29010
Significant Height (m) Total
Calendar Month
(observations)

Vancouver Port Authority Northwest Hydraulic Consultants Ltd/Triton Consultants Ltd. Roberts Bank Container Expansion File: 33863 Wind and Wave Climate – Appendix A - 26 - November 2004
• generation by wind;
• dissipation by whitecapping;
• dissipation by depth-induced wave breaking;
• dissipation by bottom friction;
• wave-wave interactions (quadruplets and triads);
• interaction with obstacles; and,
• wave-induced set-up of the mean sea surface.
Diffraction is not explicitly accounted for in the equations upon which SWAN is based.
However, in irregular short-crested wave fields, the effect of diffraction is small except in a
region less than one or two wavelengths away from the diffracting point (Booij et al., 1993) and
has therefore been neglected in the present analysis.
SWAN version 40.30 was implemented for this project based initially on the Existing Conditions
seabed geometry; an additional model was developed for DPE. To achieve a reasonable balance
of computational efficiency and spatial resolution, the models were constructed as nested grids
with a 100 m resolution in the outer domain and a 25 m resolution in the immediate vicinity of
the terminal. Figure A3-5 provides a visual impression of the resolution of the outer and nested
domains of the Existing Conditions model. The resolution of the DPE model geometry is similar.
Figure A3-5: SWAN Existing Conditions Bathymetry – Outer and Nested Grid

Vancouver Port Authority Northwest Hydraulic Consultants Ltd/Triton Consultants Ltd. Roberts Bank Container Expansion File: 33863 Wind and Wave Climate – Appendix A - 27 - November 2004
Ideally, both the Existing Conditions and DPE models described above would be run in dynamic
mode, time-stepping hour-by-hour through the 40 years of wind, wave, and water level
conditions in the offshore metocean database. This would yield 40 years of highly accurate wave
conditions at each gridpoint in the model. Unfortunately, wave generation and propagation
models are slow running and several months of computer CPU time would be required for such
an analysis. For this reason, a compromise was struck between rigor and practical computational
effort which consisted of an approach that assumes a single wave condition is associated with
each individual wind speed and wind direction range considered. This means that a manageable
number of steady-state SWAN runs with prescribed incident wind and wave parameters can be
used to reasonably describe a continuous transfer function relating conditions offshore to those at
inshore locations of interest. The derived transfer function can then be applied to the 40 years of
offshore wave data to yield a continuous hindcast of wave conditions at any inshore location of
interest.
Steady-state wave conditions were computed at low, mean and high water level for both Existing
Conditions and the DPE geometry for each of the incident wind and wave conditions indicated in
Table A3-13.

Vancouver Port Authority Northwest Hydraulic Consultants Ltd/Triton Consultants Ltd. Roberts Bank Container Expansion File: 33863 Wind and Wave Climate – Appendix A - 28 - November 2004
Table A3-13: Modelled Wind and Wave Conditions
The tabulated parameters represent hourly sustained wind speeds, significant wave heights and
peak spectral periods.
Calm 1 1.979 0.1 1.1
N 1 4.69 0.25 2.3 S 1 14.43 0.25 2.3N 5 1.876 0.75 4.7 S 5 10.2 0.75 4.7N 10 0.352 1 5.2 S 10 5.511 1 5.2N 15 0.058 1.25 5.7 S 15 2.767 1 5.2N 20 0.014 1.5 6 S 20 1.028 1.25 5.7N 25 0.003 1.75 6.4 S 25 0.327 1.25 5.7N 30 0 2 6.8 S 30 0.081 1.5 6
S 35 0.024 1.75 6.4S 40 0.006 2 6.8S 45 0.001 2.25 7.2
NE 1 5.538 0.25 2.3 SW 1 7.418 0.25 2.3NE 5 2.948 0.75 4.7 SW 5 4.727 0.5 3.8NE 10 1.245 1 5.2 SW 10 2.252 0.75 4.7NE 15 0.441 1.25 5.7 SW 15 0.799 1 5.2NE 20 0.122 1.25 5.7 SW 20 0.154 1.15 5.2NE 25 0.021 1.5 6 SW 25 0.024 1.4 5.6NE 30 0.001 1.5 6 SW 30 0.005 1.5 5.8
SW 35 0.001 1.6 6
E 1 15.97 0.25 2.3 W 1 8.464 0.25 2.3E 5 12.25 0.75 4.7 W 5 5.182 0.75 4.7E 10 6.268 1 5.2 W 10 2.397 1 5.2E 15 2.15 1.25 5.7 W 15 0.889 1.15 5.4E 20 0.552 1.25 5.7 W 20 0.293 1.3 5.7E 25 0.11 1.25 5.7 W 25 0.075 1.4 5.8E 30 0.013 1.25 5.7 W 30 0.014 1.55 6E 35 0.002 1.25 5.7 W 35 0.001 1.8 6.4E 40 0.001 1.25 5.7
SE 1 22.92 0.25 2.3 NW 1 18.58 0.25 2.3SE 5 18.36 0.8 4.5 NW 5 13.96 0.5 3.8SE 10 9.976 1.35 5.8 NW 10 6.733 0.75 4.7SE 15 4.548 1.6 6.1 NW 15 2.484 1 5.2SE 20 2.027 1.85 6.5 NW 20 0.773 1.25 5.7SE 25 0.855 2.1 7 NW 25 0.225 1.5 6SE 30 0.312 2.35 7.3 NW 30 0.056 2 6.8SE 35 0.097 2.6 7.6 NW 35 0.014 2.5 7.5SE 40 0.023 2.8 8 NW 40 0.003 2.75 7.9SE 45 0.003 3 8.3 NW 45 0.001 3.25 8.5
Wave Period
(s)
*Frequency of exceedance for specified direction in all cases except for calms in which case the value represents the frequency of occurrence.
Dir (from)
Wind Speed (kts)
Freq.* (%)
Wave Period
(s)
Wave Height
(m)
Wind Speed (kts)
Wave Height
(m)
Dir (from)
Freq. (%)
Vancouver Port Authority Northwest Hydraulic Consultants Ltd/Triton Consultants Ltd. Roberts Bank Container Expansion File: 33863 Wind and Wave Climate – Appendix A - 29 - November 2004
The pairing of wind and wave parameters was derived from a simple joint probability assessment
using the hindcast wind and wave database. Each pairing was determined by first plotting a
bivariate histogram of hourly wind speed (5 knot bins) versus significant wave height (0.5 m
bins) for each wind direction (45 degree bins). The histograms were then used to determine the
most commonly occurring joint condition for each wind speed bin interval. It is noted that, for
some wind conditions, there was considerable variability in offshore wave height which is a
reflection of the fact that sea conditions in the Strait are not always fetch limited. The significant
wave height associated with the next highest wave height bin (to introduce a degree of
conservatism into the analysis) was then assigned to that wind condition. The wave direction was
assumed to be the same as that of the wind which is a reasonably accurate approximation for
locally-generated seas such as those in the Strait. The associated wave period was assigned using
the chosen wave height and an empirical best-fit wave height/wave period relationship developed
from the wave database.
Note that the traditional coastal engineering approach to this type of analysis is to compute wave
transformations for a range of offshore wave periods and directions, and to assume that the
computed inshore conditions are scale linearly with wave height and are completely independent
of wind speed. Such an approach could not be used for the present study because it would have
required that wave growth within the local study area be ignored. Wave growth effects are
considered to be an essential element of this study, particularly across the shallow regions of
Roberts Bank.
The results of the model are not well suited for presentation in report format due to the large
number of runs (hundreds) and detail of the information available for each run. For this reason,
the complete set of results is provided on compact disk that is available upon request.
A few representative plots are included below to demonstrate the type of information that is
available. Figure A3-6 through Figure A3-8 show the spatial variation of waves during typical
10, 20 and 30-knot southeast wind conditions for existing and post-project conditions at mean
water. The colour contours indicate significant wave height and the vectors indicate the direction
towards which waves are propagating. Note that the differences in pre- and post-project wave
conditions are insignificant except in the immediate vicinity of the proposed DPE berth.

Vancouver Port Authority Northwest Hydraulic Consultants Ltd/Triton Consultants Ltd. Roberts Bank Container Expansion File: 33863 Wind and Wave Climate – Appendix A - 30 - November 2004
Figure A3-6: Typical Wave Conditions – 10 knot SE wind, mean water level
Figure A3-7: Typical Wave Conditions – 20 knot SE wind, mean water level
Figure A3-8: Typical Wave Conditions – 30 knot SE wind, mean water level

Vancouver Port Authority Northwest Hydraulic Consultants Ltd/Triton Consultants Ltd. Roberts Bank Container Expansion File: 33863 Wind and Wave Climate – Appendix A - 31 - November 2004
A similar conclusion can be drawn at other water levels; Figure A3-9 through Figure A3-11
show that the pre- and post-project differences are minor at low, mean and high water level.
Figure A3-9: Typical Wave Conditions – 20 knot SE wind, low water level
Figure A3-10: Typical Wave Conditions – 20 knot SE wind, mean water level
Figure A3-11: Typical Wave Conditions – 20 knot SE wind, high water level

Vancouver Port Authority Northwest Hydraulic Consultants Ltd/Triton Consultants Ltd. Roberts Bank Container Expansion File: 33863 Wind and Wave Climate – Appendix A - 32 - November 2004
The effect of wind direction on wave conditions can be seen in Figure A3-12 through Figure A3-
16. These mean water plots demonstrate 20-knot winds from NW, W, SW, S and SE.
Figure A3-12: Typical Wave Conditions – 20 knot NW wind, mean water level
Figure A3-13: Typical Wave Conditions – 20 knot west wind, mean water level

Vancouver Port Authority Northwest Hydraulic Consultants Ltd/Triton Consultants Ltd. Roberts Bank Container Expansion File: 33863 Wind and Wave Climate – Appendix A - 33 - November 2004
Figure A3-14: Typical Wave Conditions – 20 knot SW wind, mean water level
Figure A3-15: Typical Wave Conditions – 20 knot south wind, mean water level
Figure A3-16: Typical Wave Conditions – 20 knot SE wind, mean water level
Again, the differences between pre- and post-project are seen to be minor.

Vancouver Port Authority Northwest Hydraulic Consultants Ltd/Triton Consultants Ltd. Roberts Bank Container Expansion File: 33863 Wind and Wave Climate – Appendix A - 34 - November 2004
4.0 CONCLUSION
This appendix provides a review of available wind and wave data for the southern portion of the
Strait of Georgia. The existing wind data is used to generate the general wave climate at Roberts
Bank, which is verified against existing wave data. The formation of offshore waves is
calculated using Triton’s WaveHind software. Propagation of these offshore waves into the
nearshore area in the vicinity of Roberts Bank was computed using Triton’s implementation of
the numerical model SWAN (Delft University, 2003). Thus a detailed computation of the
expected wave climate in the project area has been generated using numerical models verified
against a reliable dataset.

Vancouver Port Authority Northwest Hydraulic Consultants Ltd/Triton Consultants Ltd. Roberts Bank Container Expansion File: 33863 Wind and Wave Climate – Appendix A - 35 - November 2004
5.0 REFERENCES
Delft University, 2003. SWAN Cycle III version 40.30 Users Manual. Unauthorized Electronic Version. Prepared by Holthuijsen, L.H., Booij, N., Ris, R.C., Haagsma, I.J.G., Kieftenburg, A.T.M.M., Kriezi, E.E., Zijlema, M., van der Westhuysen, A.J. Available from http://fluidmechanics.tudelft.nl/swan/download/info.htm, February 2004.
Lange, O.S., 1998. The wind came all ways: a quest to understand the winds, waves and weather in the Georgia Basin. Environment Canada, Victoria, B.C.
MSC, 2000. CD ROM Coastal Weather for British Columbia Mariners prepared by the Meteorological Service of Canada.