robert j. gordon, northwestern, nber, cepr ees/iab workshop on
DESCRIPTION
The Evolution of Okun’s Law and of Cyclical Productivity Fluctuations in the United States vs. Europe. Robert J. Gordon, Northwestern, NBER, CEPR EES/IAB Workshop on Labor Market Institutions and the Macroeconomy Nuremberg, June 17-18, 2011. Themes of Paper with Broader Implications. - PowerPoint PPT PresentationTRANSCRIPT

The Evolution of Okun’s Law and of The Evolution of Okun’s Law and of Cyclical Productivity Fluctuations Cyclical Productivity Fluctuations
in the United States vs. Europe in the United States vs. Europe
Robert J. Gordon, Northwestern, NBER, CEPRRobert J. Gordon, Northwestern, NBER, CEPR
EES/IAB Workshop on EES/IAB Workshop on
Labor Market Institutions and the MacroeconomyLabor Market Institutions and the Macroeconomy
Nuremberg, June 17-18, 2011Nuremberg, June 17-18, 2011

Themes of Paper with Broader Implications
Procyclical productivity shocks are not a fundamental object in macroeconomics; they are residual artifacts of lags of hours behind output– Productivity lead is definitional and does not prove
causation– Productivity residual varies across time and places (US vs
EU) as a result in part of labor-market institutions, not differences in technology shocks.
– Procyclical productivity fluctuations have nothing to do with technology, and the phrase “technology shocks” should be banished from business-cycle macroeconomics
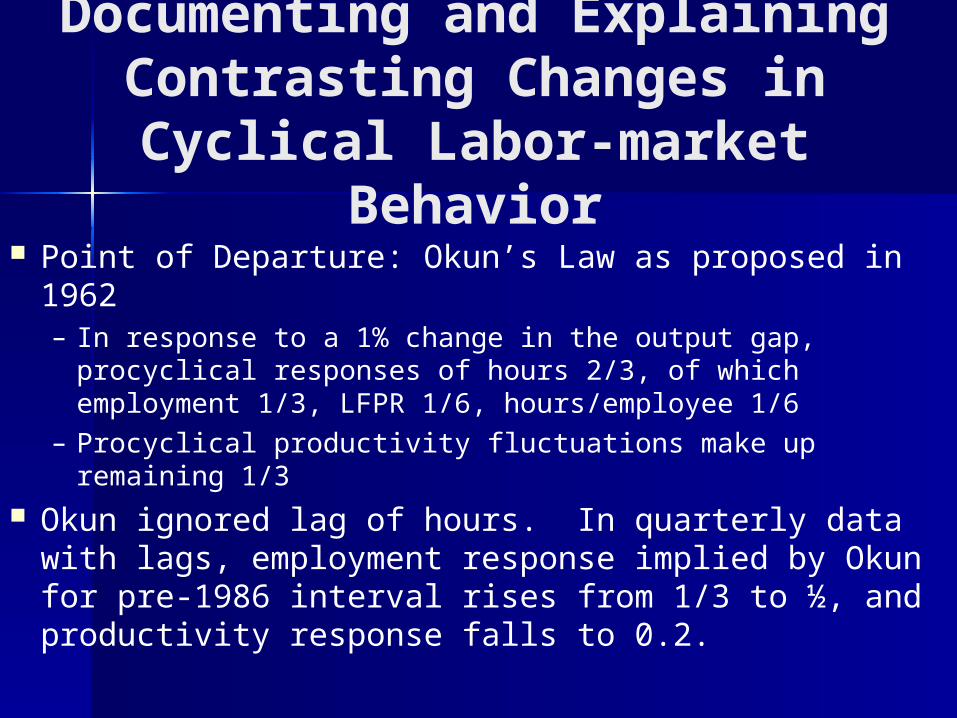
Documenting and Explaining Contrasting Changes in Cyclical
Labor-market Behavior Point of Departure: Okun’s Law as proposed in 1962
– In response to a 1% change in the output gap, procyclical responses of hours 2/3, of which employment 1/3, LFPR 1/6, hours/employee 1/6
– Procyclical productivity fluctuations make up remaining 1/3 Okun ignored lag of hours. In quarterly data with lags,
employment response implied by Okun for pre-1986 interval rises from 1/3 to ½, and productivity response falls to 0.2.
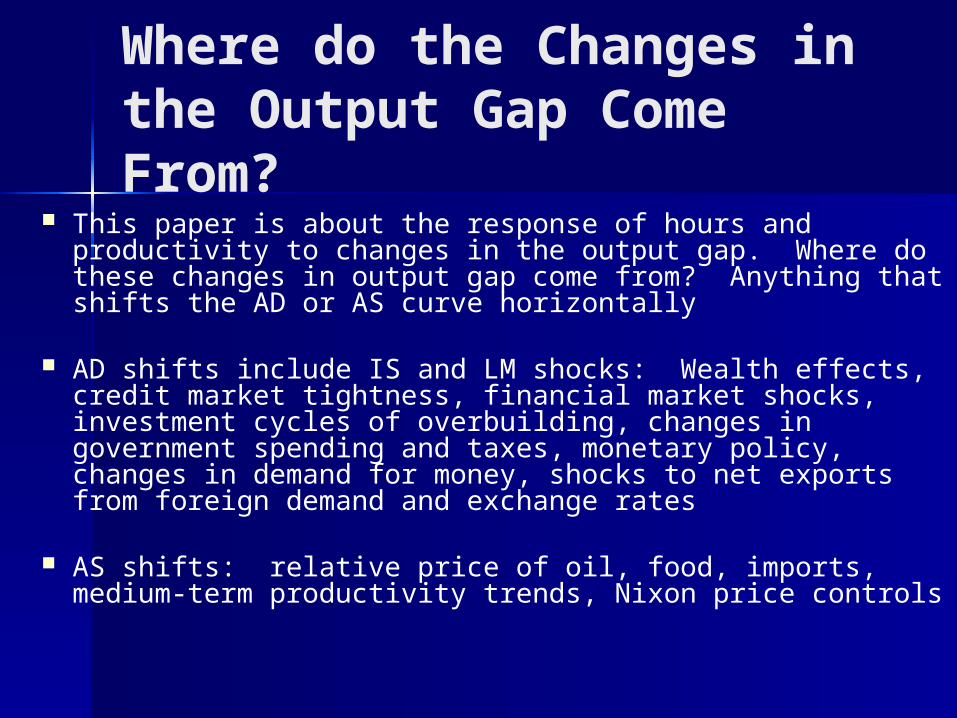
Where do the Changes in the Output Gap Come From?
This paper is about the response of hours and productivity to changes in the output gap. Where do these changes in output gap come from? Anything that shifts the AD or AS curve horizontally
AD shifts include IS and LM shocks: Wealth effects, credit market tightness, financial market shocks, investment cycles of overbuilding, changes in government spending and taxes, monetary policy, changes in demand for money, shocks to net exports from foreign demand and exchange rates
AS shifts: relative price of oil, food, imports, medium-term productivity trends, Nixon price controls
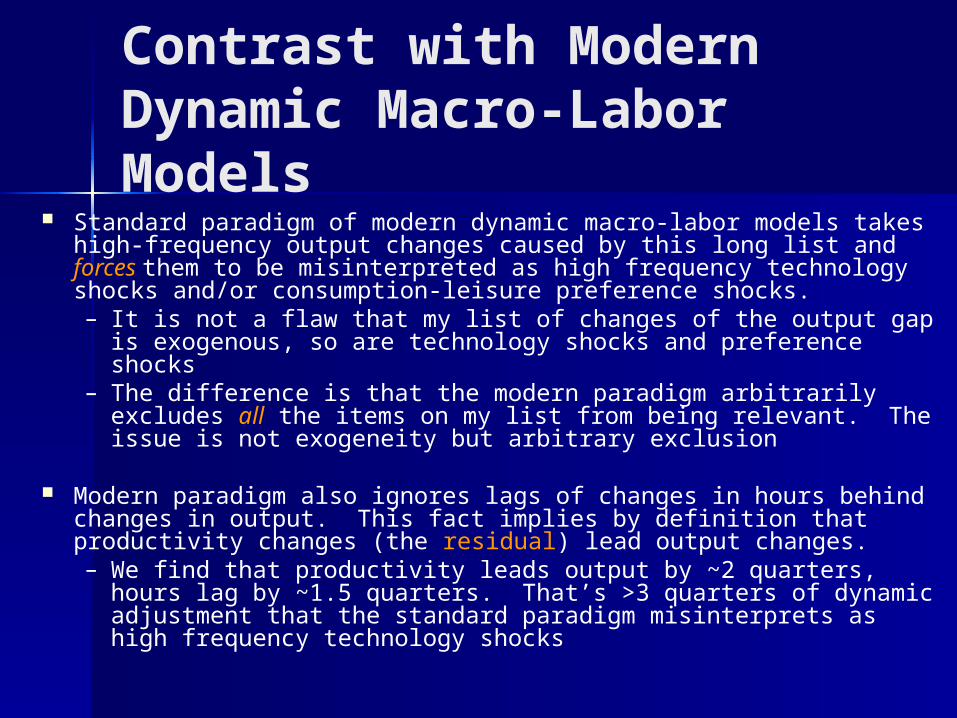
Contrast with Modern Dynamic Macro-Labor Models
Standard paradigm of modern dynamic macro-labor models takes high-frequency output changes caused by this long list and forces them to be misinterpreted as high frequency technology shocks and/or consumption-leisure preference shocks.– It is not a flaw that my list of changes of the output gap is exogenous,
so are technology shocks and preference shocks– The difference is that the modern paradigm arbitrarily excludes all the
items on my list from being relevant. The issue is not exogeneity but arbitrary exclusion
Modern paradigm also ignores lags of changes in hours behind changes in output. This fact implies by definition that productivity changes (the residual) lead output changes.– We find that productivity leads output by ~2 quarters, hours lag by
~1.5 quarters. That’s >3 quarters of dynamic adjustment that the standard paradigm misinterprets as high frequency technology shocks
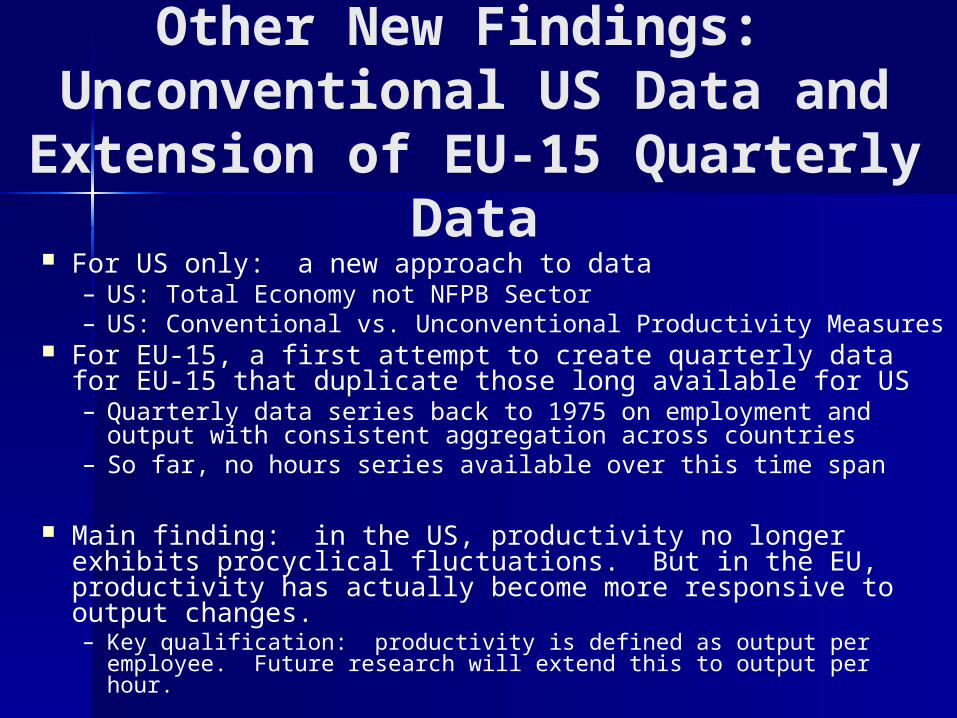
Other New Findings: Unconventional US Data and
Extension of EU-15 Quarterly Data For US only: a new approach to data
– US: Total Economy not NFPB Sector– US: Conventional vs. Unconventional Productivity Measures
For EU-15, a first attempt to create quarterly data for EU-15 that duplicate those long available for US– Quarterly data series back to 1975 on employment and output
with consistent aggregation across countries– So far, no hours series available over this time span
Main finding: in the US, productivity no longer exhibits procyclical fluctuations. But in the EU, productivity has actually become more responsive to output changes.– Key qualification: productivity is defined as output per employee.
Future research will extend this to output per hour.
Preview of Substantive Hypotheses to Explain Changes
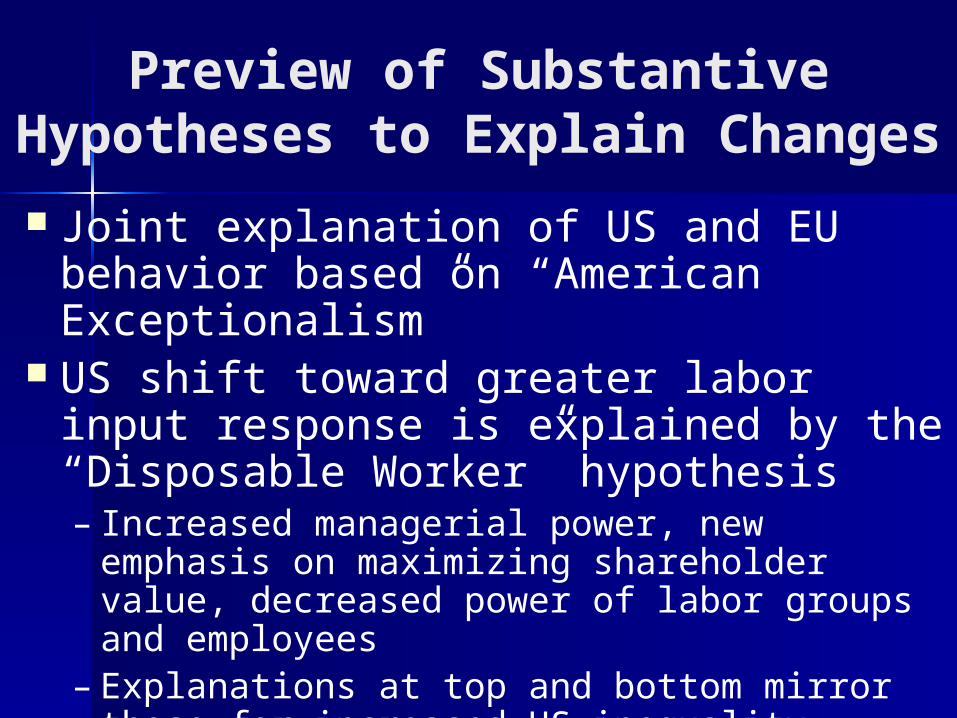
Joint explanation of US and EU behavior based on “American Exceptionalism”
US shift toward greater labor input response is explained by the “Disposable Worker” hypothesis– Increased managerial power, new emphasis on
maximizing shareholder value, decreased power of labor groups and employees
– Explanations at top and bottom mirror those for increased US inequality
Preview of Substantive Hypotheses (Continued)
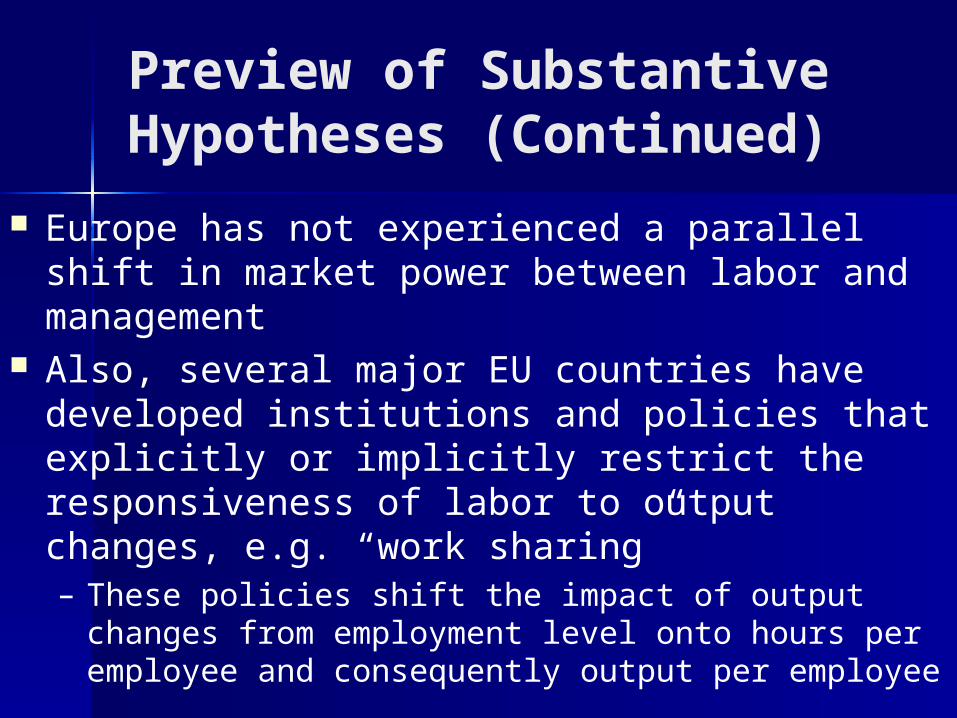
Europe has not experienced a parallel shift in market power between labor and management
Also, several major EU countries have developed institutions and policies that explicitly or implicitly restrict the responsiveness of labor to output changes, e.g. “work sharing”– These policies shift the impact of output changes from
employment level onto hours per employee and consequently output per employee
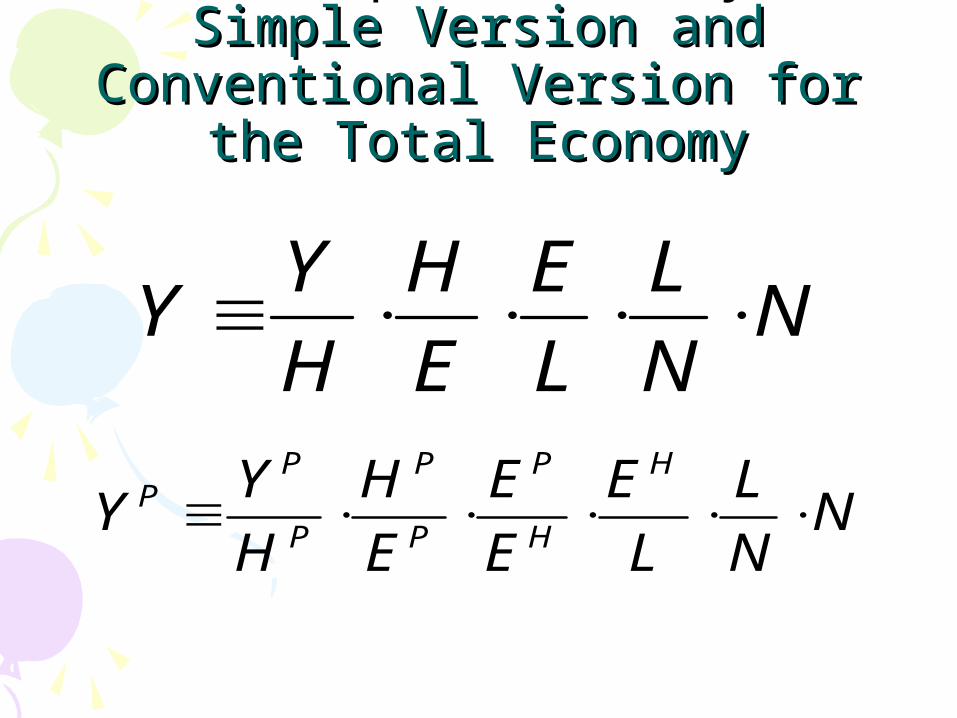
The Output Identity: Simple The Output Identity: Simple Version and Conventional Version and Conventional
Version for the Total EconomyVersion for the Total Economy
NN
L
L
E
E
H
H
YY
NN
L
L
E
E
E
E
H
H
YY
H
H
P
P
P
P
PP

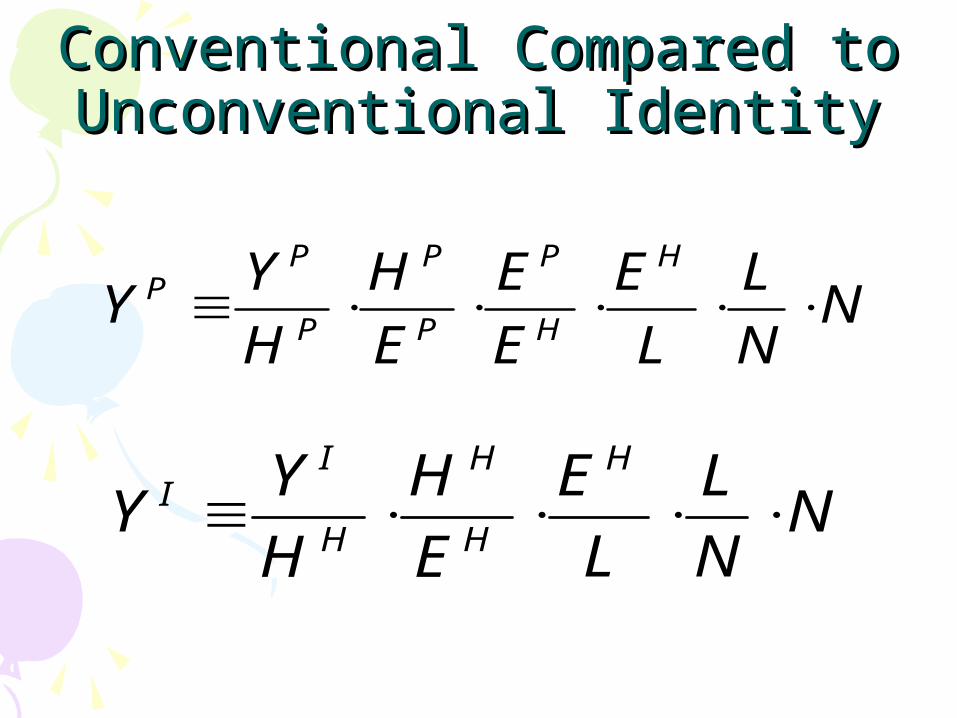
Introducing the Alternative “Unconventional” Identity
Nalewaik’s 2010 Brookings Paper:– GDP and GDI are conceptually identical– But they differ (statistical discrepancy)– GDI is more procyclical– When GDP is revised, it tends to be revised toward what GDI already
shows Hours
– All existing work uses hours based on payroll employment– There is a little-known series on hours based on the household survey
In principle 2 numerators, 2 denominators = 4 possible productivity measures, here we simplify by comparing only two combinations, Conventional and Unconventional
Conventional Compared to Conventional Compared to Unconventional IdentityUnconventional Identity
NN
L
L
E
E
E
E
H
H
YY
H
H
P
P
P
P
PP
NN
L
L
E
E
H
H
YY
H
H
H
H
II

Detrending the Detrending the Full-Period US DataFull-Period US Data
Uses Kalman detrending, which allows use of an outside Uses Kalman detrending, which allows use of an outside feedback variable.feedback variable.– Avoids excessive cyclicality of H-P trendsAvoids excessive cyclicality of H-P trends– For this outside information, turn to a technique for estimating the For this outside information, turn to a technique for estimating the
unemployment gap from inflation data. The unemployment gap unemployment gap from inflation data. The unemployment gap provides outside information on the business cycleprovides outside information on the business cycle
– Study of US vs. EU uses H-P filter as a stopgap prior to further Study of US vs. EU uses H-P filter as a stopgap prior to further data study to locate outside cyclical variabledata study to locate outside cyclical variable
We avoid making judgments on 2008-10 cycle by constraining all growth trends as equal to 2007:Q4 values throughout 2008-10– Thus the paper “dodges” the hot current (as yet unanswerable) topic of
the new normal
Graphs Start with the US:Graphs Start with the US:What We Learn from Cyclical What We Learn from Cyclical
Deviations from TrendDeviations from Trend The most interesting results The most interesting results
– OkunOkun’’s 2/3 hours vs. 1/3 productivity result worked s 2/3 hours vs. 1/3 productivity result worked perfectly in late 1960s and early 1980s but at perfectly in late 1960s and early 1980s but at almost no other timealmost no other time
Most important, the 2008-09 cycle has been Most important, the 2008-09 cycle has been bigger for hours than for output, while 1980-82 bigger for hours than for output, while 1980-82 was the reversewas the reverse
Correlation of productivity gap with output gap Correlation of productivity gap with output gap changes timing and disappears after mid-1980schanges timing and disappears after mid-1980s
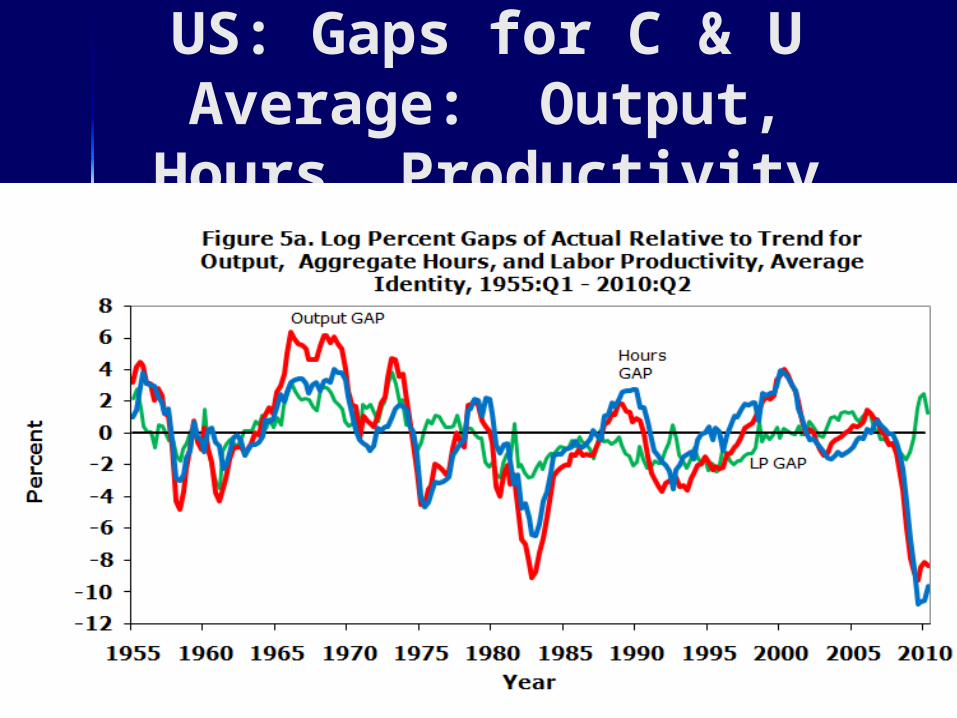
US: Gaps for C & U Average: Output, Hours, Productivity
Regression Analysis Begins for Regression Analysis Begins for US-Only 1955-86 vs. 1986-2010US-Only 1955-86 vs. 1986-2010
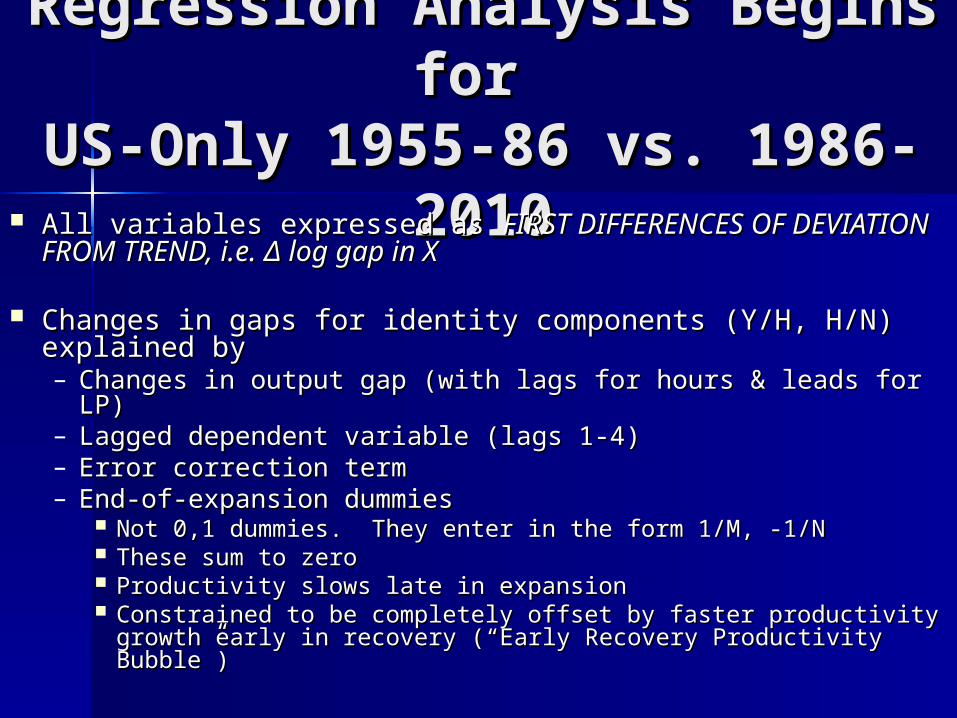
All variables expressed as All variables expressed as FIRST DIFFERENCES OF FIRST DIFFERENCES OF DEVIATION FROM TREND, i.e. DEVIATION FROM TREND, i.e. ΔΔ log gap in X log gap in X
Changes in gaps for identity components (Y/H, H/N) explained by Changes in gaps for identity components (Y/H, H/N) explained by – Changes in output gap (with lags for hours & leads for LP)Changes in output gap (with lags for hours & leads for LP)– Lagged dependent variable (lags 1-4)Lagged dependent variable (lags 1-4)– Error correction termError correction term– End-of-expansion dummiesEnd-of-expansion dummies
Not 0,1 dummies. They enter in the form 1/M, -1/NNot 0,1 dummies. They enter in the form 1/M, -1/N These sum to zeroThese sum to zero Productivity slows late in expansionProductivity slows late in expansion Constrained to be completely offset by faster productivity growth early Constrained to be completely offset by faster productivity growth early
in recovery (in recovery (““Early Recovery Productivity BubbleEarly Recovery Productivity Bubble””))

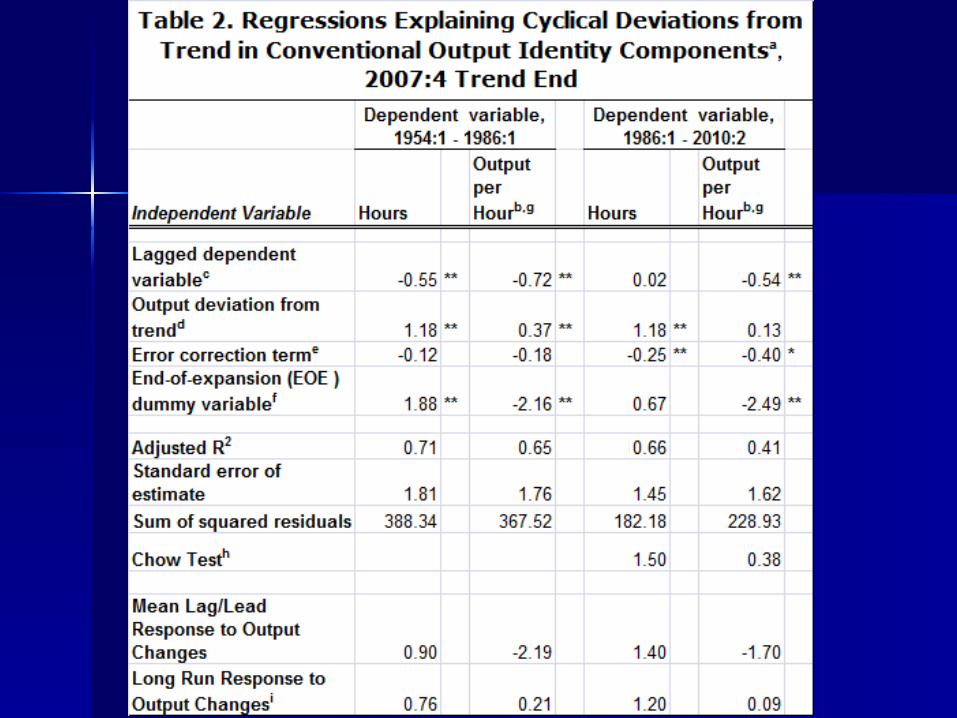
Regression Results for US-Regression Results for US-Only, Table 2, 1955-86 vs. Only, Table 2, 1955-86 vs.
1986-20101986-2010 Hours gap lags output by roughly one quarterHours gap lags output by roughly one quarter Productivity leads output by roughly two quartersProductivity leads output by roughly two quarters End-of-expansion dummies (8 recessions)End-of-expansion dummies (8 recessions)
– To simplify tables, constrained to be equal within subsampleTo simplify tables, constrained to be equal within subsample– Significant in LP equations pre and post 1986Significant in LP equations pre and post 1986– Not significant in hours equation post 1986Not significant in hours equation post 1986
Split sample: 1954-86 vs 1986-2010Split sample: 1954-86 vs 1986-2010– Big change in long-run responsesBig change in long-run responses
To simplify paper, regressions are presented only for To simplify paper, regressions are presented only for conventional concept of hours & LPconventional concept of hours & LP– Unconventional data are noisier due to HHUnconventional data are noisier due to HH
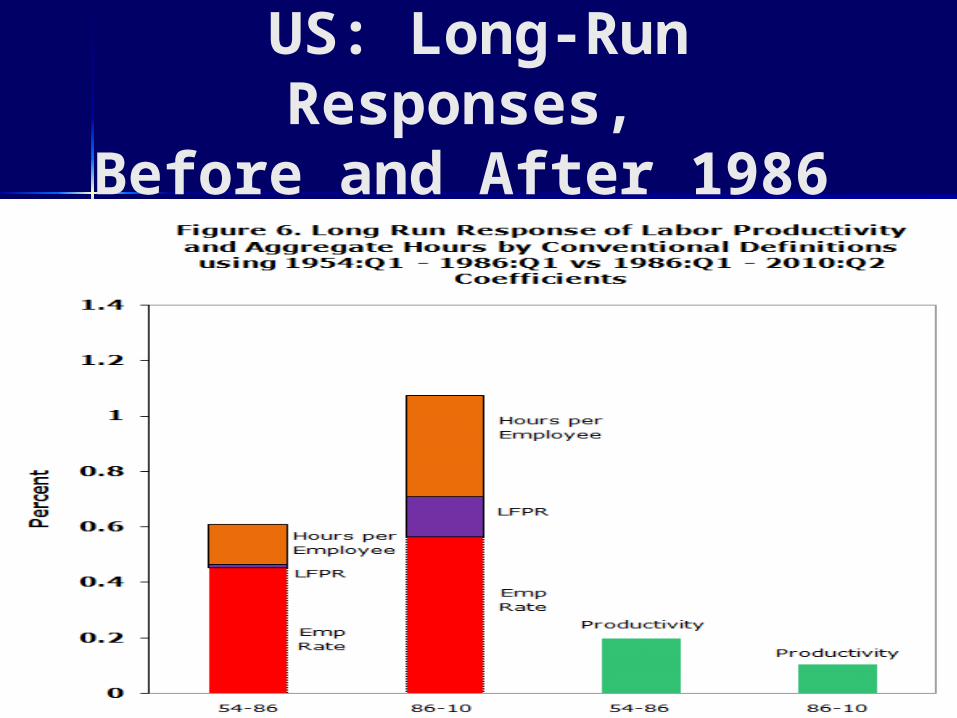
US: Long-Run Responses, Before and After 1986
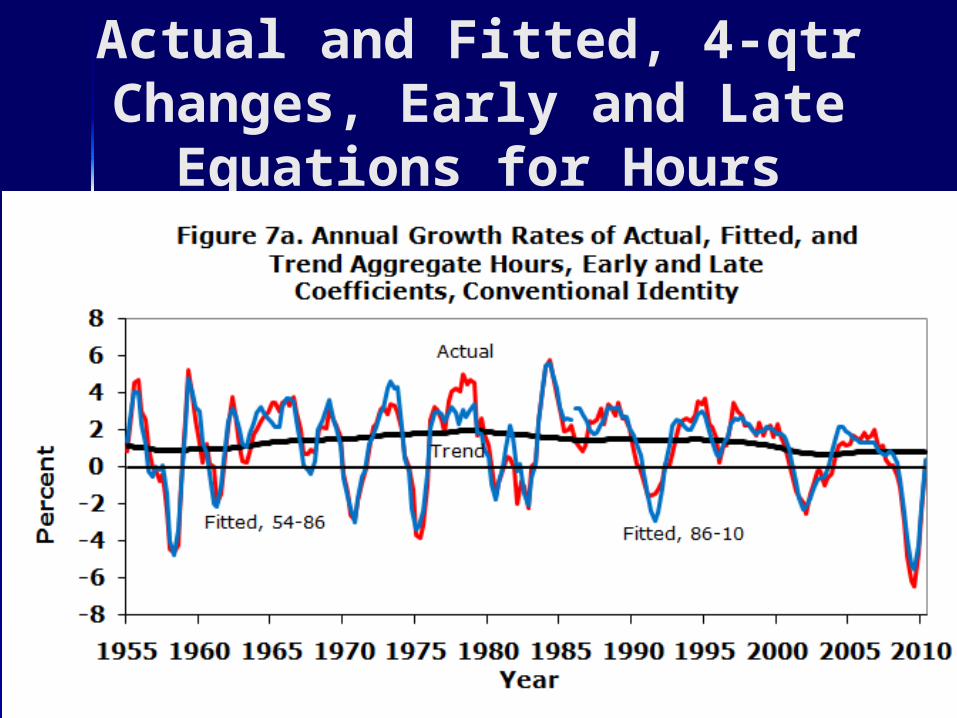
Actual and Fitted, 4-qtr Changes, Early and Late
Equations for Hours
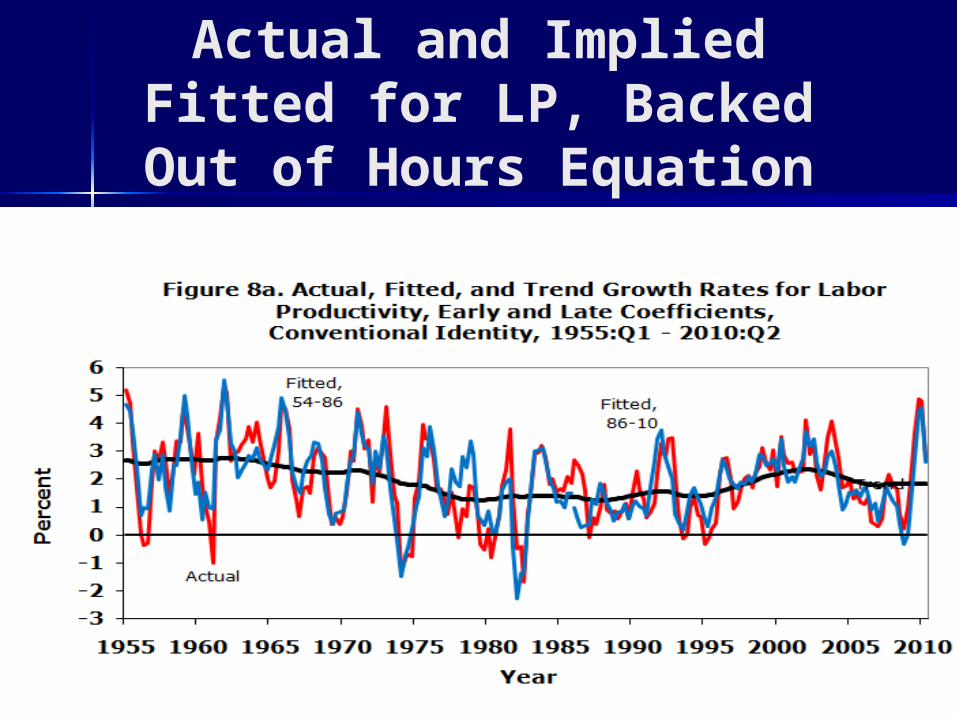
Actual and Implied Fitted for LP, Backed Out of Hours
Equation
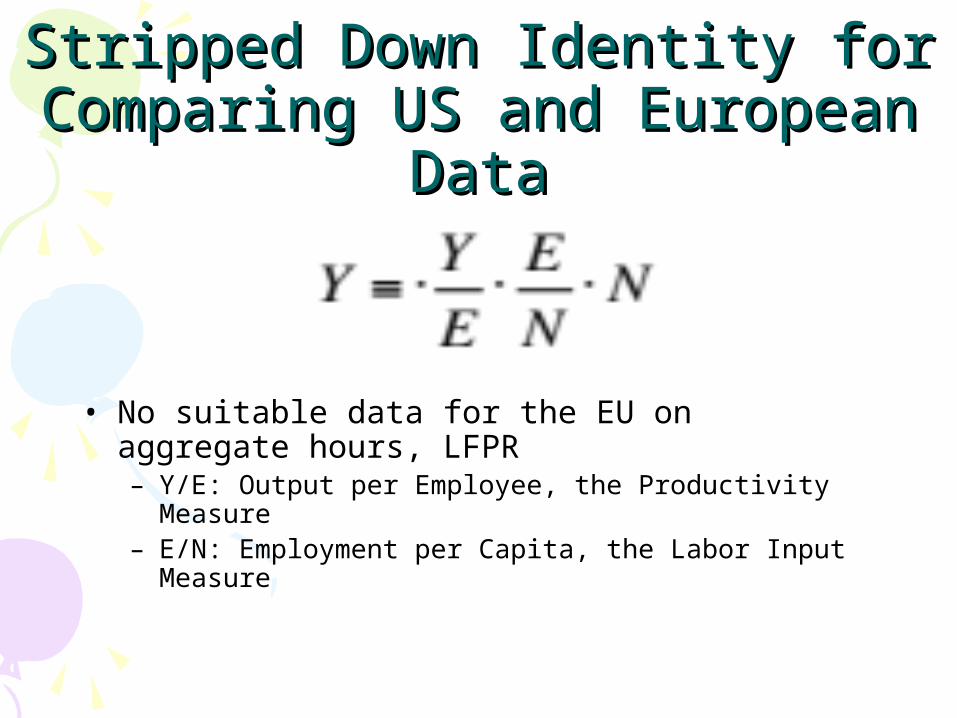
Stripped Down Identity for Stripped Down Identity for Comparing US and European Comparing US and European
DataData
• No suitable data for the EU on aggregate hours, LFPR– Y/E: Output per Employee, the Productivity
Measure– E/N: Employment per Capita, the Labor Input
Measure
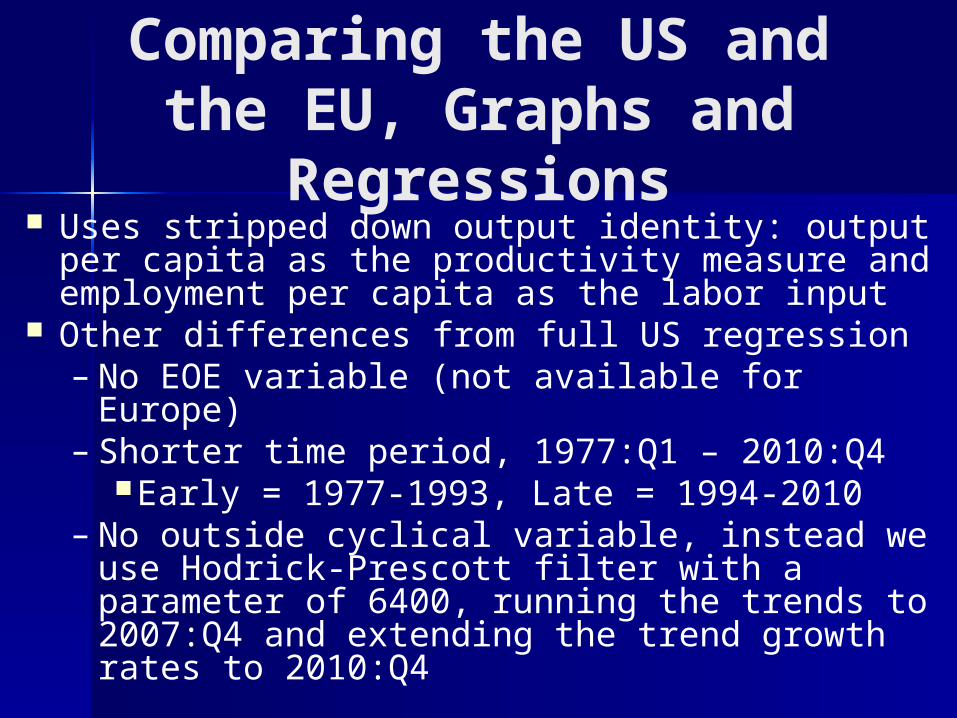
Comparing the US and the EU, Graphs and Regressions
Uses stripped down output identity: output per capita as the productivity measure and employment per capita as the labor input
Other differences from full US regression– No EOE variable (not available for Europe)– Shorter time period, 1977:Q1 – 2010:Q4
Early = 1977-1993, Late = 1994-2010– No outside cyclical variable, instead we use
Hodrick-Prescott filter with a parameter of 6400, running the trends to 2007:Q4 and extending the trend growth rates to 2010:Q4
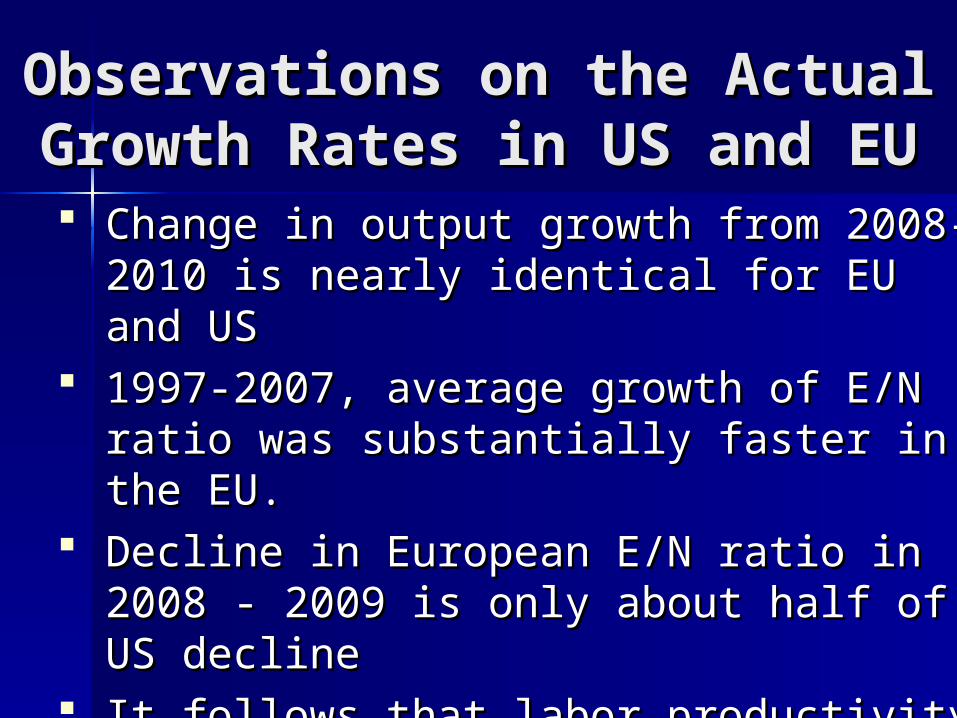
Observations on the Actual Observations on the Actual Growth Rates in US and EUGrowth Rates in US and EU
Change in output growth from 2008-2010 is Change in output growth from 2008-2010 is nearly identical for EU and USnearly identical for EU and US
1997-2007, average growth of E/N ratio was 1997-2007, average growth of E/N ratio was substantially faster in the EU.substantially faster in the EU.
Decline in European E/N ratio in 2008 - 2009 Decline in European E/N ratio in 2008 - 2009 is only about half of US declineis only about half of US decline
It follows that labor productivity must have It follows that labor productivity must have grown more slowly in the EU after 1997, as grown more slowly in the EU after 1997, as shown in the graph of Y/Eshown in the graph of Y/E
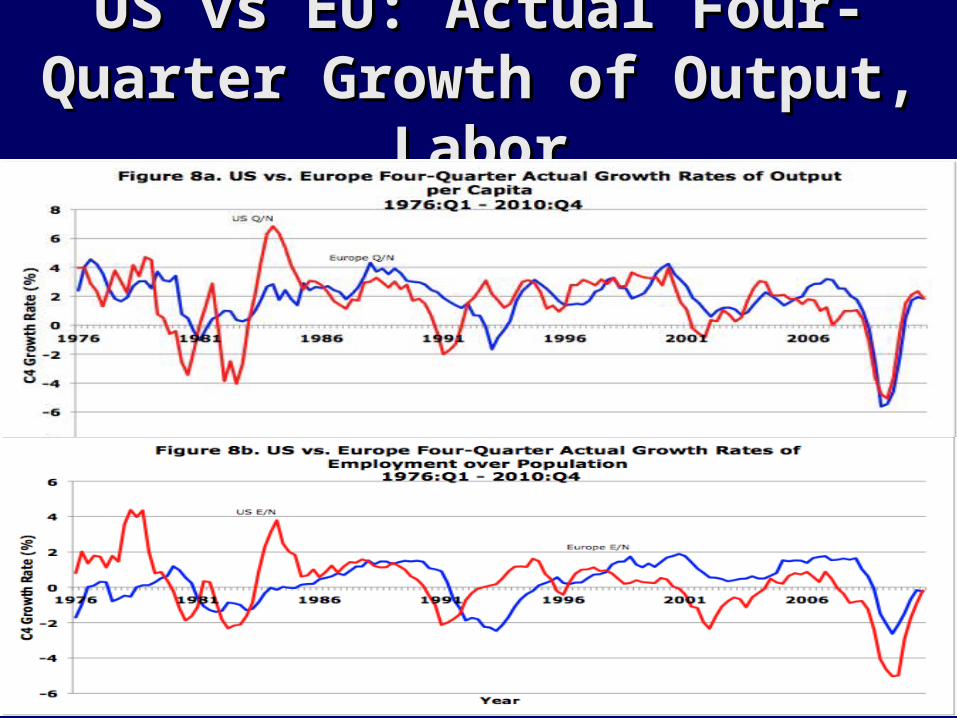
US vs EU: Actual Four-Quarter US vs EU: Actual Four-Quarter Growth of Output, LaborGrowth of Output, Labor
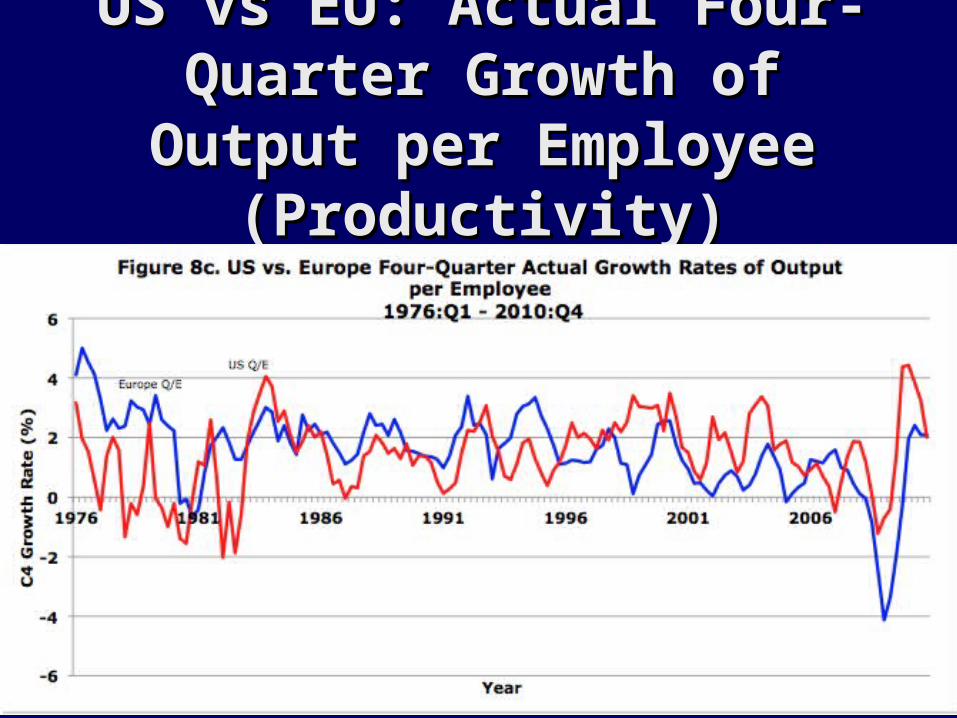
US vs EU: Actual Four-US vs EU: Actual Four-Quarter Growth of Output Quarter Growth of Output
per Employee (Productivity)per Employee (Productivity)
Observations on Gaps in US and Observations on Gaps in US and EUEU
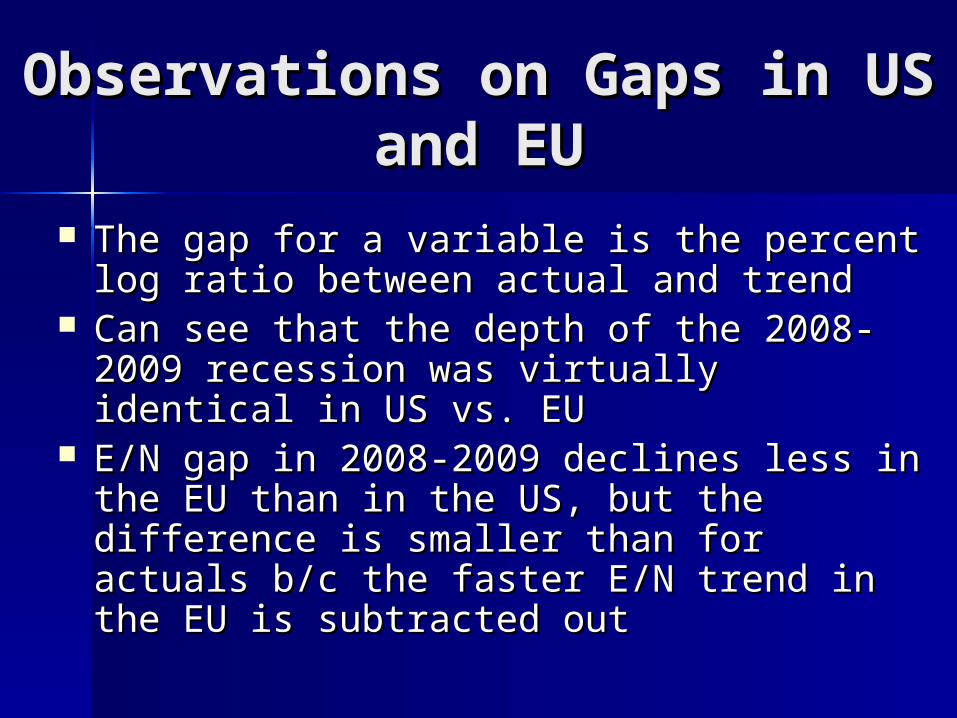
The gap for a variable is the percent log ratio The gap for a variable is the percent log ratio between actual and trendbetween actual and trend
Can see that the depth of the 2008-2009 Can see that the depth of the 2008-2009 recession was virtually identical in US vs. EUrecession was virtually identical in US vs. EU
E/N gap in 2008-2009 declines less in the EU than E/N gap in 2008-2009 declines less in the EU than in the US, but the difference is smaller than for in the US, but the difference is smaller than for actuals b/c the faster E/N trend in the EU is actuals b/c the faster E/N trend in the EU is subtracted outsubtracted out
Observations on Gaps in US and Observations on Gaps in US and EU (cont.)EU (cont.)
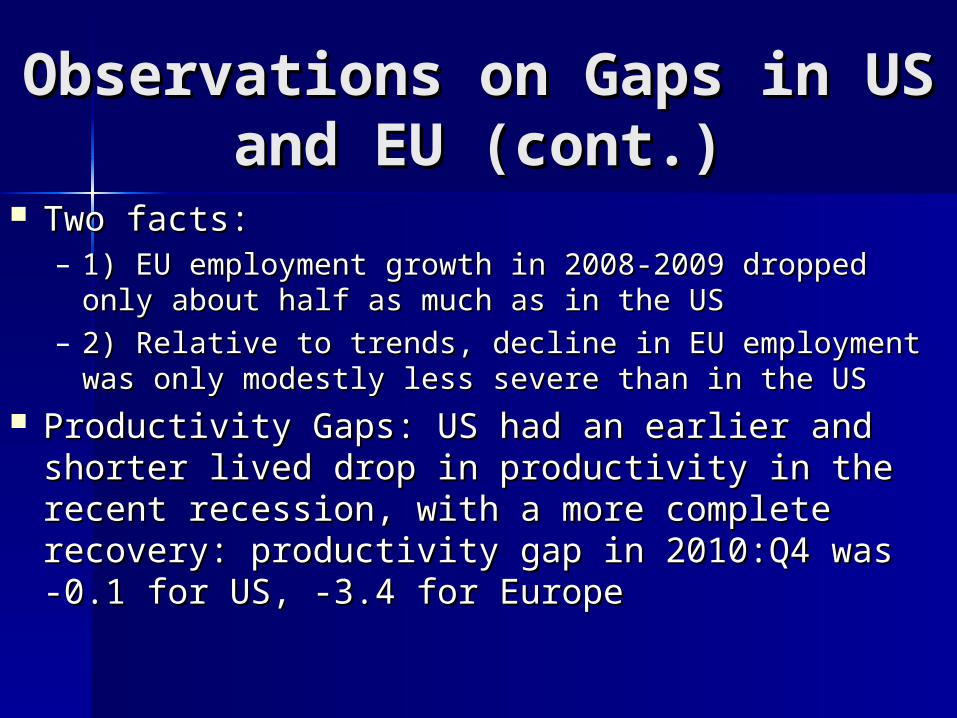
Two facts:Two facts:– 1) EU employment growth in 2008-2009 dropped only 1) EU employment growth in 2008-2009 dropped only
about half as much as in the USabout half as much as in the US– 2) Relative to trends, decline in EU employment was only 2) Relative to trends, decline in EU employment was only
modestly less severe than in the USmodestly less severe than in the US Productivity Gaps: US had an earlier and shorter Productivity Gaps: US had an earlier and shorter
lived drop in productivity in the recent recession, with lived drop in productivity in the recent recession, with a more complete recovery: productivity gap in a more complete recovery: productivity gap in 2010:Q4 was -0.1 for US, -3.4 for Europe2010:Q4 was -0.1 for US, -3.4 for Europe
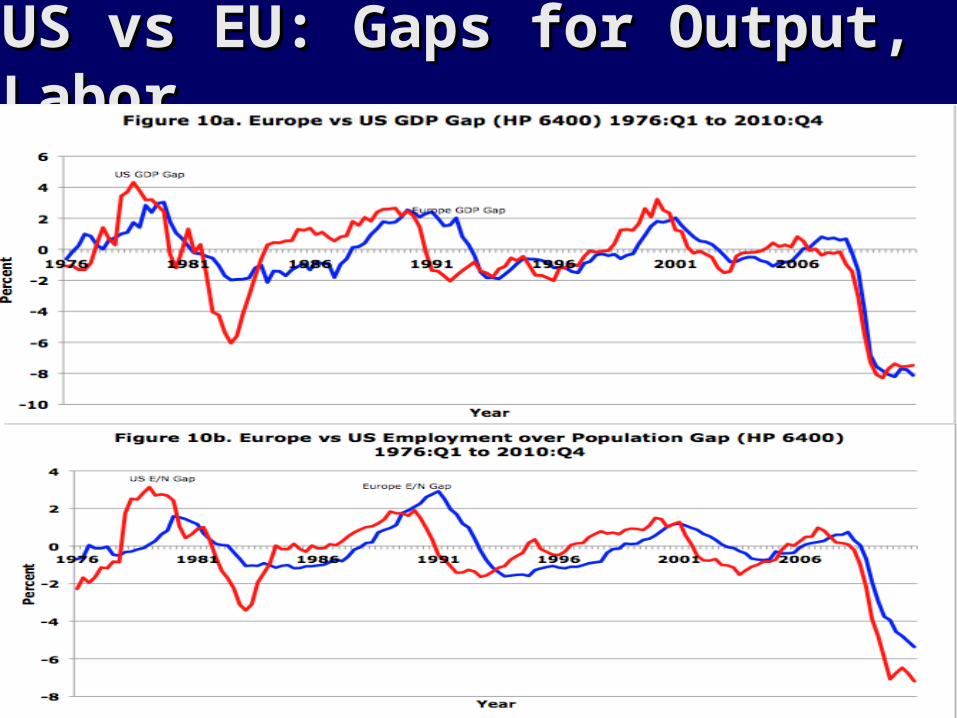
US vs EU: Gaps for Output, LaborUS vs EU: Gaps for Output, Labor
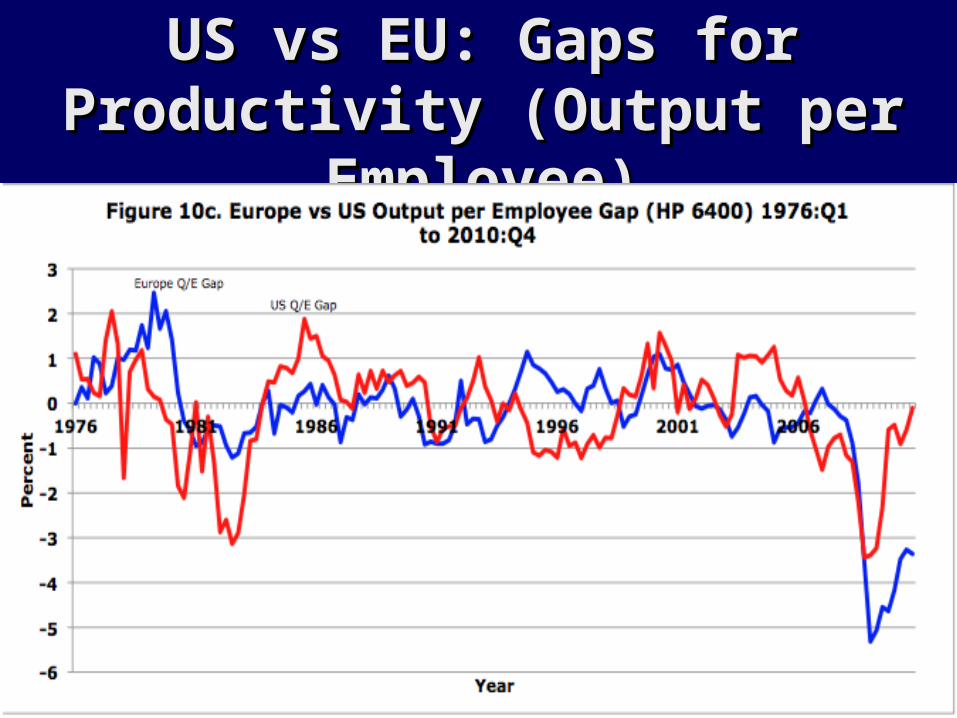
US vs EU: Gaps for Productivity US vs EU: Gaps for Productivity (Output per Employee)(Output per Employee)

Overall Differences in US and Europe Graphs
In EU, employment tends to respond less than in the U.S. to output changes in the late half of the data (1994-2010)
Difficult to analyze differences before 1994, because both output and employment were more volatile in the US than in the EU during the first 10 years of the data (1976-1986)

Regression Analysis Europe vs. Regression Analysis Europe vs. US, 1977-2010US, 1977-2010
Dependent variables: labor (E/N), productivity (Y/E)Dependent variables: labor (E/N), productivity (Y/E) Independent variables:Independent variables:
– 4 lags of dependent variable4 lags of dependent variable– Current value and 4 lags of outputCurrent value and 4 lags of output– Error correction termError correction term
Measures of productivity and labor are different from full US Measures of productivity and labor are different from full US regression (Y/H and H/N respectively). Because we expect regression (Y/H and H/N respectively). Because we expect procyclical fluctuation in hours per employee, the long-run US procyclical fluctuation in hours per employee, the long-run US response of employment to output changes in the comparative response of employment to output changes in the comparative regression should be lower than in the full regression.regression should be lower than in the full regression.
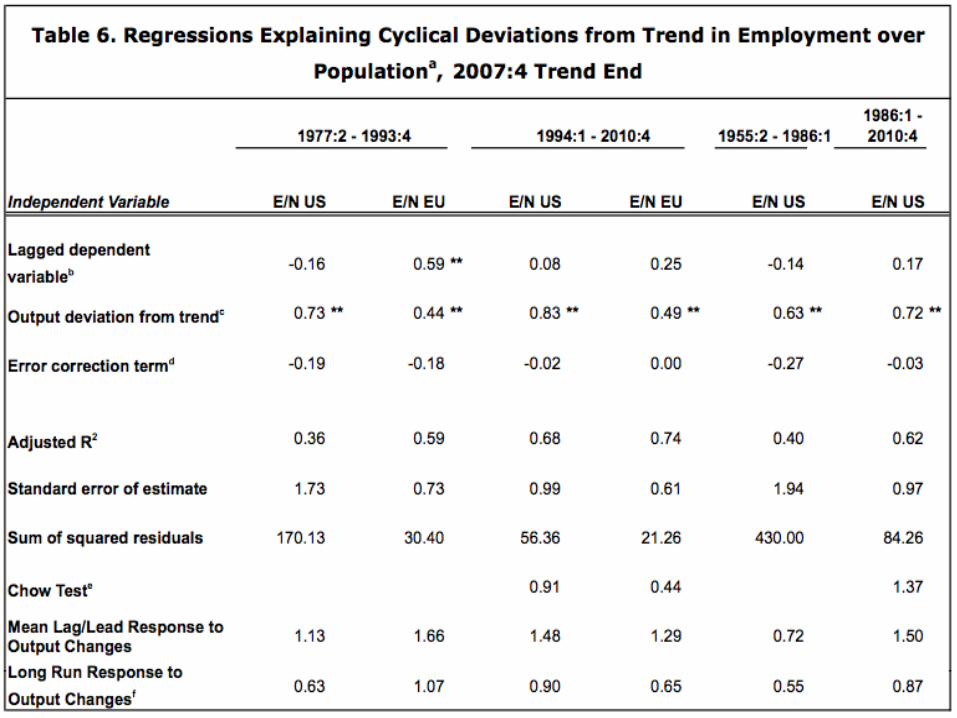
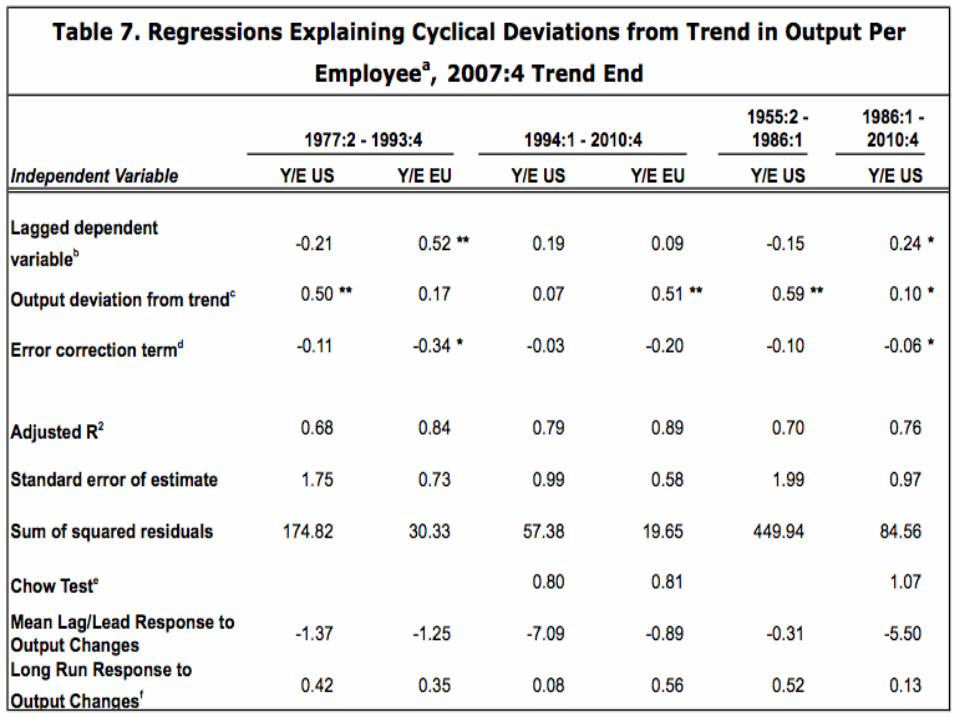
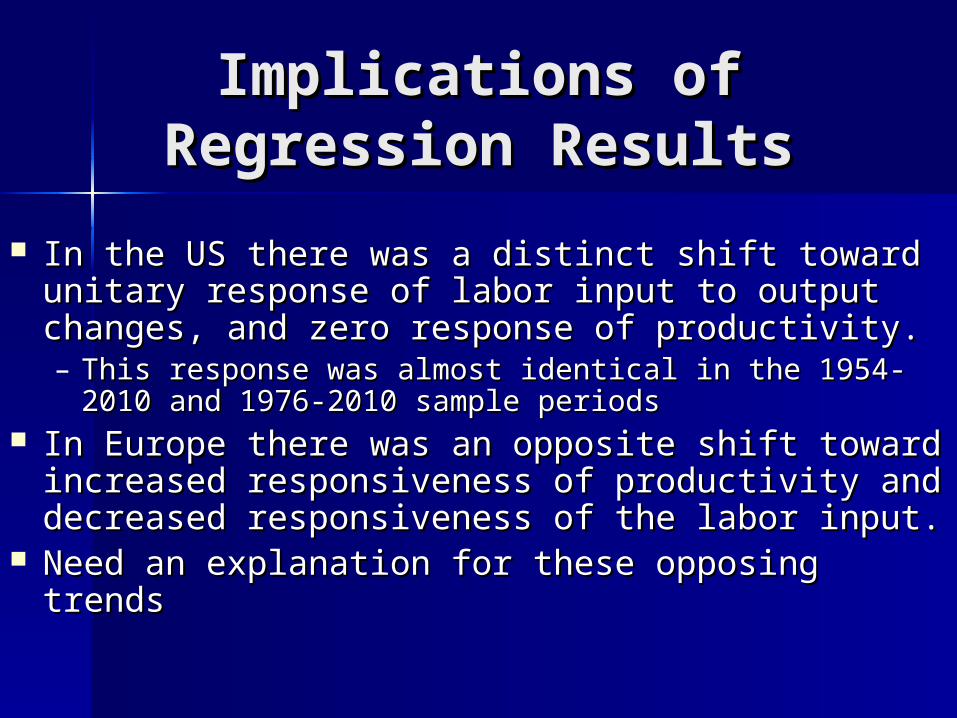
Implications of Regression Implications of Regression ResultsResults
In the US there was a distinct shift toward unitary In the US there was a distinct shift toward unitary response of labor input to output changes, and zero response of labor input to output changes, and zero response of productivity.response of productivity.– This response was almost identical in the 1954-2010 and This response was almost identical in the 1954-2010 and
1976-2010 sample periods1976-2010 sample periods In Europe there was an opposite shift toward In Europe there was an opposite shift toward
increased responsiveness of productivity and increased responsiveness of productivity and decreased responsiveness of the labor input.decreased responsiveness of the labor input.
Need an explanation for these opposing trendsNeed an explanation for these opposing trends

Unified Explanatory Hypothesis:“American Exceptionalism”
Joint explanation of changes in American and European behavior
American shifts toward greater labor response explained by “disposable worker” hypothesis
Europe’s opposite shift explained by the absence of the conditions of the “disposable worker” idea and by differing institutions and policies that promote work sharing.
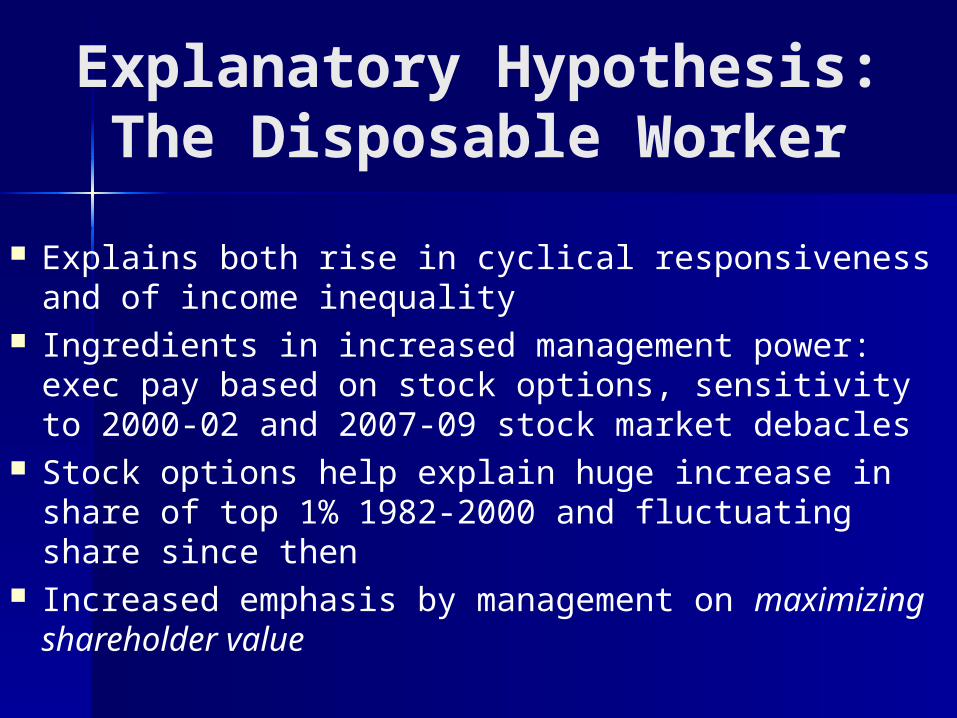
Explanatory Hypothesis:The Disposable Worker
Explains both rise in cyclical responsiveness and of income inequality
Ingredients in increased management power: exec pay based on stock options, sensitivity to 2000-02 and 2007-09 stock market debacles
Stock options help explain huge increase in share of top 1% 1982-2000 and fluctuating share since then
Increased emphasis by management on maximizing shareholder value

Not just Strong Management, Weak Workers
Contributions of weak labor bargaining power the same list as the sources of increased income inequality in the bottom 90 percent
Lower real minimum wage, reduced penetration of unions in the private sector, more imports, more low-skilled immigration
Explanations for EU BehaviorExplanations for EU Behavior
Three broad differences between the Three broad differences between the US and Europe offer a point of US and Europe offer a point of departure for developing explanations:departure for developing explanations:1) Different evolution of inequality1) Different evolution of inequality2) Longstanding European regulations that 2) Longstanding European regulations that
protect employmentprotect employment3) Explicit European institutions 3) Explicit European institutions
encouraging work-sharing and reducing encouraging work-sharing and reducing hours, both in the long run and during a hours, both in the long run and during a cyclical downturncyclical downturn

Differences in InequalityDifferences in Inequality
The U.S. exhibited a move toward maximizing shareholder value and cost-cutting. This move has the same causes as the increasing income inequality in the U.S. as compared to Europe.
Factors leading to lower European inequality and lower responsiveness of labor to output:– Smaller role of short-term profit maximization in management– Greater power of unions– Corporatist tradition: unions join with management in making
decisions that ultimately effect labor responsiveness (Obviously this differs across different nations within the EU-15)

Income share of top 0.1% in the US quadrupled from 2 to 8 percent between 1975 and 2000.
Top share in France has remained remarkably stable, increase in U.K. has been relatively moderate compared to U.S.
Gini Coefficients: EU Average = 0.31, US = 0.45 Cultural customs and institutions (e.g. traditional role of labor of
German corporate boards) play a large role in determining inequality. US unions have very little influence over management, leading to
decisions that can cut jobs and make labor much more responsive to output swings
Differences in Inequality (cont.)Differences in Inequality (cont.)
Pre-1980, EU had consistently lower unemployment than US After 1980 EU Governments enacted policies that reduced
employment per capita to deal with the hardships of higher unemployment
Employment Protection Legislation (EPL) – An attempt by EU governments directly to regulate layoffs– Outright bans as well as mandated severance packages. This helps to explain
the shift toward less elasticity in the response of labor to output swings in Europe.
– Timing question: EPL reached its peak in the early 1990s
Backlash against EPL: After 1995 several EU countries introduced a flexible second tier of employment
Employment Protection Employment Protection LegislationLegislation

Legislation and policies by EU countries since 1985 aimed at cutting work hours instead of firing employees– Sweden: reduction in hours is aimed at providing parental leave to
parents of both genders
– Netherlands: shift to part-time work to accommodate the cultural norm that mothers should not work full time
– Germany: hours reductions have been achieved through corporatist negotiations between employers and unions
– France: switched to a compulsory 35-hour work week
Work SharingWork Sharing

Work sharing in Europe represents a link to the responsiveness of labor input – shows that European countries view hours as
an adjustment mechanism to respond to output changes, while US cost-cutting most often takes the form of layoffs
– Further exploration of this requires data on aggregate hours
Work Sharing (cont.)Work Sharing (cont.)

US Changes after 1986US Changes after 1986– OkunOkun’’s Law is Deads Law is Dead– Procyclical productivity innovations are deadProcyclical productivity innovations are dead– RBC model and RBC model and ““technology shockstechnology shocks”” are no longer are no longer
relevant as core determinants of business cyclesrelevant as core determinants of business cycles– ““Technology shock” paradigm represents an arbitrary Technology shock” paradigm represents an arbitrary
exclusion restriction on 10 or 12 other important exclusion restriction on 10 or 12 other important causes of output fluctuatioscauses of output fluctuatios
Europe Europe – Comparisons are tentative under the absence of Comparisons are tentative under the absence of
quarterly hours and labor force seriesquarterly hours and labor force series– Analysis shows that trends in responsiveness of labor Analysis shows that trends in responsiveness of labor
and productivity have been opposite in Europe and the and productivity have been opposite in Europe and the U.S.U.S.
Conclusions for MacroConclusions for Macro
Much remains to be accomplished in this line Much remains to be accomplished in this line of investigation.of investigation.
Need a data series on European aggregate Need a data series on European aggregate hourshours– Makeshift solutions: (a) look just at annual hours, Makeshift solutions: (a) look just at annual hours,
(b) look at quarterly, available only 2000-2010(b) look at quarterly, available only 2000-2010 Need to recognize differences among EU Need to recognize differences among EU
countriescountries– Could split Europe between AU-GE-NL vs. the others Could split Europe between AU-GE-NL vs. the others
and/or between northern and southern Europeand/or between northern and southern Europe
Further ResearchFurther Research