road statistics final 24-10 - erf.be · pkm passenger-kilometre ptw powered two-wheelers ten-t...
TRANSCRIPT

YEARBOOK 2017
ROAD STATISTICS

European Union Road FederationPlace Stéphanie 6/BB-1050 Brussels • BelgiumT. +(32) 2 644 58 77www.erf.be
Gold members Silver member

YEARBOOK 2017ROAD STATISTICS

INTRODUCTION
4

The ERF is pleased to present you with the ‘ERF Road Statistics Yearbook 2017’.This new edition contains important updat-ed information on road transport sector and road infrastructure in Europe and beyond.More than ever, the road infrastructure is an essential key element of the global mobility and the road sector is constantly striving to provide citizens with the accessi-ble, e�cient and safe mobility they deserve.We are convinced that this Yearbook will provide you with the same interesting and fruitful information as the previous editions.
5

Infrastructure Financing
Road Maintenance & Investment
Freight Transport
3.
4.
5.Road Network
General Data
1.
2.
CONTENTS
6

Passenger Transport
Safety
Taxation
Environment
Case Studies
6.
7.
8.
9.10.
7

General data
1.1 Percentage of turnover by mode of transport in EU 28 1.2 Transport growth in EU 28 1.3 Annual growth rates EU 28 1.4 Employment by mode of transport in EU countries 1.5 Employment by mode of transport in EU 28
Road Network
2.1 Length of total road network by category by country 2.2 Length of total road network by country 2.3 Density of the total road network by country 2.4 Length of motorway network by country 2.5 Length and Type of TEN-T Roads in EU 28 2.6 Proportion of motorways compared to the total road network by country 2.7 Density of motorways by country 2.8 Passenger cars per km of motorway by country 2.9 Transport network comparison between EU 28, USA, Japan, Russia and China 2.10 Density of motorways: comparison between EU 28, USA, Japan, Russia and China
Infrastructure Financing
3.1 Toll net revenues in selected countries 3.2 Budget managed by INEA 3.3 European Investment Bank Loans for Transport to EU 28 3.4 European Investment Bank Loans for Transport to EU 28 3.5 World Bank Total Transport Lending 3.6 Transport Lending Breakdown by Region
Road Maintenance and Investment
4.1 Gross investment spending in road infrastructure in selected countries 4.2 Investment in inland transport infrastructure in EU 28 4.3 Volume of investment in inland transport infrastructure by region 4.4 Distribution of infrastructure investment between modes in EU 28 4.5 Maintenance expenditures in road infrastructure in selected countries 4.6 Maintenance expenditures in road infrastructure in selected countries
Freight Transport
5.1 Transport of goods, performance by mode in EU 28 5.2 Goods transport by mode in EU 28 5.3 Inland transport modal split in EU 28 5.4 Inland transport modal split in EU 28 5.5 Performance of inland freight transport by mode in EU countries 5.6 Performance by mode for inland freight transport in EU 28 5.7 Total road transport by group of goods in EU countries 5.8 Transport of dangerous goods in EU countries 5.9 Registration of commercial vehicles in EU and selected countries
Introduction
Contents
Symbols & Abbreviations
p.12
p.18
p.26
p.32
p.38
8

Passenger Transport
6.1 Transport of passengers by mode in EU 28 6.2 Evolution of passenger transport by mode in EU 28 6.3 Passenger transport modal split in EU 28 6.4 Modal split of passenger transport on land by country in EU countries 6.5 Passenger vehicles by country 6.6 Motorisation by country, 2014 6.7 New passenger car registration per 1.000 inhabitants in EU countries 6.8 Motorcycle registrations in EU countries 6.9 Transport of passengers per mode: comparison EU 28/World 6.10 Motorisation: comparison EU 28/ World 6.11 Trends and outlooks in passenger transport demand for the di�erent modes of transport in EU
Safety
7.1 Road accidents involving personal injury by country 7.2 Road accidents involving personal injury per one thousand population in EU countries 7.3 Road fatalities in EU countries 7.4 Percentage change in road fatalities between 2002 and 2015 7.5 Road fatalities country rankings 7.6 Lives saved per million inhabitants in EU countries in 2015 7.7 Evolution of road fatalities and injured in EU 28 7.8 Road fatalities by mode of transport in EU 28 7.9 PTWs fatalities in selected EU countries 7.10 Road fatalities by gender in EU countries 7.11 Road fatalities by age group in EU-28 and selected countries 7.12 Road Fatalities (per 100.000 population) in EU 28 and selected countries 7.13 Speed limits, blood alcohol limits by country 7.14 Fatalities at 30 days by road user type in EU countries
Taxation
8.1 Taxes on acquisition of motor vehicles in EU countries 8.2 Fiscal income from motor vehicles in EU selected countries 8.3 Revenues from environmentally related taxes in % of GDP 8.4 CO2 based motor vehicle taxes in EU countries 8.5 Excise duties on fuels in EU countries at 1-1-2015 & 1-1-2017 8.6 At the pump prices of petroleum in EU countries, first quarter of 2017 8.7 Net charges per domestic haul by type in EU countries
Environment
9.1 Comparison between freight and passenger transport evolution and CO2 emissions in EU 28 9.2 CO2 emissions from road transport in EU and selected countries 9.3 CO2 emissions from road passenger transport by mode in EU and selected countries 9.4 CO2 emissions from road freight transport in EU and selected countries 9.5 Average CO2 emissions per km from new passenger cars in EU 9.6 Fuel market share for new car registrations in EU 9.7 Biodiesel production in EU countries 9.8 Biofuels share in transport consumption in EU 9.9 Share of total CO2 emmissions from fossil fuel by sector in EU 9.10 Final energy consumption by sector in EU countries
10. Case Study: Roads in Ethiopia
p.46
p.56
p.70
p.77
p.85
9

SYMBOLS AND ABBREVIATIONS
10

AT Austria BE Belgium DE Germany DK Denmark EL Greece ES Spain FI Finland FR France IE Ireland IT Italy LU Luxembourg NL The Netherlands PT Portugal SE Sweden UK United Kingdom BG Bulgaria CY Cyprus CZ Czech Republic EE Estonia HR Croatia HU Hungary LT Lithuania LV Latvia MT Malta PL Poland RO Romania SI Slovenia SK Slovakia
AL Albania ME Montenegro MK Former Yugoslav Republic of Macedonia TR Turkey RS Republic of Serbia IS Iceland LI Liechtenstein NO Norway CH Switzerland AU Australia CA Canada CL Chile IL Israel JP Japan KP Korea MX Mexico NZ New Zealand US United States RF Russian Federation ACEA European Automobile Manufacturers Association ACEM European Association of Motorcycle Manufacturers ASECAP European Association of tolled motorways, bridges and tunnel operators Bn Billion (thousand million) CARE European Road Accident Database CORDIS Community Research and Development Information Service EBB European Biodiesel Board EC European Commission EEA European Environment Agency EIB European Investment Bank EU European Union EUR Euro GDP Gross Domestic Product g Gram INEA Innovation and Networks Executive Agency IRTAD International Road Tra�c and Accident Database ITF International Transport Forum n.a. Not available data OECD Organisation for Economic Co-operation and Development pkm Passenger-kilometre PTW Powered Two-Wheelers TEN-T Trans- European Transport Network tkm Tonne-kilometre toe Tonne of oil equivalent
EU-28
EU-candidates
EFTA EEA
OtherCountries
Other abbreviations
11

12

GENERAL DATA
13

Postal and courier activities
Warehousing and support activities
Air transport Sea transport
Inland water transport
Pipelines
Railways
Road passenger transport (*)
Road freight transport
(%)EU 28
Percentage of turnover by mode of transport in EU 28, 2013 (total €1,373 billion)
Source : EC (*) Including all urban and suburban land transport modes (motor bus, tramway, streetcar, trolley bus, under-ground and elevated railways). The above figures refer to employment only in those companies whose main activity lies in the mode concerned.
35,4%22,7%
5,3%
1,2%
0,5%
7,7
9,1%
10,1%
8%
1.1
14

Transport growth in EU 28, evolution 1995-2014
1.2
Annual growth rates EU 28 (% change) 1.3
Source: Eurostat Notes : (1) : passenger cars, powered two-wheelers, buses & coaches, tram & metro, railways, intra-EU air, intra-EU sea (2) : road, rail, inland waterways, oil pipelines, intra-EU air, intra-EU sea GDP: at constant year 2005 prices and exchange rates
Source : EC
GDP at year 2005 prices and exchange rates
Passenger transport (pkm)
Freight transport(tkm)
1,6% 1,2% 1,4%
1,1% 0,7% 1,8%
1,1% 0,6% 1,4%
1995 - 2014 p.a.
2000 - 2014 p.a.
2013 - 2014 p.a.
15
90
120
150
140
130
100
110
19951996
19971998
19992000
20012002
20032004
20052006
20072008
20092010 2011
20122013
2014
Goods (2) (tkm)GDP (at constant year 2005 prices)
Passengers (1) (pkm)

Employment by mode of transport in EU countries, 2013 (thousand)
1.4
215,0155,5262,9147,3
2062,437,879,9166,6824,61378,5
77,21059,7
17,974,9
108,719,8
216,39,9
409,0206,8720,8147,8337,543,4121,9148,0270,01205,1
59,955,7113,932,8
409,915,119,834,8
305,8351,820,1
304,91,9
23,952,87,665,11,1
113,557,9
293,658,8113,820,438,945,575,9
242,5
18,332,537,523,3
385,33,816,067,4174,0256,710,5
166,83,1
13,014,85,0
48,01,8
60,055,5131,733,278,45,1
18,033,068,8
229,9
1,910,927,86,7
48,11,72,91,0
13,8169,4
4,241,10,03,7
10,81,011,60,0
20,011,5
55,30,631,70,712,98,610,359,6
0,10,30,60,13,30,00,00,22,04,90,52,20,00,20,00,00,90,00,10,53,60,16,60,60,90,20,00,9
1,00,70,60,28,10,10,00,00,42,30,32,50,00,10,10,30,90,013,80,51,30,62,20,30,50,61,51,1
1,81,60,021,121,30,80,713,26,413,14,1
25,61,90,81,40,00,01,1
12,80,01,90,70,40,20,08,213,312,4
5,32,02,59,2
57,80,39,52,4
28,865,02,8
22,01,01,30,51,20,90,625,16,65,1
10,74,00,60,34,79,071,0
90,232,239,030,6625,712,414,435,6
209,9259,322,9
333,68,7
26,219,53,4
52,34,3
85,349,5130,128,560,68,2
34,629,348,3341,2
36,419,541,023,5
502,93,616,612,083,5
256,011,7
161,01,35,68,71,3
36,51,0
78,424,998,214,639,87,315,921,942,8
246,5
EU-28EU-15EU-13
BEBGCZDKDEEEIEELESFRHRIT
CYLVLTLUHUMTNLATPLPTROSISKFISEUK
EU-28EU-15EU-13
BEBGCZDKDEEEIEELESFRHRIT
CYLVLTLUHUMTNLATPLPTROSISKFISEUK
10521,3 2938,0 1991,4 559,6 28,5 40,3 164,8 350,2 2635,8 1812,6 8336,7 2121,6 1593,1 388,3 14,4 33,0 150,6 328,4 2184,8 1522,3 2184,6 816,4 398,3 171,3 14,1 7,3 14,2 21,8 451,0 290,3
Total
Road Roadpassenger
transport (**) Railways PipelinesInland water
transportSea
transportAir
transport
Warehousing and support
activities
Postal and courier activities
freight transport
Source: EurostatNotes: (*) Data refers to transportation and storage activities (including postal and courier services). (**) Including all urban and suburban land transport modes (motor bus, tramway, streetcar, trolley bus, under-ground and elevated railways)The above figures refer to employment only in those companies whose main activity lies in the mode concerned.
16

Employment by mode of transport in EU 28, 2013 (%)
1.5
Source: Eurostat Notes: (*) Including all urban and suburban land transport modes (motor bus, tramway, streetcar, trolley bus, under-ground and elevated railways) The above figures refer to employment only in those companies whose main activity lies in the mode concerned.
Postal and Courier activities
Warehousing and support activities
Air transport
Sea transport
Inland watertransport
Pipelines
Railways
Road passenger transport (*)
Road freight transport
27,9%
25,1%
18,9%
17,2%
5,3%
3,3% 1,6%0,4%0,3%
17

18

ROAD NETWORK
19

Length of total road network by category(*) by country, end of 2013 (km) 2.1
20
BEBGCZDKDEEEIEELESFRHRITCYLVLTLUHUMTNLATPLPTROSISKFISEUK
EU28
MEMKRSTRISNOCH
BEBGCZDKDEEEIEELESFRHRITCYLVLTLUHUMTNLATPLPTROSISKFISEUK
EU28
MEMKRSTRISNOCH
1 763 605 7761 21612 917 140 8971 55814 98111 5521 2956 751 257- 309 1521 767-2 6781 7191 4823 065 644 770 420 8102 0573 760
74340,8
- 259 6032 127 11 3921 419
13 2292 9756 2502 64639 3893 8734 5319 29915 0419 6586 71119 9202 2031 6746 372 8376 82423612 5649 99717 8046 45417 110 8193 53812 52113 55349 074
287227,4
7 965 6514 79431 3414 91910 562 393
1 3494 03548 73670268178 07112 47611 63130 864135 340377 3239 720154 9482 3075 38814 5731 891 23 1692 361 7 74923 640153 7534 79135 5875 13513 99613 56182 90533 111
1456316,7
7 9653 77810 34132 1552 95044 38217 926
138 86912 06374 91970 268
42 29878 95875 600501 053673 2909 09474 4204 99863 38151 3371 891171 5492 361 125 65088 759242 083
32 19032 15036 85251 201118 461335 182
3034357,5
7 9659 47129 271323 0435 01039 04151 789
155 210 19 678 130 680 74 130 230 377 58 787 96 017 117 321 666 4151 071 823 26 820 256 039 9 765 70 443 72 591 2 880 203 310 2 361 138 641 124 115 415 122 14 310 85 531 38 874 54 806 78 093 216 976 421 127
4 852 242
7 965 14 159 45 009 388 666 12 890 94 377 71 527
MotorwaysMain or
national roadsSecondary or regional roads Other roads* Total
Source: Eurostat, International Road Federation, national statistics Notes: The definition of road types varies from country to country, the data are therefore not comparable. "Other roads" sometimes includes roads without a hard surface. BE end of 2009 EL end of 2010 UK 1st of April 2014 IS end of 2011 MT end of 2012

Length of total road network by country, 2013 (thousand km)
2.2
Source: EC, IRF Notes: "Other roads" sometimes includes roads without a hard surface. BE end of 2009 EL end of 2010 UK 1st April,2014 IS end of 2011 MT end of 2012
Density of the total road network by country, 2013 (km road/ km² land area) 2.3
Source: EC Notes: The definition of road types varies from country to country, the data are therefore not comparable. "Other roads" sometimes includes roads without a hard surface. BE end of 2009 EL end of 2010 UK 1st April,2014 IS end of 2011 MT end of 2012
21
0
200
400
600
800
1000
1200
CHNOISTRRSMKMEUKSEFISKSIROPTPLATNLMTHULULTLVCYITHRFRESELIEEEDEDKCZBGBE
0
1
2
3
4
5
6
7
8
CHNOISTRRSMKMEUKSEFISKSIROPTPLATNLMTHULULTLVCYITHRFRESELIEEEDEDKCZBGBE
1071
,82
7,5

0
3000
6000
9000
12000
15000
CHNOISTRRSMKUKSEFISKSIROPTPLATNLMTHULULTLVCYITHRFRESELIEEEDEDKCZBGBE
Length of motorway network by country, 2013 (km)
2.4
Notes: BE end of 2009 EL end of 2010 UK 1st April,2014IS end of 2011MT end of 2012
Length (Km) and Type of TEN-T* Roads in EU 282.5
Source: EC * The Guidelines define the TEN-T roads as composed of motorways and high-quality roads – existing, new or to be adapted
CHNOISTRRSMKUKSEFISKSIROPTPLATNLMTHULULTLVCYITHRFRESELIEEEDEDKCZBGBE
1498
1
22
0
20000
40000
60000
80000
100000
120000 Total
Motorways
High quality roads
Ordinary Roads

Proportion of motorways compared to the total road network by country, 2013 (%)
2.6
Source: EC Notes: "Other roads" sometimes includes roads without a hard surface. BE end of 2009 IS end of 2011 MT end of 2012
0
5
10
15
20
25
CHNOISTRRSMKUKSEFISKSIROPTPLATNLMTHULULTLVCYITHRFRESELIEEEDEDKCZBGBE
Density of motorways by country, 2013 (km motorway per 100 km² land area)
2.7
Source: Eurostat, EC BE end of 2009 EL end of 2010 UK 1st April,2014 IS end of 2011 MT end of 2012
0
1
2
3
4
5
6
7
8
CHNOISTRRSMKMEEU UKSEFISKSIROPTPLATNLMTHULULTLVCYITHRFRESELIEEEDEDKCZBGBE
21,4
2 %
6,40
23

Passenger cars per km of motorway by country, 20142.8
Source: Eurostat, EC, UNECE statistical database Notes: Stock at end of year, except for BE: 1 August (1 July in 2012), CH: 30 September Taxis are usually included.
Transport network comparison between EU 28, USA, Japan, Russia and China, 2013 (thousand km)
2.9
Source: Eurostat, International Road Federation, Union Internationale des Chemins de Fer, national statistics Notes: (1): Divided highways with 4 or more lanes (rural or urban interstate, freeways, expressways, arterial and collec-tor) with full access control by the authorities. (2): Japan: national expressways. (3): Russia: federal roads. (4): USA: a sum of partly overlapping networks. (5): China: both oil and gas pipelines (6): Russia: only crude oil pipelines. 20 thousand km of oil products pipelines are not included. (7): USA: light duty vehicles, short wheel and long wheel base. (8): Japan: including 31.8 million light motor vehicles (engine capacity up to 660 cubic centimetres).
0
5000
10000
15000
20000
CHNOISTRRSMKMEALUKSEFISKSIROPTPLATNLMTHULULTLVCYITHRFRESELIEEEDEDKCZBGBE
Road network (paved)Motorway networkRailway networkElectrified rail lines
EU 28
5.00074,3220,0115,2
USA (1)
4.31093,3205,6
Japan (2)
9898,419,511,7
China
3.756104,4103,136,0
Russia
1.09451,086,043,0
1976
9
24

0 200 400 600 800 1000
Russia
China
Japan
USA
EU 28
Density of motorways: comparison between EU 28, USA, Japan, Russia and China, 2013 (km motorway per km² land area)
2.10
Source: EC, IRF Area EU 28: including French overseas department
Passenger cars per km of motorway comparison between EU 28, USA, Japan, Russia and China, 2014
2.11
Source: EC, IRF (1) USA: data are from 2009
0,0 0,5 1,0 1,5 2,0 2,5
Russia
China
Japan
USA
EU 28
2,22
812
Source: EC, IRF Area EU 28: including French overseas department
25

26

INFRASTRUCTURE FINANCING
27

28
Toll net revenues in selected countries, 2010-2015 (EUR million)
3.1
DK
EL
ES
FR
IE
IT
NL
AT
PT
HU
SI
NO
HR
PL
UK
RS
CZ
DE
RF
SK
DK
EL
ES
FR
IE
IT
NL
AT
PT
HU
SI
NO
HR
PL
UK
RS
CZ
DE
RF
SK
2010 2011 2012 2013
Source: ASECAP Notes: (1) Provisional figure (2) Preliminary value for 2013 (3) Toll revenues on motorways A2 and A4 (4) km-based tolling only (5) Revenue from ETC and the revenue from the vignette on the whole charged network including motorways, expressways and selected 1st class roads
454,00
565,00
1820,56
7775,6
184,00
4835,90
27,21
1535,50
725,31
145,50
290,10
457,30
267,40
189,3
70,1
137,9
262,8
4484,00
-
175,3
472,00
530,00
1808,7
8442,6
184,00
4971,00
28,49
1561,00
693,43
167,90
298,34
605,70
272,34
148,25
64,40
137,90
325,00
4498,00
-
199,88
492,0
516,0
1623,8
8450,0
193,0
4804,5
26,8
1622,1
627,8
167,9
294,9
641,2
282,8
157,0
71,6
19,0
346,5
4364,0
-
151,3
507,0
516,0
1565,0
9170 (1)
200,0
4914,0
26,5
1687,0
812,5
189,2
305,0
614,4
296,69 (2)
179,6 (3)
77,6
138,3
342,2 (4)
4400,0
29,3
158,63 (5)
537
469
1608,6
9222,4
217
5176,94
27,67
1826
855,37
677,6
344,16
940,63
297,05
185,86
83,3
138,44
316
4460
75,16
113,7
559
495
1709,27
9160
217
5454,86
28,3
1840
915,62
677,6
349,92
940,63
317,25
209
102
139,55
360,18
4370
55,5
119,6
2014 2015

Budget managed by INEA (Total 34 bn)
3.2
Source: EC
European Investment Bank Loans for Transport to EU 28, 2006-2015 (EUR million)
3.3
Source: EC
0
5
10
15
20
25
EnergyTransportDigitalEnergyTransport
Roads, Motorways
Railways
Urban Transport
Air Transport
Maritime Transport
Intermodal Freight Terminals and Other
Transport
Total Transport Sector
4384
2999
1294
764
593
36
10.070
3542
3534
1924
644
454
29
10.127
4932
2495
1981
2458
894
763
13.523
6030
2704
3399
1740
1.821
n.a.
15.694
3716
4352
4151
487
496
2
13.204
3876
4624
4411
500
793
66
14.270
2726
3541
2655
261
863
28
10.074
4728
3419
2733
420
212
81
11.593
5384
3875
2865
428
368
45
12.965
2827
5548
3371
18
586
15
60
12.425
Connecting Europe Facility Horizon 2020
22,4
29
2010 2011 2012 20132006 2007 2008 2009 2014 2015

European Investment Bank Loans for Transport to EU 28, 2015 (total € 12.425 million)
3.4
Intermodal Freight Terminals and Other Maritime Transport
Urban Transport
Railways
Roads, Motorways
45%
27% 23%5%
Air Transport
1%
0,14%
30Source: EIB

World Bank Total Transport Lending, 2004-2016 ($ billion)
3.5
Transport Lending Breakdown by Region, 2016 (total $ 6,39 billion)
3.6
Source: World Bank
Source: World Bank
0
2
4
6
8
10
South Asia
Europe & Central Asia
Middle East & North Africa
Latin America and the Caribbean
East Asia & the Pacific
Africa
9 2004
20052006
20072008
20102010
20112012
20132014
20152016
32%20%
17%
12% 10%
8%
31

32

ROAD MAINTENANCE AND INVESTMENT
33
34
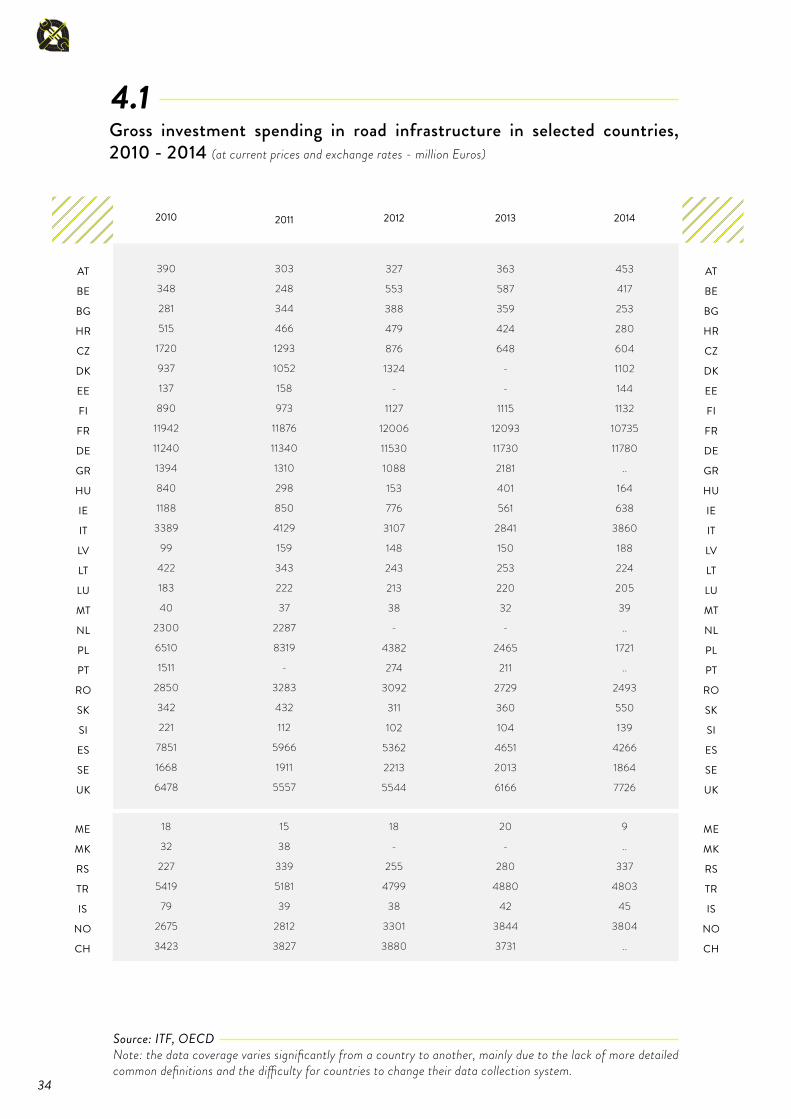
Gross investment spending in road infrastructure in selected countries, 2010 - 2014 (at current prices and exchange rates - million Euros)
4.1
AT
BE
BG
HR
CZ
DK
EE
FI
FR
DE
GR
HU
IE
IT
LV
LT
LU
MT
NL
PL
PT
RO
SK
SI
ES
SE
UK
2010 2011 2012 2013
Source: ITF, OECD Note: the data coverage varies significantly from a country to another, mainly due to the lack of more detailed common definitions and the di�culty for countries to change their data collection system.
390
348
281
515
1720
937
137
890
11942
11240
1394
840
1188
3389
99
422
183
40
2300
6510
1511
2850
342
221
7851
1668
6478
303
248
344
466
1293
1052
158
973
11876
11340
1310
298
850
4129
159
343
222
37
2287
8319
-
3283
432
112
5966
1911
5557
327
553
388
479
876
1324
-
1127
12006
11530
1088
153
776
3107
148
243
213
38
-
4382
274
3092
311
102
5362
2213
5544
363
587
359
424
648
-
-
1115
12093
11730
2181
401
561
2841
150
253
220
32
-
2465
211
2729
360
104
4651
2013
6166
453
417
253
280
604
1102
144
1132
10735
11780
..
164
638
3860
188
224
205
39
..
1721
..
2493
550
139
4266
1864
7726
2014
ME
MK
RS
TR
IS
NO
CH
AT
BE
BG
HR
CZ
DK
EE
FI
FR
DE
GR
HU
IE
IT
LV
LT
LU
MT
NL
PL
PT
RO
SK
SI
ES
SE
UK
ME
MK
RS
TR
IS
NO
CH
18
32
227
5419
79
2675
3423
15
38
339
5181
39
2812
3827
18
-
255
4799
38
3301
3880
20
-
280
4880
42
3844
3731
9
..
337
4803
45
3804
..

Investment in inland transport infrastructure in EU 28, 2014 (as a percentage of GDP, at current prices)
Source: ITF at the OECD Note: No data for CY
0
0,5
1
1,5
2
2.5
UKSEESSISKROPTPLNLMTLULTLVITIEHUELDEFRFIEEDKCZHRBGBEAT
2,10
0
2E+10
4E+10
6E+10
8E+10
1E+11
1.2E+11
1.4E+11
EU
North America
Russian Federa�on
1995 1996 1997 1998 1999 2000 2001 2002 2003 2004 2005 2006 2007 2008 2009 2010 2011 2012 2013 2014
35
4.2
Volume of investment in inland transport infrastructure by region, 1995 - 2014 (Euro)
Source: ITFThe drop in North America is due to non existing data for United States after 2004
4.3

36
Distribution of infrastructure investment between modes in EU 28, 1995-2014 (Euros, current prices, current exchange rates)
Source: ITFNote: No data for CY
4.4
Maintenance expenditures in road infrastructure in selected countries, 2010-2014 (at current prices and exchange rates - million Euros)
Source: ITF
4.5
2010 2011 2012 2013 2014
ATBEBGHRCZDKEEFIFRHUIEITLVLTLUMTNLPLPTROSKSISEUK
Total EU MKRSTRIS
NOCH
ATBEBGHRCZDKEEFIFRHUIEITLVLTLUMTNLPLPTROSKSISEUK
Total EU MKRSTRIS
NOCH
559 184 100 195 670
1.058 38
667 2.431 328 164
6.437 85 160 34 25
1.209 2.636
102
175 137 875
3.919 22.188
16 228 360 29
1.361 2.001
494 156 71
212 570 881 39
658 2.746 256 161
6.220 90 153 37 27
323 2.678
160 122 856
3.552 20.462
15 205 674 29
1.615 2.238
517 145 103 187 571 945 44 574
2.851 296 139
7.195 93 123 34 24
428 165
193 120 959
3.591 19.295
208 600 29
1.747 2.414
559 147 96
209 513 920 47
585 2.904
412 128
9.134 100 127 41 25
438 174
204 123
1.044 3.346 21.276
129 630 28
1.841 2.402
667 206 93
257 587 796 45
506 2.760
357 85
9.564 154 143 41 17 ..
383 .. ..
181 118
1.017 3229,13 21.206
..142,98582,14
321997,63
..
0%10%20%30%40%50%60%70%80%90%
100%
1995 1996 1997 1998 1999 2000 2001 2002 2003 2004 2005 2006 2007 2008 2009 2010 2011 2012 2013 2014
Rail
Road
IWW

37
Maintenance expenditures in road infrastructure in selected countries, 2002 - 2014 (million Euros)
Source: ITFNote: No data for CY
4.6
0
5000
10000
15000
20000
25000
30000
350002006
31301,8
200527430,12004
23471,62003
22325,6
200216275,6
200727960,3 2008
26791,6
200921536,9
201022188,4
201120462,4 2012
19295,1
201321275,6
201421206,3

38

FREIGHT TRANSPORT
39

40
Transport of goods, performance by mode in EU 28, 1995-2014 (billion tkm) 5.1
1995
1996
1997
1998
1999
2000
2001
2002
2003
2004
2005
2006
2007
2008
2009
2010
2011
2012
2013
2014
1995 -2014
2013-2014
1995
1996
1997
1998
1999
2000
2001
2002
2003
2004
2005
2006
2007
2008
2009
2010
2011
2012
2013
2014
1995 -2014
2013-2014
Road Rail Inland Water- ways
Pipe- lines
Source: EC Air and Sea: only domestic and intra-EU-28 transport; estimates for air and for sea (1995-2004) Road: national and international haulage by vehicles registered in the EU-28. (1) The time series for maritime transport performance has been revised, for the period from 2005 to 2014, by replacing previous estimates on port-to port distances with more accurate measurements by Eurostat. The time series from 1995 to 2004 has been recalibrated by DG MOVE in line with the new Eurostat figures to avoid break in series. The revision of tkm figures mainly concerns the calculation of distance travelled and not the tonnages transported by sea.
1 289
1 303
1 352
1 414
1 461
1 509
1 553
1 603
1 608
1 751
1 795
1 858
1 925
1 891
1 700
1 755
1 744
1 693
1 719
1 725
388
394
411
394
385
405
388
386
394
419
416
438
452
443
364
394
422
407
406
411
122
120
128
131
129
134
133
133
124
137
139
139
145
146
131
156
142
150
153
151
115
119
119
126
125
127
134
130
132
133
138
137
128
125
122
121
118
115
112
113
930
942
969
1 000
1 029
1 067
1 083
1 100
1 119
1 159
1 178
1 191
1 174
1 153
1 035
1 094
1 111
1 085
1 082
1 122
2
2
2
2
2
2
2
2
2
2
2
2
2
2
2
2
2
2
2
2
Sea (1) Air
2845, 948
2879, 110
2980, 161
3068, 126
3131, 013
3244, 912
3292, 283
3353, 314
3378, 221
3601, 139
3667, 082
3764, 233
3826, 497
3760, 470
3353, 069
3522, 114
3539, 859
3451, 158
3474, 050
3524, 416
Total
33,9%
0,4%
5,8%
1,1%
23,5%
-1,2%
-1,8%
1,0%
20,6%
3,8%
27,0%
0,0%
23,8%
1,4%

41
Goods transport by mode in EU 28, 2014 (% of tkm)
5.2
49%
31,8%
11,7%
1%
Source: ECNotes: Air and Sea: only domestic and intra-EU-28 transport; provisional estimates Road: national and international haulage by vehicles registered in the EU-28
5%
5% Roads
Sea
Rail
Inland waterway
Pipe-lines
Air

Inland transport modal split in EU 28, 2000-2014 (% of tkm)
5.3
Source: EC Notes: Road: national and international haulage by vehicles registered in the EU-28
2000
2001
2002
2003
2004
2005
2006
2007
2008
2009
2010
2011
2012
2013
2014
2000-2014
2000
2001
2002
2003
2004
2005
2006
2007
2008
2009
2010
2011
2012
2013
2014
2000-2014
69,4
70,3
71,2
71,2
71,7
72,2
72,3
72,6
72,6
73,4
72,4
71,9
71,6
71,9
71,9
3,6
18,6
17,6
17,1
17,5
17,2
16,7
17,0
17,1
17,0
15,7
16,2
17,4
17,2
17,0
17,1
-8,1
6,2
6,0
5,9
5,5
5,6
5,6
5,4
5,5
5,6
5,6
6,4
5,9
6,3
6,4
6,3
2,1
5,8
6,1
5,8
5,8
5,5
5,5
5,3
4,8
4,8
5,3
5,0
4,9
4,9
4,7
4,7
-19,5
Inland transport modal split in EU 28, 2014 (% of tkm)
5.4
Source: EC Notes: Road: national and international haulage by vehicles registered in the EU-28
Pipelines
Inland waterways
Rail
Road
71,9%
17,1%
6,3%4,7%
42
Latin America and the Caribbean
Road RailInland
waterways Pipelines

Source: EC 43
Performance of inland freight transport by mode in EU countries, 2014 (billion tkm)
5.5
Performance by mode for inland freight transport in EU 28, 1995-2014 (billion tkm)
5.6
Source: EC (*) National and international haulage by vehicles registered in the reporting country (including cross-trade and cabotage). Only haulage of heavy goods vehicles (usually > 3,5 tonnes load capacity) (**) For FI only shipborne transport (i.e. no floating) (***) Data are not harmonised and therefore not fully comparable; in most countries, only pipelines longer than 40km are included. DE: only crude oil (i.e. no refined petroleum products)
EU-28BEBGCZDKDEEEIEELESFRHRIT
CYLVLTLUHUMTNLATPLPTROSISKFISEUK
EU-28BEBGCZDKDEEEIEELESFRHRIT
CYLVLTLUHUMTNLATPLPTROSISKFISEUK
1725,5 31,827,954,116,2310,16,39,819,2
195,8165,2
9,4117,80,513,728,19,6
37,50,3
70,924,3
250,934,935,116,331,423,442,0143,2
410,8 7,33,414,62,5
112,63,30,10,310,832,22,1
20,1-
19,414,30,210,2
-6,2
20,550,12,412,34,18,89,621,322,1
150,9 10,55,10,0
-59,1
----
8,80,70,1--
0,00,31,8-
49,32,20,1-
11,8-
0,90,1-
0,2
112,9 1,60,62,12,417,5
--
0,29,011,11,1
9,6-
2,40,6
-2,8
-5,88,322,10,41,0-
4,5--
10,0
Road (*) RailwaysInland
Waterways (**)Pipelines (Oil)
(***)
0
500
1000
1500
2000
2500 Oil Pipeline
Inland Waterway
Rail
Road
19951996
19971998
19992000
20012002
20032004
20052006
20072008
20092010 2011
20122013
2014

Total road transport by group of goods in EU countries, 2015 (1.000 tonnes and million tkm)
5.7
Source: Eurostat
BEBGCZDKDEEEIEELESFRHRIT
CYLV
Thousandtonnes Million tkm
Thousandtonnes Million tkm
264.034161.567437.118181.232
3.031.32528.162
117.090420.0051.258.2611.796.755
66.503957.00614.40262.569
31.72932.29757.20015.500314.6776.2639.90019.764
209.390153.58010.439116.820
56314.690
BEBGCZDKDEEEIEELESFRHRIT
CYLVLTLUHUMTNLATPLPTROSISKFISEUK
EU 28
2.1249581.281760
12.9581634761.169
10.6268.158483
8.037181213386700997n.a.
1.342946
7.024973
1.704552228
1.4261.0649.017
73.946
1.6946841.567690
12.912172355
1.01011.7187.976501
7.358147227534839
1.0231.119933
8.778946
1.664724329
1.4231.2838.5831.02976.218
2.922885
1.869814
12.420146347
1.44612.2698.281455
6.942138315488454
1.2061.171927
9.1741.1581.623714364
1.9092.122
10.6821.333
82.574
2013 2014 2015
LTLUHUMTNLATPLPTROSISKFISEUK
58.60152.547198.744
:641.538351.068
1.264.960150.358198.82470.509147.225271.912422.891
1.667.627
26.4858.850
38.353:
68.90024.436260.71331.83539.02317.90933.54024.48841.502
158.924
TOTAL 14.292.833 1.767.770
Source: Eurostat *Total of dangerous goods includes: Explosives; Gases - compressed, liquified, dissolved under pressure; Flam-mable liquids and solids; Substances liable to spontaneous combustion; Substance emitting flammable gases (with water); Oxidising substances; Organic peroxides; Toxic substances; Substances liable to cause infections; Radioactive material; Corrosives; Miscellaneous dangerous substances.
Transport of dangerous goods* in EU countries, 2013-2015 (million tkm)
5.8
44

Registration of commercial vehicles in EU and selected countries, 2015-2016
5.9
Source: ACEA
ATBE DKHRCZDKEEFIFRDEELHUIEIT LVLTLUNLPLPTROSKSIESSEUK
EU 28IS
NOCH
32.85263.8564.8756.84317.27232.4563.89711.522
377.741237.922
5.65217.516
23.403133.680
2.3482.3693.94957.37650.30730.85811.3567.2896.639
154.79544.799371.123
1.712.6951.269
33.23533.526
35.90670.8494.5528.316
19.23636.6244.35313.678
408.545258.1195.62321.33527.514
199.5342.2182.7914.593
70.02556.92634.86214.3727.4597.738
172.19151.647
374.8891.913.895
1.62436.00233.250
9,3%11,0%-6,6%21,5%11,4%12,8%11,7%18,7%8,2%8,5%
-0,5%21,8%17,6%49,3%-5,5%17,8%16,3%22,0%13,2%13,0%26,6%2,3%16,6%11,2%15,3%1,0%11,7%
28,0%8,3%
-0,8%
2015 2016Evolution
2015-2016
Ligh
t Com
mer
cial V
ehicl
es (L
CV)
Up
to 3
,5 t
Med
ium
and
Hea
vy C
omm
ercia
l Veh
icles
Ove
r 3.5
t AT
BE DKHRCZDKEEFIFRDEELHUIEIT LVLTLUNLPLPTROSKSIESSEUK
EU 28IS
NOCH
72919366
0977
113864753767
26704278089723
4655702225015329125536021152
14080224304041612526081907
225685456
47890326573
22052154416
799210738
-1325118625099878
32494815792458
3215513
304021156158860041288
157202663045578032
-2392
248466520
24678334043
31859884483
9,6%14,6%
-35,6%4,2%7,3%
14,5%21,7%12,6%3,0%
-31,0%-3,3%35,1%38,0%26,5%66,7%11,8%11,6%18,7%12,8%31,1%
-25,4%10,1%19,5%
-48,5%2,3%
44,5%14,8%1,5%
45

46

PASSENGER TRANSPORT
47

Transport of passengers by mode in EU 28, 1995-2014 (billion pkm)
6.1
Source : EC EstimatesNotes:Air and Sea: only domestic and intra-EU-28 transport; provisional estimates
1995
1996
1997
1998
1999
2000
2001
2002
2003
2004
2005
2006
2007
2008
2009
2010
2011
2012
2013
2014
1995 -2014
per year
2000-2014
per year
2013-2014
1995
1996
1997
1998
1999
2000
2001
2002
2003
2004
2005
2006
2007
2008
2009
2010
2011
2012
2013
2014
1995 -2014
per year
2000-2014
per year
2013-2014
3 935
4 003
4 087
4 191
4 307
4 355
4 454
4 542
4 586
4 652
4 591
4 636
4 690
4 698
4 774
4 726
4 702
4 621
4 678
4 766
21,1%
1,1%
9,4%
0,6%
1,9%
116
118
122
126
130
108
112
114
117
121
123
123
119
124
122
123
125
126
125
127
9,4%
0,5%
18,2%
1,2%
1,8%
503
507
509
516
518
549
549
539
543
545
542
538
551
557
535
529
531
525
528
526
4,5%
0,2%
-4,2%
-0,3%
-0,5%
Passenger Cars PTW Bus & Coach
350
349
350
351
358
372
374
366
362
369
377
389
396
411
404
405
415
420
425
428
22,2%
1,1%
15,3%
1,0%
0,8%
Railway
74
75
76
77
79
81
82
82
83
86
87
89
91
94
94
97
98
100
100
102
37,8%
1,8%
25,6%
1,6%
1,6%
Tram & Metro
348
368
392
411
427
460
455
447
466
496
530
552
575
560
522
538
579
572
579
605
74,0%
3,1%
31,7%
2,0%
4,5%
Air
44
44
44
43
43
42
42
43
43
43
42
42
43
43
43
40
39
42
39
38
-15,5%
-0,9%
-10,1%
-0,8%
-3,9%
Sea
5 370
5 464
5 579
5 715
5 862
5 965
6 068
6 135
6 200
6 310
6 293
6 370
6 466
6 488
6 493
6 458
6 489
6 405
6 475
6 592
22,7%
1,1%
10,5%
0,7%
1,8%
Total
48

Passenger transport modal split in EU 28, 2014 (pkm in %)
6.3
Source: ECNotesAir and Sea: only domestic and intra-EU-28 transport; provisional estimates
Sea
Air
Tram & Metro
Railway
Bus & Coach
PTW
Passenger cars
72,3%
9,2%
8%
6,5%
1,9%
0,6%
0
100
200
300
400
500
1000
2500
4000Sea
Air
Tram & Metro
Railway
Bus & Coach
PTW
Passenger Cars
Evolution of passenger transport by mode in EU 28, 1995-2014
6.2
Source: EC
1,5%
49
19971996
19951998 1999
20002001
20022003
20042005
20062007
20082009
2010 20112012
20132014

Modal split of passenger transport on land by country in EU countries, 2014 ( billion pkm and pkm in %)
6.4
Source : EC Notes: Data are not harmonised and therefore not fully comparable. BE: Passenger cars data include pkm by vehicles registered as light goods vehicles but used as personal cars. UK: Passenger data refer to Great Britain only; include pkm by vans. UK: Buses and coaches data: GB data + 1.5 bln pkm throughout to account for Northern Ireland FR: Urban rail data refer to the Paris Metro and RER (Réseau Express Régional) systems and to metros in other French cities. PT: Urban rail data refer only to Lisbon and Porto Metro. "* Public Service Obligation (PSO) means a requirement defined or determined by a competent authority in order to ensure public passenger transport services in the general interest that an operator, if it were considering its own commercial interests, would not assume or would not assume to the same extent or under the same conditions without reward."
BEBGCZDKDEEEIEELESFRHRIT
CYLVLTLUHUMTNLATPLPTROSISKFISEUK
EU 28
BEBGCZDKDEEEIEELESFRHRIT
CYLVLTLUHUMTNLATPLPTROSISKFISEUK
EU 28
109,654,066,353,7
920,811,947,296,9319,7815,726,1
642,96,1
12,624,3
7,152,72,4
145,076,6218,983,385,225,627,365,5114,9
654,2
4766,48
76,1279,5166,1479,6584,4580,6279,6180,3281,6883,9183,5280,1281,81
80,2488,2483,5665,1883,0883,2972,4578,6988,8775,91
86,3076,8884,6083,1984,69
81,87%
22,211,516,76,6
63,22,410,221,039,553,43,6
102,81,32,33,01,017,60,511,510,139,25,614,13,45,47,58,741,1
525,51
Passenger cars Buses and coaches* Railways Urban Rail Total
(%) (billion pkm)
15,4116,9116,699,825,8016,2817,2117,4210,085,5011,6912,8118,1914,8110,7812,1621,8016,926,609,59
14,086,0012,5311,6115,109,746,275,32
9,03%
(%) (billion pkm) (%) (billion pkm) (billion pkm) (%)
11,01,77,66,8
89,50,31,71,1
25,186,70,9
50,0-
0,60,30,47,7-
16,212,015,93,95,00,62,63,912,1
64,7
428,21
7,622,507,6310,108,211,902,920,896,428,922,946,23
4,090,984,299,53
9,2911,406,704,104,502,507,005,208,908,00
7,36%
1,20,79,60,316,80,20,21,77,1
16,20,66,8
-0,1--
2,8-
1,47,04,21,08,0
-0,30,52,412,5
101,56
0,010,010,100,000,020,010,000,010,020,020,020,01
0,01
0,03
0,010,070,020,010,07
0,010,010,020,02
1,74%
144,0367,86100,1867,37
1.090,3014,7059,27120,61391,43972,0831,20
802,417,4015,7327,588,54
80,882,91
174,10105,72278,1893,78112,2329,7135,4477,45138,12772,54
5.821,76
(billion pkm)"
50

Source: ECNotes: Motorisation: Passenger car stock at end of year n has been divided by the population on 1 January of year n+1 Stock of registered passenger cars, PTWs and buses and coaches: At end of year, except for BE (1 August). Stock of registered passenger cars: Taxis are usually included. Stock of registered buses and coaches: Data include buses, coaches, minibuses and sometimes also trolleybuses. Stock of registered PTW: National vehicle stock data do not always include all powered two-wheelers and are therefore not fully comparable between countries. Break in time series due to inclusion of mopeds from 2001 in ES, from 2002 in SI and HR, from 2004 in LV, from 2005 in PL, from 2007 in LT. Tricycles and quads are sometimes included in the data.
Passenger vehicles by country, 2014 6.5
Stock of registered buses & coaches
(thousand)
Stock of registeredpassenger cars
(thousand)
Stock of registered PTW
(thousand)
BEBGCZDKDEEEIEELESFRHRIT
CYLVLTLUHUMTNLATPLPTROSISKFISEUK
EU 28
MKRSTR
5572,573013,904833,392329,58
44403,12653,001966,245107,62
22029,5131800,00
1474,5037080,75
478,49657,801205,67372,83
3107,70265,95
7979,084694,92
20003,864496,004907,561068,361949,063179,804584,71
30557,16
249773,13
371,451797,439857,92
453,01154,80998,82197,51
6181,7442,3036,57
1619,625033,213015,22153,05
9022,2340,9746,4233,1627,28161,5418,40
1772,21788,18
2406,11486,00107,3495,8080,79568,19618,55
1240,20
35399,24
8,6363,17
2828,47
16,7723,6020,5113,4177,504,608,8026,5959,8089,005,0497,912,584,856,941,78
17,921,799,609,59
106,0614,5044,282,569,16
16,2513,99112,16
817,53
3,169,04
638,46
51

Source : EC Estimates Notes: Motorisation: Passenger car stock at end of year n has been divided by the population on 1 Janu-ary of year n+1
Source: ACEA
Motorisation by country 2014 6.6
New passenger car registration per 1.000 inhabitants in EU countries, 2015
6.7
BEBGCZDKDEEEIEELESFRHRIT
CYLVLTLUHUMTNLATPLPTROSISKFISEUK
EU 28
MKRSTR
LUBEUKDEDKATSEFRSIIENL
EU 28
ITCZESFIPTEESKCYPLHRHUELLVLT
ROBG
Motorisation (number of passenger cars per 1.000 inhabitants)
Motorisation (number of passenger cars per 1.000 inhabitants)
495418459412547497425472474479349610565331413662316619472547526433247518360581470472
13170
180253127
8345413937363529292727
27
262222201715141298877643
52

Motorcycle registrations in EU countries, 2010-2016 6.8
Source: ACEMNotesData of 2015 available till November
AT
BE
BG
CY
CZ
DE
DK
EE
EL
ES
FI
FR
HR
HU
IE
IT
LT
LU
LV
MT
NL
PL
PT
RO
SE
SK
SI
UK
EU 28
AT
BE
BG
CY
CZ
DE
DK
EE
EL
ES
FI
FR
HR
HU
IE
IT
LT
LU
LV
MT
NL
PL
PT
RO
SE
SK
SI
UK
EU 28
21.510
24.271
n.a.
3.060
5.418
122.382
3.258
244
59.638
134.297
6.054
198.086
2.851
2.453
1.042
306.303
229
1.255
278
568
12.843
8.718
18.896
440
9.024
2.324
2.658
81.060
1.029.160
22.750
25.047
n.a.
2.527
6.056
126.991
2.032
299
44.785
119.423
5.692
185.122
2.726
2.091
831
254.895
280
1.306
472
746
11.662
8.957
18.937
469
8.223
1.960
2.139
79.144
935.562
24.808
23.428
127
2.074
6.974
127.497
1.984
364
31.805
97.931
4.986
169.644
2.397
1.957
663
206.291
224
1.201
494
n.a.
10.617
7.758
17.136
555
7.605
1.920
2.042
80.029
832.511
2010 2011 2012
25.996
20.644
173
1.675
n.a.
129.605
1.870
409
28.522
92.678
3.943
147.915
2.046
1.778
441
153.941
241
1.566
477
n.a.
9.570
7.394
14.510
521
7.800
2.840
2.380
80.951
739.886
2013
25.155
20.681
n.a.
n.a.
12.441
141.623
1.936
449
30.951
111.460
3.467
153.324
n.a.
n.a.
360
156.431
294
1.734
589
n.a.
10.673
9.848
15.335
n.a.
8.378
n.a.
1.707
91.492
798.328
2014
24.891
21.577
n.a.
n.a.
13.424
151.661
2.417
489
32.468
132.536
3.157
153.242
1.511
2.093
1.022
172.073
294
1.654
595
n.a.
11.688
23.865
17.611
648
9.422
5.309
1.855
105.717
891.219
2015
29.763
23.621
n.a.
n.a.
14.086
174.624
3.139
609
38.632
155.003
3.022
163.335
1.811
2.204
1.420
195.290
390
1.783
642
n.a.
12.872
25.823
19.760
952
13.220
5.565
2.074
119.889
1.009.529
2016
53

Transport of passengers per mode: comparison EU 28/World 6.9
Motorisation: comparison EU 28/ World, 2014 (passenger cars/ 1000 inhabitants)
6.10
Source: EC(1) USA: data from 2012
0
200
400
600
800
RussiaChinaJapanUSA(1)EU28
753
Source: Eurostat, Japan Statistics Bureau, US Bureau of Transportation Statisitics, Goskom STAT (Russia), National Bureau of Statistics of China, International Transport Forum, estimates Notes: (1): USA: Including light trucks / vans (2): China: including buses and coaches (3): Japan: included in railway pkm
Passenger car
Bus, trolley-bus and coach
Railway
Tram and metro
Waterborne
Air (domestic/intra EU)
4.766,5
525,5
428,2
101,6
37,5
665,3
EU 28 (2014)
6.005,9
546,1
403,0
23,0
0,7
978,1
USA (2014)
-
74,8
414
-
3,1
82,7
Japan (2013)
1.208,4
-
1.160,5
-
7,4
633,4
China (2014)
-
133,4
128,8
50,4
0,6
241,4
Russia (2014)
54

Trends and outlooks in passenger transport demand for the di�erent modes of transport in EU, 1990-2030 (Gpkm)
6.11
0
2000
4000
6000
8000
10000
Inland Navigation
Aviation Rail Private Cars and Motorcycles
Public Road Transport
1990 1995 2000 2005 2010 2015 2020 2025 2030
55

56
SAFETY
57

7.1 Road accidents involving personal injury by country, 1990-2015 (thousand)
7.1
Source: CARE; United Nations (Statistics of road tra�c accidents), national statistics (MT, candidate countries, IS, CH).
Notes: the definition of an accident involving personal injury di�ers from country to country. RO: only serious accidents before 2005. ME : Data used from 2010 and onwards
BEBGCZDKDEEEIEELESFRHRIT
CYLVLTLUHUMTNLATPLPTROSISKFISEUK
EU 28
MEMKIS
NOCH
62,46,521,99,2
389,42,16,1
19,6101,5162,614,5161,83,24,35,11,2
27,80,2
44,946,350,545,19,75,28,210,217,0
265,6
1502,1
2,30,68,8
23,8
50,77,4
28,88,4
388,01,68,1
22,883,6133,012,7
182,83,14,14,11,2
19,81,0
42,639,056,948,3
9,16,68,77,815,6
237,3
1433,0
2,41,1
8,623,0
49,16,9
25.47,3
382,91,57,7
23,0101,7121,214,4
256,52,44,55,80,917,51,3
42,342,157,344,57,99,07,96,615,8
242,1
1505,7
1,71,08,423,7
49,38,2
25,25,4
336,62,36,516,991,284,515,7
240,01,49,36,80,8
20,80,827,040,948,137,119,810,57,97,018,1
203,7
1342,0
2,80,78,1
21,7
42,16,619,73,5
288,31,35,815,085,567,313,3211,4
1,23,23,50,816,30,612,535,338,835,426,07,78,16,1
16,5160,1
1130,4
9,14,20,96,419,6
42,16,6
20,53,5
306,31,55,213,783,065,013,2
205,61,1
3,43,31,0
15,80,310,835,140,132,526,67,15,46,416,1
157,1
1128,5
8,54,50,96,1
19,0
37,56,7
20,53,1
299,61,45,612,283,160,411,8
186,70,93,43,41,0
15,20,45,0
40,837,029,926,96,95,45,716,5151,3
1078,4
8,14,10,76,218,2
35,67,0
20,33,0
291,11,45,012,1
89,556,811,2
181,70,83,53,40,915,71,29,5
38,535,830,324,86,64,75,314,9
144,5
1054,7
5,34,20,85,217,5
41,57,021,12,9
302,41,45,411,791,658,210,3177,00,83,73,30,915,81,4
13,438,035,030,625,46,25,15,313,1
152,4
1080,8
5,53,90,85,017,8
40,37,221,62,9
305,71,45,511,697,856,611,0
174,50,73,73,21,0
16,31,4
18,538,033,032,028,96,65,25,214,7
146,2
1090,3
n.a. n.a. n.a. n.a. n.a.
-45,110,8-1,4
-85,8-21,9-47,1-7,8
-35,0-3,7
-87,4-23,8
5,0-104,2-14,1-33,8-25,9-65,691,2
-62,4-19,9-30,6-29,6
243,815,7
-38,9-75,5-14,6-49,3
-27,3
n.a. n.a. n.a. n.a. n.a.
-2,83,02,4-1,01,1
-3,11,0-1,16,8-2,76,9-1,4
-12,9-1,0-2,68,33,1
-4,838,70,0-5,74,414,26,62,1
-3,012,1-4,1
0,9
n.a. n.a. n.a. n.a. n.a.
BEBGCZDKDEEEIEELESFRHRIT
CYLVLTLUHUMTNLATPLPTROSISKFISEUK
EU 28
MEMKIS
NOCH
1990 1995 2000 2005 2010 2011 2012 2013 2014 2015
Evolution 1990
-2015 (%)
Evolution 2014
-2015 (%)
58

Road accidents involving personal injury per one thousand population in EU countries, 2015
7.2
Source: EC Notes: The definition of an accident involving personal injury di�ers from country to country. The number of inhabitants used in this table is the sum of the population at 1 January 2014 and at 1 January 2015 divided by two.
0 1 2 3 4 5
EU 28UKSEFI
SKSI
ROPTPLATNLMTHULULTLVCY
ITHRFRESELIE
EEDEDKCZBGBE
4,44
59
3,59
1,00
2,05
0,51
3,77
1,06
1,181,06
2,100,86
2,61
2,87
0,771,85
1,08
1,77
1,663,23
1,10
0,873,07
1,453,19
0,950,95
1,51
2,272,15

Road fatalities in EU countries, 2005-2015 7.3
Source: CARE database (DG Mobility and Transport)Notes: Persons killed are all persons deceased within 30 days of the accident. Corrective factors have been applied to the figures which did not follow this definition.
BEBGCZDKDEEEIEELESFRHRIT
CYLVLTLUHUMTNLATPLPTROSISKFISEUK
EU-28
1 089 957 1 286 331
5 361 170 400 1 658 4 442 5 318 597
5 818 102 442 773 47
1 278 17
750 768
5 444 1 247 2 629 258 606 379 440 3 336
45 943
BEBGCZDKDEEEIEELESFRHRIT
CYLVLTLUHUMTNLATPLPTROSISKFISEUK
EU-28
2005
840 776 802 255
3 648 79 212
1 258 2 479 3 992 426 4 114 60 218 299 32
740 13
537 552
3 908 937
2 377 138 353 272 266
1 905
31 488
2010
862 657 772 220
4 009 101 186 1 141
2 060 3 963 418
3 860 71
179 296 33
638 16
546 523
4 189 891
2 018 141 328 292 319
1 960
30 689
2011
770 601 742 167
3 600 87 162 988 1 903 3 653 390 3 753
51 177 302 34
606 9
562 531
3 571 718
2 042 130 352 255 285 1 802
28 243
2012
723 601 655 191
3 339 81
188 879
1 680 3 268 368
3 401 44 179 256 45 591 17
476 455 3 357 637 1 861 125 251 258 260 1 770
25 956
2013
727 661 688 182
3 377 78 193 795
1 688 3 384 308 3 381 45 212 267 35
626 10
477 430
3 202 638 1 818 108 291 229 270 1 854
25 974
2014
732 708 734 178
3 459 67 166 805 1 689 3 461 348
3 428 57
188 242 36
644 11
531 479
2 938 593 1 893 120 274 266 259
1 806
26 112
2015
0,7 7,1 6,7 -2,2 2,4
-14,1 -14,0
1,3 0,1 2,3 13,0 1,4
26,7 -11,3 -9,4 2,9 2,9
10,0 11,3 11,4 -8,2 -7,1 4,1 11,1
-5,8 16,2 -4,1 -2,6
0,5
evolution % 14/15
-32,8 -26,0 -42,9 -46,2 -35,5 -60,6 -58,5 -51,4 -62,0 -34,9 -41,7 -41,1 -44,1 -57,5 -68,7 -23,4 -49,6 -35,3 -29,2 -37,6 -46,0 -52,4 -28,0 -53,5 -54,8 -29,8 -41,1 -45,9
-43,2
evolution % 05/15
60

Percentage change in road fatalities between 2002 and 2015 (%)
7.4
Source: CARE
Road fatalities country rankings, 2014
7.5
Source: EC Notes: Fatalities: all fatalities on the road: car drivers and passengers, bus and coach occupants, powered two-wheelers' riders and passengers, cyclists, pedestrians, commercial vehicle drivers, etc. indicated in table 2.7.1 for 2014.
-80
-70
-60
-50
-40
-30
-20
-10
0 ROBGMTFICYLUBEHRNLCZDEUKPLATELITEUSEFRHUSKSIIEDKPTLTLVESEE
23282829323642424250515152535456596163636565737384919192
106
MTSENLUKDKESDEIEFIATFREU 28SICYSKITEEPTLUHUBECZHRELPLLTROBGLV
232832343436404141424849515355646673757798
104106114116
120142161
205
SEUKNLDKFIDEMTFRIESILUITESEU 28ATEEBECYPTELCZSKLTHRHUBGPLLVRO
38596061737777799192949599101
104107122131
142144152155163177
204211
223328379
MTSENLUKFIDEESDKITATCYLUIESIEU 28FREEBEPTCZSKELPLLTHUHRBGLVRO
per million inhabitants
per 10 billion pkm per million passenger cars
61

Lives saved per million inhabitants in EU countries in 2015 (compared to 2001)
7.6
Source: CARE
0
30
60
90
120
150
LVLTPTESELLUEEFRSIBECYIEITPLHRSKATCZHUDKDESEFIUKNLBGROMT
Evolution of road fatalities and injured in EU 28, 2003-20157.7
Source: CARE
1400000
1300000
1700000
1500000
1600000
1800000
1900000
2000000 55000
50000
Injuries Road Fatalities
20032004
20052006
20072008
20092010 2011
20122013
20142015
62
45000
40000
35000
30000
25000

Road fatalities by mode of transport in EU 28, 2015
7.8
Source: CARE (EU road accidents database) or national publications
Other
Moped
Bus or Coach
Car + Taxi
Lorry <3.5 tonnes
HGV
Motorcycle
Agricultural Tractor
Cyclists
Pedestrian
Moped
Bus or Coach
Car + Taxi
Lorry <3.5 tonnes
HGV
Motorcycle
Agricultural Tractor
Cyclists
Pedestrian
7.8.1
7.8.2
7.8.3
TOTAL
INSIDE
URBAN
AREA
OUTSIDE
URBAN
AREA
46,1%
21,7%
15%
39,62%25,70%
15,35%
Moped
Bus or Coach
Car + Taxi
Lorry <3.5 tonnes
HGV
Motorcycle
Agricultural Tractor
Cyclists
Pedestrian
53.39% 13.46%
10.08%
63
7,8%
0,6%
0,5%
1,9%
2,6%
2,7%
1%
4,17%0,35%
1,57%
0,67%
0,59%
1,94%0,48%
5,33%
9,17%
2,54%3,61%

PTWs fatalities in selected EU countries, 2015 (%)
7.9
Source: CARE database (DG Mobility and Transport), national sources. Notes: Persons deceased within 30 days of their accident.
0
10
20
30
40
moped %
motor cycle %
UKSEFISKSIROPTPLATNLMTHULULTLVCYIT HRFRESELIEEEDEDKCZBGBE
64

Source: IRTAD, CARE, OECD Data and figures, EU: 2015, Australia: 2015, Israel: 2015, USA:2014, Japan:2014 figures
Road fatalities by age group in EU 28 and selected countries, 2015 (%)
7.11
0
20
40
60
80 % female
% male
UKSEFISKSIROPTPLATNLMTHULULTLVCYITHRFRESELIEEEDEDKCZBGBE
Source: CARE BE, DK, EL, PL, SE & UK 2014 figures BG 2009 figures MT, SK 2010 figures IE 2013 figures
0
10
20
30
40
50
60
70
80
USA
Japan
Israel
EU 28
Australia
>6425-6418-2415-170- 14
65
Road fatalities by gender in EU countries, 2015 (%)
7.10

Road Fatalities (per 100.000 population) in EU 28 and selected countries, 2014
7.12
Speed limits, blood alcohol limits by country
7.13
0
2
4
6
8
10
12
USANew ZealandKorea Japan Israel EU 28Canada (*)Australia(*)
Source: OECD * Figures & Data, USA: 2014, Australia: 2014, Canada:2014, Israel:2015, Japan:2014, Korea: 2014, New Zealand:2014
BEBGCZDKDEEEIEELESFRHR
ITCYLVLT
LUHUMTNLATPLPT
ROSI
SKFI
SEUK
30-5050505050505050505050505050505050505050
50-605050
30-5050
40-5050
32-48
90-120909080100
90-11080-10090-11090-10080-11090-11090-110
8090
70-9090
90-11080
80-100100
90-12090-10090-10090-100
9080-100
7096-112
120130130130
(130)-
120130120
110-130130130100110
110-130110-130
130-
130130140120130130130
100-120110112
0,50,50,00,50,50,20,50,50,50,50,50,50,50,50,40,50,00,80,50,50,20,50,00,50
0,50,20,8
Speed limit, cars (in general), km/h:
Built-up areas Outside built-up areas Motorways
Blood alcohol limit, grams of alcohol in 1
litre of blood
66

ALMEMKRSTR
ISNOCH
Source: National sources, International Transport Forum, EC Road Safety website, TIPSOL, World Health Organization
Notes : UK, IE, CY and MT drive on the left hand side of the road, the other Member States drive on the right hand side (Sweden since 3 September 1967). Signs in UK are in miles per hour.
The higher figure shown in the "outside built-up areas" column generally refers to the speed limit on dual carriageways that are not motorways. Speed limits: DE: Motorways: No general speed limit, recommended speed limit is 130 km/h (more than half the network has a speed limit of 120 km/h or less). FR: Dual carriageways 110 km/h. If the road is wet : motorways 110 km/h, dual carriageways 90 km/h, other roads outside built-up areas 80 km/h. IT: 150 km/h on certain 2x3 lane motorways if the operator so requests.
FI: in winter 100 km/h on motorways, 80 km/h on other roads. PL: Built-up areas: 50 km/h from 05h00 to 23h00, 60 km/h from 23h00 to 05h00. Blood alcohol limits: In many countries, special (more restrictive) rules apply to novice (i.e. new, unexperienced) and professional drivers
Fatalities at 30 days by road user type in EU countries7.14
Unknown
Pedestrian
Passenger
Driver
61,79%7.14.1TOTAL
Speed limit, cars (in general), km/h:
Built-up areas Outside built-up areas Motorways
Blood alcohol limit, grams of alcohol in 1
litre of blood
4050605050
505050
80-9080-10080-10080-10090-110
80-9080
80-100
110130120120120
-90-100
120
0,50,50,50,30,5
0,50,20,5
67

Pedestrian
Passenger
Driver
49,9%7.14.2
URBAN
Pedestrian
Passenger
Driver59,72%7.14.3
MOTORWAY
68

Pedestrian
Passenger
Driver70,597.14.4RURAL
Source: CARE
69

70

TAXATION
71

Taxes on acquisition of motor vehicles in EU countries, January 20178.1
Fiscal income from motor vehicles in EU selected countries, 2015 (EUR billion)
8.2Source: ACEA
Source: ACEA * latest available data; only countries for which sourced data is available are listed ** 2012 estimates for income from VAT and other taxes
ATBEBGHRCYCZDKEEFIFRDEELHUIEITLVLTLUMTNLPLPTROSKSIESSEUK
20%21%20%25%19%21%25%20%24%20%19%24%27%23%22%21%21%17%18%21%23%23%19%20%22%21%25%20%
Based on CO2 emissions (max 32% + bonus/malus) Based on purchase price + BGN 25 (plate) + BGN 160 (eco tax) Based on selling price and CO2 emissions Based on CO2 emissions and cylinder capacity Based on vehicle type and Euro standards Based on tra�c safety equipment and evaluation (105% up to DKK106,600 + 150% on the remainder) €62 (registrationlabel) + €130 (registration card) Based on price and CO2 emissions (min 3.8%, max 50%) Bonus/malus system based on CO2 emissions Based on purchase price + €26.30 (registration fees) Based on net retail price and CO2 emissions Based on age and cylinder capacity Based on CO2 emissions, from 14 to 36% Based on kilowatt, weight and seats Based on weight and fuel type Based on vehicle type Based on purchase price + registration fees (€24 or €50) Based on CO2 emissions, length and vehicle value Based on CO2 emissions and fuel e�ciency Based on cylinder capacity (3.1-18.6%) Based on cylinder capacity and CO2 emissions Based on purchase price + €9 (registration fees) Based on engine power (kW) and age Based on CO2 emissions and purchase price Based on CO2 emissions,from 4.75% (121-159g/km) to 14.75% (200g/km or more) Based on purchase price and vehicle type Based on invoice value or resale price
Based on cylinder capacity and age (Brussels-Capital)Fuel, age, Euro standards and CO2 emissions (Flanders) CO2 emissions (Wallonia)"
Registration TaxVAT
ATBEBGHRCYCZDKEEFIFRDEELHUIEITLVLTLUMTNLPLPTROSKSIESSEUK
VAT on vehicles, servicing/ repair parts, tyres
Fuels & LubricantsSales & registration taxesAnnual ownership taxes
Driving license fees Insurance taxes
TollsCustoms duties
Other taxesTOTAL (National currencies)
Total in EURO
AT€ bn2014
2,68
5,340,522,10
-0,321,69
-0,31
12,9613,00
BE€ bn2015
6,23
6,930,411,600,010,96
--
0,6616,8016,80
DKDKK bn
2014
NA
16,6115,8710,59
-1,580,38
--
45,026,10
DE€ bn2012
26,32
39,30-
8,990,013,79
-0,541,01
79,9680,00
ES€ bn2015
-
18,723,792,640,06
---
0,6625,8625,90
FI€ bn2015
1,50
4,070,880,93
-0,39
---
7,777,80
FR€ bn2014
13,74
37,102,071,00
-4,5911,03
-1,5871,1171,10
EL€ bn2013
0,16
3,770,051,30
n.a.
0,065,345,34
IE€ bn2015
0,60
3,030,681,12
-----
5,445,40
IT€ bn2015
16,10
36,841,525,95
-4,001,95
-5,5071,8671,90
NL€ bn2015
1,52
7,871,463,970,25
0,948--
2,3918,4118,40
PT€ bn2016
3,45
3,260,670,55
--
0,320,050,208,508,50
SESEK bn
2014
24,50
48,20-
14,30-
2,801,80
-4,5096,10
10
UK£bn
2016**
12,50
27,90-
5,80----
1,5047,7055,9
Total = EUR 395,7bn
72

Revenues from environmentally related taxes in % of GDP8.3
Environmental tax revenues by % of GDP in EU countries, 20158.3.1
Evolution of environmental tax revenues by % of GDP in EU 28, 2005-20158.3.2
Country code 2015
BEBGCZDKDEEEIEELESFRHRITCYLVLTLUHUMTNLATPLPTROSISKFISEUKEU 28
2,112,92,093,991,922,751,923,731,892,184,113,392,982,71,811,852,652,93,392,412,652,432,433,921,772,922,222,472,44
0.0
0.5
1.0
1.5
2.0
2.5
3.0
20052006
20072008
20092010 2011
20122013
20142015
Source: OECD 73

CO2 based motor vehicle taxes in EU countries, 20158.4
Excise duties on fuels in EU countries at 1-1-2015 & 1-1-2017 (EUR/1000 litres)
8.5
CountryAustria
BelgiumCyprus
GermanyDenmark
Spain FinlandFranceGreeceCroatiaIreland
LuxembourgLatviaMalta
NetherlandsPortugalRomania
SwedenSlovenia
United Kingdom
CO2 based motor vehicle taxes in the EU in 2015Fuel consumption tax (CO2) levied on the first registration of the carCO2-based registration tax (Wallonia). Registration tax based on CO2 emissions, Euro standards, fuel consumption and age (Flanders). CO2-based company car tax.Registration tax and annual circulation tax based on CO2 emission CO2-based annual circulation tax.annual circulation tax based on fuel consumption. Registration tax (based on price) linked to fuel consumptionCO2-based registration tax.Registration tax and annual circulation tax based on CO2 emissionRegistration tax, annual circulation tax and company car tax based on CO2 emissions.CO2-based annual circulation taxRegistration tax based on price, CO2 emissions and fuel consumption.Registration tax and annual circulation tax based on CO2 emissions.CO2-based annual circulation tax.CO2-based registration tax.Registration tax based on price, CO2 emissions and vehicle length. Annual circulation tax based on CO2 emissions and ageCO2-based registration taxRegistration tax based on cubic capacity and CO2 emissions. Annual circulation tax based on cubic capacity, CO2 emissions and ageRegistration tax based on CO2 emissions, cubic capacity, exhaust emissions and age.Annual circulation tax based on CO2 emissions and exhaust emissionsCO2-based registration tax.Annual circulation tax and company car tax based on CO2 emissions
ATBEDEDKELESFI
FRHR
IEIT
LUNLPTSEUKBGCYCZEE
HULTLV
MTPL
ROSI
SKEU 28 average
Source: ACEA
515615670608416425681624479587728465759617646674363479469423397434411519349461596551554
425443486414383331506468374479617338478402602674330450398393384330333422345430495386449
482623655564700461703651519588728462772671405680363479475465388434436549395368508515557
397513470363410367530531412479617335486446260680330450405448357330341472345337426368441
-6,4%1,3%
-2,2%-7,2%68,3%8,5%3,2%4,3%
0,2%0,0%-0,6%1,7%8,8%
-37,3%0,9%0,0%0,0%1,3%9,9%-2,3%0,0%6,1%5,8%13,2%
-20,2%-14,8%-6,5%0,5%
-6,6%15,8%-3,3%-12,3%7,0%10,9%4,7%13,5%
0,0%0,0%-0,9%1,7%
10,9%-56,8%
0,9%0,0%0,0%1,8%
14,0%-7,0%0,0%2,4%11,8%0,0%
-21,6%-13,9%-4,7%-1,7%
Unleaded Petrol
Unleaded PetrolDiesel
Unleaded Petrol Diesel Diesel
1 Jaunuary 2015 1 January 2017 % change 2015-2017
74

At the pump prices of petroleum in EU 28, first quarter of 2017* (€/litre)
8.6
At the pump prices of automotive diesel in EU countries, 2017 (€/litre) 8.6.1
At the pump prices of premium unleaded gasoline 95 in EU countries, 2017 (€/litre)8.6.2
Source: DG ENER, Member States, *Average of the First 4 Months of 2012
0.0
0.3
0.6
0.9
1.2
1.5
United K
ingdom
Sweden
Spain
Slovenia
Slovakia
Romani
a
Portuga
lPola
nd
Netherla
ndsMalta
Luxem
bourg
Lithuan
iaLat
viaItaly
Ireland
Hungary
Greece
Germany
France
Finland
Estonia
Denmark
Czech R
epublic
Cyprus
Croatia
Bulgaria
BelgiumAust
ria
0.0
0.5
1.0
1.5
2.0
2.5
75
SEFISKSIROPTPLATNLMTHULULTLVCYITHRFRESELIEEEDEDKCZBGBE

Net charges per domestic haul by type in EU countries, 2012 (EUR/litre)
8.7
Source: OECD
BelgiumBulgaria
Czech RepublicDenmarkGermany
EstoniaIrelandGreece
SpainFrance
CroatiaItaly
CyprusLatvia
LithuaniaLuxembourg
HungaryMalta
NetherlandsAustriaPoland
PortugalRomaniaSloveniaSlovakiaFinlandSweden
United Kingdom
3,15
7,33,43,4
17,54,83,33,4
3
22,82,63,1
4,26,42,73,44,4
94,54
8,3
55,240,9656,3256,3260,1649,264
52,4842,2455,04
56,32
42,2438,438,449,2
48,6455,0451,249,247,3639,6846,0847,3660,1665,2892,16
Vehicle Taxes (EUR/domestic
haul)Fuel Taxes (EUR/do-
mestic haul)
76

77

ENVIRONMENT
78

Comparison between freight & passenger transport evolution and CO2 emissions in EU 28, 1995-2014
9.1
CO2 emissions from road transport in EU and selected countries, 2000-2014 (g/ tonne-km & g/ passenger-km)
9.2
0
1000
2000
3000
4000
5000
6000
7000
8000
19951996
19971998
19992000
20012002
20032004
20052006
20072008
20092010 2011
20122013
2014
Source: EC * Including International Bunkers (international tra�c departing from the EU)
Source: EC * Including International Bunkers (international tra�c departing from the EU)
Passenger Transport in EU 28(billion pkm)
Freight Transport in EU 28 (billion tkm)
CO2 emissions* from transport in EU 28(million tonnes)
100
150
200
CO2 emissions (g/ passenger-km)
CO2 emissions(g/ tonne-km)
79
20002001
20022003
20042005
20062007
20082009
2010 20112012
20132014

Source: EEA(*) EU-28 plus Norway, Switzerland and Turkey
CO2 emissions from road passenger transport by mode in EU and selected countries (g/pkm)
9.3
CO2 emissions from road freight transport in EU and selected countries (g/tkm) 9.4
Source: EEA(*) EU-28 plus Norway, Switzerland and Turkey
0
30
60
90
120
150Passenger Cars
Buses + Coaches
Passenger Cars
Buses + Coaches
Light DutyVehicles
Heavy DutyVehicles
Two-wheelers
20142000 2007 2011
0
50
100
150
200
250
300
350
20002005
20102015
80
Source: EC
-6
-5
-4
-3
-2
-1
0EU 28
UKSEESSISKROPTPLNLMTLULTLVITIEHUELDEFRFIEEDKCZCYHRBGBEAT
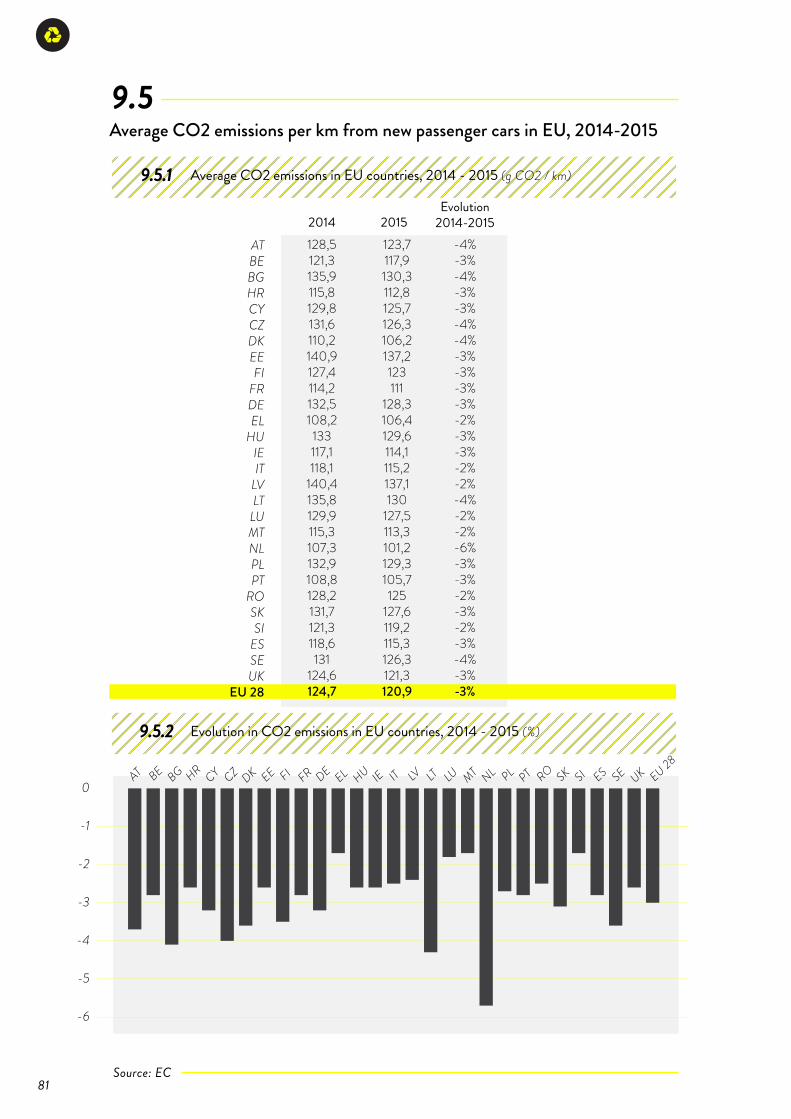
Average CO2 emissions per km from new passenger cars in EU, 2014-2015 9.5
ATBEBGHRCYCZDKEEFI
FRDEEL
HUIEIT
LVLT
LUMTNLPLPT
ROSKSI
ESSEUK
EU 28
128,5121,3135,9115,8129,8131,6110,2140,9127,4114,2132,5108,2
133117,1118,1
140,4135,8129,9115,3107,3132,9108,8128,2131,7121,3118,6131
124,6124,7
123,7117,9130,3112,8125,7126,3106,2137,2123111
128,3106,4129,6114,1115,2137,1130
127,5113,3101,2129,3105,7125
127,6119,2115,3126,3121,3120,9
-4%-3%-4%-3%-3%-4%-4%-3%-3%-3%-3%-2%-3%-3%-2%-2%-4%-2%-2%-6%-3%-3%-2%-3%-2%-3%-4%-3%-3%
2014 2015Evolution
2014-2015
Average CO2 emissions in EU countries, 2014 - 2015 (g CO2 / km) 9.5.1
Evolution in CO2 emissions in EU countries, 2014 - 2015 (%) 9.5.2
81

50
100
150
2002020 target
2015 target
Average CO2 emissions from new passenger cars
Source: ACEA
0
10
20
30
40
50
60
Alternative fuelsDieselPetrol
2012
2013
2014
2015
Evolution of CO2 emissions from new passenger cars in EU (gCO2/km)9.5.3
20002005
20102015
2020
Fuel market share for new car registrations in EU, 2012-2015 (%)
9.6Source: EEA
82

BEBGCZDKDEEEIEELESFRHRIT
CYLVLTLUHUMTNLATPLPTROSISKFISEUK
Total
BEBGCZDKDEEEIEELESFRHRIT
CYLVLTLUHUMTNLATPLPTROSISKFISEUK
Total
2010 2011 2012 2013
1-
13371
16697-3
73492
-396
157--2-
85100
1-8
78-1
513183
435301812462861
328*33
3251910
-706
643850
1490
368289370289702288
288246145
8723
47226154225
28000
26*78
6041559
-479
656790
1500
3702263632871010
103225*225218
8083
3768
117235
22230
27*219
4001964
11349
681
1070
1501
1102*114
602176100
1110
251*235197
7398
56513
2103342516
024*220618
188533
3871
611180
1501
1248*2396483141372
105320*334277
8590
741378502250
46553574*70241942445
5518372015614720158
525054951269590407108158
400*282505
21500
20142005
Source: EBB * IE, FI, NL: Data include hydro-diesel production (*) 2010 Biodiesel production of SE is included in the 246.000 tonnes indicated for DK
Source: Eurostat
0
1
2
3
4
5
6
7
8
BelgiumBulgaria
Czech RepublicDenmarkGermany
EstoniaIrelandGreece
SpainFrance
CroatiaItaly
CyprusLatvia
LithuaniaLuxembourg
HungaryMalta
NetherlandsAustriaPoland
PortugalRomaniaSloveniaSlovakiaFinlandSweden
United KingdomIceland
NorwayAlbania
SerbiaTurkey
EU (28 countries)
Biodiesel production in EU countries, 2005-2014 (1000 tonnes)
9.7
Biofuels share in transport consumption in EU, 1996-2015 (%)
9.8
19961997
19981999
20002001
20022003
20042005
20062007
20082009
2010 20112012
20132014
2015
83

Source: JRC - EDGAR * Includes public power and heat production ** Excludes emissions from non-energy use and feedstock use of fuels *** Excludes international marine and aviation bunkers **** Service sector; includes agriculture and forestry
Source: Eurostat
38%55%53%20%32%45%24%27%35%26%34%33%24%31%34%52%32%0%
33%32%42%40%62%41%47%44%40%25%27%38%35%39%31%34%
25%16%9%
30%26%15%28%40%40%31%22%32%58%18%21%30%16%67%24%26%12%32%8%
25%9%
20%24%34%20%24%12%14%25%26%
26%15%22%30%27%18%32%21%16%26%30%24%10%25%19%15%35%17%23%30%30%19%26%25%15%25%21%27%20%22%27%25%38%25%
2%5%5%5%1%
13%3%7%3%3%7%3%0%9%8%0%6%0%8%3%6%4%3%0%5%4%3%1%2%3%0%1%5%3%
9%1%9%13%13%6%13%4%6%13%7%8%5%17%18%2%
10%0%11%9%8%5%1%8%
24%4%13%9%14%13%0%1%2%
10%
0%9%2%0%1%4%0%0%0%0%0%0%3%0%0%0%0%16%0%0%2%0%1%0%0%3%0%3%1%0%
25%21%0%1%
BelgiumBulgaria
Czech RepublicDenmarkGermany
EstoniaIrelandGreece
SpainFrance
CroatiaItaly
CyprusLatvia
LithuaniaLuxembourg
HungaryMalta
NetherlandsAustriaPoland
PortugalRomaniaSloveniaSlovakiaFinlandSweden
United KingdomIceland
NorwayAlbania
SerbiaTurkey
EU (28 countries)
Industry Transport Households Agriculture ServicesFisheries
and other sectors
Other Buildings****
Residential Sector
Other Transport***
Road Transport
Manufacturing industry **
Autoproducers/ other energy industry
Main Activity Power Generation*
38%
Share of total CO2 emmissions from fossil fuel by sector in EU (Mt CO2), 20169.9
Final energy consumption by sector in EU countries, 2015 (% of TOE)
9.10
84

85

38%55%53%20%32%45%24%27%35%26%34%33%24%31%34%52%32%0%
33%32%42%40%62%41%47%44%40%25%27%38%35%39%31%34%
25%16%9%
30%26%15%28%40%40%31%22%32%58%18%21%30%16%67%24%26%12%32%8%
25%9%
20%24%34%20%24%12%14%25%26%
26%15%22%30%27%18%32%21%16%26%30%24%10%25%19%15%35%17%23%30%30%19%26%25%15%25%21%27%20%22%27%25%38%25%
2%5%5%5%1%
13%3%7%3%3%7%3%0%9%8%0%6%0%8%3%6%4%3%0%5%4%3%1%2%3%0%1%5%3%
9%1%9%13%13%6%13%4%6%13%7%8%5%17%18%2%
10%0%11%9%8%5%1%8%
24%4%13%9%14%13%0%1%2%
10%
0%9%2%0%1%4%0%0%0%0%0%0%3%0%0%0%0%16%0%0%2%0%1%0%0%3%0%3%1%0%
25%21%0%1%
CASE STUDY
86

HISTORICAL BACKGROUND
87
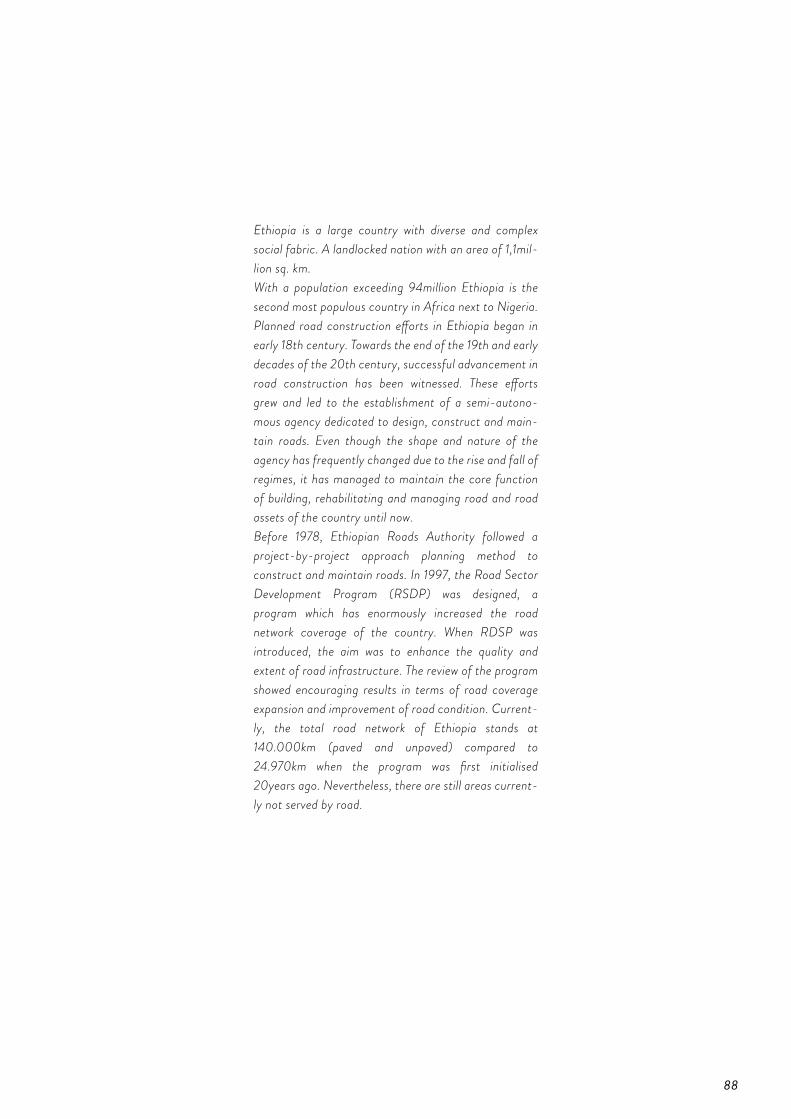
Ethiopia is a large country with diverse and complex social fabric. A landlocked nation with an area of 1,1mil-lion sq. km. With a population exceeding 94million Ethiopia is the second most populous country in Africa next to Nigeria. Planned road construction e�orts in Ethiopia began in early 18th century. Towards the end of the 19th and early decades of the 20th century, successful advancement in road construction has been witnessed. These e�orts grew and led to the establishment of a semi-autono-mous agency dedicated to design, construct and main-tain roads. Even though the shape and nature of the agency has frequently changed due to the rise and fall of regimes, it has managed to maintain the core function of building, rehabilitating and managing road and road assets of the country until now. Before 1978, Ethiopian Roads Authority followed a project-by-project approach planning method to construct and maintain roads. In 1997, the Road Sector Development Program (RSDP) was designed, a program which has enormously increased the road network coverage of the country. When RDSP was introduced, the aim was to enhance the quality and extent of road infrastructure. The review of the program showed encouraging results in terms of road coverage expansion and improvement of road condition. Current-ly, the total road network of Ethiopia stands at 140.000km (paved and unpaved) compared to 24.970km when the program was first initialised 20years ago. Nevertheless, there are still areas current-ly not served by road.
88

Total length of federal roads in Ethiopia, 2015 (post RSDP)
10.1
Road Network evolution since the inception of RSDP (km)
10.2
1997
1998
1999
2000
2001
2002
2003
2004
2005
2006
2007
2008
2009
2010
2011
2012
2013
2014
1997
1998
1999
2000
2001
2002
2003
2004
2005
2006
2007
2008
2009
2010
2011
2012
2013
2014
3708
3760
3812
3824
3924
4053
4362
4635
4972
5002
5452
6066
6938
7476
8295
9875
11301
12640
12162
12240
12250
12250
12467
12564
12340
13905
13640
14311
14628
14363
14234
14373
14136
14675
14455
14217
10680
11737
12600
15480
16480
16680
17154
17956
18406
20164
22349
23930
25640
26944
30712
31550
32582
33609
Asphalt Gravel Rural
854
6983
27628
39056
Wereda
26550
27737
28662
31554
32871
33297
33856
36496
37018
39477
42429
44359
46812
48793
53997
63083
85966
99522
Total
-
4,5%
3,3%
10,1%
4,2%
1,3%
1,7%
7,8%
1,4%
6,6%
7,5%
4,5%
5,5%
4,2%
10,7%
16,8%
36,3%
15,8%
Growth Rate (%)
0,46
0,46
0,46
0,50
0,50
0,49
0,49
0,51
0,51
0,53
0,55
0,56
0,57
0,58
0,66
0,75
1,00
1,10
Road Density / 1000 Popn
24,1
25,2
26,1
28,7
29,9
30,3
30,8
33,2
33,6
35,9
38,6
40,3
42,6
44,4
49,1
57,3
78,2
90,5
Road Density/ 1000 sq. km
Road Network (km)
0
20000
40000
60000
80000
100000
19971998 1999
20002001
20022003
20042005
20062007
20082009
2010 20112012
20132014
Asphalt
Gravel
Rural
Wereda
Total
89

Road Network Growth Rate in Ethiopia Post RSDP10.3
Since the introduction of Road Sector Development Program (RSDP) in 1997 the country is a victim of the inevitable steep increase in road tra�c accidents because of the motorisation induced by the growing economy. As a country aspiring to become middle earning, the trend of not coping with the rapid motorisation in terms of safety and infrastructure demand is a significant challenge for Ethiopia. According to the WHO, the country stood among the top countries with devastating road safety status. Behavioural problems, poorly enforced road safety regulations, inadequate and substandard road infrastructure, and higher population of vulnerable road users (mostly pedestrians) combined with an ever-in-creasing number of vehicles are the core reasons of road safety problems in Ethiopia.
ROAD
SAF
ETY
IN E
THIO
PIA
0
5
10
15
20
25
30
35
40Growth Rate (%)
19971998 1999
20002001
20022003
20042005
20062007
20082009
2010 20112012
2013
90

Road fatalities and serious injuries in Ethiopia, 2008 - 201310.4
Evolution of road tra�c fatalities in Ethiopia, 2003 – 2013 (%)
10.5
0
1000
3000
5000
7000 Serious Injuries
Fatalities
2008 2009 2010 2011 2012 2013
2003 -
2004 2004 -
2005 2006 -
2007 2007 -
20082005 -
2006 2008 -
2009 2009 -
2010 2010 -
2011 2011 -
2012 2012 -
2013
0.0
0.5
1.0
1.5
2.0
2.5
3.0
3.5
4.0
Source: World Bank, ERA 91

Authors:Christophe Nicodème
Konstandinos DiamandourosJosé Diez
Concetta DursoKyriaki Arampidou
Ali Kemal Nuri
92
