road salt use in the united states
TRANSCRIPT

2
Road Salt Use in theUnited States
Under many snow and ice con-ditions, the use of deicing chem-icals is necessary to maintainclear pavements. In terms ofboth time and budget, commonsalt, or sodium chloride, is widelyregarded as the most effectivemeans of deicing highways. Saltis by far the most commonly used
deicing chemical in the United States; it is spread at a rate of approx-imately 10 million tons per year.
This chapter provides general background information on the useof road salt, including trends in usage, application and storage prac-tices, use by region and jurisdictional level, and annual spending onsalting operations. The chapter concludes with a brief discussion ofsome of the benefits of deicing and efforts being made by highwayagencies to manage their salting programs.
TRENDS IN ROAD SALT USE
The use of road salt has paralleled changes in the size and importanceof the nation’s highway system. Before the 1940s, highway depart-ments relied mostly on plowing and abrasives (e.g., sand and cinders)to keep roadways open after winter storms. Salt was used primarilyas an additive to prevent freezing of sandpiles. During the winter of1941–1942, New Hampshire became the first state to adopt a generalpolicy of using salt, although a total of only 5,000 tons of salt wasspread on the nation’s highways that winter (TRB 1974, 2).
17

1 8 HIGHWAY DEICING
After World War II, as the expanding highway system became essential to the public and the national economy, road salt use began to soar. The bare-pavement concept, under which motorists could expect snow- and ice-free pavements shortly after storms, soon became a policy in most cities and their suburbs. As a result, salt use doubled every 5 years during the 1950s and 1960s growing from 1 million tons in 1955 to nearly 10 million tons less than 15 years later (Figure 2-1).
Road salt use has leveled off during the past 20 years. Whereas salt use increased rapidly during the 1950s and 1960s because it was replacing abrasives, by the 1970s this conversion was nearly com- plete. Also, at about this time, many of salt’s adverse effects were becoming well known, causing many highway agencies to reevaluate their salting practices. Through practical experience and with guid- ance from government and industry, many highway agencies started managing their salting programs, for example, by calibrating spread- ing equipment and establishing formal salt use policies. Partly because of these changes, annual salt use has fluctuated from 8 million to 12 million tons during the past 20 years, with year-to-year fluctuations depending mainly on winter conditions.
Tons (millions) 12
10 -
8-
6-
56 58 60 62 64 66 68 70 72 74 76 70 80 02 04 86 08
Year
F I G U R E 2-1 T r e n d s in highway salt use, 1950-1988 (source: Salt Institute).

Road Salt Use in the United States 19
SALT A P P L I C A T I O N A N D S T O R A G E
Early in t h e century, when salt w a s used s e l e c t i v e l y on busy city streets, it w a s of ten shoveled from t h e back of t r u c k s . As i t s u s e grew, i n n o v a t i o n s were made in s a l t i n g equipment a n d p r a c t i c e s . D u r i n g t h e 1950s a n d 1960s spinning disks a n d r o l l e r s extending t h e width of t h e t ruck were i n t r o d u c e d to allow spreading over a wide p a t h . Later, many h i g h w a y agencies l e a r n e d to spread salt more e f f i c i e n t l y by w i n d r o w i n g it in a n a r r o w line to p r o d u c e c o n c e n t r a t e d brines that f l o w e d under t h e i c e to break t h e p a v e m e n t - i c e bond. Other m e t h o d s of applying salt i n c l u d e t h e direct d i s p e n s i n g of salt solution from trucks equipped with a tank a n d nozzle a n d t h e u s e of “ p r e w e t t e d ” salt dampened with water or liquid c a l c i u m chloride. B e c a u s e prewetted salt a d h e r e s well to t h e pavement (reducing wind a n d t r a f f i c scatter) a n d acts faster than d r y salt ( b y d i s s o l v i n g faster), less d e i c i n g chemical is required.
Salt A p p l i c a t i o n Rates
Salt melts i c e by d e p r e s s i n g t h e freezing point of water? T h e addition of salt to water lowers the freezing point of the solution until the salt c o n c e n t r a t i o n r e a c h e s about 25 percent. This threshold c o n c e n - t r a t i o n marks t h e eutectic point, at which t h e freezing t e m p e r a t u r e of t h e solution c a n no longer be lowered, a n d t h e addition of more salt h a s no a d d i t i o n a l i c e - m e l t i n g e f f e c t . T h e eutectic t e m p e r a t u r e f o r salt solution is - 21°C ( -@F). Under f i e l d c o n d i t i o n s , however, i c e m e l t i n g is much t o o slow near t h e eutectic t e m p e r a t u r e to be of practical significance. At pavement temperatures below - 12’C ( 10°F), s o d i u m c h l o r i d e i s s e l d o m u s e d , a n d h i g h w a y a g e n c i e s r e l y m o r e o n s a n d i n g or salt mixed with c a l c i u m chloride, which r e m a i n s effective in cold conditions.
As a practical m a t t e r , at pavement t e m p e r a t u r e s above - 12’C ( 1 0 ° F ) , t h e a m o u n t o f s a l t n e e d e d f o r h i g h w a y d e i c i n g i s u s u a l l y l e s s than t h e t h e o r e t i c a l a m o u n t necessary to melt a l l t h e ice. If a p p l i e d properly, small a m o u n t s of salt u s u a l l y p r o d u c e p a r t i a l m e l t i n g a n d ct h e r e b y allow a c c u m u l a t i o n s to be r e m o v e d by t h e action of t r a f f i c or p l o w i n g (TRB 1974). Usually, h i g h w a y m a i n t e n a n c e engineers a r e given f l e x i b i l i t y to determine salt a p p l i c a t i o n r a t e s on t h e bas i s of t h e i r judgment of w e a t h e r a n d r o a d w a y c o n d i t i o n s . Critical b r i d g e s

20 HIGHWAY DEICING
a n d highways, such as multilane freeways, a r e typically t r e a t e d most i n t e n s e l y , t h r o u g h higher a p p l i c a t i o n r a t e s a n d more frequent treat- ment. L o w e r - p r i o r i t y s t r e e t s a n d secondary roads a r e of ten left untreated f o r longer periods, or n o t t r e a t e d at a l l (see Figure 2 - 2 ) .
Official salt a p p l i c a t i o n r a t e s f o r s e v e r a l states a r e listed in Table 2-1. Rates vary from s t a t e to state, although most a r e b e t w e e n 2 0 0 a n d 4 0 0 l b / l a n e - m i on h i g h - p r i o r i t y highways. On medium-priority roads, coverage tends to be r e d u c e d or e l i m i n a t e d at night, a n d salt is mixed with abrasives to r e d u c e salt u s e by at l e a s t 25 percent. These policies generally do n o t l i m i t t h e frequency of a p p l i c a t i o n . As might be expected, northern states tend to have t h e h i g h e s t a n n u a l loadings of salt b e c a u s e of t h e i r higher a p p l i c a t i o n f r e q u e n c i e s . N e w York, M a s s a c h u s e t t s , Michigan, N e w H a m p s h i r e , a n d V e r m o n t report t h e h i g h e s t a n n u a l salt loadings. Each averages more than 10 t o n s / l a n e - m i on state-maintained highways (Table 2 - 2 ) .
Municipal h i g h w a y agencies were n o t surveyed in this study. They a r e among t h e most generous users of road salt b e c a u s e of t h e e m p h a - s i s placed on clearing b u s lanes a n d commuter routes (TRB 1974). Toll a u t h o r i t i e s a r e also heavy salt users, b e c a u s e they a r e s e l l i n g a s e r v i c e a n d do n o t wish to lose customers by allowing hazardous d r i v i n g c o n d i t i o n s or d e l a y s .
S t o r a g e
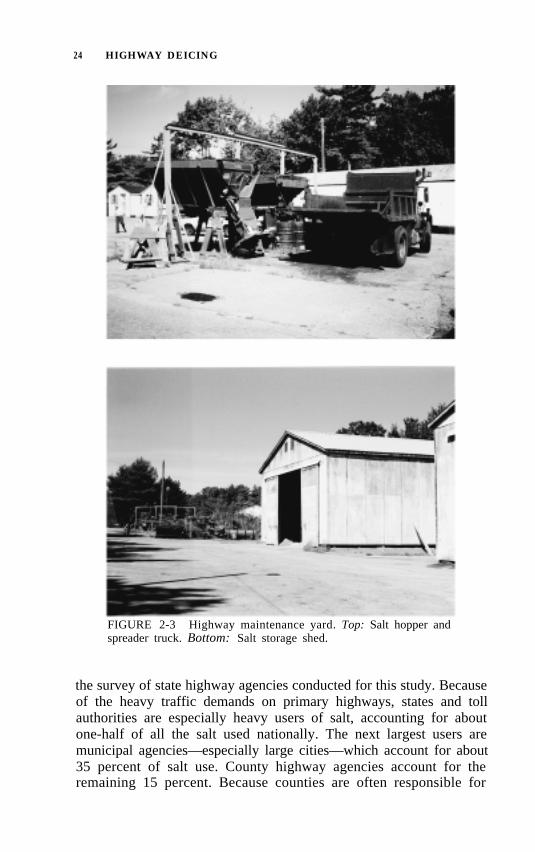
Salt s t o r a g e f a c i l i t i e s a r e u s u a l l y l o c a t e d at h i g h w a y m a i n t e n a n c e yards as well as at o ther i n t e r m e d i a t e points along highways (see Figure 2 - 3 ) . T h e location, s i z e , a n d n u m b e r of s t o r a g e f a c i l i t i e s o f ten d e p e n d on t h e priority of t h e roads being t r e a t e d a n d t h e incidence of s p e c i a l features, such as b r i d g e s a n d i n t e r s e c t i o n s that r e q u i r e more frequent salting.
When stored o u t s i d e a n d e x p o s e d to p r e c i p i t a t i o n , salt solution m a y r u n o f f a n d leach into s u r r o u n d i n g s o i l s a n d g r o u n d w a t e r unless properly c o v e r e d a n d drained. A c c o r d i n g l y , h i g h w a y agencies i n c r e a s i n g l y s t o r e salt on i m p e r v i o u s pads a n d in leakproof shelters, such as sheds, barns, or “beehive” domes that c o r r e s p o n d to t h e salt pile’s angle of r e p o s e . These b u i l d i n g s , which of ten cost u p w a r d s of $100,000 to build, c a n p r o v i d e s t o r a g e f o r more than 1,000 tons of s a l t . In recent years, some h i g h w a y agencies have i n t r o d u c e d high- capacity s i l o s f o r g r a v i t y loading. S i los r e d u c e t h e potential f o r s p i l - lage d u r i n g handling while p r o t e c t i n g t h e salt from exposure to moisture a n d humidity.

FIGURE 2-2 Top: Primary highway. Middle: Secondaryhighway. Bottom: Residential street.

22 HIGHWAY DEICING
TABLE 2-1 OFFICIAL SALT USE POLICIES IN VARIOUS STATES
Region and State Summary of General Policy
New England Connecticut
Massachusetts
New Hampshire
Middle Atlantic Maryland
West Virginia
Great Lakes Michigan
Ohio
Wisconsin
Plains Iowa
Kansas
West Colorado
- California
Salt applied at 215 lb/lane-mi on multilane roads; no more than 150 lb/lane-mi on two-lane state highways
Salt applied at less than 300 lb/lane-mi on state highways
Salt application guideline of 250 to 300 lb/lane-mi on state highways
Salt application guideline of 300 to 500 lb/lane-mi on state highways
Salt application guideline of 100 to 250 lb/lane-mi, usually mixed with abrasives, except in cities
Salt applied at 225 lb/lane-mi on primary highways. Salt and sand mixtures used on lower-priority roads, depending on storm temperature and severity
Salt applied at 200 to 300 lb/lane-mi on Interstate and primary highways; 100 to 200 lb/lane-mi, with abrasives on secondary roads; no more than 100 to 200 lb/lane-mi on low-priority roads
Salt application rates of 100 to 300 lb/lane-mi recommended; additional salt use restrictions related to pavement temperature in place
Salt applied at 150 lb/lane-mi (mixed with sand) on Interstates and other arterials; 100 lb/lane-mi on collectors; no salt used on local roads
Salt applied at 100 to 250 lb/lane-mi (mixed with sand) on Interstates, freeways, and other roads with 2,500+ ADT; less on roads with 750 to 2,500 ADT; no salt used on roads with < 750 ADT
Salt only with abrasives; rates not defined Salt applied at 500 lb/lane-mi on some mountain
highways
NOTE: Although policies often identify an ideal salt application rate for equipment cali- bration, they seldom regulate the timing and frequency of applications. Application timing and frequency are typically determined by the maintenance engineer in charge during the storm. Data in the table are from states that responded to relevant questions in survey. ADT = average daily traffic. SOURCE: TRB survey of state highway agencies.
SALT USE BY JURISDICTION AND REGION
Nationwide, there are more than 3.8 million mi of public highway and streets. Except for minor amounts of mileage on federal lands, practically all of these roads are maintained by state and local high-

Road Salt Use in the United States 23
TABLE 2-2 AVERAGE ANNUAL SALT LOADINGS ON STATE HIGHWAYS WHERE SALT IS NORMALLY APPLIED
Region and State Average Annual Loading (tons/lane-mile)
New England Maine Massachusetts New Hampshire Vermont
Middle Atlantic Delaware Maryland New Jersey New York Virginia West Virginia
Great Lakes Illinois Indiana Michigan Ohio Wisconsin
Plains Iowa Minnesota Missouri Nebraska Oklahoma South Dakota
Mountain and West Alaska California Idaho Nevada New Mexico
8.0 19.4 16.4 17.1
9.0 7.1 6.7
16.6 3.0 6.3
6.6 9.0
12.9 9.1 9.2
3.8 5.0 1.0 1.5 1.5 1.0
1.2 3.0 0.3 1.9 0.5
NOTE: Data are from only those states that responded to relevant , questions in survey. SOURCE: TRB survey of state highway agencies.
way agencies. As the data in Table 2-3 indicate, state highway agen- cies (including toll authorities) administer about 20 percent of this mileage, including all Interstates and virtually all other primary high- ways. Local governments (counties, cities, and towns) have juris- diction over about three-quarters of all mileage, although a large share consists of low-volume secondary roads and residential streets.
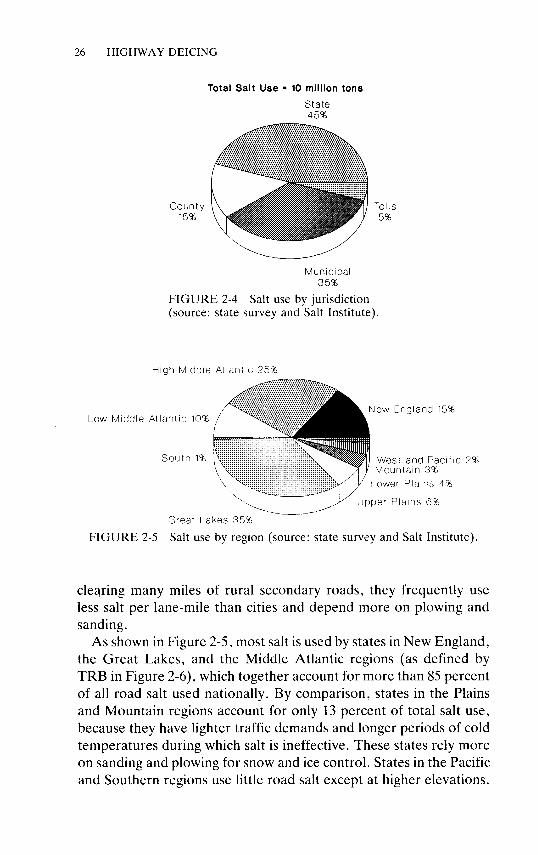
Figure 2-4 shows the share of total salt usage by state, toll, county, and municipal highway agencies, derived from Salt Institute data and
24 HIGHWAY DEICING
FIGURE 2-3 Highway maintenance yard. Top: Salt hopper andspreader truck. Bottom: Salt storage shed.
the survey of state highway agencies conducted for this study. Becauseof the heavy traffic demands on primary highways, states and tollauthorities are especially heavy users of salt, accounting for aboutone-half of all the salt used nationally. The next largest users aremunicipal agencies—especially large cities—which account for about35 percent of salt use. County highway agencies account for theremaining 15 percent. Because counties are often responsible for

TA
BL
E
2-3
RO
AD
M
ILE
AG
E
CL
ASS
IFIE
D
BY
FE
DE
RA
L-A
ID
SYST
EM
A
ND
JU
RIS
DIC
TIO
N
(FH
WA
19
89,
114-
116)
Fede
ral-
Aid
Sy
stem
M
ileag
e
Juri
sdic
tion
Stat
e an
d to
ll C
ount
y M
unic
ipal
Fe
dera
l
Tot
al
Inte
rsta
te
and
Oth
er
Prim
ary
300,
455
961
1,56
0 47
0
303,
446
Seco
ndar
y (R
ural
)
196,
503
193,
383
9,26
9 92
6
400,
081
Urb
an
33,9
96
27,4
30
85,5
34
75
147,
035
Non
-Fed
eral
-Aid
T
otal
M
ileag
e M
ileag
e
269,
297
800,
251
1,45
1,9
76
1,67
3,75
0 1,
116,
068
1,21
2,43
1 18
2,88
8 18
4,35
9
3,02
0,22
9 3,
870,
791
Perc
enta
ge
21
43
31
_5
100
26 HIGHWAY DEICING
Total Salt Use = 10 million tons
State 45%
County I
15% Tolls 5%
Municipal 35%
FIGURE 2-4 Salt use by jurisdiction (source: state survey and Salt Institute).
High Middle Atlantic 25%
Low Middle Atlantic l@% new England 15%
West and Pacific 2% Mountain 3%
Lower Plains 4%
Great Lakes 35%
upper Plains 6%
FIGURE 2-5 Salt use by region (source: state survey and Salt Institute).
clearing many miles of rural secondary roads, they frequently use less salt per lane-mile than cities and depend more on plowing and sanding.
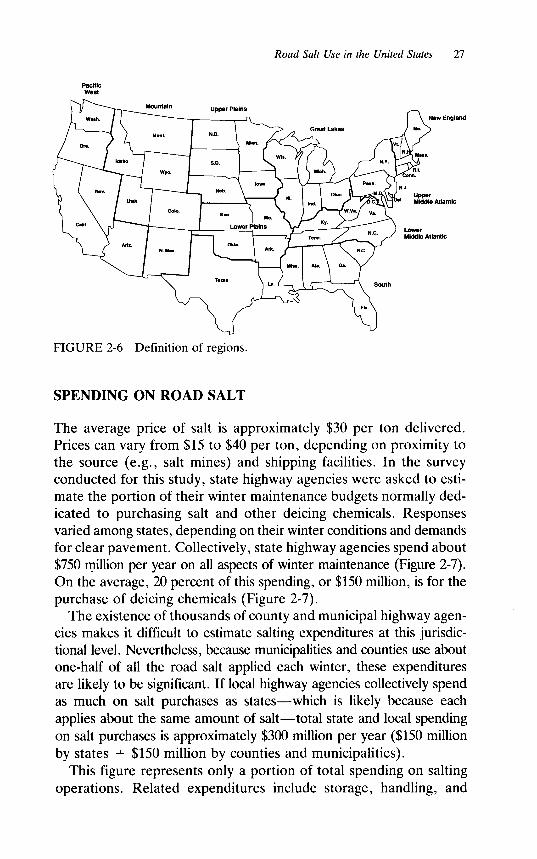
As shown in Figure 2-5, most salt is used by states in New England, the Great Lakes, and the Middle Atlantic regions (as defined by TRB in Figure 2-6) which together account for more than 85 percent of all road salt used nationally. By comparison, states in the Plains and Mountain regions account for only 13 percent of total salt use, because they have lighter traffic demands and longer periods of cold temperatures during which salt is ineffective. These states rely more on sanding and plowing for snow and ice control. States in the Pacific and Southern regions use little road salt except at higher elevations.
Road Salt Use in the United States 27
PacificWest
FIGURE 2-6 Definition of regions.
SPENDING ON ROAD SALT
The average price of salt is approximately $30 per ton delivered. Prices can vary from $15 to $40 per ton, depending on proximity to the source (e.g., salt mines) and shipping facilities. In the survey conducted for this study, state highway agencies were asked to esti- mate the portion of their winter maintenance budgets normally ded- icated to purchasing salt and other deicing chemicals. Responses varied among states, depending on their winter conditions and demands for clear pavement. Collectively, state highway agencies spend about $750 million per year on all aspects of winter maintenance (Figure 2-7). On the average, 20 percent of this spending, or $150 million, is for the purchase of deicing chemicals (Figure 2-7).
The existence of thousands of county and municipal highway agen- cies makes it difficult to estimate salting expenditures at this jurisdic- tional level. Nevertheless, because municipalities and counties use about one-half of all the road salt applied each winter, these expenditures are likely to be significant. If local highway agencies collectively spend as much on salt purchases as states-which is likely because each applies about the same amount of salt-total state and local spending on salt purchases is approximately $300 million per year ($150 million by states + $150 million by counties and municipalities).
This figure represents only a portion of total spending on salting operations. Related expenditures include storage, handling, and

28 HIGHWAY DEICING
Annual Spending by States l $750 million
Abrasives/Other 10%
Deicing Chemicals 20%
FIGURE 2-7 State spending on snow and ice control by type of expenditure (source: state survey and Salt Institute).
spreading. The New York State Department of Transportation, which accounts for about 10 percent of state-level spending on road salt, estimates that these other salt-related costs (e.g., equipment and labor for spreading, handling, and storage) average about $25 per ton of salt applied (personal communication, Assistant Commis- sioner for Operations of the New York State Department of Trans- portation). Hence, a rough national estimate of these costs can be developed by multiplying $25 by the 10 million tons of salt applied each winter in the United States. The result is $250 million per year.
These estimates of salt purchase and application costs suggest that total annual spending on road salting is slightly more than $500 million and represents about one-third of the $1.5 billion spent on winter maintenance activities each year.
DEICING BENEFITS
Among the benefits of deicing are fewer disruptions in trucking and other commercial traffic, smaller losses in work force productivity because of absent and tardy workers, and uninterrupted provision of emergency services, Presumably, deicing also improves highway safety, although no studies have demonstrated this effect unequi- vocally because of the many interrelated factors found in accident statistics (TRB 1974, 8).
These benefits, which are difficult to quantify, are widely acknowl- edged to be valuable to society. Hence, changes in deicing policies

Road Salt Use in the United States 29
or practices that threaten to reduce these benefits often arouse public concern and opposition.
MANAGING ROAD SALT
Whereas salt is an effective snow- and ice-control tool, its limitations require careful management. Recognizing both the importance of highway deicing and the adverse side effects of salt, many highway agencies have tried to control salt use without sacrificing deicing effectiveness. Management improvements have focused primarily on reducing excessive salt use or waste, for example, through personnel training , more accurat e and timely weather information, and better spreading equipment and techniques.
In some states computerized inventory methods that monitor salt usage by district and stockpile, and sometimes by truck, have been implemented. Combined with proper operator and supervisor train- ing, monitoring creates incentives to eliminate unnecessary salting. Likewise, improvements in spreading equipment and weather fore- casting have helped some highway agencies control salt use. For example, during the 1960s and 1970s, automatic, ground-oriented spreader controls were introduced to regulate salt discharge accord- ing to truck speed. Recently, some state and municipal highway agencies have started to contrac t with private weather services for storm advisories. The prediction of snow and ice conditions can shorten the lead time required to star t salting operations and, there- fore, reduce the amount of salt used unnecessarily when storm con- ditions do not develop as originally expected.
SUMMARY
Salt and other chemicals are important for highway snow and ice control. Approximately 10 million tons of salt is spread on the nation’s highways each winter. Most road salt is applied in the Northeast and Midwest. Salting is heaviest on high-volume highways and city streets, where traffic demands are greatest ; accordingly, many state and municipal highway agencies are heavy users of salt.
The price of road salt averages $30 per ton. Each year, state and local highway agencies spend about $300 million on salt purchases and another $250 million on storage , handling, and application . To control expenditures on salting and reduce its adverse side effects, many highway agencies are reevaluating the way they use salt. Better

30 HIGHWAY DEICING
management practices , equipment, and spreading techniques have improved both the effectiveness and the efficiency of many salting programs.
NOTE
1. When salt dissolves in water, the freezing point is depressed in proportion to the concentration of ions in solution. Because sodium chloride is very soluble in water and yields a large number of ions per unit weight, it is especially effective as a freezing point depressant , or ice melter.
REFERENCES
ABBREVIATIONS
FHWA Federal Highway Administration TRB Transportation Research Board
FHWA. 1989. Highway Statistics 1988. U.S. Department of Transportation. TRB. 1974. NCHRP Synthesis of Highway Practice 24: Minimizing Deicing
Chemical Use. National Research Council, Washington, D.C.