road safety barriers design guide appendices · roadside design guide (1996). this rate should be...
TRANSCRIPT

DEPARTMENT OF INFRASTRUCTURE ENERGY AND RESOURCES
ROAD SAFETY BARRIERS
DESIGN GUIDE
APPENDICES
Transport Infrastructure Branch

CONTENTS
APPENDIX A QUANTITATIVE EVALUATION OF TREATMENT OPTIONS......................................4 APPENDIX B A GUIDE FOR CONSIDERATION OF TREATMENT ...................................................12 APPENDIX C EXAMPLES OF CLEAR ZONE CALCULATIONS .......................................................13 APPENDIX D EXAMPLES OF LENGTH OF NEED CALCULATIONS...............................................17 GLOSSARY OF TERMS.................................................................................................................................31

TABLES Table A.1 — Crash Cost Related to Severity Index Summary Table ............................................................. 11 Table D.1 — Suggested Runout Lengths for Barrier Design.......................................................................... 19 Table D.2 — Angles of Departure from the Road .......................................................................................... 21
FIGURES Figure A.1 — Modelling Process for Rigid Object Evaluation......................................................................... 6 Figure A.2 — Horizontal Curve Correction Factors (EFC) ............................................................................... 7 Figure A.3 — Grade Correction Factors (EFg).................................................................................................. 7 Figure A.4 — Typical Roadway Types............................................................................................................. 8 Figure A.5 — Impact Zones for Rigid Roadside Objects ............................................................................... 10 Figure B.1 — A Risk Assessment Guide ........................................................................................................ 12 Figure C.1 — (Case 2a)................................................................................................................................... 13 Figure C.2 — (Case 1)..................................................................................................................................... 14 Figure C.3 — (Case 2b)................................................................................................................................... 15 Figure C.4 — (Case 1)..................................................................................................................................... 16 Figure D.1 — Runout Length Method of Determining Length of Need......................................................... 18 Figure D.2 — Angle of Departure Method of Determining Length of Need.................................................. 20 Figure D.3 — Layout of Example 1 ................................................................................................................ 21 Figure D.4 — Example 1 Options for Barrier Layout..................................................................................... 24 Figure D.5 — Example 1 using Angle of Departure Method.......................................................................... 26 Figure D.6 — Layout of Example 2 ................................................................................................................ 26 Figure D.7 — Example 2 Showing Barrier layouts......................................................................................... 29 Figure D.8 — Example 2 using Angle of Departure Method.......................................................................... 30

APPENDIX A QUANTITATIVE EVALUATION OF TREATMENT OPTIONS
Quantitative evaluation is described in Section 2.5.3. It involves the comparison of benefit cost ratios for various treatment options that may be available.
Once a roadside object is identified as a potential hazard (i.e. it is within the clear zone determined using the guidance in Section 2.4.7), the risk can be analysed and an annual cost of crashes computed. The same method can be used to analyse the risk and determine annual crash costs associated with treatment options. This information can then be used together with installation, construction and maintenance costs to undertake benefit cost analysis.
Methods used to assess risk and compute annual crash costs in various jurisdictions are similar but details may differ. Methods that may be used include the Road Safety Risk Manager (RSRM) developed by ARRB Group in association with Austroads and the “Roadside Impact Severity Calculator” (RISC) software developed by the Department of Main Roads, Queensland.
The current USA equivalent to RISC is the National Cooperative Highway Research Program (NCHRP) software entitled Roadside Safety Analysis Program (RSAP). Further information on this program is available in Appendix A of the Roadside Design Guide (AASHTO 2002). The program is intended as a tool for economic analysis and should not supersede the guidelines in the Roadside Design Guide or sound engineering judgement. It carries no guarantees or warranties from AASHTO.
Road Safety Risk Manager
The RSRM has been developed to provide road safety professionals with a tool to proactively assess road safety hazards and treatments for the purpose of prioritising actions. The tool adopts a risk management approach, with the ultimate aim of maximising the risk reduction on the road network for a given budget. RSRM provides a method to evaluate treatments and assist designers in making optimal investment decisions. It enables relative risks to be examined for different treatments at a site, including those associated with proposals to provide safety barriers.
RSRM is specifically focussed on the prioritisation of appropriate treatments. It is not a replacement for sound engineering judgement. The method calculates a risk reduction to cost ratio (Discounted Risk Reduction / Discounted Costs) and uses this as the basis for prioritisation of treatments.
Roadside Impact Severity Calculator
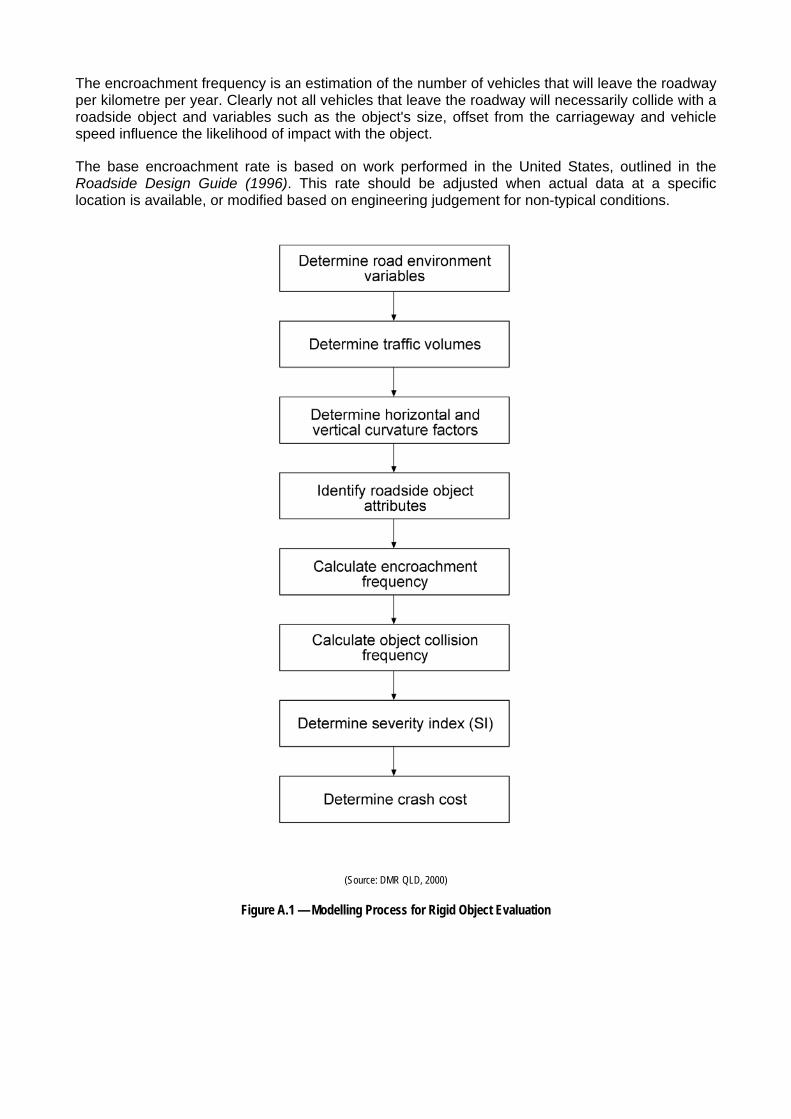
The RISC method and process is illustrated in Figure A.1 and described below. It determines the crash frequency for objects and calculates annual crash costs based on the likely severity of impacts. These crash costs can be used as the basis for an economic analysis described in Section 2.5.3. The steps in the RISC process to determine crash costs comprise:
(a) Determine road environment variables
Road environment variables define the roadway characteristics and are used to determine the base encroachment frequency (the number of expected encroachments per kilometre per year).

The following variables are required:
Road type - the three general road types are divided, undivided and one-way.
Number of lanes - the number of lanes on each carriageway.
Width of lanes - the width of the marked lanes.
85th percentile speed - if unavailable then the posted limit can be used.
(b)Determine traffic volumes
The current traffic volume of the road can be determined from traffic survey counts.
The traffic volume is then divided into the number of carriageways. For example, on a two-lane two-way road, the traffic volume would remain unchanged (i.e. it is a single carriageway), whereas for a four lane divided facility, the volume is divided by two. If a split of traffic other than 50/50 is evident, then the traffic volumes can be proportioned to each carriageway accordingly.
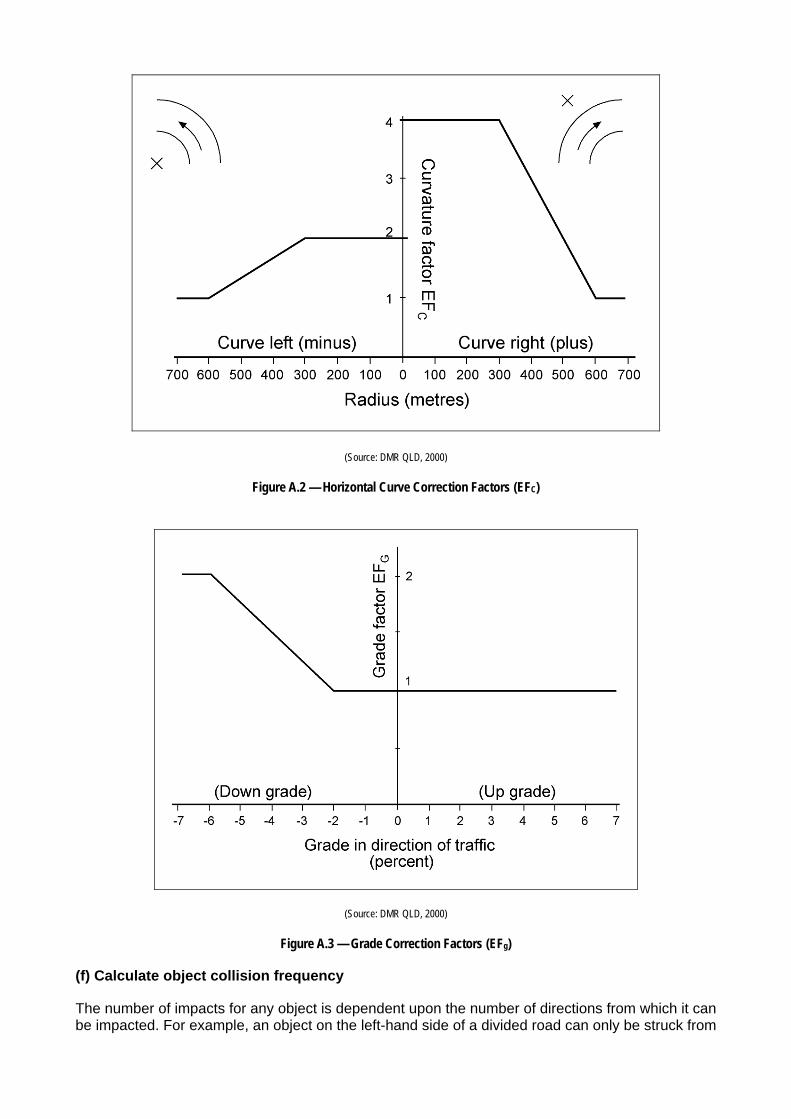
(c) Determine curvature and grade factors
Figures A2 and A3 provide adjustment factors for road curvature (EFc) and for longitudinal grade (EFg) respectively. These figures modify the encroachment frequency, due to the increased probability of a vehicle leaving the road on horizontal curves or grades.
(d) Identify roadside object attributes
The following attributes, in combination with vehicle speed and road curvature, define the probability of impact with the object:
horizontal offset of object from the edge of the travelled way
object length
object width.
(e) Calculate encroachment frequency
The likelihood of a vehicle leaving the roadway under particular circumstances is then determined using the following relationship:
( )( )( )( )( )UGC EFEFEFAADTBEREF =
Where:
EF Encroachment Frequency (encroachments/year/km)
BER Base Encroachment Rate (0.00030 enc/km/year/vpd)
AADT Annual Average Daily Traffic
EFc- Curvature factor (refer Figure B2)
EFg Grade factor (refer Figure B3)
Efu User factor (Used at discretion of engineer to accommodate special circumstances)
The encroachment frequency is an estimation of the number of vehicles that will leave the roadway per kilometre per year. Clearly not all vehicles that leave the roadway will necessarily collide with a roadside object and variables such as the object's size, offset from the carriageway and vehicle speed influence the likelihood of impact with the object.
The base encroachment rate is based on work performed in the United States, outlined in the Roadside Design Guide (1996). This rate should be adjusted when actual data at a specific location is available, or modified based on engineering judgement for non-typical conditions.
(Source: DMR QLD, 2000)
Figure A.1 — Modelling Process for Rigid Object Evaluation
(Source: DMR QLD, 2000)
Figure A.2 — Horizontal Curve Correction Factors (EFC)
(Source: DMR QLD, 2000)
Figure A.3 — Grade Correction Factors (EFg)
(f) Calculate object collision frequency
The number of impacts for any object is dependent upon the number of directions from which it can be impacted. For example, an object on the left-hand side of a divided road can only be struck from
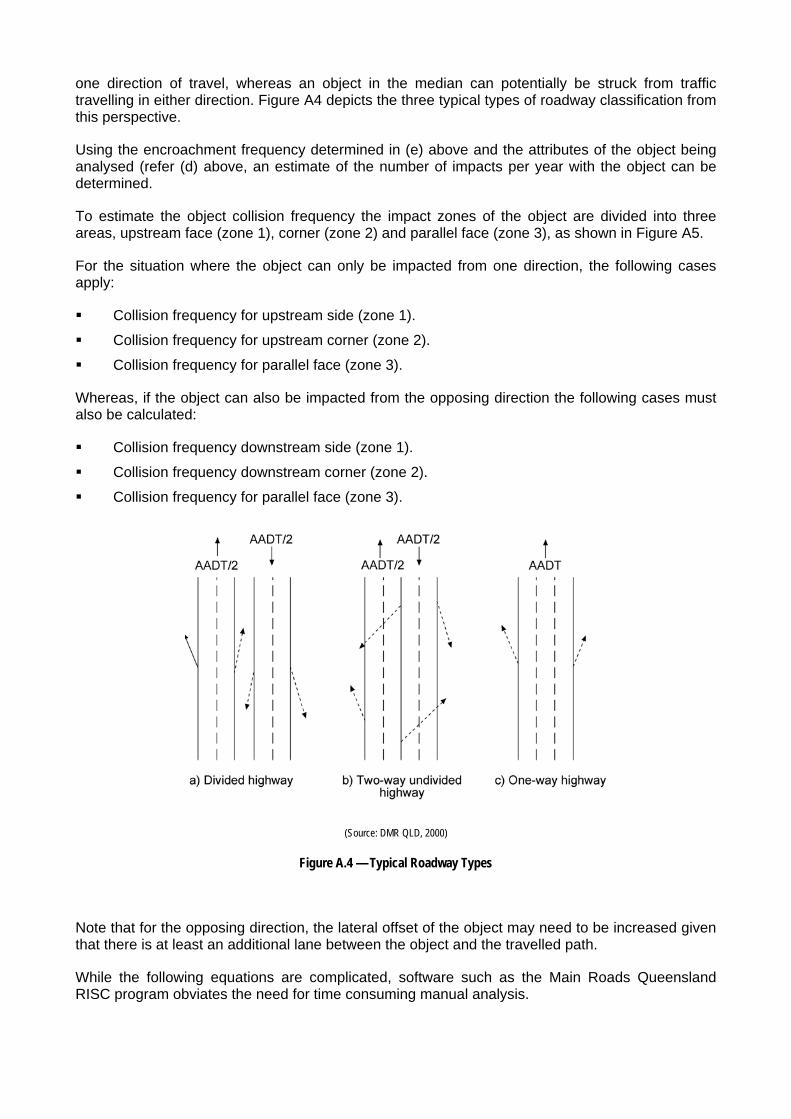
one direction of travel, whereas an object in the median can potentially be struck from traffic travelling in either direction. Figure A4 depicts the three typical types of roadway classification from this perspective.
Using the encroachment frequency determined in (e) above and the attributes of the object being analysed (refer (d) above, an estimate of the number of impacts per year with the object can be determined.
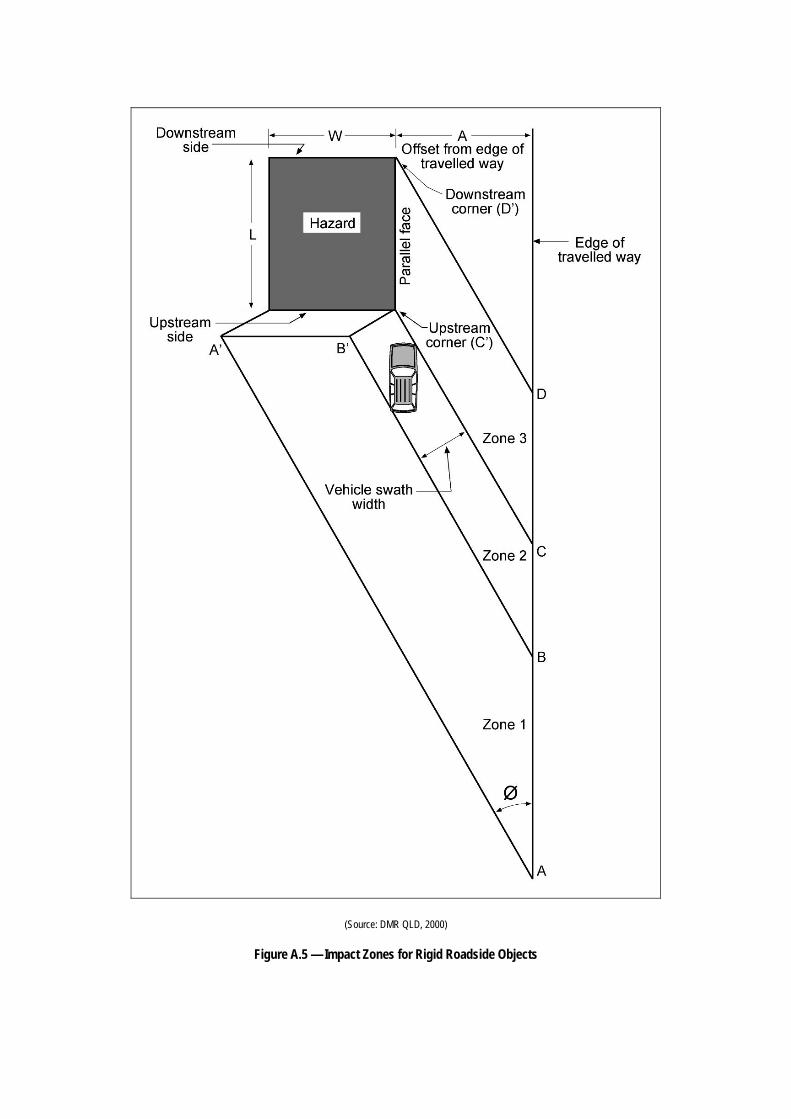
To estimate the object collision frequency the impact zones of the object are divided into three areas, upstream face (zone 1), corner (zone 2) and parallel face (zone 3), as shown in Figure A5.
For the situation where the object can only be impacted from one direction, the following cases apply:
Collision frequency for upstream side (zone 1).
Collision frequency for upstream corner (zone 2).
Collision frequency for parallel face (zone 3).
Whereas, if the object can also be impacted from the opposing direction the following cases must also be calculated:
Collision frequency downstream side (zone 1).
Collision frequency downstream corner (zone 2).
Collision frequency for parallel face (zone 3).
(Source: DMR QLD, 2000)
Figure A.4 — Typical Roadway Types
Note that for the opposing direction, the lateral offset of the object may need to be increased given that there is at least an additional lane between the object and the travelled path.
While the following equations are complicated, software such as the Main Roads Queensland RISC program obviates the need for time consuming manual analysis.

( ) ( ) 1000/1cos)tan
1(1
⎥⎦
⎤⎢⎣
⎡−++= ∑
=
W
iiSWALEPEFCFUS φ
φ
( ) ( ) 1000/cos1sin
11
⎥⎦
⎤⎢⎣
⎡−+⎟⎟
⎠
⎞⎜⎜⎝
⎛= ∑
=
W
iiALEPEFCFUC φ
φ
( )( ) ( ) 1000/ALEPLEFCFFA =
Where:
CFUS = Collision frequency for the upstream side
CFUC = Collision frequency for the upstream corner
CFFA = Collision frequency for the parallel face
LEP = Lateral extent probability
f = Encroachment angle (degrees)
SW = Swath width (3.6 m)
EF = Encroachment Frequency (enc/km/y)
A = Lateral Offset of Object (m)
W = Width of object (m)
When determining the impacts for traffic travelling in lanes other than the lane closest to the hazard (e.g. traffic travelling in the opposite direction), it is important to increase the offset of the feature to reflect the increased distance to the travel lane. The variable (A) is replaced with:
A+ (number of adjacent lanes) x (lane width)
The total number of impacts per year for the object is given by:
CFFACFUCCFUSYEARIMPACTS ++=/
(Source: DMR QLD, 2000)
Figure A.5 — Impact Zones for Rigid Roadside Objects

(g) Determine Severity Index (SI) for object
Once the collision frequency has been calculated for the roadside object, it is necessary to assign severity values. As discussed earlier, the severity index defines the severity of the outcome of an impact with a particular roadside feature. Table 2.1 outlines suggested Severity Indices for particular features and three ranges of design speed. Other jurisdictions may have a different system, for example, DMR Queensland has a more detailed matrix of SIs for use in the RISC program. It is important to note the values in Table 2.1 are a guide and engineering judgement may be applied to determine appropriate values for particular situations.
A separate Severity Index for each impact zone of the hazard should be applied. This process is automated when software such as RISC is used.
(h) Determine crash costs
Once the number of crashes that can be expected at a given location and the object’s severity index is known, the expected crash cost per year can be calculated using the following relationship. Table A1 shows an example of typical costs of crashes related to the severity index. The costs are based on a vehicle occupancy of one and the proportion of crash outcome types.
Annual Crash Costs per Year ($) = (Impacts per Year) x (SI Crash Cost per impact)
Where:
Impacts per year is the collision frequency calculated in (f) above
The crash costs so determined can be used as the basis for an economic analysis as described in Section 2.5.3.
Table A.1 — Crash Cost Related to Severity Index Summary Table
Severity Index (SI)
Property Damage
Minor Injury Medical Treatment
Hospitalisation Fatal Cost $
0 0 0 0 0 0 0 0.5 100 0 0 0 0 3,750 1 90.4 7.3 2.3 0 0 7,879 2 71 22 7 0 0 16,282 3 43 34 21 1 1 31,353 4 30 30 32 5 3 61,323 5 15 22 45 10 8 123,404 6 7 16 39 20 18 243,518 7 2 10 28 30 30 383,458 8 0 4 19 27 50 582,707 9 0 0 7 18 75 822,304 10 0 0 0 0 100 1,046,600
Note: Source: RTA NSW. Provided as an example only. This table will vary between jurisdictions because categories used to define the level of injury differ and the costs associated with them differ.

APPENDIX B A GUIDE FOR CONSIDERATION OF TREATMENT The risk assessment guide shown in Figure B1 may be used with information about the severity index (Figure 2.1) and number of collisions to make a judgement about the need for the hazard to be modified or shielded, or for some other preventative treatment to be implemented. It may also be used for ranking various projects within a finite budget. The definitions applied to the areas of the graph are:
Urgent – work required for short term mitigation of the hazard should commence immediately.
High Risk – consider site for ranking in the current works program.
Medium – consider for inclusion in a long term program.
Low – project can be deferred.
(Source: RTA 1996)
Figure B.1 — A Risk Assessment Guide
APPENDIX C EXAMPLES OF CLEAR ZONE CALCULATIONS Example 1:
Design AADT: 4000 vpd
Design Speed: 100 km/h
Alignment: 700 m radius horizontal curve
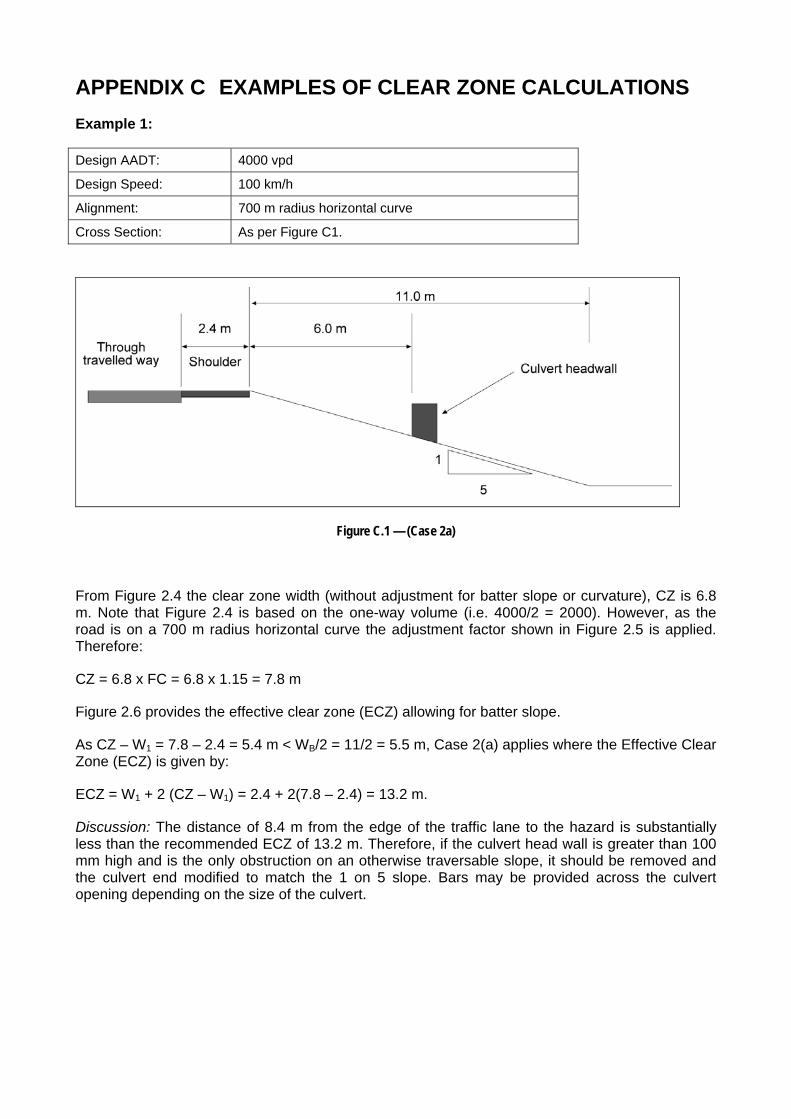
Cross Section: As per Figure C1.
Figure C.1 — (Case 2a)
From Figure 2.4 the clear zone width (without adjustment for batter slope or curvature), CZ is 6.8 m. Note that Figure 2.4 is based on the one-way volume (i.e. 4000/2 = 2000). However, as the road is on a 700 m radius horizontal curve the adjustment factor shown in Figure 2.5 is applied. Therefore:
CZ = 6.8 x FC = 6.8 x 1.15 = 7.8 m
Figure 2.6 provides the effective clear zone (ECZ) allowing for batter slope.
As CZ – W1 = 7.8 – 2.4 = 5.4 m < WB/2 = 11/2 = 5.5 m, Case 2(a) applies where the Effective Clear Zone (ECZ) is given by:
ECZ = W1 + 2 (CZ – W1) = 2.4 + 2(7.8 – 2.4) = 13.2 m.
Discussion: The distance of 8.4 m from the edge of the traffic lane to the hazard is substantially less than the recommended ECZ of 13.2 m. Therefore, if the culvert head wall is greater than 100 mm high and is the only obstruction on an otherwise traversable slope, it should be removed and the culvert end modified to match the 1 on 5 slope. Bars may be provided across the culvert opening depending on the size of the culvert.
Depending on the size of the culvert, if the batter contains rough outcrops of boulders that are a similar hazard to the head wall then it is necessary to consider improvement of the batter together with removal of the head wall. If batter improvement is impracticable an evaluation should be undertaken of the provision of a barrier and the “do nothing” option. A decision to do nothing should take into account the relative risks and benefits of improving this particular culvert compared to other hazardous situations along the road and throughout the road network.
Example 2:
Design AADT: 11000 vpd
Design Speed: 80 km/h
Alignment: 300 m radius horizontal curve
Trees Avenue on the approach to a rural township; trees healthy and on outside of curve; tree removal sensitive in terms of the environment and heritage; tree diameters > 300 mm.
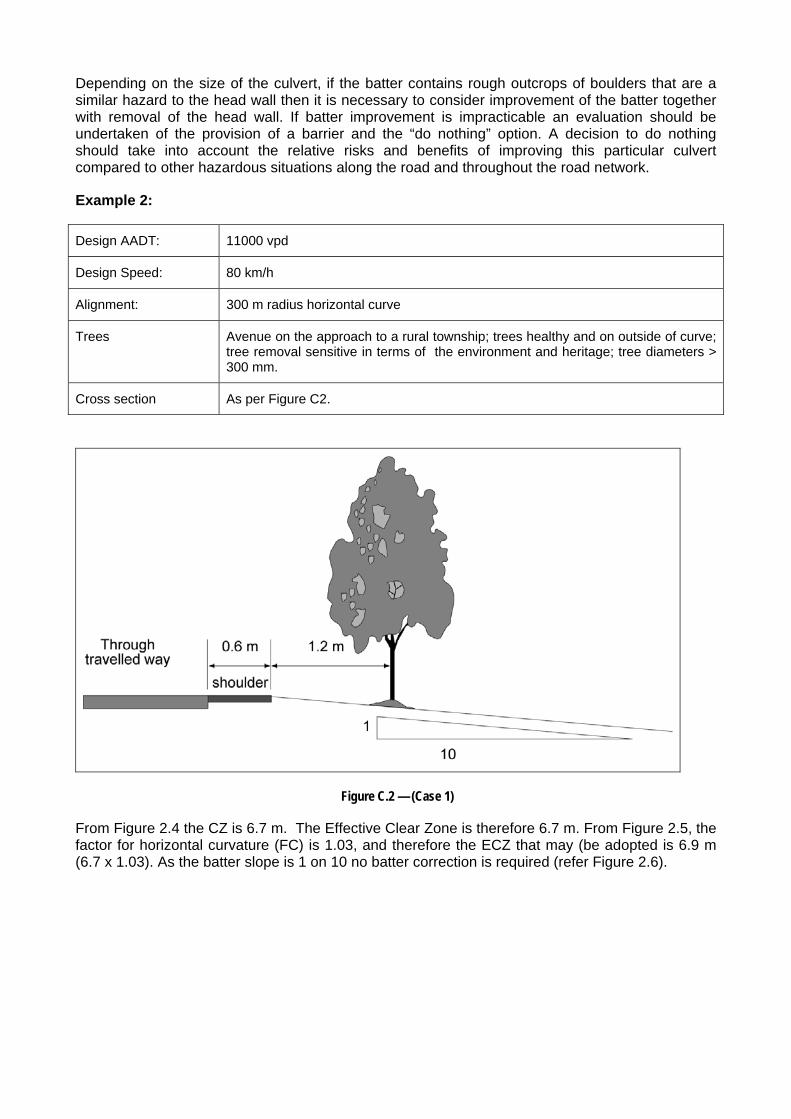
Cross section As per Figure C2.
Figure C.2 — (Case 1)
From Figure 2.4 the CZ is 6.7 m. The Effective Clear Zone is therefore 6.7 m. From Figure 2.5, the factor for horizontal curvature (FC) is 1.03, and therefore the ECZ that may (be adopted is 6.9 m (6.7 x 1.03). As the batter slope is 1 on 10 no batter correction is required (refer Figure 2.6).
As the distance from the edge of traffic lane to the trees is only 1.8 m and the EFC is 6.9 m the trees are a significant hazard to any errant vehicle. If the area has a significant number of off road rashes and it is not possible to remove the trees, the provision of a safety barrier should be considered to shield the trees. On the other hand, if the section of road has no significant history of off road crashes and all other trees are set back at the same or a slightly greater distance, this particular tree may not require treatment. If, however, most of the other trees are set back at a distance approximating the clear zone, this individual tree would represent a more significant hazard and should be considered for removal.
If a barrier is necessary to address off road crashes and considering that the tree is set back only 1.2 m from the hinge point, it is unlikely that the deflection of a flexible barrier could be accommodated. As the batter is traversable and has a slope of only 1 on 10 a semi-rigid barrier placed a distance in front of the tree that would accommodate its deflection would be most appropriate.
Example 3:
Design AADT: 800 vpd
Design Speed: 80 km/h
Alignment: Straight road
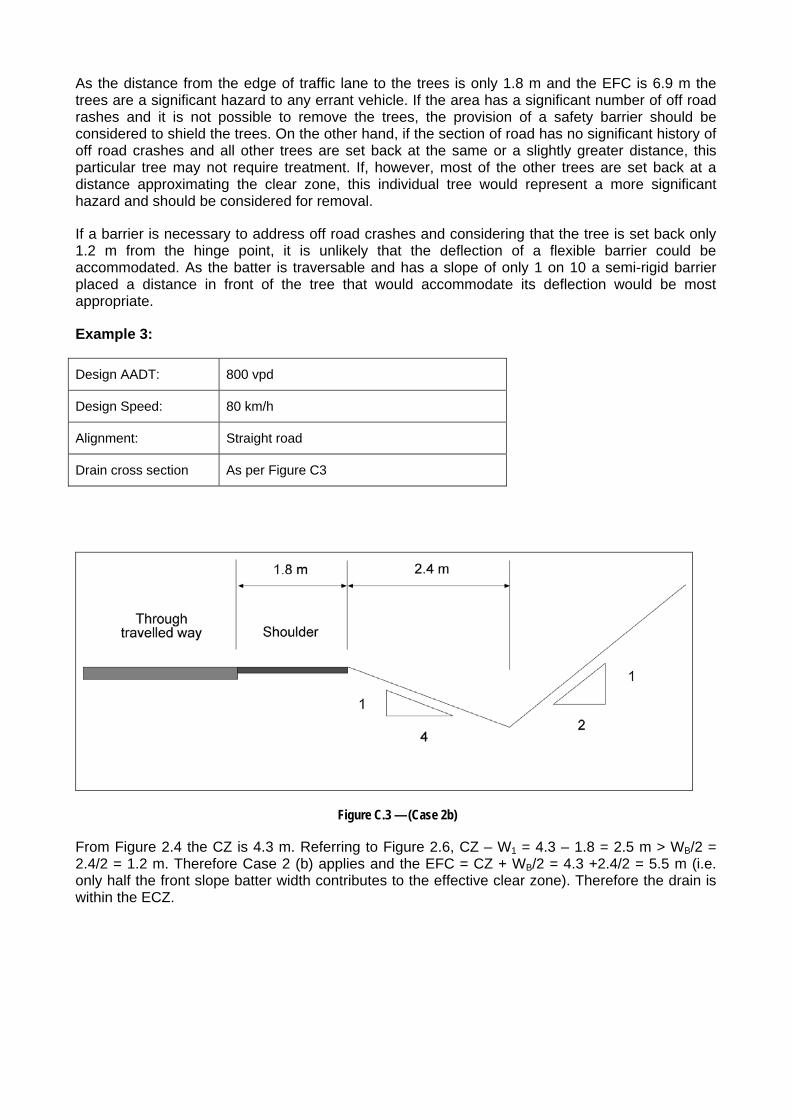
Drain cross section As per Figure C3
Figure C.3 — (Case 2b)
From Figure 2.4 the CZ is 4.3 m. Referring to Figure 2.6, CZ – W1 = 4.3 – 1.8 = 2.5 m > WB/2 = 2.4/2 = 1.2 m. Therefore Case 2 (b) applies and the EFC = CZ + WB/2 = 4.3 +2.4/2 = 5.5 m (i.e. only half the front slope batter width contributes to the effective clear zone). Therefore the drain is within the ECZ.
As the bottom of the drain does not have a flat or rounded bottom it is categorised as having abrupt slope changes. It can be seen that the drain does not fall within the preferred cross section shown in Figure 2-11 and should desirably be re-shaped to comply or be relocated outside the clear zone if this is practicable.
As the road is straight, and if the drain bottom and back slope are free of obstacles, no improvement is likely to be necessary. A similar cross section on the outside of a curve would probably be treated because of the increased likelihood of encroachments and the higher angles of impact.
Example 4:
Design AADT: 3000 vpd
Design Speed: 100 km/h
Alignment: Straight
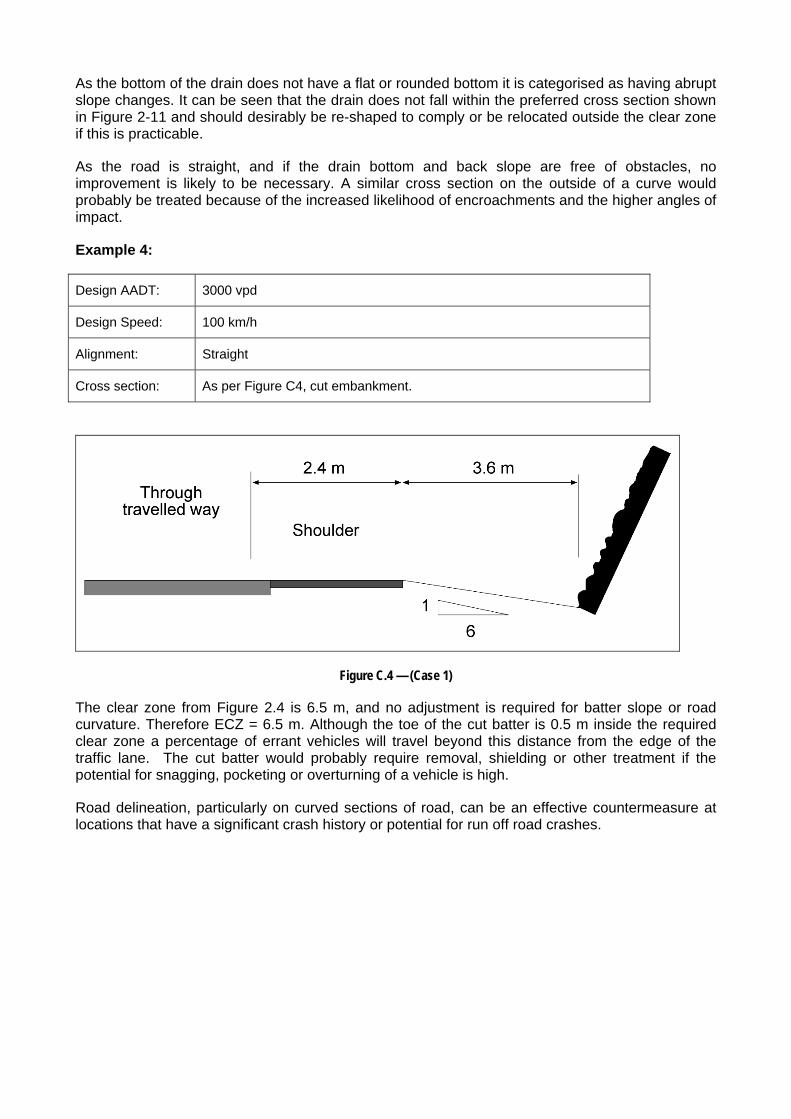
Cross section: As per Figure C4, cut embankment.
Figure C.4 — (Case 1)
The clear zone from Figure 2.4 is 6.5 m, and no adjustment is required for batter slope or road curvature. Therefore ECZ = 6.5 m. Although the toe of the cut batter is 0.5 m inside the required clear zone a percentage of errant vehicles will travel beyond this distance from the edge of the traffic lane. The cut batter would probably require removal, shielding or other treatment if the potential for snagging, pocketing or overturning of a vehicle is high.
Road delineation, particularly on curved sections of road, can be an effective countermeasure at locations that have a significant crash history or potential for run off road crashes.
APPENDIX D EXAMPLES OF LENGTH OF NEED CALCULATIONS
The two methods currently used in Australasia for determining the length of roadside barrier required to shield a hazard are presented in section 5 of this guide. The American Association of State Highway and Transportation Officials (AASHTO) suggest the use of the run-out length method for determining the ‘length of need’ of a barrier and acknowledges that some jurisdictions choose to use an alternative method based on the vehicle angle of departure from the road. In Australasia many jurisdictions use the run-out length method whereas the Roads and Traffic Authority (RTA) of New South Wales uses the “Angle of Departure” method. Each example in this appendix is calculated using both methods.
D.1 Run-out Length Method
This method is presented in section 5.2.3 and figures, tables and formulae are reproduced below for convenience with respect to the examples provided. Application of the run-out length method to establish barrier “Length of Need” for both traffic in the adjacent lane, and for opposing traffic, is illustrated in Figure D1. On a two-lane two-way road, and for medians, these requirements are combined to develop a design layout that protects traffic from both directions.
The layout of barriers on straight or nearly straight sections of road is established by applying the following formulae. Dimension “X” is the required Length of Need in advance of the area of concern (hazard) and can be calculated from the following equations.
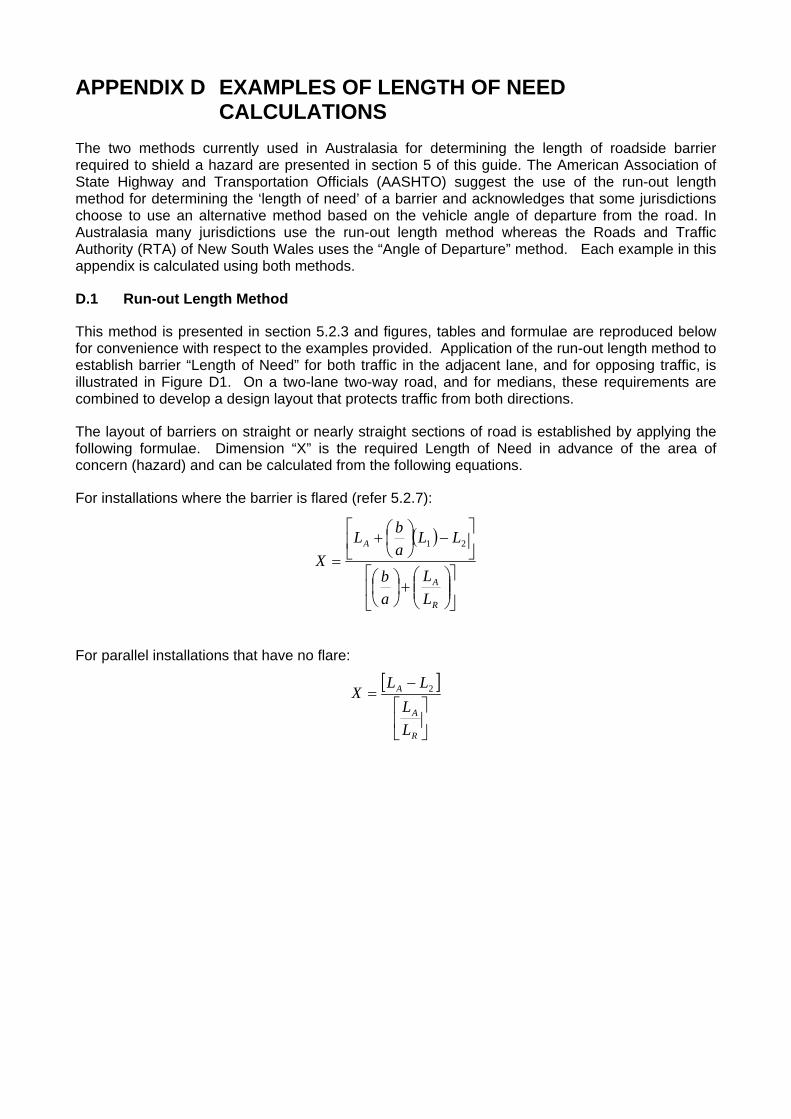
For installations where the barrier is flared (refer 5.2.7):
( )
⎥⎦
⎤⎢⎣
⎡⎟⎟⎠
⎞⎜⎜⎝
⎛+⎟
⎠⎞
⎜⎝⎛
⎥⎦
⎤⎢⎣
⎡−⎟
⎠⎞
⎜⎝⎛+
=
R
A
A
LL
ab
LLabL
X21
For parallel installations that have no flare:
[ ]
⎥⎦
⎤⎢⎣
⎡−
=
R
A
A
LL
LLX 2
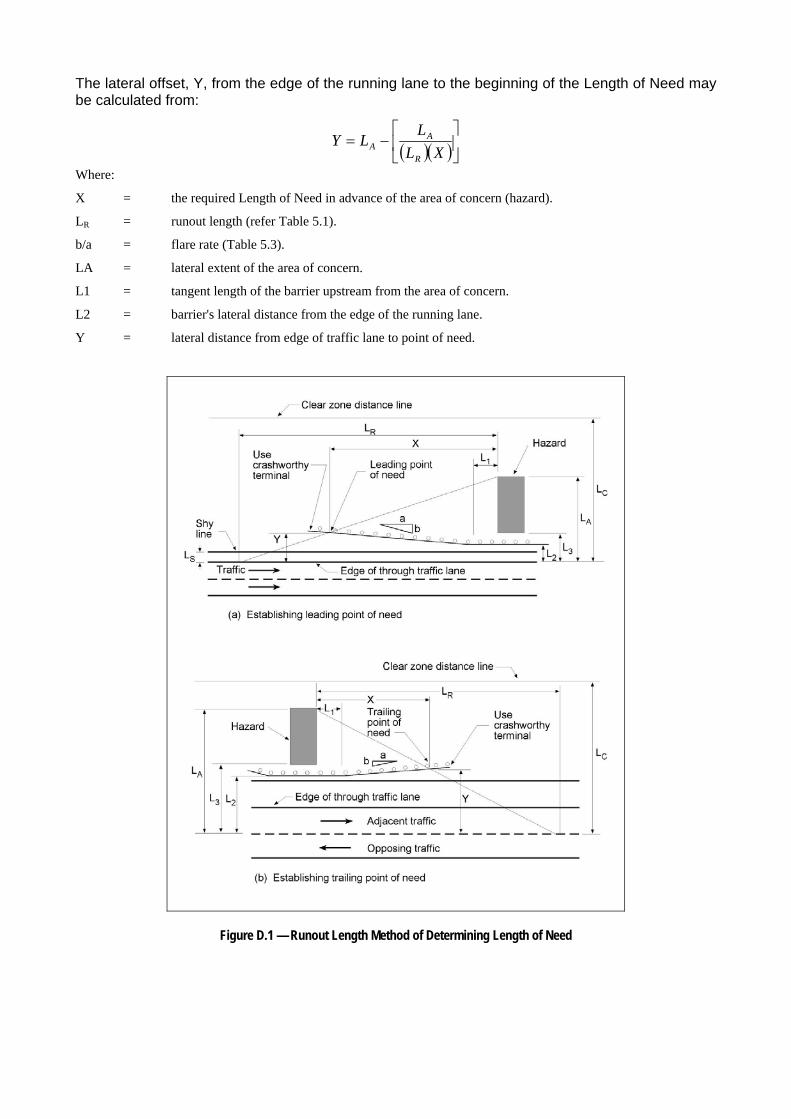
The lateral offset, Y, from the edge of the running lane to the beginning of the Length of Need may be calculated from:
( )( )⎥⎦⎤
⎢⎣
⎡−=
XLL
LYR
AA
Where:
X = the required Length of Need in advance of the area of concern (hazard).
LR = runout length (refer Table 5.1).
b/a = flare rate (Table 5.3).
LA = lateral extent of the area of concern.
L1 = tangent length of the barrier upstream from the area of concern.
L2 = barrier's lateral distance from the edge of the running lane.
Y = lateral distance from edge of traffic lane to point of need.
Figure D.1 — Runout Length Method of Determining Length of Need
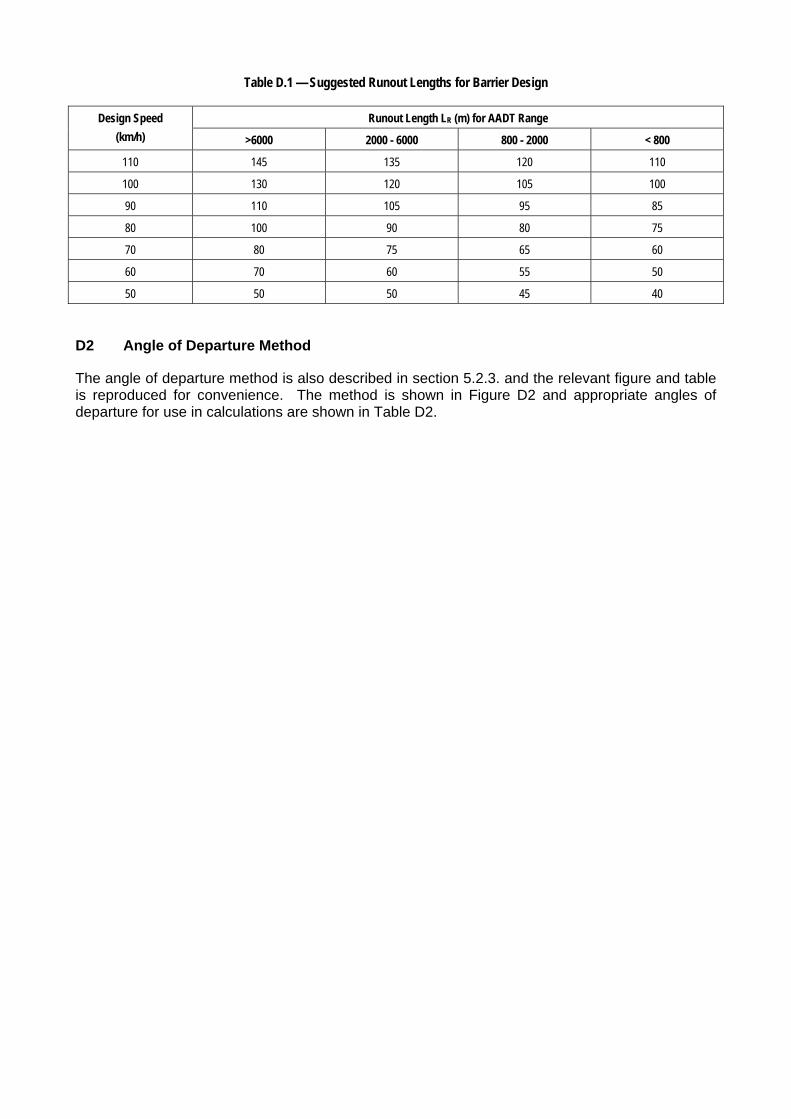
Table D.1 — Suggested Runout Lengths for Barrier Design
Runout Length LR (m) for AADT Range Design Speed (km/h) >6000 2000 - 6000 800 - 2000 < 800
110 145 135 120 110
100 130 120 105 100
90 110 105 95 85
80 100 90 80 75
70 80 75 65 60
60 70 60 55 50
50 50 50 45 40
D2 Angle of Departure Method
The angle of departure method is also described in section 5.2.3. and the relevant figure and table is reproduced for convenience. The method is shown in Figure D2 and appropriate angles of departure for use in calculations are shown in Table D2.
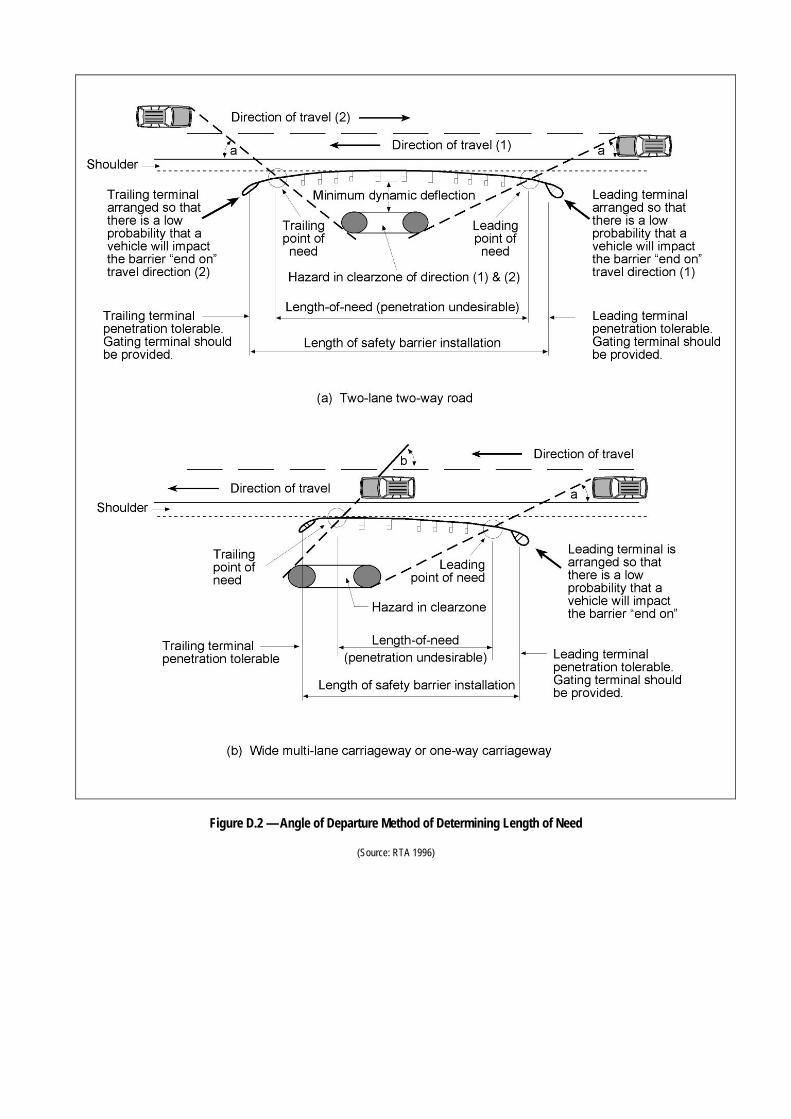
Figure D.2 — Angle of Departure Method of Determining Length of Need
(Source: RTA 1996)
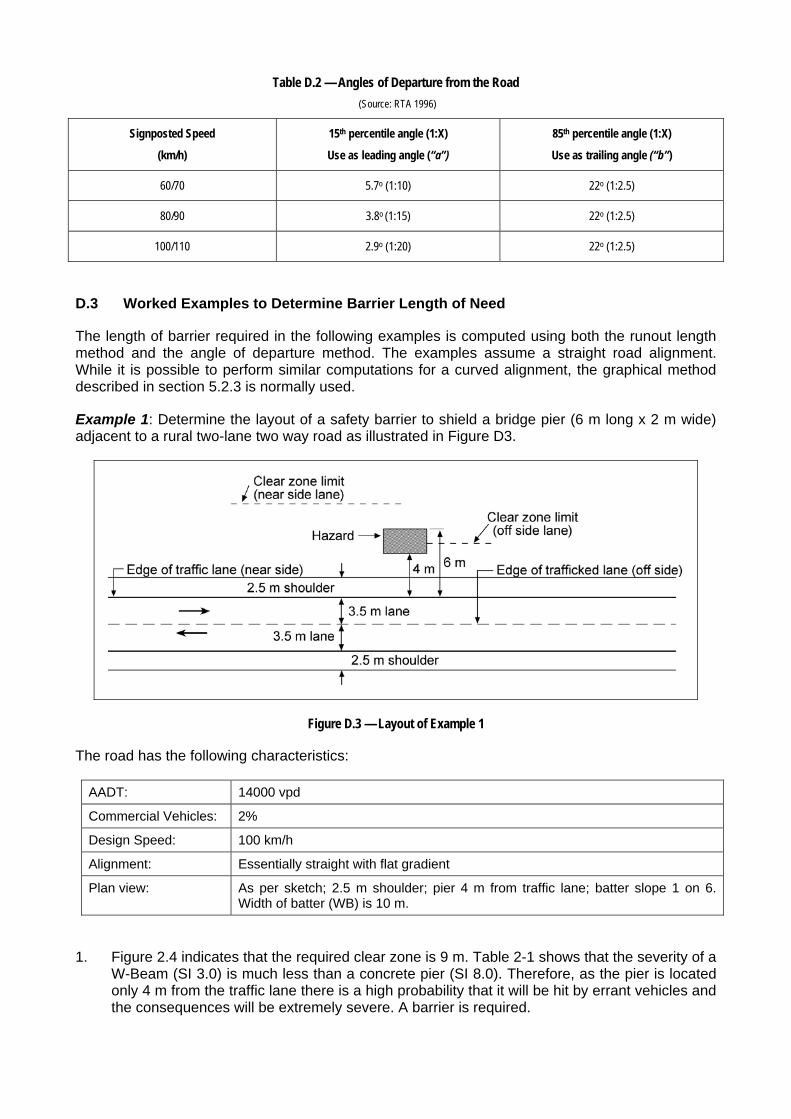
Table D.2 — Angles of Departure from the Road (Source: RTA 1996)
Signposted Speed
(km/h)
15th percentile angle (1:X)
Use as leading angle (“a”)
85th percentile angle (1:X)
Use as trailing angle (“b”)
60/70 5.7o (1:10) 22o (1:2.5)
80/90 3.8o (1:15) 22o (1:2.5)
100/110 2.9o (1:20) 22o (1:2.5)
D.3 Worked Examples to Determine Barrier Length of Need
The length of barrier required in the following examples is computed using both the runout length method and the angle of departure method. The examples assume a straight road alignment. While it is possible to perform similar computations for a curved alignment, the graphical method described in section 5.2.3 is normally used.
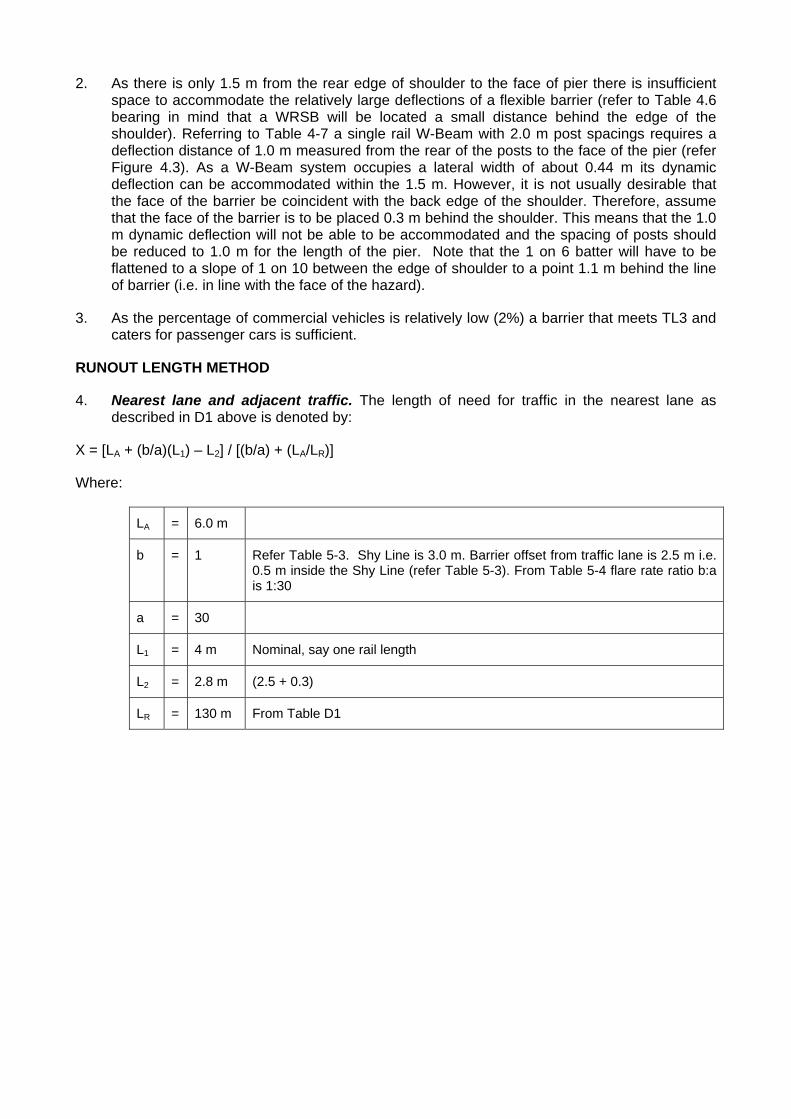
Example 1: Determine the layout of a safety barrier to shield a bridge pier (6 m long x 2 m wide) adjacent to a rural two-lane two way road as illustrated in Figure D3.
Figure D.3 — Layout of Example 1
The road has the following characteristics:
AADT: 14000 vpd
Commercial Vehicles: 2%
Design Speed: 100 km/h
Alignment: Essentially straight with flat gradient
Plan view: As per sketch; 2.5 m shoulder; pier 4 m from traffic lane; batter slope 1 on 6. Width of batter (WB) is 10 m.
1. Figure 2.4 indicates that the required clear zone is 9 m. Table 2-1 shows that the severity of a W-Beam (SI 3.0) is much less than a concrete pier (SI 8.0). Therefore, as the pier is located only 4 m from the traffic lane there is a high probability that it will be hit by errant vehicles and the consequences will be extremely severe. A barrier is required.
2. As there is only 1.5 m from the rear edge of shoulder to the face of pier there is insufficient space to accommodate the relatively large deflections of a flexible barrier (refer to Table 4.6 bearing in mind that a WRSB will be located a small distance behind the edge of the shoulder). Referring to Table 4-7 a single rail W-Beam with 2.0 m post spacings requires a deflection distance of 1.0 m measured from the rear of the posts to the face of the pier (refer Figure 4.3). As a W-Beam system occupies a lateral width of about 0.44 m its dynamic deflection can be accommodated within the 1.5 m. However, it is not usually desirable that the face of the barrier be coincident with the back edge of the shoulder. Therefore, assume that the face of the barrier is to be placed 0.3 m behind the shoulder. This means that the 1.0 m dynamic deflection will not be able to be accommodated and the spacing of posts should be reduced to 1.0 m for the length of the pier. Note that the 1 on 6 batter will have to be flattened to a slope of 1 on 10 between the edge of shoulder to a point 1.1 m behind the line of barrier (i.e. in line with the face of the hazard).
3. As the percentage of commercial vehicles is relatively low (2%) a barrier that meets TL3 and caters for passenger cars is sufficient.
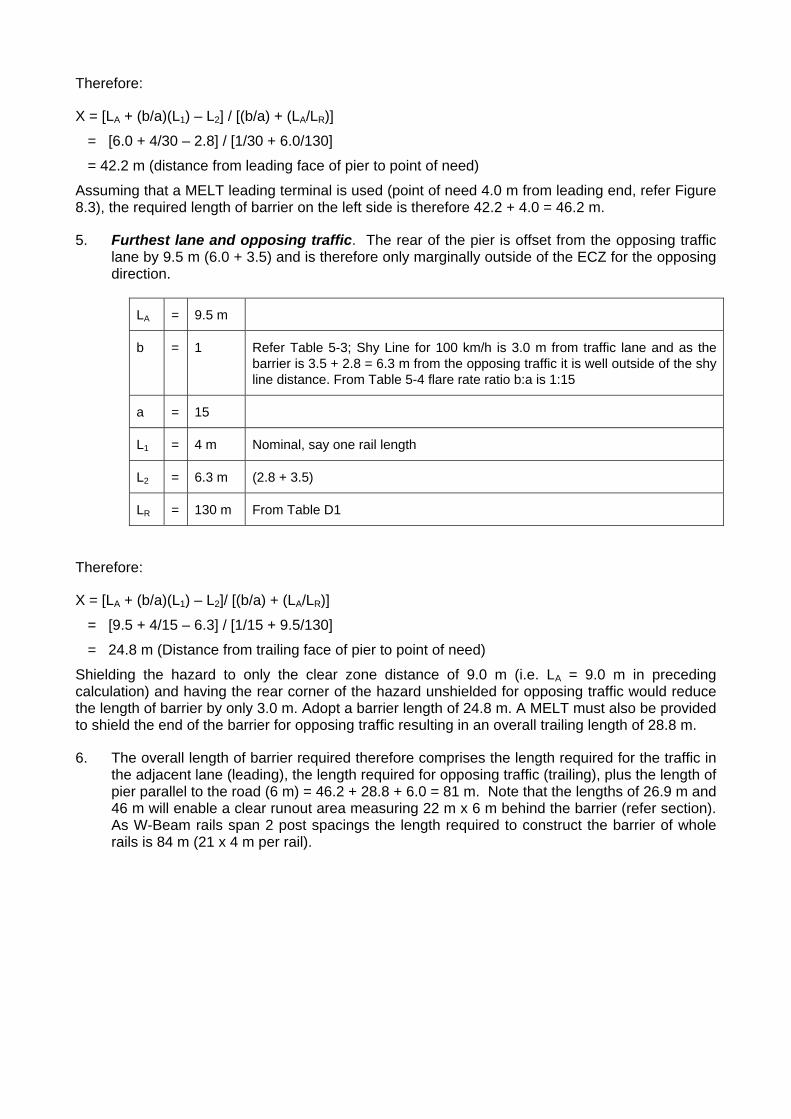
RUNOUT LENGTH METHOD
4. Nearest lane and adjacent traffic. The length of need for traffic in the nearest lane as described in D1 above is denoted by:
X = [LA + (b/a)(L1) – L2] / [(b/a) + (LA/LR)]
Where:
LA = 6.0 m
b = 1 Refer Table 5-3. Shy Line is 3.0 m. Barrier offset from traffic lane is 2.5 m i.e. 0.5 m inside the Shy Line (refer Table 5-3). From Table 5-4 flare rate ratio b:a is 1:30
a = 30
L1 = 4 m Nominal, say one rail length
L2 = 2.8 m (2.5 + 0.3)
LR = 130 m From Table D1
Therefore:
X = [LA + (b/a)(L1) – L2] / [(b/a) + (LA/LR)]
= [6.0 + 4/30 – 2.8] / [1/30 + 6.0/130]
= 42.2 m (distance from leading face of pier to point of need)
Assuming that a MELT leading terminal is used (point of need 4.0 m from leading end, refer Figure 8.3), the required length of barrier on the left side is therefore 42.2 + 4.0 = 46.2 m.
5. Furthest lane and opposing traffic. The rear of the pier is offset from the opposing traffic lane by 9.5 m (6.0 + 3.5) and is therefore only marginally outside of the ECZ for the opposing direction.
LA = 9.5 m
b = 1 Refer Table 5-3; Shy Line for 100 km/h is 3.0 m from traffic lane and as the barrier is 3.5 + 2.8 = 6.3 m from the opposing traffic it is well outside of the shy line distance. From Table 5-4 flare rate ratio b:a is 1:15
a = 15
L1 = 4 m Nominal, say one rail length
L2 = 6.3 m (2.8 + 3.5)
LR = 130 m From Table D1
Therefore:
X = [LA + (b/a)(L1) – L2]/ [(b/a) + (LA/LR)]
= [9.5 + 4/15 – 6.3] / [1/15 + 9.5/130]
= 24.8 m (Distance from trailing face of pier to point of need)
Shielding the hazard to only the clear zone distance of 9.0 m (i.e. LA = 9.0 m in preceding calculation) and having the rear corner of the hazard unshielded for opposing traffic would reduce the length of barrier by only 3.0 m. Adopt a barrier length of 24.8 m. A MELT must also be provided to shield the end of the barrier for opposing traffic resulting in an overall trailing length of 28.8 m.
6. The overall length of barrier required therefore comprises the length required for the traffic in the adjacent lane (leading), the length required for opposing traffic (trailing), plus the length of pier parallel to the road (6 m) = 46.2 + 28.8 + 6.0 = 81 m. Note that the lengths of 26.9 m and 46 m will enable a clear runout area measuring 22 m x 6 m behind the barrier (refer section). As W-Beam rails span 2 post spacings the length required to construct the barrier of whole rails is 84 m (21 x 4 m per rail).

The barrier layout determined above is illustrated as the Line A installation in Figure D4 below. A Line B installation is also illustrated showing that a longer barrier would be required with a tangential alignment. This can be computed for both the leading and trailing sides using the formula:
X = (LA-L2) / (LA/LR)
Barrier length of need = length on leading side + length of hazard + length on trailing side
= (6.0 - 2.8)/(6.0/130) + 6 + [(9.5 – (2.8 + 3.5)]/ (9.5/130)
= 3.2/0.046 + 6.0 + 3.2/0.073
= 119.4 m (adopt 120 m i.e. 30 rails x 4 m)
Overall length Line B = 120 + 2 x 4
= 128 m (i.e. includes allowance for 2 MELTS)
Figure D.4 — Example 1 Options for Barrier Layout
ANGLE OF DEPARTURE METHOD
7. In the angle of departure method (Figure D2) a vehicle travelling at 100 km/h is assumed to leave the road at a leading angle of 2.9° (Table D2). This equates to a rate of lateral shift of 1 on 20. This angle is applied from the edge of the travel lane to the rear extremity of the hazard for the adjacent traffic, and from the centre of the road to the clear zone for opposing traffic.
8. It is assumed that the barrier in this example is located 2.8 m from the edge of the nearest travel lane.
9. Figure D4 shows the general layout options for the barrier. For a straight alignment the lengths can be determined either graphically or by using simple algebra that relates to the geometry of triangles.
10. As the barrier is to be located 2.8 m from the edge of travel lane it is situated 6.0 – 2.8 = 3.2 m from the rear of the hazard at the leading side and 2.7 m inside the clear zone (9.0 m for 100 km/h, refer Figure 2.4) on the trailing side (i.e. for opposing traffic). The dimensions resulting from the angle of departure method are shown in Figure D5.

For Line B, the key factor is the rate of divergence (1 on 20) of the vehicle travel path from the edge of traffic lane, and as the barrier is parallel to the rear of shoulder the length of barrier between points of need is simply given by:
L = 20 x 3.2 + 6 + 20 x 2.7
= 64 + 6 + 54
= 124 m
Assuming that the crashworthy end treatments have a distance of 4 m from the leading end to the point of need, the overall length of barrier required along Line B is 124 + 2 x 4 = 132 m.
For Line A the length of barrier between points of need can be determined either graphically or by applying geometry to the triangle enclosed by the vehicle trajectory, Line B and Line A.
For the leading length the base of the triangle is 64 – 4 = 60 m long. As the vehicle trajectory is 1 on 20 and the flare of the barrier is 1 in 30 the length of the side of the triangle along the barrier is given by:
30/(30 + 20) x 60 = 0.6 x 60 = 36 m (refer Figure D5)
Similarly, for the trailing end the length of barrier (flare rate 1 in 15) is given by:
15/(20 +15) x 50 = (15/35) x 50 = 3/7 x 50 = 21.4 m
Therefore, the length of barrier between points of need = 36 + 4 +6 + 4 + 21.4 = 71.4 m
And the overall length of barrier = 71.4 + 2 x 4 = 79.4 m (20 rails x 4 m).

Figure D.5 — Example 1 using Angle of Departure Method
Example 2: Determine the layout of a safety barrier to shield bridge end posts adjacent to a divided rural highway as illustrated in Figure D6.
Figure D.6 — Layout of Example 2
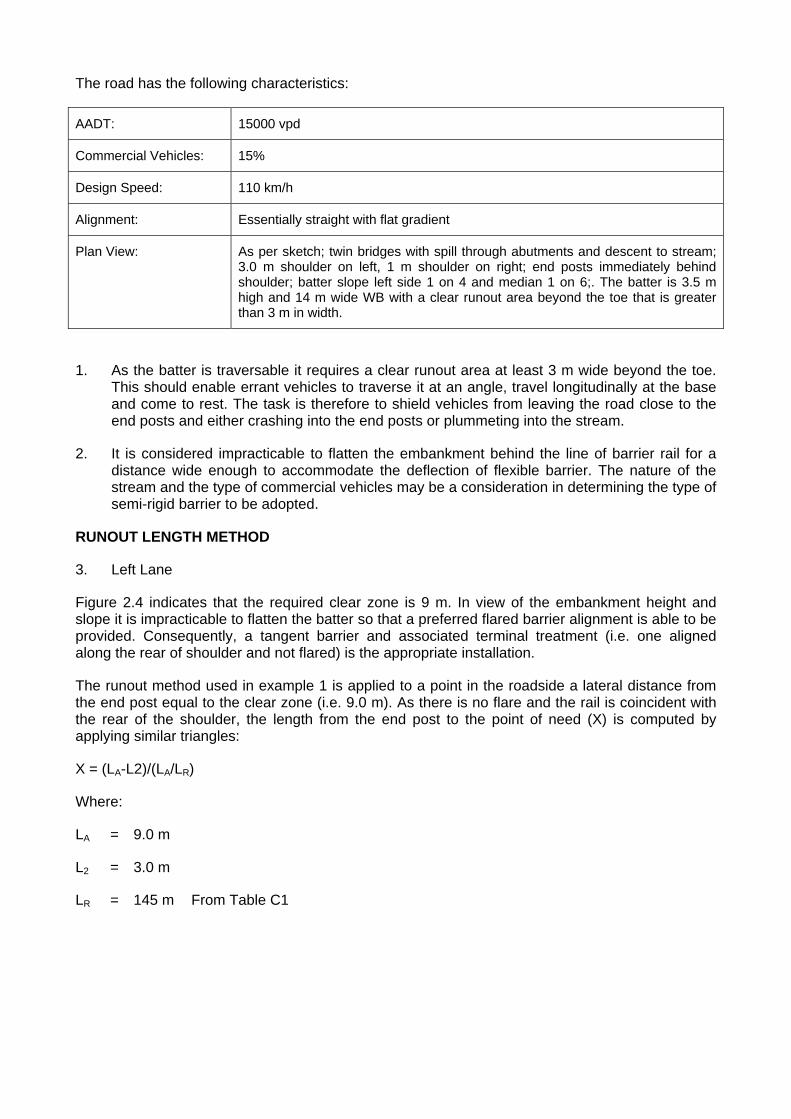
The road has the following characteristics:
AADT: 15000 vpd
Commercial Vehicles: 15%
Design Speed: 110 km/h
Alignment: Essentially straight with flat gradient
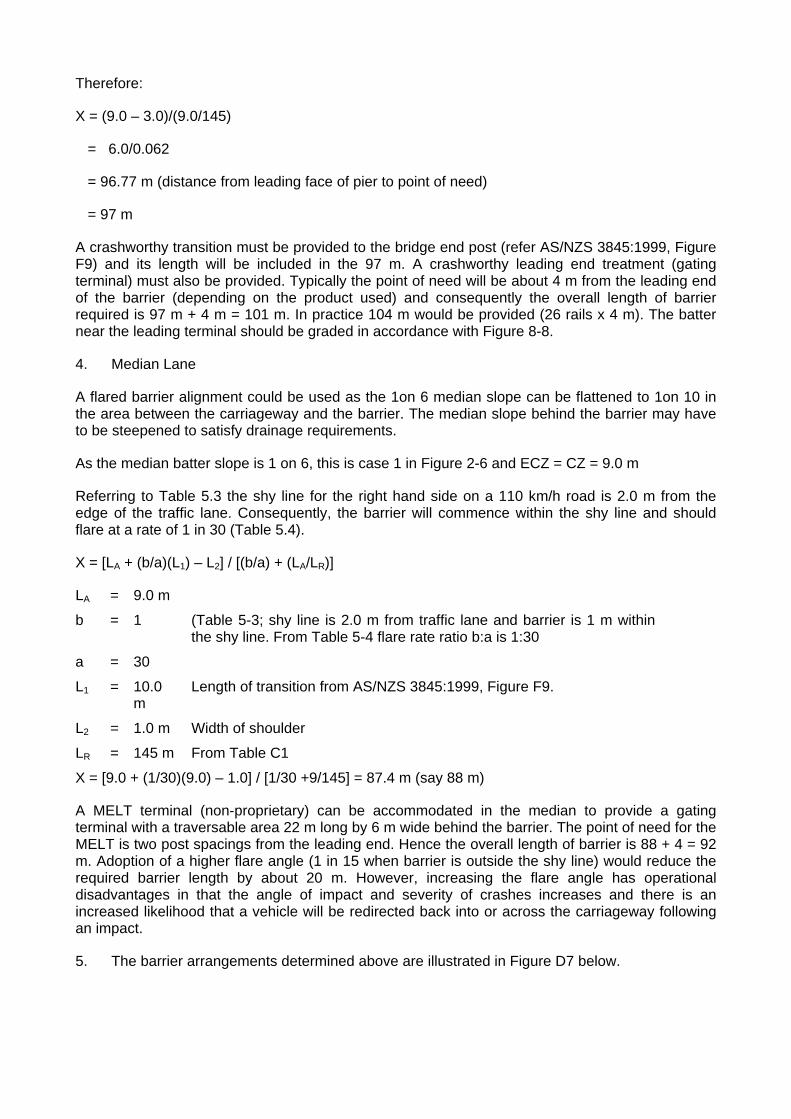
Plan View: As per sketch; twin bridges with spill through abutments and descent to stream; 3.0 m shoulder on left, 1 m shoulder on right; end posts immediately behind shoulder; batter slope left side 1 on 4 and median 1 on 6;. The batter is 3.5 m high and 14 m wide WB with a clear runout area beyond the toe that is greater than 3 m in width.
1. As the batter is traversable it requires a clear runout area at least 3 m wide beyond the toe. This should enable errant vehicles to traverse it at an angle, travel longitudinally at the base and come to rest. The task is therefore to shield vehicles from leaving the road close to the end posts and either crashing into the end posts or plummeting into the stream.
2. It is considered impracticable to flatten the embankment behind the line of barrier rail for a distance wide enough to accommodate the deflection of flexible barrier. The nature of the stream and the type of commercial vehicles may be a consideration in determining the type of semi-rigid barrier to be adopted.
RUNOUT LENGTH METHOD
3. Left Lane
Figure 2.4 indicates that the required clear zone is 9 m. In view of the embankment height and slope it is impracticable to flatten the batter so that a preferred flared barrier alignment is able to be provided. Consequently, a tangent barrier and associated terminal treatment (i.e. one aligned along the rear of shoulder and not flared) is the appropriate installation.
The runout method used in example 1 is applied to a point in the roadside a lateral distance from the end post equal to the clear zone (i.e. 9.0 m). As there is no flare and the rail is coincident with the rear of the shoulder, the length from the end post to the point of need (X) is computed by applying similar triangles:
X = (LA-L2)/(LA/LR)
Where:
LA = 9.0 m
L2 = 3.0 m
LR = 145 m From Table C1
Therefore:
X = (9.0 – 3.0)/(9.0/145)
= 6.0/0.062
= 96.77 m (distance from leading face of pier to point of need)
= 97 m
A crashworthy transition must be provided to the bridge end post (refer AS/NZS 3845:1999, Figure F9) and its length will be included in the 97 m. A crashworthy leading end treatment (gating terminal) must also be provided. Typically the point of need will be about 4 m from the leading end of the barrier (depending on the product used) and consequently the overall length of barrier required is 97 m + 4 m = 101 m. In practice 104 m would be provided (26 rails x 4 m). The batter near the leading terminal should be graded in accordance with Figure 8-8.
4. Median Lane
A flared barrier alignment could be used as the 1on 6 median slope can be flattened to 1on 10 in the area between the carriageway and the barrier. The median slope behind the barrier may have to be steepened to satisfy drainage requirements.
As the median batter slope is 1 on 6, this is case 1 in Figure 2-6 and ECZ = CZ = 9.0 m
Referring to Table 5.3 the shy line for the right hand side on a 110 km/h road is 2.0 m from the edge of the traffic lane. Consequently, the barrier will commence within the shy line and should flare at a rate of 1 in 30 (Table 5.4).
X = [LA + (b/a)(L1) – L2] / [(b/a) + (LA/LR)]
LA = 9.0 m
b = 1 (Table 5-3; shy line is 2.0 m from traffic lane and barrier is 1 m within the shy line. From Table 5-4 flare rate ratio b:a is 1:30
a = 30
L1 = 10.0 m
Length of transition from AS/NZS 3845:1999, Figure F9.
L2 = 1.0 m Width of shoulder
LR = 145 m From Table C1
X = [9.0 + (1/30)(9.0) – 1.0] / [1/30 +9/145] = 87.4 m (say 88 m)
A MELT terminal (non-proprietary) can be accommodated in the median to provide a gating terminal with a traversable area 22 m long by 6 m wide behind the barrier. The point of need for the MELT is two post spacings from the leading end. Hence the overall length of barrier is 88 + 4 = 92 m. Adoption of a higher flare angle (1 in 15 when barrier is outside the shy line) would reduce the required barrier length by about 20 m. However, increasing the flare angle has operational disadvantages in that the angle of impact and severity of crashes increases and there is an increased likelihood that a vehicle will be redirected back into or across the carriageway following an impact.
5. The barrier arrangements determined above are illustrated in Figure D7 below.
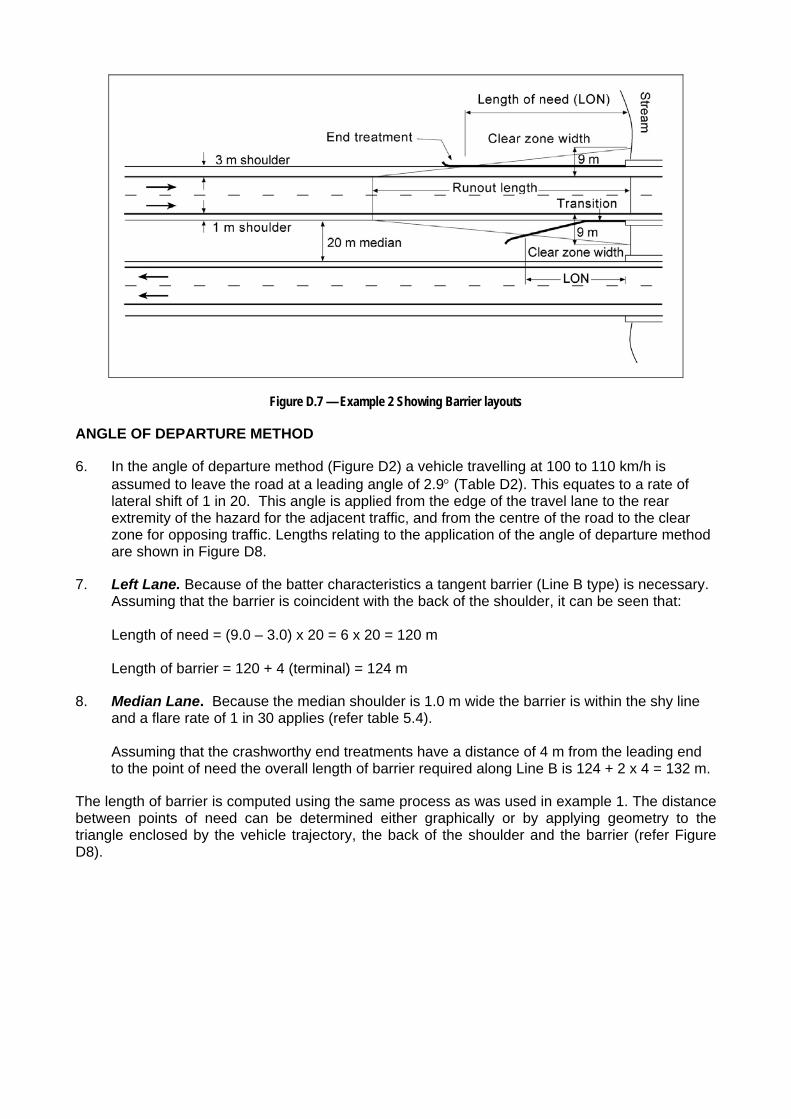
Figure D.7 — Example 2 Showing Barrier layouts
ANGLE OF DEPARTURE METHOD
6. In the angle of departure method (Figure D2) a vehicle travelling at 100 to 110 km/h is assumed to leave the road at a leading angle of 2.9° (Table D2). This equates to a rate of lateral shift of 1 in 20. This angle is applied from the edge of the travel lane to the rear extremity of the hazard for the adjacent traffic, and from the centre of the road to the clear zone for opposing traffic. Lengths relating to the application of the angle of departure method are shown in Figure D8.
7. Left Lane. Because of the batter characteristics a tangent barrier (Line B type) is necessary. Assuming that the barrier is coincident with the back of the shoulder, it can be seen that: Length of need = (9.0 – 3.0) x 20 = 6 x 20 = 120 m Length of barrier = 120 + 4 (terminal) = 124 m
8. Median Lane. Because the median shoulder is 1.0 m wide the barrier is within the shy line and a flare rate of 1 in 30 applies (refer table 5.4). Assuming that the crashworthy end treatments have a distance of 4 m from the leading end to the point of need the overall length of barrier required along Line B is 124 + 2 x 4 = 132 m.
The length of barrier is computed using the same process as was used in example 1. The distance between points of need can be determined either graphically or by applying geometry to the triangle enclosed by the vehicle trajectory, the back of the shoulder and the barrier (refer Figure D8).

The distance from the end of the structure to the point where the vehicle trajectory crosses the rear of the shoulder is:
(9.0 – 1.0) x 20 = 8.0 x 20 = 160 m
The length (along the shoulder) of the base of the triangle is therefore:
160 m – transition length = 160 – 10 = 150 m.
The vehicle trajectory rate of lateral shift and the barrier flare rate can be used to compute the length of barrier along the side of the triangle:
30/(30 + 20) x 150 = 30/50 x 150 = 0.6 x 150 = 90 m
Therefore the length of need of the barrier is = 90 m + transition length = 100 m and the overall length of barrier = 100 + 4 (MELT) = 104 m (26 rails x 4 m)
Figure D.8 — Example 2 using Angle of Departure Method
GLOSSARY OF TERMS Clear Zone The horizontal width of space available for the safe use of an errant vehicle which consists of the verge area and is measured from the nearside edge of the left-hand traffic lane. In the case of a divided road, it is also measured from the offside edge of the right-hand traffic lane to the edge of the pavement for opposing traffic.
Cost-effective An item or action taken that is economical in terms of tangible benefits produced for the money spent.
Crash An event or series of events resulting from a vehicle colliding with another person or object, likely to cause property damage, serious injury or death to the vehicle occupants or to persons struck.
Crash Attenuator A type of device that prevents an errant vehicle from impacting hazardous objects by gradually decelerating the vehicle to a safe stop or by redirecting the vehicle away from the hazard. They are often used as the end treatment on the leading end of a road safety barrier system. Also referred to as a crash cushion.
Crash Testing Conducting a series of full scale impact tests on a road safety barrier system in accordance with recommended guidelines, e.g. NCHRP 350, as appropriate.
Crashworthy A feature that has been proven acceptable for use under specified conditions either through crash testing or in-service performance.
Critical Slope A slope on which most errant vehicles are likely to overturn. Slopes greater than 1 on 3 (i.e. 1V:3H) are regarded as critical.
Deemed to Comply Accepted as complying with the criteria specified in NCHRP 350.
Dynamic Deflection The largest transverse deflection of a road safety barrier system recorded during a crash or during a full scale impact test.
End Treatment The collective term for devices and features at the leading and trailing ends of road safety barrier systems, which are selected on the basis of traffic speed and composition, the type of road barrier system and the particular site constraints. Also referred to as a terminal.
Flare
Change in the offset of a road safety barrier to move it further from the travelled way or closer to the travelled way.
Frangible A structure quality or feature that makes the structure readily or easily broken upon impact by a vehicle.
Gating Terminals Terminals that are designed to break away, pivot or hinge, and that allow a vehicle to pass through when impacted at an angle to the end, or at a point upstream of the beginning of the length of need for the associated road safety barrier system.
Gore / Gore Area The area between the through carriageway and exit ramp of a freeway, or between the two carriageways of a bifurcating road.
Hazard Any feature that could cause significant personal injury when impacted by an errant vehicle that is otherwise being operated in an appropriate manner and in accordance with warnings and advisory information and speed requirements (NY 2003).
Impact Angle For a safety barrier system, it is the angle between a tangent to the face of the barrier and a tangent to the vehicle’s path at impact. For a crash attenuator, it is the angle between the axis of symmetry of the attenuator and a tangent to the vehicle’s path at impact.
Length of Need The length of road safety barrier system needed to prevent errant vehicles colliding with a roadside hazard.
Non-Gating Terminals Terminals that are designed to redirect a vehicle and absorb part of the energy of an impacting vehicle at any point along the terminal without allowing it to pass behind the road safety barrier system.
Non – Recoverable Slope A slope which is considered traversable but on which an errant vehicle will continue on to the bottom of the slope. Embankment slopes between 1 on 3 and 1 on 4 (i.e. 1V:3H and 1V:4H) may be considered traversable but non-recoverable if they are smooth and free of fixed objects.
Proprietary System A road safety barrier system that is the subject of patent or other intellectual property rights within Australia and New Zealand.

Public Domain System
A road safety barrier system that is not the subject of patent or other intellectual property rights within Australia and New Zealand.
Recoverable Slope A slope on which a motorist may, to some degree, retain or regain control of a vehicle. Slopes flatter than 1 on 4 (i.e. 1V:4H) are generally considered recoverable.
Risk
The chance of something happening, which will have an impact upon objectives.
NOTE 1: A risk is often specified in terms of an event or circumstance and the consequences that may flow from it.
NOTE 2: Risk is measured in terms of a combination of the consequences of an event and their likelihood.
NOTE 3: Risk may have a positive or negative impact.
NOTE 4: See ISO/IEC Guide 51, for issues related to safety.
(See AS/NZS 4360: 2004).
Risk Analysis A systematic process to understand the nature of and to deduce the level of risk.
NOTE 1: Provides the basis for risk evaluation and decisions about risk treatment.
NOTE 2: See ISO/IEC Guide 51 for risk analysis in the context of safety.
(see AS/NZS 4360:2004.)
Risk Management The systematic application of management policies, procedures and practices to the tasks of communicating, establishing the context, identifying, analysing, evaluating, treating, monitoring and reviewing risk (see AS/NZS 4360:2004)
Road Safety Barrier System A roadside device that provides a physical restriction to penetration of a vehicle in a way that reduces the risk to vehicle occupants and other traffic. A safety barrier system consists of end treatment/s (including crash attenuators) and a longitudinal safety barrier. Its purpose is to contain and redirect an errant vehicle. It is used to shield roadside obstacles or non-traversable terrain features and may be placed in medians to prevent cross-median crashes. Occasionally, it may be used to protect people from vehicular traffic.
Roadside
That area between the reserve boundary and the nearest road shoulder (AS1348:2002)
Severity Index A number from zero to ten used to categorise crashes by the probability of their resulting in property damage, personal injury, or a fatality, or any combination of these possible outcomes.
Shy Line The distance from the edge of the travelled way beyond which a roadside object will not be perceived as an immediate hazard by the typical driver, to the extent that they will not change their vehicle’s placement or speed.
Temporary Road Safety Barrier System
A device designed to be erected and dismantled quickly, used to prevent vehicular access into construction or maintenance work zones. Its purpose is to redirect an impacting vehicle so as to minimise damage to the vehicle and injury to the occupants, while providing worker protection.
Terminal The specially designed end pieces of a road safety barrier system. The leading terminal is on the end of the road safety barrier system that faces oncoming traffic and the trailing terminal is on the other end. Terminals are subdivided into the classifications of gating and non-gating terminals.
Test Level (TL) A set of conditions, defined in terms of vehicular type and mass, vehicular impact speed, and vehicular impact angle, which quantifies the impact severity of a matrix of tests.
Test Vehicle A commercially available, production model vehicle or an approved surrogate vehicle used in a crash test to evaluate the impact performance of a test article.
Travelled Way The portion of the roadway for the movement of vehicles, exclusive of shoulders.
Working Width The maximum width that is required to prevent an impacting vehicle from colliding with an object behind a road safety barrier system. This includes the dynamic deflection (if any), the extra width due to the roll of the impacting vehicle, plus the width of the safety barrier system.
Work Zone A length of road where roadworks are taking place.
85th Percentile Speed

The speed at which 85% of all recorded values will be less than or equal to the 85th percentile value.

INFORMATION RETRIEVAL
Austroads (2005), Review of Austroads Road Safety Barriers (Roadside Safety Guide) Publication, Sydney, A4, 189pp, IR-97/05