road map for the development of ... -...
TRANSCRIPT

Road Map for the Development of Alternatives
to DDT
Developing Alternatives to DDT
Side Event - Conferences of the Parties of the BRS Conventions
Geneva, Switzerland
5 May 2015
Heidelore Fiedler
UNEP/DTIE Chemicals Branch
Chemin des Anémones 11-13
CH-1219 Châtelaine (GE), Switzerland
Email: [email protected]

Content
1. Mandate
2. Process
3. Objective
4. Structure and Activities
5. Key Actors
6. 7th COP of the Stockholm Convention
7. Initial Situation Analysis on DDT
Mandate
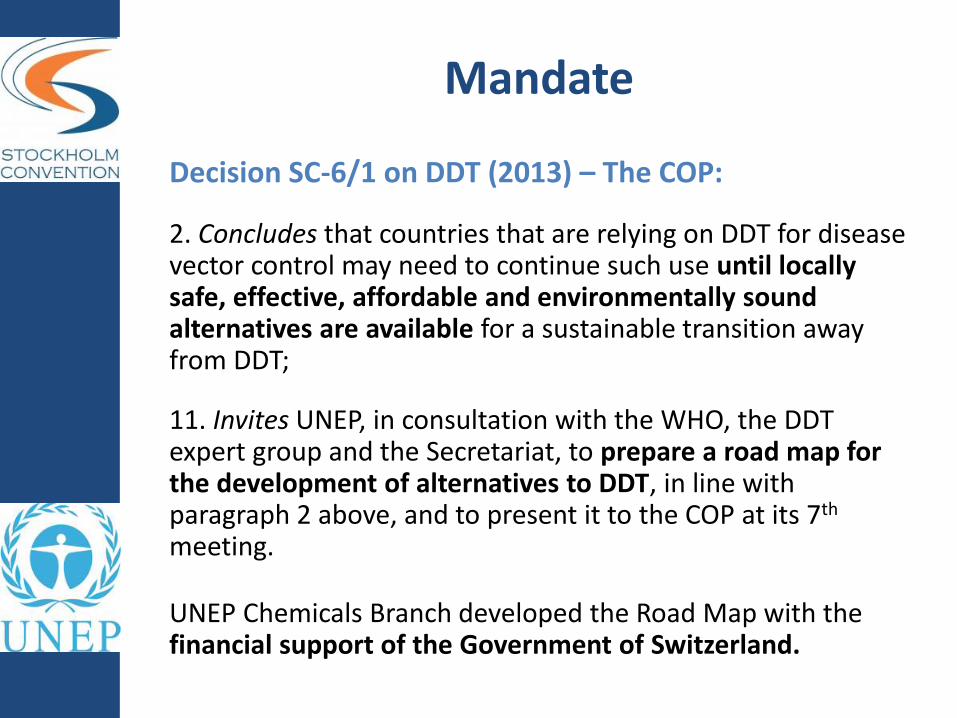
Decision SC-6/1 on DDT (2013) – The COP:
2. Concludes that countries that are relying on DDT for disease vector control may need to continue such use until locally safe, effective, affordable and environmentally sound alternatives are available for a sustainable transition away from DDT;
11. Invites UNEP, in consultation with the WHO, the DDT expert group and the Secretariat, to prepare a road map for the development of alternatives to DDT, in line with paragraph 2 above, and to present it to the COP at its 7th meeting.
UNEP Chemicals Branch developed the Road Map with the financial support of the Government of Switzerland.

Objective
… of the Road Map is to make locally safe, effective, affordable and environmentally sound alternatives available for a sustainable transition away from DDT.
The Road Map:
• Provides a framework for action, aiming to coordinate efforts and establish synergies among actors and projects;
• Does not set a specific phase-out date; rather, it promotes the development of alternatives, assesses progress regularly, and decides on the phase-out only when locally safe, effective, affordable and environmentally sound alternatives are available.

Structure and Activities (1/4)
The Road Map consists of three elements:
1) Establish management and reporting procedures
• Adopt a budget, generate funding, establish coordination and implementation mechanisms, prepare progress reports, etc.;
• Assess and monitor DDT-relevant issues (production and use, exposure of humans and the environment, insecticide resistance, alternatives, etc.);
• Regularly assess continued need for DDT and – ultimately – prepare recommendations when locally safe, effective, affordable and environmentally sound alternatives are available;
Structure and Activities (2/4)
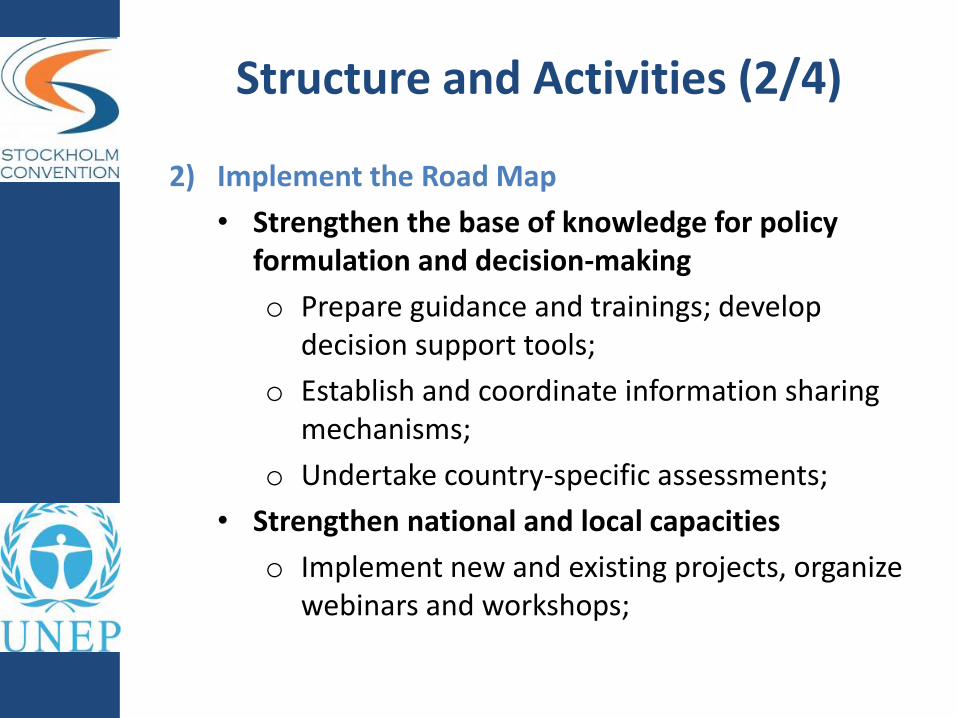
2) Implement the Road Map
• Strengthen the base of knowledge for policy formulation and decision-making
o Prepare guidance and trainings; develop decision support tools;
o Establish and coordinate information sharing mechanisms;
o Undertake country-specific assessments;
• Strengthen national and local capacities
o Implement new and existing projects, organize webinars and workshops;

Structure and Activities (3/4)
2) Implement the Road Map (Element (2) cont‘d)
• Develop and deploy chemical alternatives - Implement tiered process for selection of new active
ingredients and formulations; screening, data mining;
- Pilot testing, small-scale and large-scale field trials;
- Specifications for quality control and trade; regulatory approval, commercial development and deployment;
• Upsacle application of non-chemical alternatives - Compile lessons learned and good practices;
- Undertake pilot studies;
- Undertake activities to scale up the development and deployment of non-chemical alternatives;

Structure and Activities (4/4)
3) Eliminate stockpiles and waste
• Update national inventories;
• Collect obsolete stocks;
• Repackage and dispose obsolete stocks.

Key Actors
• Parties: key implementing actors and target group of the Road Map;
• UNEP Chemicals Branch: proposed to lead coordination; leads Global Alliance; implements GEF projects;
• WHO: evaluates alternatives (WHOPES ); leads Vector Control Advisory Group; provides recommendations to the COP; executes GEF projects;
• Regional Centers: provide local capacity and expertise;
• Global Alliance: offers expertise; platform for information exchange;
• DDT expert group: regularly assesses continued need for DDT;
• Industry/private sector: develops chemical alternatives to DDT (IVCC);
• Civil society: supports capacity-building, awareness-raising, etc.;
• Academia: provides training, including for IVM; conducts research;
• Donors: to provide funding for coordination and implementation.
Others: BRS Secretariat, POPs Review Committee, Regional Centres, UN-Habitat, Roll Back Malaria Partnership, GEF-implementing agencies, Global Coordination Group of the POPs Global Monitoring Plan, etc.

7th COP of the Stockholm Convention
The key elements of the Road Map:
• Working document UNEP/POPS/COP.7/5
The full Road Map:
• Information document UNEP/POPS/COP.7/INF/6
UNEP’s progress report ’Global Alliance‘:
• Information document UNEP/POPS/COP.7/INF/7

Initial Situation Analysis on DDT – Status 2015
Developing Alternatives to DDT
Side Event to the Conferences of the Parties of the BRS Conventions
Geneva, Switzerland
5 May 2015
Heidelore Fiedler
UNEP/DTIE Chemicals Branch
Chemin des Anémones 11-13
CH-1219 Châtelaine (GE), Switzerland
Email: [email protected]
Initial Situation Analysis on DDT – Status 2015
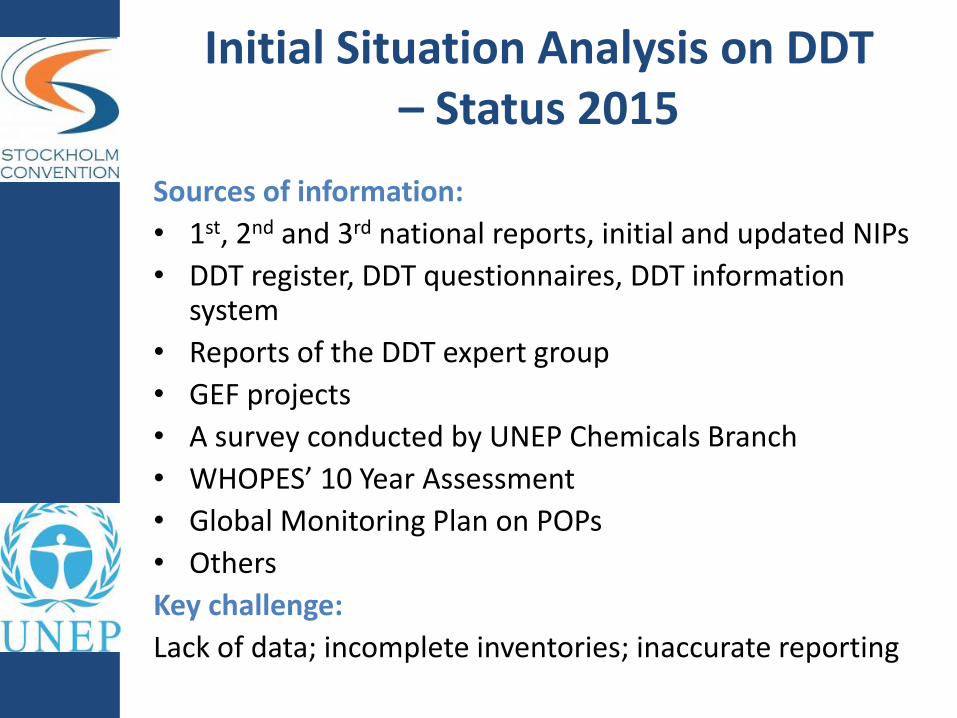
Sources of information:
• 1st, 2nd and 3rd national reports, initial and updated NIPs
• DDT register, DDT questionnaires, DDT information system
• Reports of the DDT expert group
• GEF projects
• A survey conducted by UNEP Chemicals Branch
• WHOPES’ 10 Year Assessment
• Global Monitoring Plan on POPs
• Others
Key challenge:
Lack of data; incomplete inventories; inaccurate reporting

Initial Situation Analysis on DDT – Status 2015: Production (1/2)
Country Start of production
End of production
Quantity (1,000 tonnes)
India 1955 Ongoing 239
DPR Korea 1960 > 2010? 21
China 1952 2007 467
Mexico 1959 2004 >93
Bangladesh 1966 1992 8
Indonesia 1986 1991 23
Brazil 1962 1982 76
Azerbaijan 1958 1980 481
Poland 1947 1980 79
USA 1944 1973 1,383
Serbia 1947 1960 2
Total 2,793

Initial Situation Analysis on DDT – Status 2015: Production (1/2)
0
200,000
400,000
600,000
800,000
1,000,000
1,200,000To
nn
es o
f D
DT
pro
du
ced
Total production in 2010-2013: 13,620 tonnes
Initial Situation Analysis on DDT – Status 2015: Trade
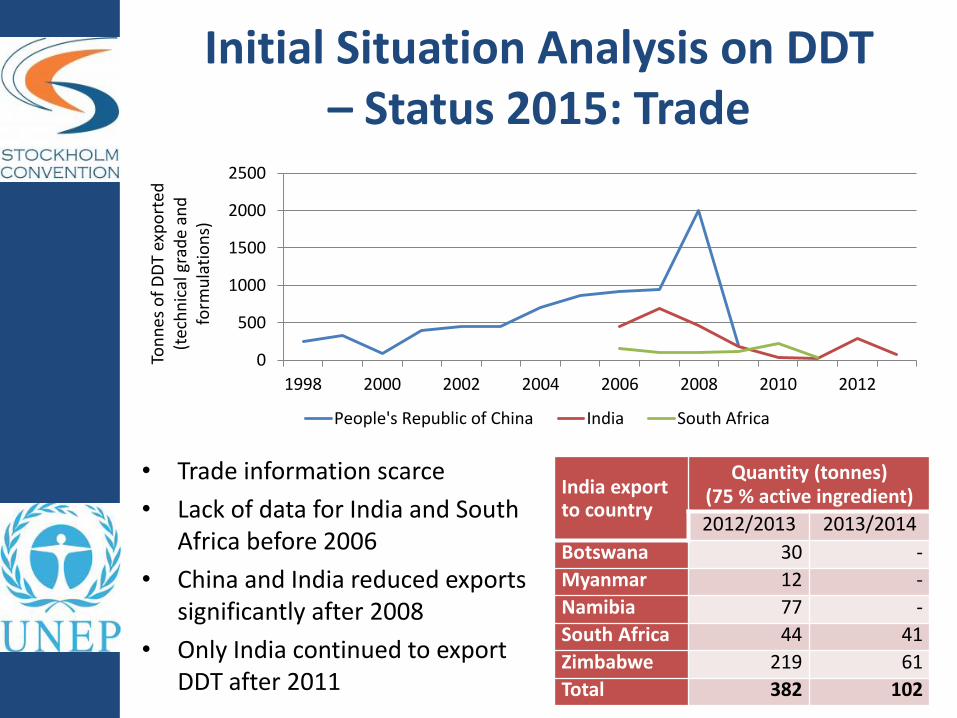
• Trade information scarce
• Lack of data for India and South Africa before 2006
• China and India reduced exports significantly after 2008
• Only India continued to export DDT after 2011
0
500
1000
1500
2000
2500
1998 2000 2002 2004 2006 2008 2010 2012
Ton
nes
of
DD
T ex
po
rted
(t
ech
nic
al g
rad
e an
d
form
ula
tio
ns)
People's Republic of China India South Africa
India export to country
Quantity (tonnes) (75 % active ingredient)
2012/2013 2013/2014
Botswana 30 -
Myanmar 12 -
Namibia 77 -
South Africa 44 41
Zimbabwe 219 61
Total 382 102

Initial Situation Analysis on DDT – Status 2015: Consumption (1/2)
According to available data, ca. 1.1 million t of DDT were used in agriculture and disease vector control.
Total Historic Consumption of DDT

Initial Situation Analysis on DDT – Status 2015: Consumption (2/2)
0
2,000
4,000
6,000
8,000
2008/2009 2010/2011 2012/2013
Ton
ne
s o
f D
DT
Total
India
0
2000
4000
6000
8000
10000
2004 2006 2008 2010 2012
Ton
ne
s o
f D
DT
Control of malaria
Control of visceral leishmaniasis
Global consumption of DDT
Consumption of DDT in India
• India: 86 % of global use in 2003-2007; only current user
• 2009-2011: 7 Parties reported use of DDT (6 African)
• India used 6,183 tonnes in 2013/2014
• Increasing use for visceral leishmaniasis (> 40 % in 2013/2014)

Initial Situation Analysis on DDT – Status 2015: Stockpiles
• In total, 76 countries reported stockpiles
• No reasonable estimate of total stockpiles possible
• Average: 741 tonnes; median: 32 tonnes (highly skewed)
• Some countries seem to have successfully reduced their stockpiles (e.g., Mauritius and South Africa)
Country Active ingredient Quantity (in tonnes)
Gambia 75 % 14
India 50 % 2,046
Jordan 75 % 25
Mauritius 75 % 5
South Africa 75 % 36
Swaziland n.a. n.a.
Total 2,126
DDT stockpiles during the reporting cycle 2009-2011

Initial Situation Analysis on DDT – Status 2015: Monitoring (1/3)
• Stockholm Convention’s Global Monitoring Plan on POPs (GMP);
• UNEP and WHO jointly implement surveys on POPs in human milk;
• Data for DDT available since 2001;
• Relatively high concentrations detected (recently), exceeding the WHO ‘safety level’ of 2,000 ng per gram lipid.
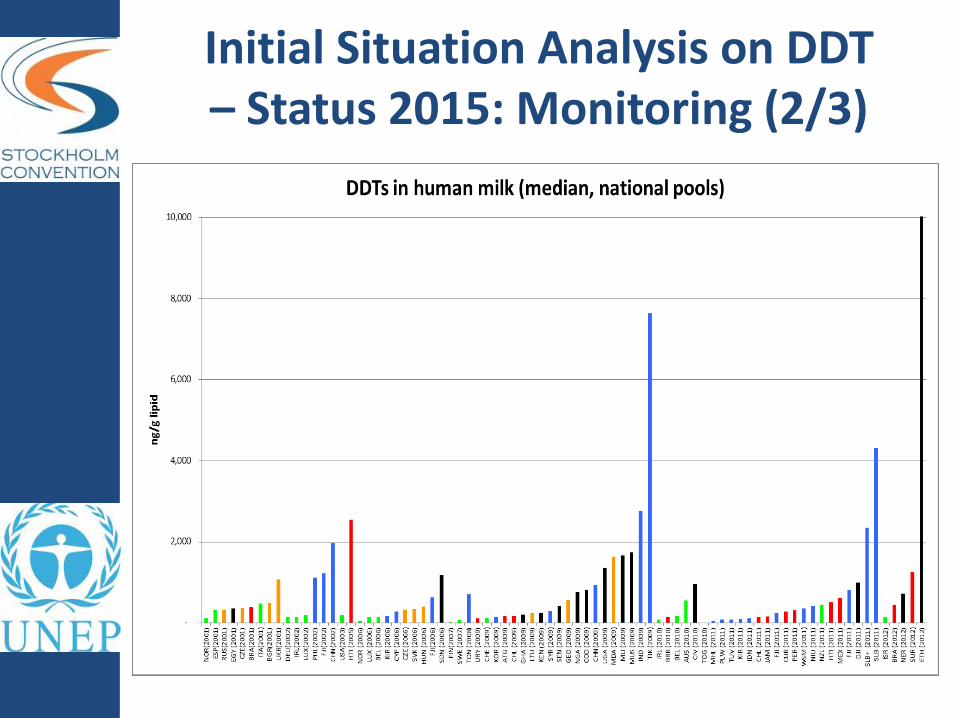
Initial Situation Analysis on DDT – Status 2015: Monitoring (2/3)

Initial Situation Analysis on DDT – Status 2015: Monitoring (3/3)
-
500
1,000
1,500
2,000
2,500
3,000
DDTs in human milk (ng/g lipid)
• Results for countries where more than one result is available
• Green bars: more recent sample lower concentrations than previous

DDT Initial Situation Analysis on DDT – Some Findings
• Data are limited in several areas (esp. stockpiles and waste), in
particular for the period before the entry into force of the
Convention;
• Production of DDT totals 2.9 million tonnes and is still ongoing;
• The USA consumed relatively large amounts of DDT during the
1950s and 1960s, making it the largest user of DDT;
• Current production levels are very low in historic comparison;
• India is reportedly the only current producer, user and exporter;
• Use of DDT for control of visceral leishmaniasis is increasing;
• There are relatively high concentrations of DDT in human milk ;
• The identification and elimination of obsolete DDT stockpiles and
wastes needs to become a priority.

Thank you for your attention!
For questions, please contact:
Heidelore Fiedler
UNEP/DTIE Chemicals Branch
Chemin des Anémones 11-13
CH-1219 Châtelaine (GE), Switzerland
Email: [email protected]
or
Jost Dittkrist
c/o UNEP/DTIE Chemicals Branch
Chemin des Anémones 11-13
CH-1219 Châtelaine (GE), Switzerland
Email: [email protected]