rnbeadsdj { a quickstart guide to the rnbeads data...
TRANSCRIPT

RnBeadsDJ – A Quickstart Guide to theRnBeads Data Juggler
Fabian Muller, Yassen Assenov, Pavlo LutsikContact: [email protected]
Package version: 1.12.2
September 25, 2018
RnBeads is an R package for the comprehensive analysis of genome-wide DNA methylationdata with single basepair resolution. RnBeadsDJ is a graphical user interface (GUI) guidingthrough RnBeads analyses.
Contents
1 Getting Started 11.1 Installation . . . . . . . . . . . . . . . . . . . . . . . . . . . . . . . . . . . . . . . 11.2 Launching the Data Juggler . . . . . . . . . . . . . . . . . . . . . . . . . . . . . . 11.3 Example Datasets . . . . . . . . . . . . . . . . . . . . . . . . . . . . . . . . . . . 2
2 Tutorial: Running RnBeads Analysis 22.1 Setting Up the Analysis . . . . . . . . . . . . . . . . . . . . . . . . . . . . . . . . 22.2 Selecting the Input Data . . . . . . . . . . . . . . . . . . . . . . . . . . . . . . . . 32.3 Specifying Analysis Options . . . . . . . . . . . . . . . . . . . . . . . . . . . . . . 42.4 Running the Analysis . . . . . . . . . . . . . . . . . . . . . . . . . . . . . . . . . 52.5 Inspecting the Analysis Results . . . . . . . . . . . . . . . . . . . . . . . . . . . . 5
1 Getting Started
1.1 Installation
A detailed protocol on how to install RnBeads and its dependencies can be found on here:http://rnbeads.mpi-inf.mpg.de/publication/data/tutorial/00 prelim.html.
1.2 Launching the Data Juggler
To launch the Data Juggler (DJ), you just have to load the RnBeads package in an R sessionand then run the launch command:
suppressPackageStartupMessages(library(RnBeads))
rnb.run.dj()
1
RnBeads 2
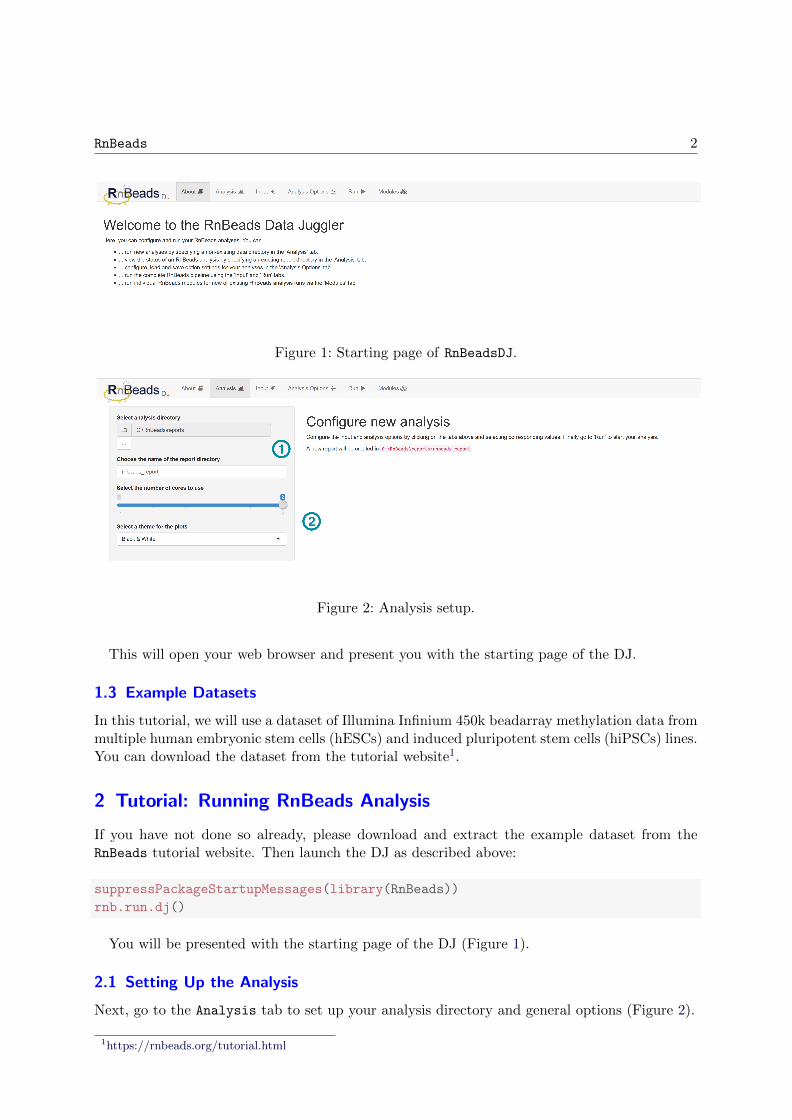
Figure 1: Starting page of RnBeadsDJ.
Figure 2: Analysis setup.
This will open your web browser and present you with the starting page of the DJ.
1.3 Example Datasets
In this tutorial, we will use a dataset of Illumina Infinium 450k beadarray methylation data frommultiple human embryonic stem cells (hESCs) and induced pluripotent stem cells (hiPSCs) lines.You can download the dataset from the tutorial website1.
2 Tutorial: Running RnBeads Analysis
If you have not done so already, please download and extract the example dataset from theRnBeads tutorial website. Then launch the DJ as described above:
suppressPackageStartupMessages(library(RnBeads))
rnb.run.dj()
You will be presented with the starting page of the DJ (Figure 1).
2.1 Setting Up the Analysis
Next, go to the Analysis tab to set up your analysis directory and general options (Figure 2).
1https://rnbeads.org/tutorial.html

RnBeads 3
Figure 3: Input data.
1. Click on the button labeled “...” to select an existing directory as the base directory for theanalysis (Note that on some Windows computers the selection dialog box will be openedin the background and that you might need to minimize your browser to find it). Thenspecify an analysis name. RnBeads will create a new folder named according to this in thebase directory, if it does not already exist.
2. Specify general analysis options such as the number of compute cores to be used for theanalysis and the style preset for report plots.
2.2 Selecting the Input Data
In the Input tab you can configure your input data (Figure 3).
1. Select a sample annotation file. This should be a tabular file (comma or tab separated)that contains information on the samples in your dataset. You can select which separatoris used in this file using the dropdown box below. For our example dataset, the sampleannotation is contained in sample_annotation.csv, which is a comma-separated file. Ifthe annotation can be loaded correctly, a preview of the sample information is shown onthe right.
2. Select the appropriate platform that was used to quantify DNA methylation. In ourexample this is the Illumina Infinium 450k beadarray.
3. Select the directory where the methylation readout can be found (again, on some Windowsmachines, the corresponding selection box might appear in the background). For Illuminabeadarrays this should be a directory containing idat intensity files for each sample. Theexample dataset you downloaded contains such a directory.

RnBeads 4
Figure 4: Analysis options – loading option profiles
Figure 5: Analysis options – general settings
2.3 Specifying Analysis Options
The Options tab allows you to configure your analysis parameters. You can load preset optionprofiles and save them (Figure 4).
1. For our example analysis, select the “450k minimal” profile, which will set some options topreset values such that the analysis will run in a reasonable amount of time.
The panel below contains several tabs which let you specify options pertaining to various stepsin the RnBeads pipeline. Each tab lists the option names, option settings and current valuesin a tabular format. Note that you can hover over option names to see tooltips containing amore detailed description of individual options. General analysis options can be specified in theGeneral tab (Figure 5). Here, let us ...
1. ... assign a reasonable name for the analysis.
2. ... select the region types for which methylation levels will be summarized in the analysis.
3. ... select a column of the sample annotation table that will be used as sample identifiers.
RnBeads 5
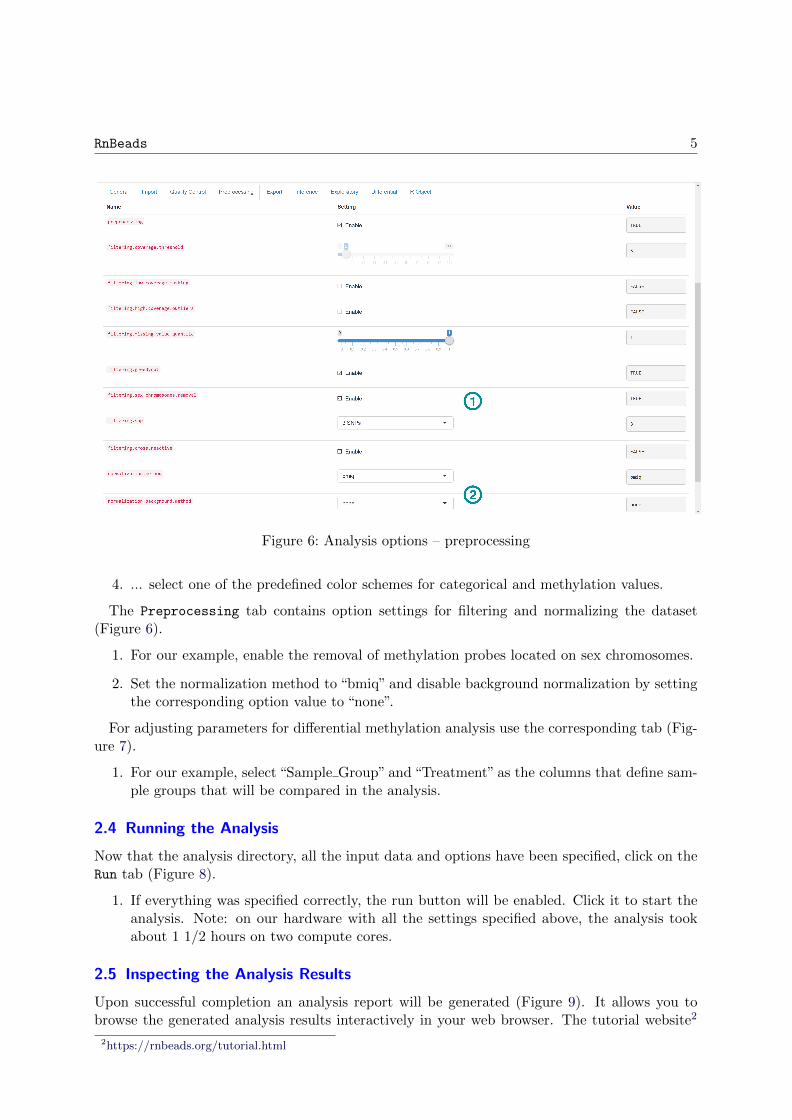
Figure 6: Analysis options – preprocessing
4. ... select one of the predefined color schemes for categorical and methylation values.
The Preprocessing tab contains option settings for filtering and normalizing the dataset(Figure 6).
1. For our example, enable the removal of methylation probes located on sex chromosomes.
2. Set the normalization method to “bmiq” and disable background normalization by settingthe corresponding option value to “none”.
For adjusting parameters for differential methylation analysis use the corresponding tab (Fig-ure 7).
1. For our example, select “Sample Group” and “Treatment” as the columns that define sam-ple groups that will be compared in the analysis.
2.4 Running the Analysis
Now that the analysis directory, all the input data and options have been specified, click on theRun tab (Figure 8).
1. If everything was specified correctly, the run button will be enabled. Click it to start theanalysis. Note: on our hardware with all the settings specified above, the analysis tookabout 1 1/2 hours on two compute cores.
2.5 Inspecting the Analysis Results
Upon successful completion an analysis report will be generated (Figure 9). It allows you tobrowse the generated analysis results interactively in your web browser. The tutorial website2
2https://rnbeads.org/tutorial.html

RnBeads 6
Figure 7: Analysis options – differential methylation
Figure 8: Running the Analysis

RnBeads 7
Figure 9: RnBeads analysis report

RnBeads 8
contains a link to the report that was generated during the writing of this tutorial.