rna polymerase i transcription silences noncoding …ec.asm.org/content/9/2/325.full.pdf ·...
TRANSCRIPT

EUKARYOTIC CELL, Feb. 2010, p. 325–335 Vol. 9, No. 21535-9778/10/$12.00 doi:10.1128/EC.00280-09Copyright © 2010, American Society for Microbiology. All Rights Reserved.
RNA Polymerase I Transcription Silences Noncoding RNAs at theRibosomal DNA Locus in Saccharomyces cerevisiae�
Elisa Cesarini,1 Francesca Romana Mariotti,1 Francesco Cioci,1† and Giorgio Camilloni1,2*Dipartimento di Genetica e Biologia Molecolare, Universita di Roma, La Sapienza, 00185 Rome, Italy,1
and Istituto di Biologia e Patologia Molecolari, CNR, 00185 Rome, Italy2
Received 29 September 2009/Accepted 17 December 2009
In Saccharomyces cerevisiae the repeated units of the ribosomal locus, transcribed by RNA polymerase I (PolI), are interrupted by nontranscribed spacers (NTSs). These NTS regions are transcribed by RNA polymeraseIII to synthesize 5S RNA and by RNA polymerase II (Pol II) to synthesize, at low levels, noncoding RNAs(ncRNAs). While transcription of both RNA polymerase I and III is highly characterized, at the ribosomal DNA(rDNA) locus only a few studies have been performed on Pol II, whose repression correlates with theSIR2-dependent silencing. The involvement of both chromatin organization and Pol I transcription has beenproposed, and peculiar chromatin structures might justify “ribosomal” Pol II silencing. Reporter genesinserted within the rDNA units have been employed for these studies. We studied, in the natural context, yeastmutants differing in Pol I transcription in order to find whether correlations exist between Pol I transcriptionand Pol II ncRNA production. Here, we demonstrate that silencing at the rDNA locus represses ncRNAs witha strength inversely proportional to Pol I transcription. Moreover, localized regions of histone hyperacetylationappear in cryptic promoter elements when Pol II is active and in the coding region when Pol I is functional;in addition, DNA topoisomerase I site-specific activity follows RNA polymerase I transcription. The repressionof ncRNAs at the rDNA locus, in response to RNA polymerase I transcription, could represent a physiologicalcircuit control whose mechanism involves modification of histone acetylation.
In Saccharomyces cerevisiae the ribosomal DNA (rDNA)locus coding for rRNAs is represented by a single gene clusterof 150 to 200 units repeated in tandem on chromosome XII(23). Each unit contains the 35S RNA gene transcribed byRNA polymerase I (Pol I) and is separated from the nextrepeat by a nontranscribed spacer (NTS) (Fig. 1). Despite itsname, the latter sequence is highly transcribed by RNA poly-merase III, at the 5S gene, and at very low levels by RNApolymerase II (Pol II) at different promoters, generating non-coding RNAs (ncRNAs) (10, 15, 19, 33).
Recent observations (10, 15, 19, 33) concerning mutantstrains overproducing ncRNAs from the NTS region haveshown that the presence of these RNA species correlates withthe SIR2-dependent transcriptional silencing occurring at theribosomal locus (19); interestingly, DNA topoisomerase I mu-tants (top1�) show increases of these ncRNA species. Also themitotic recombination in the rDNA (suppressed in wild-type[WT] strains) is increased when ncRNAs are overproduced(15); this phenomenon has been proposed to be due in part tothe Pol II activity that locally may displace cohesins and inducerecombination. More recently, alteration of ribosomal genecopy number has also been observed in mutant strains withincreased production of ncRNAs (10, 15, 33).
Thus, at the rDNA, a connection among transcriptional si-
lencing, recombination between repeated units, and ncRNAproduction appears to exist.
Moreover, it has been discovered (6, 39) that the yeast S.cerevisiae has an inherent ability to produce rRNA by Pol II,but this transcription activity is silenced in normal cells. Inmutants lacking the Pol I transcription factor upstream activa-tion factor (UAF), rDNA transcription is due to Pol II activity(the polymerase-switched state [PSW]). The presence of UAFin WT cells appears to stabilize this state, thus showing apowerful silencing of rDNA transcription by Pol I.
Hypotheses about the basis of transcriptional silencing at therDNA locus take into consideration both chromatin organiza-tion (2, 21, 27, 28) and Pol I transcription (3, 5). Differentobservations have identified the elements required for silenc-ing at the rDNA locus: histones and those enzymes capable ofhistone modifications and/or chromatin remodeling (2, 21, 27,28). Putative chromatin structures have been reported for si-lenced Pol II transcription in the rDNA region, particularly atthe NTS level (8, 22), when reporter genes are artificiallyinserted in the rDNA locus (2, 27). It has also been suggested(3, 5) that Pol I activity on this region is involved in setting oftranscriptional silencing, creating peculiar structures inhibitingPol II activity (5).
In order to verify whether Pol I and Pol II transcriptioncorrelates with ncRNA production and chromatin modifica-tions, we studied several yeast strains differing in Pol I tran-scription of 35S RNA, in particular the W303 strain (WT) (30),in which about 50% of the units are transcribed; the NOY1071strain (5), with all transcribed units (ATU), where the strongcontraction of the repeats (from 200 to 25) is stably maintainedby the lack of the FOB1 gene; and the NOY699 strain (39),carrying a UAF subunit deletion (RRN5), with a strongly re-
* Corresponding author. Mailing address: Dipartimento di Geneticae Biologia Molecolare, Universita di Roma, Sapienza, P.le A. Moro 5,00185 Rome, Italy. Phone: 390649912808. Fax: 390649912500. E-mail:[email protected].
† Present address: Sanofi-Aventis, gruppo Lepetit s.r.l., Valcanello03012 Anagni (Fr), Italy.
� Published ahead of print on 28 December 2009.
325
on Septem
ber 18, 2018 by guesthttp://ec.asm
.org/D
ownloaded from

duced 35S RNA transcription by RNA polymerase I and whererRNA synthesis is mainly carried out by RNA polymerase II(PSW). In addition, we used two strains characterized by acomplete loss of RNA polymerase I transcription: NOY558, inwhich the core factor (CF) complex is impaired due to theabsence of the RRN7 component (17), and the D128-1d (A43)strain, lacking the A43 subunit of RNA polymerase I (31). Asummary of the strain features is given in Table 1.
We have measured ncRNA synthesis in the different strainsand evaluated chromatin structure and histone acetylation inthe NTS region. The efficiency of site-specific cleavage activityof DNA topoisomerase I has also been studied.
MATERIALS AND METHODS
Strains. Strains used were as follows: W303-1a (WT) (mata ade2-1 ura3-1his3-11,15 trp1-1 leu2-3,112 can1-100); NOY699-PSW (PSW) (mata ade2-1ura3-1 his3-11 trp1-1 leu2-3,112 can1-100 rrn5::LEU2), PSW (from M. Nomura);NOY1071 (ATU) (mata ade2-1 ura3-1 his3-11,15 trp1-1 leu2-3,112 can1-100fob1::HIS3), carrying 25 ribosomal units (from M. Nomura); NOY558 (CF)(mata ade2-1 ura3-1 his3-11 trp1-1 leu2-3,112 can1-100 rrn7::LEU2) (from M.Nomura); UKY403 (mata ade2-101 his-�200 leu2-3,112 lys2-801 ura3-52 trp1-�419 �hhf1::his3 �hhf2::leu2/pMH3110 [TRP1 CEN3 ARS1 UAS gal-HHF2])(from M. Grunstein); D128-1d (A43) (mata rpa43::LEU2 ade2-101 uaa ura3-52lys2-801 uag trp1-D63 his3-D200 leu2-D1/), pNOY102 (from P. Thuriaux).
Probes. The probes utilized in this work (Fig. 1 shows localization) were asfollows: for Northern blot assays, single-stranded probe S1 (annealing to posi-tions �615 to �243), single-stranded probe S2 (annealing to positions �2147 to�1899), single-stranded probe S3 (annealing to positions �1709 to �1464), anddouble-stranded probe ACT1 (obtained by PCR with the oligonucleotides 5�-ACGTTCCAGCCTTCTACGTTTCCA-3� and 5�-AGTCAGTCAAATCTCTACCGGCCA-3�); for Southern blot assays, probe P (annealing from �509 to �615and obtained by PCR with the oligonucleotides 5�-TAACATCCCAATGCGGACTATA-3� and 5�-TAGGTAGTCAGATGAAAG-3�) and probe C (annealingfrom �5911 to �6295 and obtained by PCR from oligonucleotides employed forCOD amplicon production [see below for sequences and annealing positions]).
Primers. Oligonucleotides utilized as primers in chromatin immunoprecipita-tion (Chr-IP) reactions were as follows: amplicon COD, 5�-GGGCTCATGGAGAACAGAAATCTC-3� (�5991 to �5934) and 5�-CCGAATGAACTGTTCCTCTCGTAC-3� (�6295 to �6272); amplicon ENH, 5�-GGGGCCTAGTTTAGAGAGAAGTAG-3� (�2454 to �2431) and 5�-CTCTGATGGTGCGGAAAAAACTGC-3� (�2136 to �2160); amplicon E-PRO, 5�-TGTTAGTGCAGGGAAAGCGGGAAGGA-3� (�1709 to �1684) and 5�-GCACTATCCAGCTGCACTCTTCTTC-3� (�1464 to �1489); amplicon NUC, 5�-ATGTTCAGTAGGTGGGAGTGAGAG-3� (�1197 to �1174) and 5�-CATCCGGTGCCGTAAATGCAAAAC-3� (�860 to �884); amplicon C-PRO, 5�-AATAGTGAGGAACTGGGTTACCCG-3� (�229 to �207) and 5�-TTGTACTCCATGACTAAACCCCCC-3� (�31 to �54); amplicon ACT1, 5�-ACGTTCCAGCCTTCTACGTTTCCA-3� and 5�-AGTCAGTCAAATCTCTACCGGCCA-3�.
The following specific primers were used in reverse transcriptase PCRs (RT-PCRs): 5�-TAGGTAGTCAGATGAAAG-3� (S1), 5�-GCACCATCAGAGCGGCAAAC-3� (S2), 5�-GCACTATCCAGCTGCACTCTTCTTC-3� (S3), and 5�-AGTCAGTCAAATCTCTACCGGCCA-3� (ACT1). The resulting cDNAs wereamplified by PCR.
FIG. 1. Map of rDNA, probes, and oligonucleotides used in this study. Schematic map of ribosomal genes in Saccharomyces cerevisiae.Horizontal black arrows represent RNA transcripts. Filled boxes indicate 35S and 5S coding units. Gray boxes represent ncRNA promoters.Ellipses refer to positioned nucleosomes. The boxed areas in the lower part of the figure contain probes used in Southern and Northern blottingexperiments (thin horizontal black lines). White arrows indicate oligonucleotides used in RT-PCR and primer extension experiments. The thickblack lines represent the positions of amplicons produced in Chr-IP analyses.
TABLE 1. Features of strains used in this studya
Name Copy no.(rDNA)
Pol Itranscriptionproduction
ncRNA
Acetylation
Coding Crypticpromoters
ATU (NOY1071) 25 ���� � ��� �WT (W303-1a) 150 ��� �/� � �/�CF (NOY558) 100 � � ND NDPSW (NOY699-
PSW)300 �/� ��� � ���
A43 (D128-1d) 150 � � ND ND
a The reference strain (W303-1a, WT �30�) has about 50% of the units tran-scribed; in the ATU (NOY1071 �5�) strain all units are transcribed, and thestrong contraction of the repeats (from 200 to 25) is stably maintained by the lackof the FOB1 gene; the CF strain (NOY558 �17�) lacks the rrn7 subunit of the CFcomplex, and thus, Pol I transcription is abolished; the PSW (NOY699 �39�)strain carries a UAF subunit deletion that abolishes 35S RNA transcription; inaddition, a polymerase switch (PSW) occurred and transcription of 35S RNA byRNA polymerase I is switched to RNA polymerase II. In the A43 strain(D128-1d �31�) a deletion of the gene of the A43 subunit of Pol I abolishes itstranscriptional activity. � to ����, lowest to highest levels, respectively; ND,not determined.
326 CESARINI ET AL. EUKARYOT. CELL
on Septem
ber 18, 2018 by guesthttp://ec.asm
.org/D
ownloaded from

Culture media and conditions. The culture medium utilized for cell growthwas complete YPGal (26), supplemented with 2% galactose, except for theexperiments described in Fig. 6, for which a galactose-to-glucose shift was re-quired. In this case we employed complete yeast extract-peptone-dextrose(YPD) supplemented with 2% glucose.
Restriction enzymes, micrococcal nuclease (MNase), and RT were purchasedfrom Roche; Taq polymerase was from Eppendorf; zymolyase was from Seika-gaku (Tokyo, Japan); nystatin was from Sigma; radiochemicals were from Am-ersham; and Vent (Exo�) polymerase was from New England Biolabs.
RNA analysis. Total RNA from yeast cells grown to exponential phase inYPGal medium was prepared as previously described (36). After spectrophoto-metric determination of the amount of RNA present, 20 �g from each samplewas run in a 1.2% agarose morpholinepropanesulfonic acid (MOPS) gel (con-taining formaldehyde as a denaturing agent). The gel was stained with ethidiumbromide and photographed to visualize rRNA as a control for equal loading andintegrity. Northern analysis was performed by standard procedures, with HybondN� nylon paper (Amersham). For hybridization probes utilized, see specificparagraphs above.
The band intensities were measured with a phosphorimager and normalized tothe ACT1 value (loading control). In the graph the ncRNA values are givenrelative to the rDNA copy number. Error bars refer to at least three differentexperiments.
Chromatin immunoprecipitation. Three hundred milliliters of culture wasgrown to exponential phase (optical density [OD] of 0.5/ml), fixed with 1%formaldehyde for 15 min, and then incubated with 330 mM glycine for 10 min,to block the formaldehyde reaction. Chromatin extract was recovered and sub-jected to sonication in order to obtain an average size of 500 to 800 bp in all theexperiments.
Equal amounts of chromatin extracts (350 �g of protein) were immunopre-cipitated with 2.5 �g of antibodies against histone H3 and H2A C-terminal tailor anti-acetyl H3 (anti-AcH3) or H4 (Upstate Biotechnology), depending on theexperiments, at the final concentration of 140 mM NaCl. Chromatin-antibodycomplexes were isolated with protein A Sepharose beads (Amersham) and thenwashed with increasing amounts of NaCl (up to 500 mM), deoxycholate buffer,and 10 mM Tris HCl (pH 8.0)-1 mM EDTA. Immunoprecipitated chromatin wasthen recovered and treated with 0.5 mg/ml proteinase K and 0.25 mg/ml RNase A.
Genomic, immunoprecipitated, and no antibody DNAs (not shown) wereanalyzed by multiple PCR using specific primers.
Different DNA amounts were used as template for PCR, in order to obtaincomparable autoradiographic signals, in particular for input samples 1 �l for a1:20 dilution and 1 �l of IP and no antibody. Template titration for each samplewas performed in order to evaluate the linear range of the amplifications. PCRswere performed under the following conditions: denaturation at 95°C for 30 s,annealing at 55°C for 30 s, and elongation at 68°C for 1 min, with 25 cycles foractin, 21 cycles for ATU rDNA, and 18 cycles for WT and PSW rDNA.[�-32P]dATP was added to the reaction mixture (0.04 �Ci/�l). The amplifiedfragments were separated on a 6% acrylamide gel. Quantification was performedusing a phosphorimager. The band intensities were normalized to the ACT1value, and the IP/input ratio was determined. The average (with standard devi-ations) of at least three independent experiments is reported.
Chromatin analysis. For micrococcal nuclease treatment, cells (100 to 200 mlgrown to an OD of 0.5/ml) were pelleted and resuspended in 10 ml of a buffercontaining 1 M sorbitol, 50 mM Tris-HCl (pH 7.5), and 10 mM -mercaptoeth-anol, in the presence of 0.03 mg/3 107 cells of Zymolyase 100T, and incubatedfor 10 min at 30°C. The resulting spheroplasts were harvested, resuspended innystatin buffer to an OD of about 25/ml (50 mM NaCl, 1.5 mM CaCl2, 20 mMTris-HCl, pH 7.5, 0.9 M sorbitol, 100 �g/ml nystatin) (34), and divided into0.4-ml aliquots. MNase (0.4, 0.8, or 1.6 units) was added to each aliquot, and thesamples were incubated at 37°C for 15 min. The reaction was stopped with 1%sodium dodecyl sulfate (SDS) and 5 mM EDTA (final concentrations). Protein-ase K (40 �g/sample) was added, and the samples were kept at 56°C for 2 h. TheDNA was then purified by three phenol-chloroform-isoamylic alcohol (24:24:1,vol/vol/vol) extractions and ethanol precipitation. RNase A treatment was alsoperformed. Nucleosome spacing analysis was performed as follows. After MNasetreatments and DNA purification, the samples were run in a 1.2% agarose gelelectrophoresis (1.75 V/cm) gel, transferred onto a BA-S 85 nitrocellulose mem-brane (Schleicher & Schuell), hybridized to specific probes (see elsewhere intext) according to standard procedures, and analyzed by autoradiography.
RT-PCR. RNA from yeast cells was isolated as described above, treated withRNase-free DNase I (Boehringer-Mannheim) for 30 min at 37°C, and thenpurified. Three micrograms was subjected to cDNA synthesis with SuperScriptIII RT (Invitrogen) from specific primers.
Primer extension. Twenty micrograms of RNA extracted from cells grown ingalactose (0 min) (transcribing H4 gene) or in glucose (240 min and 360 min)(nontranscribing H4 gene) was subjected to treatment with 1.5 units of DNasefor 15 min at 37°C. The reaction was stopped by 1 mM EDTA, and the reactionmixture was incubated with 5�-labeled oligonucleotide PSW (39) and RT (30 U)for 30 min at 55°C. The retrotranscription was stopped by heat inactivation of RTat 85°C for 5 min. The reaction products were treated with 35 U of RNase A,phenol extracted, and ethanol precipitated. The purified samples were thenloaded on a sequencing gel (6%). After electrophoresis, exposure of the gel to anX-ray film with an intensifying screen was performed.
Induction of CPT-dependent DNA topoisomerase I cleavage sites. Sphero-plasts were obtained as described above and resuspended in cleavage buffer (3mM CaCl2, 1 mM MgCl2, 10 mM Tris-HCl, pH 8.0, 1 M sorbitol, 100 �g/mlnystatin), and aliquots were incubated with 0, 50, or 100 �M camptothecin (CPT)for 2 min at room temperature. The reaction was stopped with 1% SDS, 5 mMEDTA (final concentrations). Proteinase K (40 �g/sample) was added, and thesamples were kept at 56°C for 2 h. The DNA was then purified by three phenol-chloroform extractions and ethanol precipitation, followed by RNase A treat-ment. Multiple-round primer extension and high-resolution analysis of DNAtopoisomerase I cleavage sites were then performed. The specific amount ofgenomic DNA (adjusted to the strain with lower copy number) was elongatedwith Vent polymerase and end-labeled oligonucleotide as described previously(1). The samples were amplified 25 times through the following steps: 95°C for5 min, 58°C for 10 min, and 76°C for 3 min (conditions for oligonucleotide R3,5�-CGCGTTTCCGTATTTTCCGC-3�). The extension products were phenolextracted, ethanol precipitated, dissolved in formamide buffer, and analyzed by6% denaturing polyacrylamide gel electrophoresis. The intensity of the cleavagesite for 50 �M CPT-treated strains was measured by phosphorimaging andnormalized to the unreacted DNA; the ratios were reported as histogram bars.Data refer to means of at least three different experiments, and standard devi-ations are reported.
RESULTS
ncRNA production at rDNA locus increases in Pol I tran-scription-defective mutants. In S. cerevisiae ncRNAs transcrip-tion by Pol II is maintained at a low level because its increaseseems to be associated with rDNA instability (10, 15, 33). Thisseems to be the physiological reason for transcriptional silenc-ing at this genetic locus. rDNA transcriptional silencing hasbeen previously described as a repression of expression of thePol II reporter gene inserted into the ribosomal gene array (2,27). This process has been ascribed to the involvement ofchromatin factors, in particular the histone deacetylase Sir2pand DNA topoisomerase I (2, 27). Moreover, Pol I activity hasbeen shown to provide Pol II transcriptional repression ofreporter genes in strains lacking active Pol I transcription ma-chinery (3, 5).
We asked whether the Pol I activity negatively interfereswith Pol II transcription, in the natural context without anyinsertion, by measuring ncRNA production.
To accomplish this task, we have evaluated the amount ofncRNAs from the NTS region by studying strains that aredifferent both for transcriptionally active units (such as WTand ATU strains) and for the Pol I machinery (such as CF,A43, and PSW strains).
The distinctive features of the strains used are listed in Table 1.The RNA extracted from different mutants, grown to expo-
nential phase, was purified and analyzed by Northern blotting.Figure 2A shows the ncRNA map positions at the NTS region;five major ncRNA species (10, 19, 33) are indicated by hori-zontal thin black arrows. E-PRO (15) indicates the bidirec-tional promoter region of NTS1 ncRNAs (revealed by S2 andS3 probes); C-PRO (19) refers to the cryptic promoter lying inthe NTS2 region (ncRNAs generated from this promoter are
VOL. 9, 2010 rDNA TRANSCRIPTION AND ncRNAs 327
on Septem
ber 18, 2018 by guesthttp://ec.asm
.org/D
ownloaded from

revealed by the S1 probe). Figure 2B shows four differenthybridization profiles, from the same filter, by three differentsingle-stranded probes, S1 to S3 (whose annealing regions arereported in Fig. 2A), revealing the expression of each ncRNAspecies; each probe employed is specified at the right of panelB. The ACT1 expression profile is also reported, as a quanti-tative control (probe ACT1). The last profile, reported at thebottom of panel B, shows the 18S and 25S RNAs (beforetransfer to nylon filter) by ethidium bromide staining of the gel,representing loading control and showing RNA integrity.
A quite different expression of ncRNAs, produced from thecryptic Pol II promoter (C-PRO) in the various mutants, isshown by the S1 probe, which anneals upstream of the 35SRNA initiation site (19). In the ATU strain, where all therDNA units are transcribed by Pol I with very high efficiency,the cryptic promoter is completely silent. Instead, the PSWstrain (with low Pol I activity) overproduces these ncRNAs atvery high levels. In addition, in the two mutant strains that lackPol I transcription, A43 and CF, an increase of ncRNA levelsrelative to WT is also evident. All three ncRNA species de-tected by the S1 probe seem to vary proportionally in all theinvestigated strains.
Similar results were obtained when probes S2 and S3 were
used, even though the strength of silencing mediated by Pol Iat the E-PRO region seems to be less than that observed atC-PRO. This observation suggests a smaller influence of Pol Imachinery on this promoter. The expression of these ncRNAsproduced from E-PRO is lower than that shown by the S1probe from C-PRO, confirming previous results obtained forthe WT strain (10, 19, 33).
Altogether these results suggest that ncRNAs, synthesized inthe NTS region of ribosomal genes, are overproduced by Pol IIin those strains where Pol I does not transcribe 35S RNA; thisis especially true for the PSW strain, where the overexpressionis maximal for all ncRNAs.
The strains analyzed in Fig. 2B differ both for Pol I tran-scription and for rDNA copy number. In order to take intoaccount also the amount of ribosomal genes (potentiallyaffecting the ncRNA expression), we measured the rDNAcopy number of each strain (not shown). The data obtainedare fully in agreement with those previously reported foreach strain (5, 22). We then normalized ncRNA productionto rDNA copy number, in order to evaluate the contributionof the rDNA amount to the observed differences in ncRNAexpression (Fig. 2C); the quantitative analysis (see Materialsand Methods) indicates that the different ncRNA produc-
FIG. 2. Pol II-produced ncRNAs are overexpressed in different mutants for Pol I transcription. (A) Schematic map showing ncRNA positions(horizontal thin black arrows), rRNA (horizontal thick black arrows), ncRNA promoters E-PRO and C-PRO (gray boxes), and positionednucleosomes (ellipses). (B) Northern analysis showing ncRNAs from the strains specified at the top of the gel. Total RNA (20 �g) from eachmutant resolved in a 1.2% agarose gel is visualized with the different probes indicated at the right side of the panel. 18S and 25S RNAs in the lowerpart of the figure show loading control and RNA integrity. (C) ncRNA quantification in the specific strains. S1, S2, and S3 represent differentsingle-stranded probes showing the three main ncRNAs. The band intensities were measured by phosphorimaging and normalized to the ACT1value. In the graph the ncRNA values are given relative to the rDNA copy number.
328 CESARINI ET AL. EUKARYOT. CELL
on Septem
ber 18, 2018 by guesthttp://ec.asm
.org/D
ownloaded from
tion levels observed in the mutant strains do not depend onthe rDNA copy number.
H3 and H4 acetylation at the rDNA locus correlates withdifferent transcriptional conditions. It is conceivable thatrDNA silencing is physiologically needed in order to repressncRNA production. It has been reported that, when Pol Ihighly transcribes rRNA genes, strong Pol II silencing occurs atthe rDNA locus, while in the PSW strain, lacking 35S RNAtranscription by Pol I, this kind of silencing is lost (5). Ingeneral, histone acetylation correlates with the establishmentof an open chromatin conformation that is transcriptionallyactive (16). The importance of chromatin deacetylation bySir2p in rDNA silencing has also been reported (2, 12, 18, 27,29). In addition, in some mutant strains (sir2 or top1 mutant),where rDNA transcriptional silencing is lost, an increase in theacetylation level of histones H3 and H4 occurs (4, 24). Weasked whether Pol I-dependent silencing of ncRNAs is associ-ated with different acetylation states within the NTS region.Thus, we evaluated whether among the strains showing thehighest differences in ncRNA transcription, (i.e., ATU andPSW) different chromatin acetylation patterns are present. Inparticular, as far as the 35S nontranscribing strains are con-cerned, we focused our attention on the PSW strain. In fact,the production of Pol I transcripts is strongly reduced and, asshown in Fig. 2B and C, the ncRNAs reach maximal expres-sion. This phenotype is associated with an increase of recom-bination (10, 15, 33), and this step is fundamental to raise therDNA copy number for the PSW phenotype (22). Thus, PSWstrain analysis could also clarify the relationship among severalprocesses, such as Pol I/Pol II transcription, ncRNA produc-tion, and copy number control.
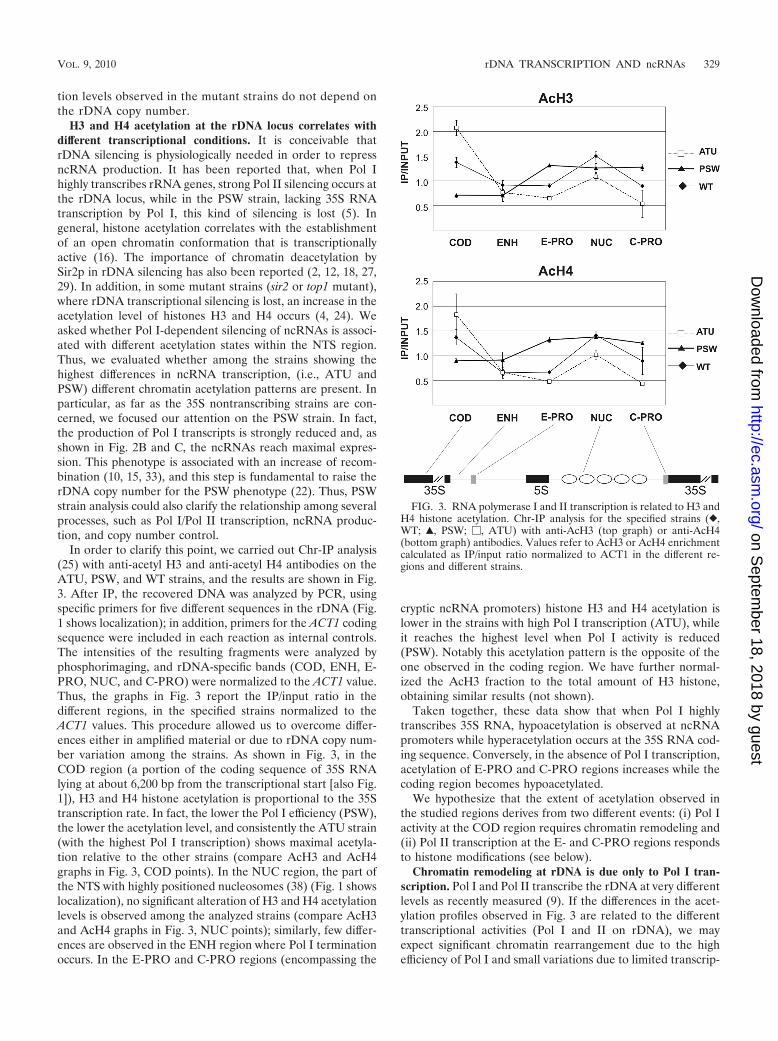
In order to clarify this point, we carried out Chr-IP analysis(25) with anti-acetyl H3 and anti-acetyl H4 antibodies on theATU, PSW, and WT strains, and the results are shown in Fig.3. After IP, the recovered DNA was analyzed by PCR, usingspecific primers for five different sequences in the rDNA (Fig.1 shows localization); in addition, primers for the ACT1 codingsequence were included in each reaction as internal controls.The intensities of the resulting fragments were analyzed byphosphorimaging, and rDNA-specific bands (COD, ENH, E-PRO, NUC, and C-PRO) were normalized to the ACT1 value.Thus, the graphs in Fig. 3 report the IP/input ratio in thedifferent regions, in the specified strains normalized to theACT1 values. This procedure allowed us to overcome differ-ences either in amplified material or due to rDNA copy num-ber variation among the strains. As shown in Fig. 3, in theCOD region (a portion of the coding sequence of 35S RNAlying at about 6,200 bp from the transcriptional start [also Fig.1]), H3 and H4 histone acetylation is proportional to the 35Stranscription rate. In fact, the lower the Pol I efficiency (PSW),the lower the acetylation level, and consistently the ATU strain(with the highest Pol I transcription) shows maximal acetyla-tion relative to the other strains (compare AcH3 and AcH4graphs in Fig. 3, COD points). In the NUC region, the part ofthe NTS with highly positioned nucleosomes (38) (Fig. 1 showslocalization), no significant alteration of H3 and H4 acetylationlevels is observed among the analyzed strains (compare AcH3and AcH4 graphs in Fig. 3, NUC points); similarly, few differ-ences are observed in the ENH region where Pol I terminationoccurs. In the E-PRO and C-PRO regions (encompassing the
cryptic ncRNA promoters) histone H3 and H4 acetylation islower in the strains with high Pol I transcription (ATU), whileit reaches the highest level when Pol I activity is reduced(PSW). Notably this acetylation pattern is the opposite of theone observed in the coding region. We have further normal-ized the AcH3 fraction to the total amount of H3 histone,obtaining similar results (not shown).
Taken together, these data show that when Pol I highlytranscribes 35S RNA, hypoacetylation is observed at ncRNApromoters while hyperacetylation occurs at the 35S RNA cod-ing sequence. Conversely, in the absence of Pol I transcription,acetylation of E-PRO and C-PRO regions increases while thecoding region becomes hypoacetylated.
We hypothesize that the extent of acetylation observed inthe studied regions derives from two different events: (i) Pol Iactivity at the COD region requires chromatin remodeling and(ii) Pol II transcription at the E- and C-PRO regions respondsto histone modifications (see below).
Chromatin remodeling at rDNA is due only to Pol I tran-scription. Pol I and Pol II transcribe the rDNA at very differentlevels as recently measured (9). If the differences in the acet-ylation profiles observed in Fig. 3 are related to the differenttranscriptional activities (Pol I and II on rDNA), we mayexpect significant chromatin rearrangement due to the highefficiency of Pol I and small variations due to limited transcrip-
FIG. 3. RNA polymerase I and II transcription is related to H3 andH4 histone acetylation. Chr-IP analysis for the specified strains (},WT; Œ, PSW; �, ATU) with anti-AcH3 (top graph) or anti-AcH4(bottom graph) antibodies. Values refer to AcH3 or AcH4 enrichmentcalculated as IP/input ratio normalized to ACT1 in the different re-gions and different strains.
VOL. 9, 2010 rDNA TRANSCRIPTION AND ncRNAs 329
on Septem
ber 18, 2018 by guesthttp://ec.asm
.org/D
ownloaded from

tion by Pol II. In order to verify the extent of chromatinrearrangements at the NTS and coding regions, we performednucleosome spacing analysis (38) and compared the digestionprofiles of WT, PSW, and ATU strains. This approach allowedus to show the DNA regions protected by micrococcal nucleasedigestion, therefore revealing the presence in vivo of nucleo-some particles on specific DNA regions.
The strains were grown to exponential phase, processed forspheroplast formation, and permeabilized with nystatin as pre-viously reported (34); the permeabilized spheroplasts weresubjected to MNase digestion (38). In the subsequent Southernanalysis we utilized two different probes in order to detect thepresence of nucleosomes in two major areas of the rDNA unit(see map in Fig. 4): probe C (from �5911 to �6295), whichdetects the 35S coding sequence transcribed by Pol I, andprobe P (from �615 to �509), which anneals with the pro-moter and part of the region with positioned nucleosomes(also Fig. 1; all numbering is from 35S RNA transcriptionalstart, �1).
As shown in Fig. 4A, when probe C, corresponding to thecoding region of the 35S RNA, is used, the nucleosomal pat-tern is maintained in PSW (Pol I-nontranscribing strain), whilethe strains with active Pol I transcription show a diffuse smear(more evident in the ATU sample).
In the PSW strain (probe P, Fig. 4B), a repeated 160-bpsharp ladder of bands (typical of nucleosomal organization) isevident for the NTS region. The samples from the two strains(WT and ATU), transcribing rDNA, show very similar diges-tion profiles, even though in the ATU sample the digestionpattern, corresponding to the dimer particle, shows a diffuse orlarger digestion.
Altogether, these data suggest that the chromatin structureof the NTS region is not reorganized by either Pol I or Pol IItranscription. Conversely, in the coding region of the 35S geneonly the nontranscribing strain (PSW) retains the nucleosomalladder, while in strains where transcription occurs (WT andATU), the same region shows a loss of organized nucleosomes.
These observations, together with the acetylation datashown in Fig. 3, suggest that hyperacetylation at the CODregion is coupled with chromatin remodeling linked to Pol Itranscription. Conversely the hyperacetylation shown at theE-PRO region for the PSW strain (Fig. 3) does not correlatewith chromatin remodeling. We hypothesize that the high levelof histone modifications in the NTS of the PSW strain is linkedto Pol II transcription, even though chromatin remodeling isnot observed.
Nucleosome occupancy changes under different transcrip-tional conditions. To further characterize the chromatin orga-nization occurring at the coding and NTS regions, in associa-tion with both Pol I and Pol II transcription, we evaluatednucleosome presence by measuring H2A and H3 amountsbound to the five investigated regions of rDNA.
We performed Chr-IP (25) using antibodies against H2A orH3 histones in PSW, WT, and ATU strains, and the results areshown in Fig. 5. After IP, the recovered DNA was analyzed byPCR, using specific primers as described above (Fig. 3). Prim-ers for the ACT1 coding sequence were included in each re-action mixture as internal controls. The intensity of the result-ing fragments was analyzed by phosphorimaging, and thespecific bands of rDNA (COD, ENH, NUC, E-PRO, and C-PRO) were normalized to the ACT1 fragments. IP/input ratiowas calculated as described for Fig. 3.
FIG. 4. Pol I, unlike Pol II, modifies nucleosome spacing at the rDNA locus. Spheroplasts from the specified strains were digested withincreasing amounts of MNase (triangles), and DNA was extracted and resolved on a 1.2% agarose gel. Southern analysis by hybridization with C(A) and P (B) probes. Probe map positions are reported in the upper part of the figure. M, molecular weight markers. Black dots indicate DNAfragments derived from digestion of chromatin containing one, two, three, or four nucleosomes.
330 CESARINI ET AL. EUKARYOT. CELL
on Septem
ber 18, 2018 by guesthttp://ec.asm
.org/D
ownloaded from

As reported in the graphs in Fig. 5, the COD region of thePSW strain shows twice as much immunoprecipitated histoneH2A as does the ATU strain, while the WT strain shows anintermediate level; a similar behavior is evident also for H3.This pattern indicates nucleosome eviction associated withhigh Pol I activity. In the NUC and EHN regions, only smalldifferences were observed among the analyzed strains, inagreement with the organization of nucleosomes shown in Fig.4. When the regions near the ncRNA promoters were analyzed(E- and C-PRO), the amounts of immunoprecipitated histoneswere similar for all the strains even if the ATU strain seemedto contain less nucleosome in the C-PRO region. It is inter-esting that in the promoter and coding regions the amounts ofH2A and H3 inversely follow the Pol I transcription rate.
Taken together, the data reported in Fig. 5 show that thechromatin alterations (Fig. 4) observed when transcription oc-curs in the coding region are due to loss of nucleosomes (Fig.5, COD points) and that this effect is particularly evident in theATU strain, where Pol I transcription machinery is stronglyengaged.
Nucleosome disruption differentially affects Pol I and Pol IItranscription at the rDNA locus. The data reported in Fig. 4and 5 demonstrate that the nucleosomes on the NTS are notremodeled by RNA polymerase I transcription. In order toverify whether the nucleosomal organization of NTS may in-
terfere with Pol I or Pol II transcription, we measured both the35S RNA synthesis and ncRNA production in a yeast strain(UKY403) where the histone H4 gene is under GAL1 pro-moter control (14). When the cells are shifted from galactose-to glucose-containing medium (switching off H4 synthesis), aregular chromatin organization is converted to generalized lossof nucleosomal structures (14). We grew UKY403 cells ingalactose medium and withdrew two aliquots, one to performMNase digestion and the other for RNA detection. The re-maining part of the cell population was switched to glucose for240 min and 360 min, and the corresponding aliquots weretreated as reported above. As shown in Fig. 6B, chromatinsamples from the galactose culture, digested with MNase andanalyzed with probe P (Fig. 6A shows localization), showed atypical nucleosomal ladder (0 min). At the opposite end, cellsfrom the glucose-containing medium (240 min and 360 min)did not show a nucleosomal arrangement, confirming the al-most-complete dissolution of the regular chromatin structureat the rDNA locus. Then, we analyzed both Pol I and Pol IItranscripts during the Gal-Glu shift (Fig. 6C and D, respec-tively). The analysis of the 35S RNA transcript was performedby primer extension, using as a primer the oligonucleotidePSW (which hybridizes to the 35S precursor rRNA, 130 nu-cleotides [nt] downstream of the RNA polymerase I start siteas reported in reference 39 and shown in Fig. 6A). This pro-cedure reveals only newly synthesized RNA, due to the oligo-nucleotide annealing to a rapidly processed region (35). RNAfrom cells grown either in galactose or in glucose for 240 or 360min, respectively, did not show any significant difference, indi-cating that nucleosome organization of NTS2 does not directlyaffect the 35S RNA transcription (Fig. 6C). Pol II transcriptswere analyzed by RT-PCR starting from strand-specific oligo-nucleotides (Fig. 6A). The resulting pattern (Fig. 6B) wasdifferent from that of Pol I transcription. In fact, a significantincrease of ncRNA production from E-PRO is observed (S2and S3 amplifications) while only a moderate increase occursat the C-PRO sequence (Fig. 6D).
Taken together, these data suggest that when chromatindisruption occurs, Pol I transcription is not affected, whereasPol II is effectively activated at the E-PRO promoter, while theC-PRO promoter seems to be almost unaffected.
Pol I transcription influences DNA topoisomerase I cleav-age sites upstream from the 35S RNA promoter. It has beendemonstrated that the DNA topoisomerase I mutant (top1)overproduces ncRNAs from the NTS region (10); we wantedto verify whether activity of this enzyme is affected by Pol Itranscription and ncRNA production by employing a powerfulassay which measures the site-specific DNA topoisomerase Iactivity in vivo (37), based on the specific inhibitor CPT (11).For this purpose, we compared the cleavage site production byDNA topoisomerase I in several strains such as the ATU, WT,and PSW strains.
Exponentially growing cells were permeabilized as reportedfor micrococcal digestion (see above) and treated with 50 and100 �M camptothecin, respectively, for cleavage site induction.After DNA purification, the samples were primer extendedunder linear PCR conditions with labeled R3 oligonucleotide(see Fig. 7 for map position and see Materials and Methods forits sequence [37]) and analyzed on a sequencing gel. As shownin Fig. 7A, the site-specific DNA topoisomerase I cleavage
FIG. 5. Histone occupancy changes with transcription of 35S RNA.Chr-IP analysis for quantitative evaluation of H2A and H3 histoneamounts in the specified strains (}, WT; Œ, PSW; �, ATU) withanti-H2A (top graph) or anti-H3 (bottom graph) antibodies. Valuesrefer to H2A or H3 enrichment calculated as IP/input ratio normalizedto ACT1 in the different regions and different strains.
VOL. 9, 2010 rDNA TRANSCRIPTION AND ncRNAs 331
on Septem
ber 18, 2018 by guesthttp://ec.asm
.org/D
ownloaded from

activity at the �171-bp sequence from the 35S RNA transcrip-tional start, previously described (37), is visible in all samplestreated with CPT (triangles). After quantification and normal-ization of the cleavage band relative to that of unreacted DNA,we observed that the DNA topoisomerase I site-specific activ-ity is affected by the ongoing Pol I transcription. In particular,the ATU strain (high Pol I activity) shows the highest cleavageefficiency whereas the PSW strain (low Pol I activity) shows thelowest.
These data, along with those concerning Pol I transcriptionand ncRNA production reported above, suggest that strongDNA topoisomerase I activity is associated with both high PolI transcription and almost-complete ncRNA silencing; con-versely, when transcription of 35S RNA is abolished, ncRNAsincrease and the in vivo DNA topoisomerase I activity is low.
DISCUSSION
The real meaning of transcriptional silencing occurring atthe rDNA locus has not been fully understood yet; in fact PolII-transcribed genes, inserted into the rDNA, lie in regionswhere the DNA is heavily transcribed by Pol I; this excludes asimple silencing model based on transcription factor inacces-sibility. We hypothesized that rDNA silencing represents thenatural way to repress the Pol II-dependent ncRNA synthesisthat could have potentially dangerous effects; in fact, it hasbeen observed that ncRNAs, produced from the NTS region,are associated with altered epigenetic modifications of histones
(19) and induction of hyperrecombination in the ribosomalunits (10).
In order to clarify the physiological meaning of ribosomalsilencing, we measured ncRNA production by Pol II in yeaststrains differing in RNA polymerase I transcription rates. Inaddition, we wanted to better characterize the relationshipbetween the two RNA polymerases’ activity and reciprocalsilencing. As reported in Fig. 2, overexpression of ncRNAsfrom C-PRO is observed for mutants defective in Pol I tran-scription, especially in the PSW mutant, where UAF is lacking(in this strain the rDNA copies are transcribed by Pol II).Actually, as reported with in vitro and in vivo analyses (1, 13),UAF binds DNA just on the region corresponding to theC-PRO promoter and this may be responsible for inhibition ofPol II transcription from this region (Fig. 2). This inhibitoryrole, performed by UAF, could be also exerted when the chro-matin organization is completely lost (Fig. 6), during repres-sion of H4 synthesis. The C-PRO-derived ncRNAs did notmodify their synthesis, while E-PRO became active in theabsence of nucleosomes. The capability of UAF to repressncRNA synthesis may be relevant to the PSW phenotype. Wehypothesize that the absence of UAF, necessary for the PSWphenotype, triggers ncRNA production that in turn inducesrDNA recombination and copy number increase (10, 15, 33).This essential step compensates for the low level of 35S RNAsynthesis by Pol II in the PSW mutant, where Pol I is switchedoff (22).
FIG. 6. Chromatin dissolution affects ncRNA production at the rDNA locus. (A) Schematic map of the analyzed region. (B) UKY cells weretreated for chromatin spacing analysis with increasing amounts of MNase (triangles) at the specified times of glucose repression of the H4 gene.U, untreated DNA. The digested DNAs were separated on a 1.2% agarose gel and subjected to Southern blotting. The resulting filter washybridized to P probe. (C) Primer extension analysis at the specified times of glucose repression of the H4 gene. M, molecular weight marker. Theoligonucleotide PSW was utilized as a primer. (D) RT-PCR results of cDNA obtained from RNA extracted at the specified times of glucoserepression of the H4 gene. S1 to S3 oligonucleotides were used as primers. Different columns in the histogram refer to the specified times of glucoserepression of the H4 gene. The band intensities were measured by phosphorimaging and normalized to the ACT1 value.
332 CESARINI ET AL. EUKARYOT. CELL
on Septem
ber 18, 2018 by guesthttp://ec.asm
.org/D
ownloaded from

Chromatin modifications have been hypothesized to occurduring rDNA silencing (19); thus, we have evaluated whetheralteration of histone acetylation occurs in mutants differing in35S RNA transcription. When Pol II activity rises, producingmore ncRNAs (strain PSW), a significant increase of histoneacetylation is observed, specifically at the Pol II promoters(E-PRO and C-PRO) (Fig. 3); conversely, when Pol I tran-scription is maximal (strain ATU), the acetylation at the E-and C-PRO promoters goes down while it increases at the
coding region (Fig. 3). Other regions engaged in neither Pol Inor Pol II transcription do not change their acetylation statesignificantly in the various mutants (ENH and NUC regions,all strains, Fig. 3). These observations suggest that histoneacetylation correlates with Pol II transcription at E- and C-PRO promoters when silencing is lost. The acetylation level ofthe coding region seems to directly depend only on Pol Iefficiency. We also observed an effective loss of histone pro-teins when transcription of Pol I is high, while during Pol IIactivity this does not occur (Fig. 4 and 5). Accordingly, it hasbeen recently demonstrated that actively transcribed rRNAgenes are largely devoid of histone molecules, and they are alsoassociated with the high-mobility group protein Hmo1 (20);moreover, significant chromatin reorganization has also beenreported for active ribosomal genes (7). In summary, our com-parison between Pol I and Pol II transcription of ribosomalgenes and ncRNAs shows that (i) Pol I, with its extremely highactivity, works in a chromatin context where nucleosomes arelost or significantly acetylated and (ii) Pol II, whose efficiencyof transcription at E- and C-PRO promoters is moderate,requires a significant increase of histone acetylation, withoutcomplete chromatin disruption, as shown in Fig. 4. This obser-vation is also confirmed by the chromatin dissolution experi-ment (Fig. 6) showing that in the strain where the H4 gene isshut down, only genes served by Pol II become more highlytranscribed, while Pol I does not take advantage of an openchromatin condition because it is intrinsically able to removenucleosomes. Previous reports (14, 32) have shown conflictsregarding the extent of Pol I transcription after chromatindisruption. Our results agree with those of Kim et al. (14), eventhough different treatments, conditions, and measuring meth-ods should be taken into account when differences are ob-served.
Finally, we investigated the role of DNA topoisomerase I inPol I transcription and ribosomal silencing. We have demon-strated that in vivo DNA topoisomerase I activity correlateswith Pol I transcription, suggesting that the swivel functiongoes together with the transcription machinery. Consideringthat top1 mutants show loss of transcriptional silencing, we canspeculate that the swivel activity of DNA topoisomerase I isnecessary to sustain Pol I transcription and, thus, that it isdetrimental for Pol II activity.
In conclusion, our observations demonstrate that transcrip-tional silencing occurring at the rDNA locus repressesncRNAs with a strength inversely proportional to Pol I tran-scription. In addition, localized regions of histone hyperacety-lation occur in E- and C-PRO elements when Pol II is activeand in the coding region when Pol I is fully functional. TheDNA topoisomerase I site-specific activity also follows RNApolymerase I transcription. We propose that repression ofncRNAs in response to active RNA polymerase I transcriptionrepresents a physiological regulative circuit (Fig. 8).
Previous studies have addressed the issue of ribosomal si-lencing by the analysis of reporter genes artificially inserted inthe ribosomal locus (2, 3, 5, 27). The experiments reportedhere indicate that 35S RNA transcription by RNA polymeraseI represents the natural control of ncRNA production, associ-ated with genome instability and possibly aging in yeast. Inaddition we identified a new epigenetic marker of Pol II activ-
FIG. 7. In vivo DNA topoisomerase I cleavage efficiency dependson Pol I activity. (A) Spheroplasts from WT, PSW, or ATU cells weretreated with 50 and 100 �M CPT (triangles); � indicates unreactedmaterial. M, molecular weight marker (pBR322 MspI). The fragmentsresulting from DNA topoisomerase I activity were primer extendedfrom oligonucleotide R3 (vertical black arrow) annealing at position�268 bp from the 35S RNA start. The horizontal black arrow indicatesthe DNA topoisomerase I cleavage site; the star indicates a pausingsite of Vent polymerase. On the left of the figure a representation ofthe analyzed region is shown. (B) Quantification of the DNA topo-isomerase I cleavage activity at position �171 bp. The intensity of thecleavage site (50 �M CPT) was normalized to the unreacted materialand reported as a histogram bar for each strain analyzed. Standarddeviations are reported.
VOL. 9, 2010 rDNA TRANSCRIPTION AND ncRNAs 333
on Septem
ber 18, 2018 by guesthttp://ec.asm
.org/D
ownloaded from

ity, H3 and H4 histone acetylation, within the NTS region atthe ncRNA cryptic promoters.
ACKNOWLEDGMENTS
This work was partially supported by the Istituto Pasteur-Fondazi-one Cenci Bolognetti Universita’ di Roma La Sapienza and by Grandiprogetti d’Ateneo 2007 Sapienza, Universita di Roma.
We are grateful to M. Nomura, M. Grunstein, and P. Thurieaux foryeast mutants. We thank Micaela Caserta for critical reading of themanuscript. We also thank an anonymous reviewer of the manuscriptfor helpful and kind suggestions.
REFERENCES
1. Bordi, L., F. Cioci, and G. Camilloni. 2001. In vivo binding and hierarchy ofassembly of the yeast RNA polymerase I transcription factors. Mol. Biol.Cell 12:753–760.
2. Bryk, M., M. Banerjee, M. Murphy, K. E. Knudsen, D. J. Garfinkel, andM. J. Curcio. 1997. Transcriptional silencing of Ty1 elements in the RDN1locus of yeast. Genes Dev. 11:255–269.
3. Buck, S. W., J. J. Sandmeier, and J. S. Smith. 2002. RNA polymerase Ipropagates unidirectional spreading of rDNA silent chromatin. Cell 111:1003–1014.
4. Cioci, F., M. Vogelauer, and G. Camilloni. 2002. Acetylation and accessibilityof rDNA chromatin in Saccharomyces cerevisiae in (Delta)top1 and (Delta)sir2 mutants. J. Mol. Biol. 322:41–52.
5. Cioci, F., L. Vu, K. Eliason, M. Oakes, I. N. Siddiqi, and M. Nomura. 2003.Silencing in yeast rDNA chromatin: reciprocal relationship in gene expres-sion between RNA polymerase I and II. Mol. Cell 12:135–145.
6. Conrad-Webb, H., and R. A. Butow. 1995. A polymerase switch in thesynthesis of rRNA in Saccharomyces cerevisiae. Mol. Cell. Biol. 15:2420–2428.
7. Dammann, R., R. Lucchini, T. Koller, and J. M. Sogo. 1993. Chromatinstructures and transcription of rDNA in yeast Saccharomyces cerevisiae.Nucleic Acids Res. 21:2331–2338.
8. Fritze, C. E., K. Verschueren, R. Strich, and R. E. Esposito. 1997. Direct
evidence for SIR2 modulation of chromatin structure in yeast rDNA. EMBOJ. 16:6495–6509.
9. Hontz, R. D., S. L. French, M. L. Oakes, P. Tongaonkar, M. Nomura, A. L.Beyer, and J. S. Smith. 2008. Transcription of multiple yeast ribosomal DNAgenes requires targeting of UAF to the promoter by Uaf30. Mol. Cell. Biol.28:6709–6719.
10. Houseley, J., K. Kotovic, A. E. Hage, and D. Tollervey. 2007. Trf4 targetsncRNAs from telomeric and rDNA spacer regions and functions in rDNAcopy number control. EMBO J. 26:4996–5006.
11. Hsiang, Y. H., R. Hertzberg, S. Hecht, and L. F. Liu. 1985. Camptothecininduces protein-linked DNA breaks via mammalian DNA topoisomerase I.J. Biol. Chem. 260:14873–14878.
12. Imai, S., C. M. Armstrong, M. Kaeberlein, and L. Guarente. 2000. Tran-scriptional silencing and longevity protein Sir2 is an NAD-dependent histonedeacetylase. Nature 403:795–800.
13. Keys, D. A., B. S. Lee, J. A. Dodd, T. T. Nguyen, L. Vu, E. Fantino, L. M.Burson, Y. Nogi, and M. Nomura. 1996. Multiprotein transcription factorUAF interacts with the upstream element of the yeast RNA polymerase Ipromoter and forms a stable preinitiation complex. Genes Dev. 10:887–903.
14. Kim, U. J., M. Han, P. Kayne, and M. Grunstein. 1988. Effects of histone H4depletion on the cell cycle and transcription of Saccharomyces cerevisiae.EMBO J. 7:2211–2219.
15. Kobayashi, T., and A. R. Ganley. 2005. Recombination regulation by tran-scription-induced cohesin dissociation in rDNA repeats. Science 309:1581–1584.
16. Kurdistani, S. K., and M. Grunstein. 2003. Histone acetylation and deacety-lation in yeast. Nat. Rev. Mol. Cell Biol. 4:276–284.
17. Lalo, D., J. S. Steffan, J. A. Dodd, and M. Nomura. 1996. RRN11 encodesthe third subunit of the complex containing Rrn6p and Rrn7p that is essen-tial for the initiation of rDNA transcription by yeast RNA polymerase I.J. Biol. Chem. 271:21062–21067.
18. Landry, J., A. Sutton, S. T. Tafrov, R. C. Heller, J. Stebbins, L. Pillus, andR. Sternglanz. 2000. The silencing protein SIR2 and its homologs are NAD-dependent protein deacetylases. Proc. Natl. Acad. Sci. U. S. A. 97:5807–5811.
19. Li, C., J. E. Mueller, and M. Bryk. 2006. Sir2 represses endogenous poly-merase II transcription units in the ribosomal DNA nontranscribed spacer.Mol. Biol. Cell 17:3848–3859.
FIG. 8. Relationship between Pol I transcription and ncRNA production. Schematic representation of the relationship between events intranscription by RNA polymerases I and II and histone acetylation in regulative and coding regions of rDNA in S. cerevisiae.
334 CESARINI ET AL. EUKARYOT. CELL
on Septem
ber 18, 2018 by guesthttp://ec.asm
.org/D
ownloaded from
20. Merz, K., M. Hondele, H. Goetze, K. Gmelch, U. Stoeckl, and J. Griesen-beck. 2008. Actively transcribed rRNA genes in S. cerevisiae are organized ina specialized chromatin associated with the high-mobility group proteinHmo1 and are largely devoid of histone molecules. Genes Dev. 22:1190–1204.
21. Mueller, J. E., C. Li, and M. Bryk. 2007. Isw2 regulates gene silencing at theribosomal DNA locus in Saccharomyces cerevisiae. Biochem. Biophys. Res.Commun. 361:1017–1021.
22. Oakes, M., I. Siddiqi, L. Vu, J. Aris, and M. Nomura. 1999. Transcriptionfactor UAF, expansion and contraction of ribosomal DNA (rDNA) repeats,and RNA polymerase switch in transcription of yeast rDNA. Mol. Cell. Biol.19:8559–8569.
23. Petes, T. D. 1979. Yeast ribosomal DNA genes are located on chromosomeXII. Proc. Natl. Acad. Sci. U. S. A. 76:410–414.
24. Robyr, D., Y. Suka, I. Xenarios, S. K. Kurdistani, A. Wang, N. Suka, and M.Grunstein. 2002. Microarray deacetylation maps determine genome-widefunctions for yeast histone deacetylases. Cell 109:437–446.
25. Rundlett, S. E., A. A. Carmen, N. Suka, B. M. Turner, and M. Grunstein.1998. Transcriptional repression by UME6 involves deacetylation of lysine 5of histone H4 by RPD3. Nature 392:831–835.
26. Sherman, F., G. R. Fink, and C. Lawrence. 1983. Methods in yeast genetics.Cold Spring Harbor Laboratory Press, Cold Spring Harbor, NY.
27. Smith, J. S., and J. D. Boeke. 1997. An unusual form of transcriptionalsilencing in yeast ribosomal DNA. Genes Dev. 11:241–254.
28. Straight, A. F., W. Shou, G. J. Dowd, C. W. Turck, R. J. Deshaies, A. D.Johnson, and D. Moazed. 1999. Net1, a Sir2-associated nucleolar proteinrequired for rDNA silencing and nucleolar integrity. Cell 97:245–256.
29. Tanny, J. C., G. J. Dowd, J. Huang, H. Hilz, and D. Moazed. 1999. Anenzymatic activity in the yeast Sir2 protein that is essential for gene silencing.Cell 99:735–745.
30. Thomas, B. J., and R. Rothstein. 1989. Elevated recombination rates intranscriptionally active DNA. Cell 56:619–630.
31. Thuriaux, P., S. Mariotte, J. M. Buhler, A. Sentenac, L. Vu, B. S. Lee, andM. Nomura. 1995. Gene RPA43 in Saccharomyces cerevisiae encodes anessential subunit of RNA polymerase I. J. Biol. Chem. 270:24252–24257.
32. Tongaonkar, P., S. L. French, M. L. Oakes, L. Vu, D. A. Schneider, A. L.Beyer, and M. Nomura. 2005. Histones are required for transcription of yeastrRNA genes by RNA polymerase I. Proc. Natl. Acad. Sci. U. S. A. 102:10129–10134.
33. Vasiljeva, L., M. Kim, N. Terzi, L. M. Soares, and S. Buratowski. 2008.Transcription termination and RNA degradation contribute to silencing ofRNA polymerase II transcription within heterochromatin. Mol. Cell 29:313–323.
34. Venditti, S., and G. Camilloni. 1994. In vivo analysis of chromatin followingnystatin-mediated import of active enzymes into Saccharomyces cerevisiae.Mol. Gen. Genet. 242:100–104.
35. Venema, J., and D. Tollervey. 1999. Ribosome synthesis in Saccharomycescerevisiae. Annu. Rev. Genet. 33:261–311.
36. Verdone, L., G. Camilloni, E. Di Mauro, and M. Caserta. 1996. Chromatinremodeling during Saccharomyces cerevisiae ADH2 gene activation. Mol.Cell. Biol. 16:1978–1988.
37. Vogelauer, M., and G. Camilloni. 1999. Site-specific in vivo cleavages byDNA topoisomerase I in the regulatory regions of the 35 S rRNA inSaccharomyces cerevisiae are transcription independent. J. Mol. Biol.293:19–28.
38. Vogelauer, M., F. Cioci, and G. Camilloni. 1998. DNA protein-interactionsat the Saccharomyces cerevisiae 35 S rRNA promoter and in its surroundingregion. J. Mol. Biol. 275:197–209.
39. Vu, L., I. Siddiqi, B. S. Lee, C. A. Josaitis, and M. Nomura. 1999. RNApolymerase switch in transcription of yeast rDNA: role of transcriptionfactor UAF (upstream activation factor) in silencing rDNA transcription byRNA polymerase II. Proc. Natl. Acad. Sci. U. S. A. 96:4390–4395.
VOL. 9, 2010 rDNA TRANSCRIPTION AND ncRNAs 335
on Septem
ber 18, 2018 by guesthttp://ec.asm
.org/D
ownloaded from