rna canonical and non-canonical base pairing types: a ...major/bin3001/notes/ms-2s-242.pdftypes: a...
TRANSCRIPT
RNA canonical and non-canonical base pairingtypes: a recognition method and complete repertoireSeÂbastien Lemieux and FrancËois Major*
DeÂpartement d'Informatique et de Recherche OpeÂrationnelle, Universite de MontreÂal, C.P. 6128,Succ. Centre-Ville, MontreÂal, QueÂbec H3C 3J7, Canada
Received May 16, 2002; Revised and Accepted August 5, 2002
ABSTRACT
The problem of systematic and objective identi®ca-tion of canonical and non-canonical base pairs inRNA three-dimensional (3D) structures was studied.A probabilistic approach was applied, and an algo-rithm and its implementation in a computer programthat detects and analyzes all the base pairscontained in RNA 3D structures were developed.The algorithm objectively distinguishes amongcanonical and non-canonical base pairing typesformed by three, two and one hydrogen bonds(H-bonds), as well as those containing bifurcatedand C-H...X H-bonds. The nodes of a bipartite graphare used to encode the donor and acceptor atoms ofa 3D structure. The capacities of the edges corres-pond to probabilities computed from the geometryof the donor and acceptor groups to form H-bonds.The maximum ¯ow from donors to acceptors irectlyidenti®es base pairs and their types. A completerepertoire of base pairing types was built from thedetected H-bonds of all X-ray crystal structures of aresolution of 3.0 AÊ or better, including the large andsmall ribosomal subunits. The base pairing typesare labeled using an extension of the nomenclaturerecently introduced by Leontis and Westhof. Theprobabilistic method was implemented in MC-Annotate, an RNA structure analysis computerprogram used to determine the base pairing para-meters of the 3D modeling system MC-Sym.
INTRODUCTION
During the past year, two important RNA structures have beendetermined at high resolution by X-ray crystallography: thelarge and small ribosomal subunits [PDB nos 1FFK and 1FJG(1,2)]. The addition of these two structures not only con®rmsimportant progress that has been accomplished in the ®eld ofRNA crystallography, but also marks an important leap in thecomplexity of the available RNA three-dimensional (3D)structures and in the dif®culty of RNA structure analysis. Untilrecently, there were no tools available to extract the usefulRNA structure information automatically, which hinderedefforts to fully exploit them. An important paradigm switch in
RNA structural analysis is needed, as the observation anddiscovery processes need to be automated so as to provide thespeed and objectivity that are necessary to ful®ll our hopestowards these structures. A method that automatically iden-ti®es hydrogen-bonding (H-bonding) patterns among nitrogenbases using the nomenclature proposed in Leontis andWesthof (3) is presented in this paper.
H-bonding patterns that form between nitrogen bases areparticularly important interactions in RNAs. Efforts have beenmade to establish a repository of base pairs from publishedliterature to show the diversity of nitrogen base pairing typeswith a particular emphasis on non-canonical ones (4), and asystematic nomenclature has been proposed (3). From amodeler's perspective, the spatial relations de®ned by suchH-bonding interactions can be used to de®ne the conforma-tional search space of RNA. For instance, in the RNA 3Dmodeling software MC-Sym (www-lbit.iro.umontreal.ca/mcsym), these spatial relations are learnt from knownexamples and applied to the construction of new RNAstructures (5). In earlier versions of MC-Sym (6), the databasewas built from base pairs that were identi®ed and annotatedusing interactive visualization. However, the number of newlydetermined RNA 3D structures is such that it has becomedif®cult to ensure the MC-Sym database remains up-to-datesimply by continuing to apply such a slow and subjectivemethod. During the development of an automated RNA 3Dstructure annotation program, we realized that no objectivemethod existed for identifying base pairing types in RNA 3Dstructures. All currently available ones are limited to thedetection of single H-bonds and, therefore, base pairing typesmust be identi®ed in a further step by visual examination or byusing heuristics (7). All existing methods detect H-bonds fromthe distance between either the hydrogen or donor atom andacceptor atom, as in Manip (8), and the angle between thehydrogen, donor and acceptor atoms, as in the moleculargraphics software insightII (Biosym/MSI) and Hbexplore (7).The use of such strict parameters is subject to false positivesand negatives when applied to RNA 3D structures that containdistorted base pairs, either due to experimental conditions,density map resolutions or variations in the application ofcomputer optimization protocols.
We present here a new method that resulted from the searchfor an automated and objective method for ®nding andidentifying base pairing types in RNA 3D structures. Theprobabilistic method provides a degree of certainty forthe presence of each H-bond in the structure by considering
*To whom correspondence should be addressed. Tel: +1 514 343 7091; Fax: +1 514 343 5834; Email: [email protected]
4250±4263 Nucleic Acids Research, 2002, Vol. 30 No. 19 ã 2002 Oxford University Press

the formation of H-bonds from competing donors andacceptors. This dependency between H-bonds that share adonor or an acceptor is implemented as a maximum ¯owproblem in a bipartite graph. The decisions are thus taken tomaximize the total number of expected H-bonds in a structurewithout involving a donor or acceptor more than once. Themaximum ¯ow problem formulation was adapted to search foran equilibrium solution that better suits the chemical nature ofthe problem. Base pairs are identi®ed if the total ¯ow,representing the mathematical expectation of the number ofH-bonds forming, is higher than a prede®ned cutoff (typically0.5). This cutoff can be varied depending on the applicationand on the desired sensibility of the detection process.
The only a priori knowledge used in selecting the param-eters of the probabilistic approach is the near aligned geometryof H-bonds. The approach consists of collecting all localgeometries of donor/acceptor pairs, and building a model ofthis distribution. Using the assumption of near alignedgeometries, the model is decomposed in two components:one for the instances that represent the H-bond geometry, andone for those that do not. Consequently, a mixture ofGaussians (with full co-variance matrices) was selected asthe form of density function for the model, and the parametersof this mixture were optimized using the EM algorithm (9)from a data set extracted from physically determined RNA 3Dstructures. The method is robust, reliable and immune to localdistortions due to experimental conditions and computeroptimization protocols. The method was implemented in anewly developed RNA 3D structure analysis computerprogram that is available on the Internet (http://www-lbit.iro.umontreal.ca/). This method was also used to de®nethe base pairing and base stacking parameters of MC-Sym, aswell as for matching larger RNA 3D patterns and motifs.
In order to identify a base pairing type, the namingscheme proposed by Leontis and Westhof (10) was usedand extended. An algorithm that automatically names abase pairing using the information from the maximum¯ow optimization is presented. This algorithm was appliedto 165 high resolution (<3 AÊ ) X-ray structures in thePDB (11) HR-RNA-SET (see Table 1 for a list). Thecollected base pairs were classi®ed, resulting in acomplete repertoire of the base pairing types in RNAstructures (available at http://www-lbit.iro.umontreal.ca/).
Our analysis of RNA 3D structures led us to three mainresults. First, we developed a method to automatically identifybase pairing types in RNA 3D structure. Second, we re®ned anexisting nomenclature and implemented its de®nitions in acomputer program. Third, we built the repertoire of basepairing types found in high-resolution RNA X-ray structures.
MATERIALS AND METHODS
Data set
The subset of PDB structures used in this work, HR-RNA-SET, is composed of those that contain at least one RNAnucleotide, and that were determined by X-ray crystallographywith a resolution of 3 AÊ or less, as of February 1, 2001. Table 1shows the list of 3D structures that are included in HR-RNA-SET. Two ®les in the initial list were rejected: 1QCU and406D. Both structures contain multiple models with different
chain identi®ers, and do not have proper MODEL/ENDMDLtags. This non-conformity to the PDB syntax precludes usfrom applying our automated procedure to these two struc-tures. To ensure complete uniformity of hydrogen atomnames, they were removed, if present, and then added usingbond lengths and angles from the Cornell et al. force ®eld (12).When appropriate, lone pair pseudo-atoms (LP) were placed1 AÊ from their atom in the direction of the lone electron pair,as determined by the sp2 geometry of the base atoms. Namesfor the LP were assigned by following the standard nomen-clature of hydrogen atoms in the PDB, replacing the H by LP.
Base pair identi®cation
In order to guide the reader through the steps of this method,we exempli®ed each computation by using a canonical G´CWatson±Crick base pair extracted from positions A79 and B97of the loop E motif from Escherichia coli 5S rRNA [PDB no.354D (13)] (Fig. 1A). The method is divided into three steps:(i) compute the probabilities of H-bonds between each pair ofdonor and acceptor groups and build a graph representingthese interactions; (ii) compute the maximum ¯ow in thisgraph to account for competing donors and acceptors; (iii)assign the types of base pairs according to the probabilities ofH-bonds forming.
For each base in the structure, the hydrogens are addedaccording to geometries de®ned in Cornell et al. (12). LP areadded and placed 1 AÊ from the oxygen or nitrogen atoms in thedirection of the orbital. We use the term donor group to refer toa pair of associated donor and hydrogen atoms and the termacceptor group to de®ne a pair of associated acceptor and LP.
Given the list of potential donor and acceptor groups for a3D structure, we compute the probability of forming a H-bondfrom the values of three measurements: the distance betweenthe hydrogen and the LP; the angle between the hydrogen, the
Table 1. HR-RNA-SET
The PDB identi®ers of the X-ray RNA structures with a resolution of3.0 AÊ or better. This list was compiled on February 1, 2001. Twostructures were removed from the list: 1QCU and 406D. These twostructures contain multiple models with different chain identi®ers andhave improper MODEL/ENDMDL tags. These structures can bedownloaded from the Internet at http://www.rcsb.org/pdb/.
Nucleic Acids Research, 2002, Vol. 30 No. 19 4251

donor and the acceptor atoms (referred to as the hydrogenangle); and the angle between the donor and acceptor, and theLP (referred to as the LP angle). Figure 2 shows a H-bond withthese three measurements identi®ed.
Our data set is built by extracting these values from all pairsof donor and acceptor groups in HR-RNA-SET (see Table 1for the list of 3D structures), resulting in a data set c = {x1,¼,xn}, where xi = (x i
1, x i2, x i
3) is a vector de®ning the distance, thehydrogen angle and the lone pair angle. To reduce the amountof data, we extracted only the values from pairs of residuesthat contain a pair of atoms at 3 AÊ of distance or less.
To obtain both ¯exibility and ef®ciency, we applied a semi-empirical approach that models the distribution of data points
by a sum of Gaussians. Because the geometrical nature of themeasurements introduces a bias in the distribution of datapoints, the raw distributions of the extracted values cannot bedirectly modeled by a sum of Gaussians. To obtain a properdistribution, a transformation x¢ = F(x) was applied to eachdata point. This process is similar to histogram equalization incomputer graphics (14), and allows us to transform anyarbitrary distribution into another. Here, we wished to derive atransformation so that the data points measured fromrandomly scattered points in space resulted in a uniformdistribution and, thus, to remove the geometrical bias. Suchtransformation was obtained by computing the cumulativeprobability density given the random model for each dimen-sion of the data points. In the case of the distance, thecumulative probability density is proportional to the volume ofa sphere of radius x1. For the angles, the cumulativeprobability density is proportional to the volume of a sphericalcone of angle x2 (or x3). The transformation we obtained isgiven by F(x) = [x3
1,cos(x2),cos(x3)].However, this transformation is inappropriate to model the
distribution as a sum of Gaussians since only a speci®c rangeis accessible in each of the three dimensions of the data points(x1 > 0, 0 < x2,3 < 1). To solve this problem, a furthertransformation was applied to the data points so that eachdimension was distributed in [±`,`]. The complete trans-formation is then F(x) = {ln(x3
1), arctanh[cos(x2)],arctanh-[cos(x3)]}.
The distribution of transformed data points is modeled as asum of Gaussians without any constraint on the mean vectorand the co-variance matrix. This model has the advantage ofmodeling the dependencies between the dimensions of thedistribution. A possible drawback is the increase in the numberof parameters, which increases the risk of over®tting the data(15). However, our data points represent a large sample of thedistribution, and in practice this is not the case. Theparameters of the model (mean vector, co-variance matrixand weight for each Gaussian) are optimized using the EMalgorithm (9,15). To avoid local minima, a variant of thealgorithm was used where only 25 000 randomly chosen datapoints were considered at each iteration. The EM algorithm isknown to minimize the negative log-likelihood and, thus,to return the parameters that maximize the likelihood of
Figure 1. A base pairing and associated graph. (A) A canonical G´CWatson±Crick base pair extracted from positions A79 and B97 of the loopE motif from E.coli 5S rRNA (PDB no. 354D). The thin lines indicate thedirection of LP, named using the same convention as for the hydrogenatoms. (B) Corresponding graph showing the probabilities associated withthis base pair (see Table 2 for the actual measurements and probabilities).The donor groups are located in the upper row of nodes, and the acceptorgroups in the bottom row. The arrow shows the direction of the ¯ow fromthe source to the sink. The capacities are indicated beside each edge (onlyedges with capacity >10±4 are shown). The thin lines show the edges withno ¯ow after the optimization of the maximum ¯ow. The thick linesbetween acceptor and donor groups correspond to the selected H-bonds.
Figure 2. H-bond parameters. The putative H-bond shown is a weakC-H¼O. The hydrogen and LP angles are identi®ed by a and b, respect-ively, and the distance between the hydrogen and LP is indicated by d.Nitrogen and hydrogen atoms are shown by large and small ®lled circles,respectively. Oxygen atoms are shown by open circles. Thin lines are usedto indicate the direction of the LP.
4252 Nucleic Acids Research, 2002, Vol. 30 No. 19
generating the data set. Once the parameters of the model areoptimized, a visual inspection of the characteristics of eachGaussian was suf®cient to determine which one(s) is respon-sible for the data points forming H-bonds.
The probability that a local geometry, x, forms a H-bond isequivalent to the probability that x is drawn from the Gaussiandescribing H-bond geometries, H = h, and not from the others.P(H = h | x) can be computed using Bayes theorem:
P(H = h | x) = [p(x | H = h) P(H = h)]/[p(x)]= [p(x | H = h)P(h)]/[S7
j=1p(x | H = j)P(H = j)] 1
where p(x | H = h) is the probability of generating x fromGaussian h, P(H = h) is the prior probability of forming aH-bond and p(x) is the probability of observing geometry x.Table 2 shows the measurements and modeled probabilityaccording to equation 1 for each pair of donor and acceptorgroups for the G´C Watson±Crick base pair extracted frompositions A79 and B97 of the loop E motif from E.coli 5SrRNA [PDB no. 354D (13)]. (The nucleotides in the PDBformat are labeled by a chain identi®er and a residue number.We refer to a base pair by a reference to the two residue PDBlabels seperated by a colon. Quotes are used to distinguishbetween a numerical chain identi®er and the residue numbers.The quotes are not necessary when a letter is used for the chainidenti®er.)
Consider a speci®c donor or acceptor group. We de®ne asstable a set of one or more H-bonds that involve this donor oracceptor group if the sum of their associated probabilities is<1. Consequently, one can interpret the probabilities as theproportion of time a group is occupied in the formation of eachH-bond in a stable set (Fig. 3). The stable set of a given groupis chosen in order to maximize the total number of H-bonds inthe structure. This is computed ef®ciently by de®ning amaximum ¯ow problem on a directed bipartite graphconnecting donors to acceptors. The graph, G = (N,A),where N is the node set and A the arc set, is a bipartite graphthat contain the set, I, of nodes for the donor groups and theset, J, of nodes for all acceptor groups. If the probability offorming a H-bond between donor i Î I and acceptor j Î J is>10±4, an arc (i, j) is added to the graph with capacity, uij, equalto the probability of forming this H-bond. Two special nodesare then added to the graph, s and t, called the source and thesink, respectively. Arcs that link the source to all donor, (s,i) ÎA "i Î I, and all acceptors to the sink, (j,t) Î A "j Î J, areadded with a capacity of 1. The maximum number of H-bondsthat can form in the molecule is obtained by solving the
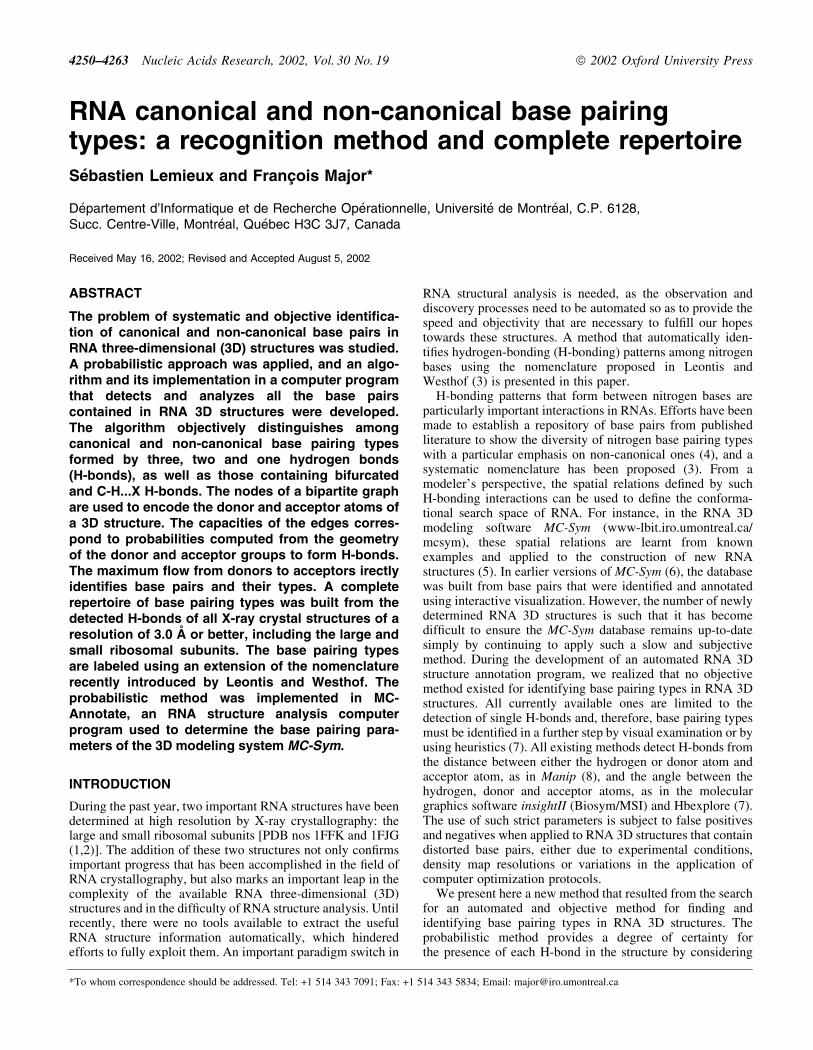
Table 2. Base pair G:A79´C:B97 of the loop E motif from E.coli 5SrRNA (354D)
The three transformed measurements and the modeled probabilities areshown for each pair of donor and acceptor groups. The values wererounded to the third decimal. The names used to identify LP are builtusing the same rules as the standard PDB hydrogen atoms names.
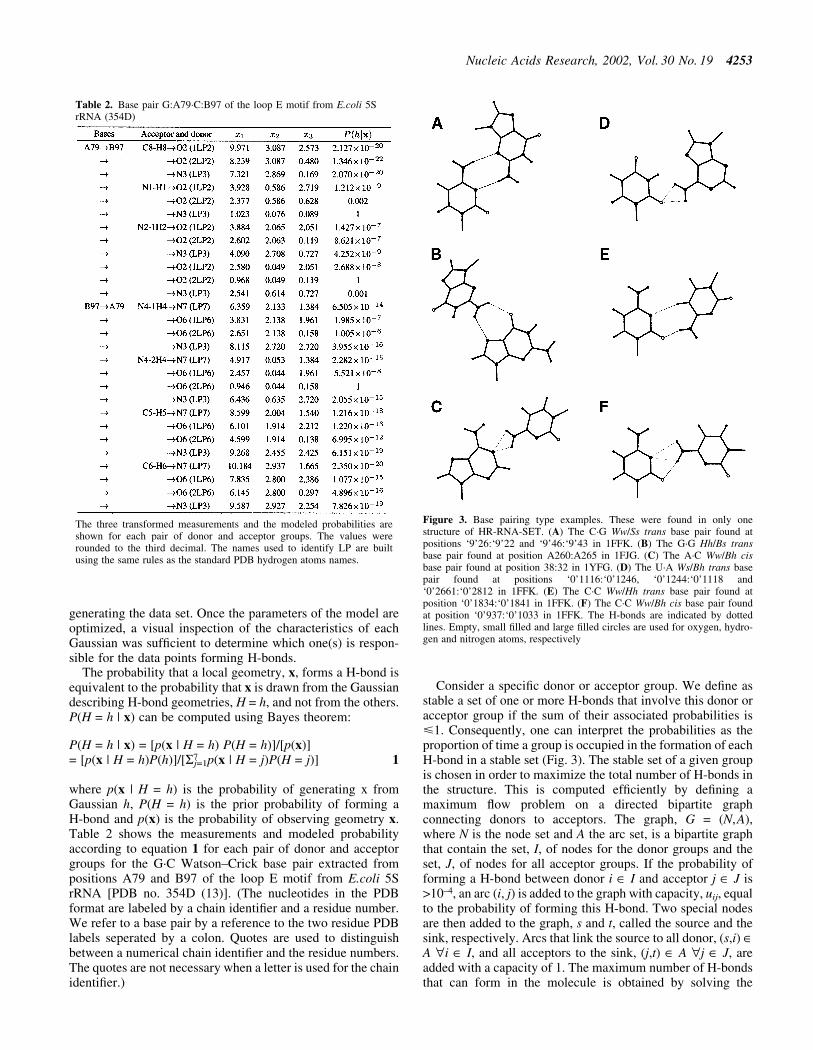
Figure 3. Base pairing type examples. These were found in only onestructure of HR-RNA-SET. (A) The C´G Ww/Ss trans base pair found atpositions `9'26:`9'22 and `9'46:`9'43 in 1FFK. (B) The G´G Hh/Bs transbase pair found at position A260:A265 in 1FJG. (C) The A´C Ww/Bh cisbase pair found at position 38:32 in 1YFG. (D) The U´A Ws/Bh trans basepair found at positions `0'1116:`0'1246, `0'1244:`0'1118 and`0'2661:`0'2812 in 1FFK. (E) The C´C Ww/Hh trans base pair found atposition `0'1834:`0'1841 in 1FFK. (F) The C´C Ww/Bh cis base pair foundat position `0'937:`0'1033 in 1FFK. The H-bonds are indicated by dottedlines. Empty, small ®lled and large ®lled circles are used for oxygen, hydro-gen and nitrogen atoms, respectively
Nucleic Acids Research, 2002, Vol. 30 No. 19 4253

maximum ¯ow problem of this graph from node s to t,resulting in values xij for i Î I and j Î J, which indicate theresulting ¯ow.
Algorithms that solve the maximum ¯ow problem return anextremal solution (16). In the context of H-bond probabilities,an extremal solution means that the algorithm, when facedwith a situation where two equivalent H-bonds can formexclusively of one another, will favor the complete formationof one of the H-bonds and leave the rest of the ¯ow (typically0) to the other. Since here we are more interested in theequilibrium state of the system, a criterion needs to be added,when allowed [notation used as in Ahuja et al. (16)]:
xij > xik or xij = uij for i Î I and j,k Î J 2
xij > xkj or xij = uij for i,k Î I and j Î J 3
This criterion is satis®ed by modifying the pre¯ow-pushalgorithm (17). As the FIFO variant of the pre¯ow-pushalgorithm [see Ahuja et al. (16) for a complete description ofthe algorithm, and Ahuja et al. (18) for theoretical andempirical performance comparisons] was selected for itssimplicity of implementation, the push/relabel() operationwas modi®ed in the following way:
procedure push/relabel(i);begin
let O be the set of admissible output arcs for node i;let n be the size of O;sort arcs (i, j) Î O by their rij;for (i, j) Î O do:
d ¬ min[rij,e(i)/n];xij ¬ xij + d;e(i) ¬ e(i) ± d;n ¬ n ± 1;
if e(i) > 0 thenlet I be the set of admissible input arcs for node i;let n be the size of I;sort arcs (i, j) Î I by their rij;for (i, j) Î I do:
d ¬ min[rij,e(i)/n];xij ¬ xij ± d;e(i) ¬ e(i) ± d;n ¬ n ± 1;
if e(i) > 0 thend(i) ¬ min[d(j) + 1: (i, j) Î A(i) and rij > 0];
end;
Nomenclature
Several schemes were proposed to name RNA base pairingtypes (10,19±21). The proposition from Leontis and Westhof(3), LW, was retained, where a base pair is described by a pairof names that are associated with the faces of the basesinvolved. This nomenclature has several advantages. First, thenames are easy to remember and there is no need to referenceany documentation. Second, the name alone gives a good ideaof the base pair geometry. Third, isosteric pairs have the samename.
Despite these advantages, LW cannot differentiate basepairing types that differ by a sliding of the bases along theinteracting faces, especially in the context of single H-bond
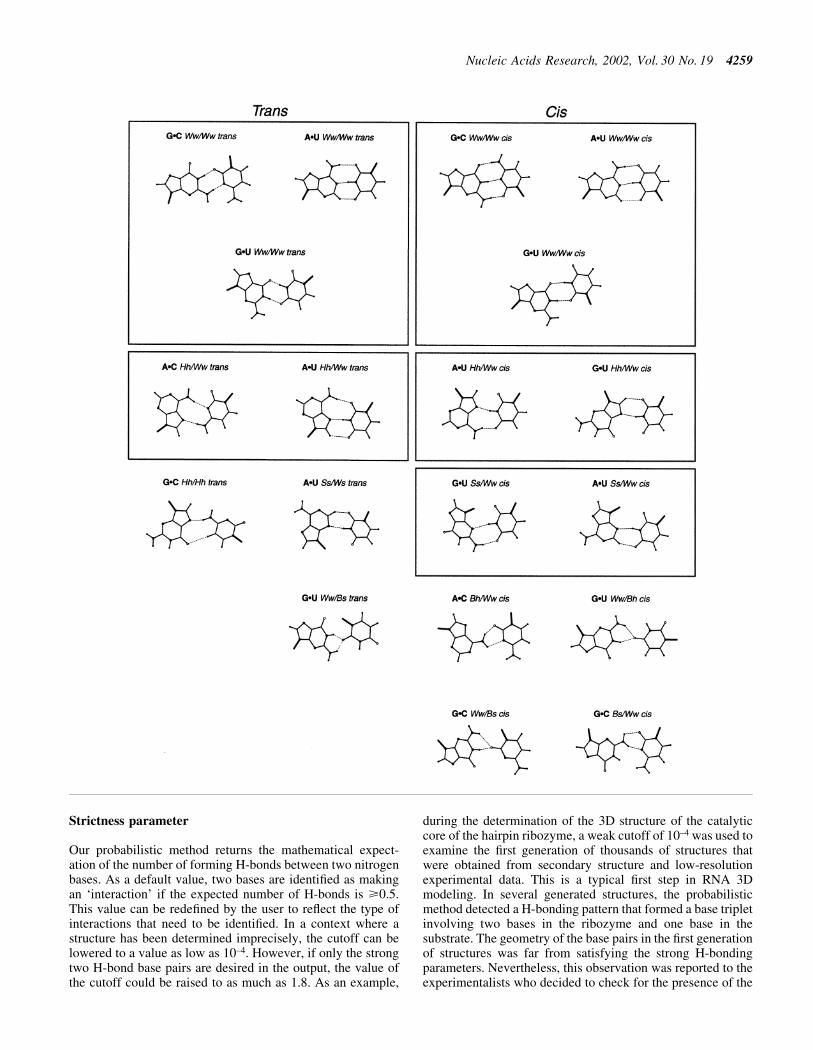
base pairs. Thus, to increase the precision of LW, we de®nedLW+ by decomposing the faces in sub-faces. Then, we de®nedand implemented an algorithm to reduce possible identi®ca-tion ambiguities to anecdotal occurrences. However, thecurrent implementation does not support the detection ofwater-mediated, protonated, ribose- or phosphate-moietyinvolved base pairs. Figure 4 shows the four RNA bases andassociated faces. For convenience, the Watson±Crick edgewas abbreviated to W, the sugar edge to S and the Hoogsteen/C-H edge to H. The sub-face names are indicated bycombining face abbreviations, for instance Ww correspondsto the central section of the W face, and Hw to the section ofthe H face that is adjacent to the W face. Bifurcated base pairsof LW were renamed by creating small faces at the center ofamino and keto groups. These faces are named Bh and Bs forthe bifurcated base pairs involving the Hoogsteen side amino/keto group and the sugar side amino/keto group, respectively.The C2-H2 group of the adenosine was named Bs to facilitatethe identi®cation of isosteric base pairing types (see Fig. 4).We also introduced a special face, C8, for the C8-H8 donorgroup of the purines. The order of the faces is the same as theorder of the bases. The cis and trans semantic for the relativeorientation of the glycosidic bond with respect to the base pairaxis are the same as in LW. Note that the local strandorientation and base±sugar conformation are not speci®ed inthe base pair notation since they belong rather to nucleotideconformations.
The face involved in a base pairing type is obtained bycomputing the contact point, de®ned by the weighted mean ofthe hydrogen and LP of each base. The weights correspond tothe calculated probabilities of each H-bond as returned by themaximum ¯ow algorithm. The face containing the contactpoint is returned.
To compute the glycosidic bond orientation the visualcontact point is de®ned, a variant of the contact point,obtained by replacing the LP by the acceptor atoms. Thevector between the two visual contact points, the contactvector, is used as the axis of the base pair, and the glycosidicbonds are attached to its extremities. A cis orientation isde®ned by a torsion around the contact vector <90°, and thetrans orientation otherwise.
Availability
The software was developed using the MC-Sym developmentlibrary under the Linux operating system, which is publiclyavailable at mccore.sourceforge.net. The code is written inC++ and, therefore, is easily portable to other Unix platforms,such as IRIX and SunOS. The probabilistic method has beenintegrated to the MC-Annotate system (22), and is accessibleon the Web. RNA 3D structures can be submitted for theidenti®cation of base pairing types and complete analysis atwww-lbit.iro.umontreal.ca/mcannotate.
RESULTS
Base pair identi®cation
The data set collected from HR-RNA-SET contained 1 607 756data points. The distributions of the transformed data pointsare shown in Figure 5 as shades of gray.
4254 Nucleic Acids Research, 2002, Vol. 30 No. 19

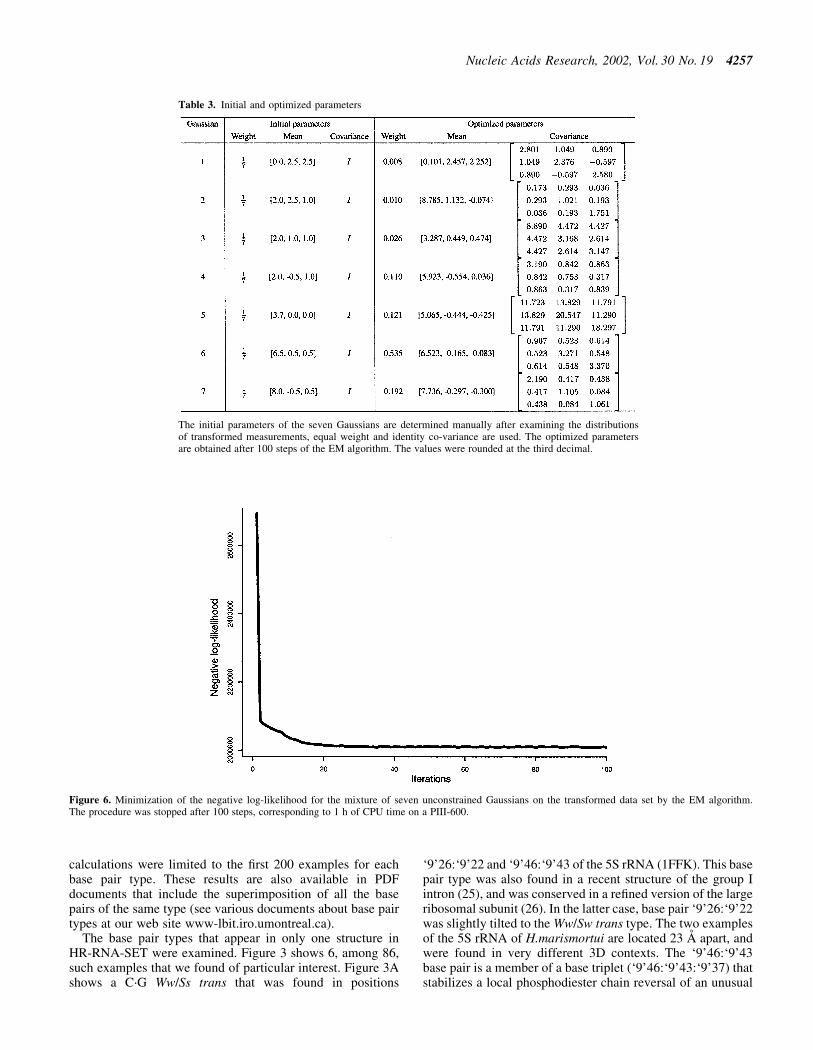
Initial values for the parameters were determined by visualinspection of the data set, and seven Gaussians provided anaccurate model of the data set. The EM algorithm wasinitialized with seven Gaussians, the initial parameters areshown in Table 3. Figure 6 shows the negative log-likelihoodof generating the data set with the current parameters as thealgorithm progresses. One hour of CPU time was necessary ona PIII/600 Mhz to complete the learning process. As a result,only one Gaussian (the one centered on the smallest distanceand angles) is suf®cient to represent H-bonds, the six otherGaussians provide an accurate model of the distribution ofnon-bonded donor±acceptor pairs. Table 3 shows the initialand ®nal parameters of the seven Gaussians before and afteroptimization. Figure 5 shows the optimized model (thin blacklines) superposed with the extracted data (gray shades).
Figure 7 shows the ¯ows resulting from the computation ofthe stable H-bond set in HR-RNA-SET. In Figure 7A, bothdistributions of capacities and ¯ows are shown. The distribu-tion of Figure 7B shows the total ¯ow obtained for every base
pair. The discrete character of this distribution suggests that acutoff can be applied in the identi®cation of base pairs with atleast one H-bond, thus assuming that a base pair forms only ifthe total ¯ow between two bases is >0.5. This parameter canbe adjusted to re¯ect stringency of the identi®cation process.
Repertoire of base pairing types in RNA
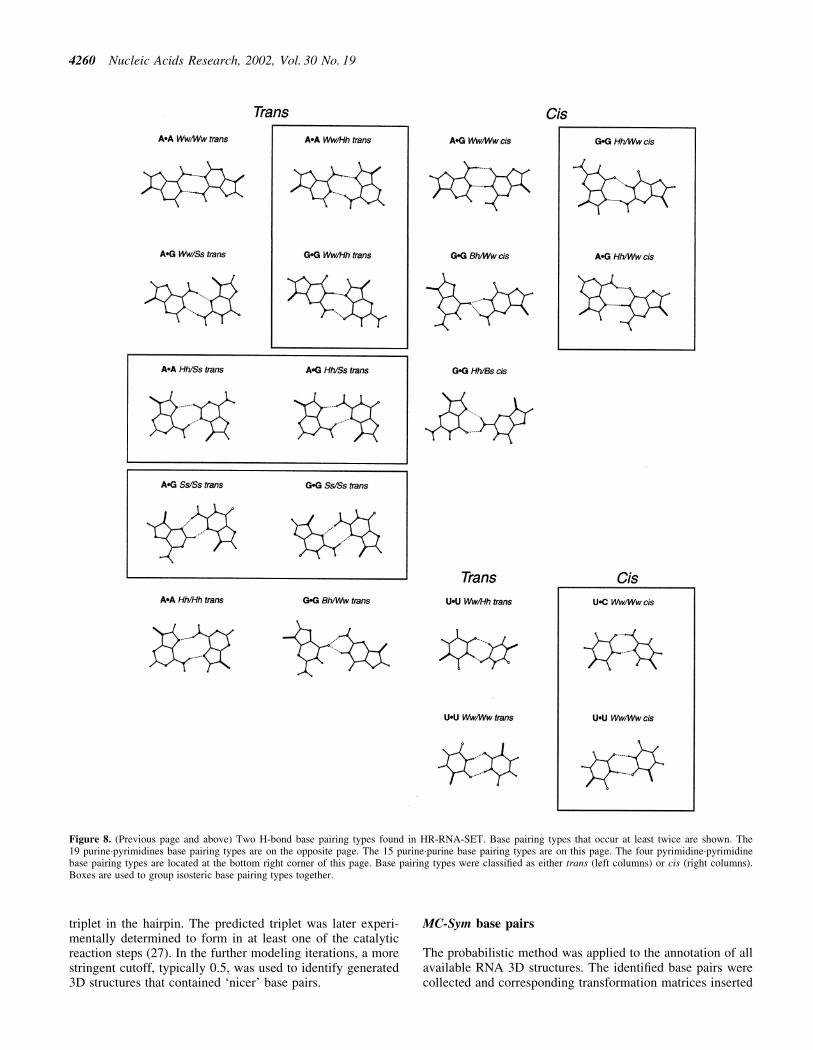
The algorithm presented here allowed us to perform asystematic survey of all of the base pairs in high resolutionX-ray RNA structures, and to study their geometrical diver-sity. For HR-RNA-SET, the complete repertoire was built in<4 min on a PIII-600. Figure 8 presents 38 base pairing typesthat occur at least twice in HR-RNA-SET. Because of spaceconstraints, base pairing types that form only one H-bond werenot included in this survey. The structure that minimizes thesum of RMSD (23,24) with all other base pairs of the sametype is shown. Structure and position information about thesespeci®c base pairs is shown in Table 4. In order to optimizethe identi®cation of representative base pairs, the RMSD
Figure 4. RNA base faces. Nitrogen atoms are shown by large black circles, hydrogen by small ®lled circles and oxygen atoms by open circles. The LP areshown with thin lines. The ribose moiety is shown by the letter R.
Nucleic Acids Research, 2002, Vol. 30 No. 19 4255

Figure 5. Superimposed two-dimensional projections of the data set histogram, modeled probability density and surface of decision. The histogram of thedata set is shown in shades of grey. The modeled probability density is shown by thin isocontours. Between 0 and 0.25 they were plotted at each 0.05 interval,whereas between 1 and 15 they were plotted at each interval of 1. An integration was carried out on the axis of projection corresponding to the effectobserved by the histogram. The surface of decision is shown with thick lines isocontoured at probabilities 0.1, 0.5 and 0.9. The maximum probability isreturned on the axis of projection. The circles represent the optimized mean of the seven Gaussians.
4256 Nucleic Acids Research, 2002, Vol. 30 No. 19
calculations were limited to the ®rst 200 examples for eachbase pair type. These results are also available in PDFdocuments that include the superimposition of all the basepairs of the same type (see various documents about base pairtypes at our web site www-lbit.iro.umontreal.ca).
The base pair types that appear in only one structure inHR-RNA-SET were examined. Figure 3 shows 6, among 86,such examples that we found of particular interest. Figure 3Ashows a C´G Ww/Ss trans that was found in positions
`9'26:`9'22 and `9'46:`9'43 of the 5S rRNA (1FFK). This basepair type was also found in a recent structure of the group Iintron (25), and was conserved in a re®ned version of the largeribosomal subunit (26). In the latter case, base pair `9'26:`9'22was slightly tilted to the Ww/Sw trans type. The two examplesof the 5S rRNA of H.marismortui are located 23 AÊ apart, andwere found in very different 3D contexts. The `9'46:`9'43base pair is a member of a base triplet (`9'46:`9'43:`9'37) thatstabilizes a local phosphodiester chain reversal of an unusual
Table 3. Initial and optimized parameters
The initial parameters of the seven Gaussians are determined manually after examining the distributionsof transformed measurements, equal weight and identity co-variance are used. The optimized parametersare obtained after 100 steps of the EM algorithm. The values were rounded at the third decimal.
Figure 6. Minimization of the negative log-likelihood for the mixture of seven unconstrained Gaussians on the transformed data set by the EM algorithm.The procedure was stopped after 100 steps, corresponding to 1 h of CPU time on a PIII-600.
Nucleic Acids Research, 2002, Vol. 30 No. 19 4257

13 nt loop between positions `9'33 and `9'47. The other basepair of this type, at positions `9'26:`9'22, stabilizes adisordered internal loop. It is worth noting here that atheoretically generated example of this base pair type has beenincluded in the MC-Sym modeling system (6) since its very®rst version, as the 119 base pair.
Figure 3B shows a base pair of type G´G Hh/Bs trans foundat positions A260:A265 in the structure of T.thermophilus 30Sribosomal subunit (1FJG). Again, here, an example of thisbase pair type was theoretically generated and included in the®rst version of the MC-Sym database, and was referred to asbase pair 34. This base pair is ¯anking a 7 nt loop that interactswith protein S20.
Figure 3C shows a base pair of type A´C Ww/Bh cis found atpositions 38:32 of the yeast initiator tRNA (1YFG). Here, weuse the term bifurcated to qualify a base pair in which two H-bonds either share the same hydrogen or LP. The equilibratedmaximum ¯ow settles the probability of each H-bond tovalues close to 0.5, expressing the shared nature of theinteraction and, hence, the pairing of Figure 3C is a perfectexample of a bifurcated base pair. The base pair of type U´AWs/Bh trans presented in Figure 3D is another example of a
bifurcated base pair, as found at positions `0'1116:`0'1246,`0'1244,`0'1118 and `0'2661:`0'2812 of 1FFK.
Figure 3E presents a base pair of type C´C Ww/Hh transfound at positions `0'1834:`0'1841 of structure 1FFK. Thisnon-canonical base pair closes a short helix, and stabilizes abulged out adenosine and a 6 nt loop. The interaction ismaintained by a H-bond between the extra cyclic amino of oneC to the oxygen of the other base, and by the formation of aweaker C-H¼N H-bond. Note that these H-bonds wereincluded in the H-bond data set used to optimize theparameters of the mixture of Gaussians and, although theyusually exhibit geometrical parameters slightly different to theother types of H-bonds, they are properly identi®ed by theprobabilistic model.
Figure 3F shows a convoluted network of three partialH-bonds obtained after the resolution of the equilibratedmaximum ¯ow problem. The base pair was observed atpositions `0'937:`0'1033 in 1FFK, the ®rst non-canonical basepair of a 10 nt internal loop that is adjacent to a G´A shearedtandem. The H-bond network describes a double bifurcatedbase pair, as the LP of N3 is shared between both hydrogens ofthe extra cyclic amino group, and one of these hydrogens is inturn shared with one of the LP of the O2 atom. The probabilityfor each H-bond is such that their sum is maximized, andrespect the stable set constraint. The base pair is recognized bythe probabilistic system despite its peculiar geometry.
DISCUSSION
Distance versus probabilistic models
The most employed distance for recognizing H-bonds is theone between the donor and acceptor atoms, dD±A, which iseasy to compute and to observe interactively, and it does notrequire either the hydrogen or LP. Figure 9 presents thedistributions of three distances as measured from HR-RNA-SET. The distribution of dD±A (black line) does not contain aclear separation between H-bonds (®rst peak) and nonH-bonds and, thus, does not provide a good classi®cationcriterion. The distance used in Massire and Westhof (8),between the hydrogen and the acceptor atoms, dH±A, is a betterone, as shown by the green line. Massire and Westhofsuggested a cutoff at 2.1 AÊ , but from the distribution inFigure 9, a cutoff at 2.4 AÊ would be a better solution. The 2.1 AÊ
cutoff was retained to reduce the number of false negatives inthe context of molecular modeling (E. Westhof, personalcommunication). Finally, the distance between the hydrogenand LP, dD±LP, among the three distances is the best, if onlyone distance must be used. As indicated from the blue linedistribution, a cutoff between 1.5 and 1.8 AÊ would be effectivefor dH±LP.
In order to quantify the power of using a probabilistic overthe strict distance approach, a scattered plot where each dotrepresents one putative H-bond was created. Figure 10 showsthat a signi®cant number of H-bonds were assigned aprobability 0 by using the probabilistic method, whereasthey would have been identi®ed as forming H-bonds usingdH±A with a cutoff at 2.1 AÊ , and as proposed by Massire andWesthof (8). Moreover, most of the H-bonds that wereassigned a probability of 1 using the probabilistic modelwould have been rejected by the distance method.
Figure 7. Probability densities for xij, uij and the total ¯ow of the basepairs. The probabilities were computed for all base pairs in HR-RNA-SET.Only those with a probability >10±4 are plotted. (A) The probability densityfor xij and uij are shown with a thin black line and yellow line, respectively.The center peak for xij (the optimized ¯ow) is the result of bifurcated H-bonds. (B) The distribution of total ¯ows obtained between every base pairin HR-RNA-SET. The total ¯ow can be seen as the mathematical expect-ation of the number of H-bonds forming between two bases. The distribu-tion clearly shows the discrete nature of this value. The area of each peakshows the relative proportion of one, two and three H-bond base pairs.
4258 Nucleic Acids Research, 2002, Vol. 30 No. 19
Strictness parameter
Our probabilistic method returns the mathematical expect-ation of the number of forming H-bonds between two nitrogenbases. As a default value, two bases are identi®ed as makingan `interaction' if the expected number of H-bonds is >0.5.This value can be rede®ned by the user to re¯ect the type ofinteractions that need to be identi®ed. In a context where astructure has been determined imprecisely, the cutoff can belowered to a value as low as 10±4. However, if only the strongtwo H-bond base pairs are desired in the output, the value ofthe cutoff could be raised to as much as 1.8. As an example,
during the determination of the 3D structure of the catalyticcore of the hairpin ribozyme, a weak cutoff of 10±4 was used toexamine the ®rst generation of thousands of structures thatwere obtained from secondary structure and low-resolutionexperimental data. This is a typical ®rst step in RNA 3Dmodeling. In several generated structures, the probabilisticmethod detected a H-bonding pattern that formed a base tripletinvolving two bases in the ribozyme and one base in thesubstrate. The geometry of the base pairs in the ®rst generationof structures was far from satisfying the strong H-bondingparameters. Nevertheless, this observation was reported to theexperimentalists who decided to check for the presence of the
Nucleic Acids Research, 2002, Vol. 30 No. 19 4259
triplet in the hairpin. The predicted triplet was later experi-mentally determined to form in at least one of the catalyticreaction steps (27). In the further modeling iterations, a morestringent cutoff, typically 0.5, was used to identify generated3D structures that contained `nicer' base pairs.
MC-Sym base pairs
The probabilistic method was applied to the annotation of allavailable RNA 3D structures. The identi®ed base pairs werecollected and corresponding transformation matrices inserted
Figure 8. (Previous page and above) Two H-bond base pairing types found in HR-RNA-SET. Base pairing types that occur at least twice are shown. The19 purine´pyrimidines base pairing types are on the opposite page. The 15 purine´purine base pairing types are on this page. The four pyrimidine´pyrimidinebase pairing types are located at the bottom right corner of this page. Base pairing types were classi®ed as either trans (left columns) or cis (right columns).Boxes are used to group isosteric base pairing types together.
4260 Nucleic Acids Research, 2002, Vol. 30 No. 19

in the MC-Sym RNA 3D modeling computer programdatabase. The previous MC-Sym databases were built fromvisual examination of all RNA 3D structures, a long andsubjective process. With the determination of the ribosomestructure, a visual annotation would have been a daunting task.The probabilistic method, on the other hand, is automatic, fastand objective. It completed the base pair recognition processwith a throughput of 7042 bp/s on a PIII-600. Now, every timea new RNA 3D structure is made available to us, the MC-Sym
Figure 9. Distance-based parameters. The distributions are computed for allbase pairs in HR-RNA-SET. The black line shows the distribution ofdistances between the donor and acceptor atoms, dDA. The yellow lineshows the distribution of distances between the hydrogen and acceptoratoms, dHA. The blue line shows the distribution of distances between thehydrogen and LP, dHL.
Figure 10. Distance criteria versus probabilities of forming H-bonds. Eachscatter plot shows the correlation between a distance criterion and theprobabilities of forming H-bonds. Each dot represents the evaluation of apair of donor and acceptor groups. The pairs separated by >5 AÊ were notconsidered.
Table 4. The 38 base pairing types in HR-RNA-SET
Each base pairing type was found at least twice in HR-RNA-SET.The example selected for each type for Figure 8 is identi®ed in thelast column. The four letter code refers to the PDB identi®er. Thenucleotides are labeled according to the PDB chain identi®er andresidue number.
Nucleic Acids Research, 2002, Vol. 30 No. 19 4261
database and parameters are completely updated to address themost recent knowledge brought by the new structure in <4 min.The most recent MC-Sym database contains 10 times morenitrogen base spatial relations than the original version of1991.
Distortion in RNA structure databases
During the computation of the probabilities of all H-bonds inall available RNA structures, the base pairs that were assignedan expected number of H-bonds near 0.5 were visualized andanalyzed. Some of these base pairs pointed us to interestingfeatures of the RNA 3D structures that are currently in publicdatabases. First, several structures that contain stableWatson±Crick G´C base pairs are distorted, which could bethe result of the re®nement process where H-bonds arerepresented by simple harmonic restraints on the distancebetween the donor and acceptor atoms. The mean distance forH-bonds changes from one structure to another, and can evensometimes reach a value of 3.9 AÊ , for the H-bond betweenC:N4 and G:O6 (see for instance 1AOI). We believe this kindof variation can be explained by the use of different force®elds and re®nement parameters and procedures. Given theobserved variations, it becomes evident that methods based onstrict distance and angle values are prone to identi®cationerrors and, hence, the use of a more ¯exible approach, such asthe one presented here, is strongly recommended for anobjective analysis of RNA 3D structures.
Ribosome contribution
When structures of the large and small ribosomal subunitswere introduced into the database, it was believed that theywould substantially contribute to RNA structural knowledge.During the building of the repertoire of two H-bond base pairs,we determined that these two structures alone account for1522 bp among a total of 3852 that were indexed and, thus,represent 40% of the base pairs in HR-RNA-SET. Despite thefact that the term non-canonical suggests rare occurrences, ouranalysis revealed that G´C and A´U Ww/Ww cis (canonicalWatson±Crick base pairs) account for 77% of all examples,where the G´C base pair accounts for 58% alone. This leaves alarge, 23%, fraction of `non-canonical' base pairs. If weremove the G´U Ww/Ww cis base pair (wobble base pair), thenthe non-canonical base pairs still represent over 16% of theindexed base pairs in the repertoire. The results of this analysiscover 629 bp, excluding those that require a water-mediatedH-bond or a protonated nitrogen base. The repertoire inFigure 8 contains 38 base pairing types that contain at leasttwo H-bonds. Seven base pairing types are formed by onetypical H-bond and a weaker C-H¼.{O,N}.
Nomenclature
Leontis and Westhof (3) have emphasized that their proposednomenclature has the interesting property of naming allisosteric base pairing types with the same name. This feature isof utmost importance since it allows one to easily describeRNA motifs without having to specify different base pairingtypes that correspond to sequence variations. This importantfeature is also a characteristic of LW+, and goes beyond bydiscriminating base pairing types that differ only by a slidingalong the pairing faces.
An important exception to this is the G´U W/W trans, whichoccur in two different forms that involve two H-bonds of theW faces. The ®rst form involves two H-bonds on the h side ofthe W face, and the second form involves two H-bonds on the sside of the W face. Because the contact points represent anaverage when two H-bonds are present, it is impossible withthis approach to modify the face de®nitions so that these twobase pairing types can be differentiated, and without introdu-cing undesired new names for each variation of the classicA´U Hh/Ww trans and A´U Ww/Ww cis. This is the onlyambiguity left in the proposed LW+ nomenclature. Thesituation could be resolved by introducing an exception, bynaming both base pairing types G´U Wh/Wh trans and Ws/Wstrans. We decided to postpone the implementation of such anexception until proper feedback is obtained from the RNAcommunity.
In LW, the presence of bifurcated H-bonds has to be noti®edexplicitly in the name. This is due to the fact that such basepairs often involve hydrogens or LP from two different faceson one of the bases. The introduction of the contact pointsalleviates this ambiguity, and the addition of the Bh and Bsfaces results in precise names.
The current probabilistic system does not identify water-mediated H-bonds because most of the currently publishedRNA structures do not contain water molecules, and whenthey do most of them do not specify the actual positions of thewater hydrogen atoms. Identi®cation of water-mediatedH-bond in an automated manner requires the correct place-ment of water molecules around the nitrogen bases, which isknown to be a dif®cult problem.
Another limitation of the probabilistic system is thatH-bonds involving the O2¢ group in the ribose moiety arenot considered. Again, this is due to the fact that an automatedmethod requires the exact position of the hydrogen atom. TheH is free to rotate around the O2¢ group and, thus, the task ofcomputing its optimal position is not trivial, althoughcurrently under investigation.
The probabilistic method introduced here describes the ®rstavailable algorithm and computer implementation of anautomated base pairing type recognition procedure, whichalso objectively classi®es and presents the base pairs of anRNA 3D structure. The probabilistic method successfullyrecognized all base pairing types that are present in availableRNA 3D structures, and allowed us to automate theirclassi®cation. In particular, a complete and well-organizedrepertoire of observed RNA base pairing types has been madeavailable on the Internet.
The systematic annotation of all RNA 3D structures, asdetermined by high-resolution crystallography, provided uswith a convincing con®rmation that a slightly revised versionof the nomenclature proposed by Leontis and Westhof (3) isperfectly suitable to a high-throughput RNA structure analysiscontext.
ACKNOWLEGEMENTS
We thank Patrick Gendron, Sergei Chteinberg and FabriceLeclerc for providing RNA structure expertise, and YoshuaBengio for suggesting the use of a mixture of Gaussians. Thiswork was supported by a grant to F.M. from the Canadian
4262 Nucleic Acids Research, 2002, Vol. 30 No. 19

Institutes of Health Research (CIHR) (MT-14604). S.L. holdsa PhD scholarship from CIHR.
REFERENCES
1. Ban,N., Nissen,P., Hansen,J., Moore,P.B. and Steitz.T.A. (2000) Thecomplete atomic structure of the large ribosomal subunit at 2.4 AÊ
resolution. Science, 289, 905±920.2. Wimberly,B.T., Brodersen,D.E., Clemons,W.M.,Jr, Morgan-Warren,R.J.,
Carter,A.P., Vonrhein,C., Hartsch,T. and Ramakrishnan,V. (2000)Structure of the 30S ribosomal subunit. Nature, 407, 327±339.
3. Leontis,N.B. and Westhof,E. (2001) Geometric nomenclature andclassi®cation of RNA base pairs. RNA, 7, 499±512.
4. Nagaswamy,U., Voss,N., Zhang,Z. and Fox,G.E. (2000) Database ofnon-canonical base pairs found in known RNA structures. Nucleic AcidsRes., 28, 375±376.
5. Lemieux,S., Oldziej,S. and Major,F. (1998) Nucleic acids: qualitativemodeling. In Allinger,N.L., Clark,T., Gasteiger,J., Kollman,P.A.,Schaefer,H.F. and Schreiner,P.R. (eds), Encyclopedia of ComputationalChemistry. John Wiley & Sons, West Sussex, UK.
6. Major,F., Turcotte,M., Gautheret,D., Lapalme,G., Fillion,E. andCedergren,R. (1991) The combination of symbolic and numericalcomputation for three-dimensional modeling of RNA. Science, 253,1255±1260.
7. Lindauer,K., Bendic,C. and Suhnel,J. (1996) HBexploreÐa new tool foridentifying and analysing hydrogen bonding patterns in biologicalmacromolecules. Comput. Appl. Biosci., 12, 281±289.
8. Massire,C. and Westhof,E. (1998) MANIP: an interactive tool formodelling RNA. J. Mol. Graph. Model., 16, 197±205.
9. Dempster,A.P., Laird,N.M. and Rubin,D.B. (1977) Maximum likelihoodfrom incomplete data via the EM algorithm. J. R. Stat. Soc. B, 39, 1±38.
10. Leontis,N.B. and Westhof,E. (1998) Conserved geometrical base-pairingpatterns in RNA. Q. Rev. Biophys., 31, 399±455.
11. Berman,H.M., Westbrook,J., Feng,Z., Gilliland,G., Bhat,T.N.,Weissig,H., Shindyalov,I.N. and Bourne.P.E. (2000) The Protein DataBank. Nucleic Acids Res., 28, 235±242.
12. Cornell,W.D., Cieplak,P., Bayley,C.I., Gould,I.R., Merz,K.M.,Jr,Ferguson,D.M., Spellmeyer,D.C., Fox,T., Caldwell,J.W. and
Kollman,P.A. (1995) A second generation force ®eld for the simulationof proteins and nucleic acids. J. Am. Chem. Soc., 117, 5179±5197.
13. Correll,C.C., Freeborn,B., Moore,P.B. and Steitz,T.A. (1997) Metals,motifs, and recognition in the crystal structure of a 5S rRNA domain.Cell, 91, 705±712.
14. Weeks,A.R.,Jr (1998) Fundamentals of Electronic Image Processing.Spie/IEEE.
15. Bishop,C.M. (1995) Neural Networks for Pattern Recognition. OxfordUniversity Press, NY.
16. Ahuja,R.K., Magnanti,T.L. and Orlin,J.B. (1993) Network Flows:Theory, Algorithms, and Applications. Prentice Hall, NJ.
17. Goldberg,A.V. and Tarjan,R.E. (1988) A new approach to the maximum¯ow problem. J. Assoc. Comput. Mach., 35, 921±940.
18. Ahuja,R.K., Kodialam,M., Mishra,A.K. and Orlin,J.B. (1997)Computational investigations of maximum ¯ow algorithms. Eur. J. Oper.Res., 97, 509±542.
19. Saenger,W. (1984) Principles of Nucleic Acid Structure.Springer-Verlag, NY.
20. Tinoco,I.,Jr (1993) Structure of base pairs involving at least twohydrogen bonds. In Gestland,R.F., Atkins,J.F. and Cech,T.R. (eds),The RNA World. Cold Spring Harbor Press, pp. 603±607.
21. Burkard,M.E., Turner,D.H. and Tinoco,I.,Jr (1999) The interactions thatshape RNA. In Gestland,R.F., Atkins,J.F. and Cech,T.R. (eds), The RNAWorld. Cold Spring Harbor Press, pp. 233±264.
22. Gendron,P., Lemieux,S. and Major,F. (2001) Quantitative analysis ofnucleic acid three-dimensional structures. J. Mol. Biol., 308, 919±936.
23. Kabsch,W. (1976) A solution for the best rotation to relate two sets ofvectors. Acta Crystallogr. A, 32, 922±923.
24. Kabsch,W. (1978) A discussion of the solution for the best rotation torelate two sets of vectors. Acta Crystallogr. A, 34, 827±828.
25. Juneau,K., Podell,E.R., Harrington,D.J. and Cech,T.R. (2001) Structuralbasis of the enhanced stability of a mutant ribozyme domain and adetailed view of RNA±solvent interactions. Structure, 9, 221±231.
26. Klein,D.J., Schmeing,T.M., Moore,P.B. and Steitz,T.A. (2001) The kink-turn: a new RNA secondary structure motif. EMBO J., 20, 4214±4221.
27. Pinard,R., Lambert,D., Walter,N.G., Heckman,J.E., Major,F. andBurke,J.M. (1999) Structural basis for the guanosine requirement of thehairpin ribozyme. Biochemistry, 38, 16035±16039.
Nucleic Acids Research, 2002, Vol. 30 No. 19 4263