river kelvin case study steady flow analysis theory
TRANSCRIPT

River Kelvin Case Study
Steady Flow Analysis
Theory

1D Steady Flow Modelling
Q
h
x
Geometrical data
River cross-sections + distance between them.
Hydraulic structures

1D Steady Flow Modelling
Equation
Solution
Standard step method.Q
Z + y x
Eg
vyz
g
vyz
22
22
222
21
111
2 and 1sectionsbetween lossenergy
tcoefficienenergy the
/ity mean veloc
levelwater 11
E
AQvv
yz
12
1D Steady Flow Modelling
h
T
Q
Q
T
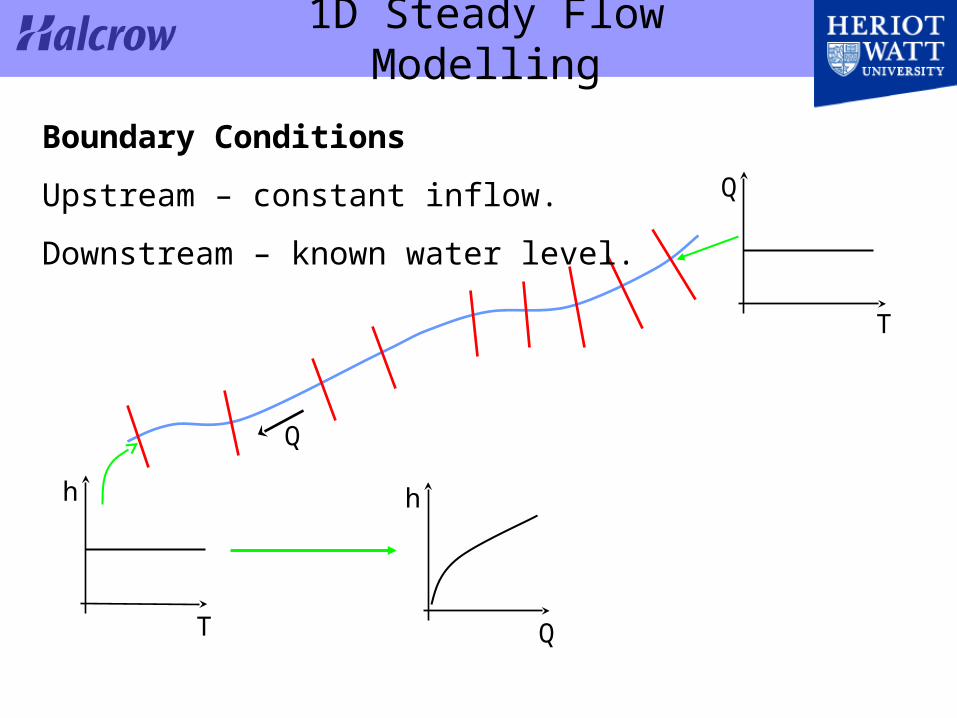
Boundary Conditions
Upstream – constant inflow.
Downstream – known water level.
h
Q

1D Steady Flow Modelling
Q
h
x
Prediction
Water level at each cross-section.
Advantages
Easy to predict maximum water level.

River Kelvin Case Study
Steady Flow Analysis
Case Study

River Kelvin Case Study
The December 1994 Flood
Flood outline 9 to 11th December 1994
Rainfall event with a return period between 1 in 300 and 1 in 1000 years.
Flood return periods
• Lower River Kelvin 1 in 200 years.
•Main tributaries - Luggie Water and Glazert Water 1 in 50 years.

River Kelvin Case Study
Consequences
Catastrophic flood which caused:
• Damage estimated at £10 million.
• Extensive damage to over 300 business and residential properties.
•The loss of two lives.
Flooding of McNair’s Factory
Overtopping of flood defences at Balmore
Inundation in Kirkintilloch

River Kelvin Case Study
Solution
Solution adopted was a system of direct defences using earth embankments and retaining walls, the location of which was chosen to preserve as much of the existing flood plain as practical.
Options considered:
•Flood storage – discounted due to timing of flood peaks.
•Channel dredging – discounted due to environmental damage and increased flood peaks downstream in Glasgow.

River Kelvin Case Study
Examples of the direct defences used of the River Kelvin flood defence scheme.
Solution

River Kelvin Case Study
Steady Flow Analysis
The Task

River Kelvin Case Study
Model Calibration
The HEC-RAS model provided has been set up with:
•Gauged inflows for the River Kelvin and its tributaries for the December 1994 flood, Table 1.
•A rating curve downstream boundary based on uniform flow.
•Manning’s ‘n’ values of 0.02 and 0.01 on the flood plain and main channel respectively.
Calibrate the model by altering the Manning’s ‘n’ values to obtain a reasonable agreement ± between the observed results provided in Table 2 and the computed values.

River Kelvin Case Study
Flood modelling
•Use the calibrated model to estimate flood levels for the 50, 100 and 200 year flood events, inflow data is provided in Table 3.
•Determine the maximum defence levels for a flood prevention scheme for Kirkintilloch.

River Kelvin Case Study
Reporting
The case study report should include:
•A map showing the location liable to flooding for a return period of 1 in 200 years.
•Details of required flood defence levels in the location of Kirkintilloch.