risky business? a firm-level analysis of chinese outward
TRANSCRIPT

Risky Business?
A Firm-Level Analysis of Chinese Outward Direct Investments
Weiyi Shi
Department of Political Science University of California, San Diego
Abstract
Once a recipient of global FDI, China is now the world’s third largest investor. A nascent literature finds that Chinese investments tend to be associated with higher host country political risks than investments from other countries, but few have been able to identify the causes. I argue that China’s political elites’ priority to ensure the provision of key public goods leads to soft budget constraints for SOEs, which in turn encourage SOEs to pursue riskier investments. Employing two original datasets at the project and firm levels (one compiled from China Ministry of Commerce’s public registry of overseas investors and the other an original survey of over 1,000 Chinese companies), this study is one of the first to systematically disentangle the investment behaviors of Chinese state-owned enterprises and private companies. I find that Chinese SOEs’ investment projects are associated with higher host country risks after controlling for investment sectors, bilateral agreements, and explicit subsidies. These results are supportive of my theoretical expectation and suggest that the soft budget constraints facing SOEs is an important factor driving the overall higher risk profile of Chinese outbound investments.
WORK IN PROGRESS, PLEASE DO NOT CITE
This Version: November 3, 2013

2
1. The Puzzle
A large body of scholarship in political economy finds that better governed countries attract
more foreign direct investments (Globerman and Shapiro, 2003; Gani, 2007; Staats & Biglaiser,
2012). Multinational corporations value political stability, predictable policies, rule of law, and
property rights in addition to economic fundamentals when they make overseas investments.
Chinese investors’ seemingly elevated appetite for risks thus presents an intriguing
puzzle. Primarily a recipient of FDI until recent years, China is now the world’s third largest
investor in terms of investment flow behind only the United States and Japan.1 One notable
feature of Chinese outbound investments is that they seem to be disproportionately directed
toward what we normally consider to be unstable and dangerous destinations. From Libya to
Sudan to Myanmar, many of China’s high profile investment projects are located in some of the
world’s most fragile and turbulent regions. Media reports aside, scholars also have found
systematic evidence that, compared to western multinationals, Chinese companies tend to make
riskier investments on average (Buckley et al., 2007; Beazer and Blake, 2011; Kolstad and Wiig,
2012). Why would Chinese investors appear to have a higher tolerance for danger and
disturbances?
The academic literature is scant on what might explain this puzzling phenomenon.
Possible explanations range from Chinese companies’ sectoral focus to their shorter institutional
distances to poorly governed and corrupt states. Analysts have also pointed to the prominent role
of Chinese state-owned enterprises (SOEs) in China’s overseas investments. However, few have
studied systematically the link between state ownership and propensity for risks. Nor do we
understand what it is about state ownership that may lead to different international investment
1 Chinas was the 6th largest investor in 2011. China Radio International, “China Vaults to World's 3rd-largest Investor,” September 10, 2013. http://english.cri.cn/6826/2013/09/10/2743s787056.htm
3
outcomes. This paper aims to fill that gap. I theorize how China’s political elites’ priority to
ensure provision of key public goods leads to soft budget constraints for SOEs, which in turn
encourage SOEs to pursue riskier investments. Using new, original data sources at the project
level, I then test for the effect of state ownership on chosen project risk levels. I find that
Chinese SOEs’ investment projects are associated with higher host country risks after controlling
for investment sectors, bilateral agreements, and explicit subsidies. These results are supportive
of my theoretical expectation.
This paper is to my knowledge the first to systematically disentangle the investment
behaviors of Chinese SOEs from those of private companies. The differences between SOE and
private investments can lend us substantial leverage in isolating some of the key factors
contributing to Chinese investments’ higher risk profiles. Chinese ODI has become a hot button
issue and attracted a lot of attention in policy circles and the media, but the topic has received
relatively little rigorous treatment and academic scrutiny. This study hopes to be one of the
many future studies that will help separate the myths from the reality of Chinese outbound
investments. This paper also enriches the broader literature on host country risks and FDI.
Scholarship in international political economy is largely silent on what leads to varying
propensities for risks among international investors. My theory and empirical findings suggest
one of the possible reasons.
The rest of the paper is organized as follows: Section 2 reviews the various factors
identified in the existing literature that mediate the link between investment decisions and host
country risks. Section 3 presents a brief background on Chinese SOEs and China’s Go Out
strategy. Section 4 introduces my theory on the risk implications of a soft budget constraint and
derives testable hypotheses. This general model is presented in the Chinese context, but is

4
applicable to a broad range of governance systems. Section 5 introduces two innovative project
and firm level data sources. Sections 6 and 7 present empirical analyses and results. Section 8
concludes.
2. Political Risks and FDI: The Mediating Factors
Scholars have long observed the link between governance and FDI inflows. A large empirical
literature across a variety of data sources and host countries finds that good governance,
particularly mature democratic institutions, correlate with more foreign investments (Globerman
2002, Harms and Urspring 2002, Jensen 2003, Busse, 2007; Daude, 2007; Gani, 2007; Biglaiser
& Staats, 2010, 2012). Borrowing from North and Weingast (1989)’s seminal work on the
state’s ability to make credible commitments, scholars find that democratic systems, with more
checks and balances and greater constraints on leaders, are often more attractive since they are
better able to provide policy stability (Jensen 2003). In addition to institutional checks, Wei
(1997, 2000) observes foreign investments are also sensitive to corruption levels. Corruption, in
particular uncertainty regarding corruption, has a significant negative impact on investment
inflows.
While the literature has identified a strong positive link between host country governance
and FDI inflow, it says little about the variation among investors. Why do some investors appear
to have a higher tolerance for political risks than others? Specifically, why do we observe that
emergent investors, and Chinese investors in particular, tend to choose riskier investment
destinations than their more established counterparts from the West? Although the literature has
not addressed this question directly, several areas of research are relevant:

5
The first intervening factor to consider is the sector of investment. Afflicted with the
resource curse, countries with rich natural resource endowments are disproportionately victims
of conflicts and corrupt governments (Collier and Hoeffler, 2004; Collier et al., 2004; Ross, 2004;
Van der Ploeg, 2011). Adding the fact that resource investments, due to immobility, are
especially susceptible to expropriation and nationalization (Frieden, 1994), it follows that
investments in natural resource are inherently riskier. To the extent certain multinationals are
engaged in the resource sector more than others, they naturally adopt an investment profile
higher in political risks. Chinese investments have been widely regarded as resource seeking
(Child and Rodrigez 2005), so their higher risk profile may simply be the byproduct of their
sectoral focus.
Second, investors from the South are relative latecomers to the global economic
landscape, and this position comes with its particular opportunities as well as challenges.
Although some studies note the benefit of the position as it allows firms to catch up quickly
through the acquisition of existing assets, resources, and technology (Child and Rodrigez 2005;
Amighini et al 2010), others have noted that earlier investors may possess a first-mover
advantage and limit market space and resources for latecomers (Schmalensee 1981, Spence 1981,
Kang 2009). This first-mover advantage is particularly pronounced in the natural resource sector
(Bunker & Ciccantell, 2005). When the safe assets are already taken, late investors will have to
resort to riskier frontiers.
Third, institutional distance between the country of origin and host countries impacts
investment decisions. Recent research has shown that investors prefer to operate in a similar
institutional environment to their home markets (Bénassy-Quéré et al. 2007; Habib and
Zurawicki, 2002). The persistence of the “liability of foreignness” in the business literature

6
further confirms the impact of institutional distance on investment outcomes (Eden and Miller,
2004). Although most of these studies derive from the experiences of investors from developed
countries, their results imply that investors from the South may have a comparative advantage to
operate in other developing countries because of a shorter institutional distance (Cuervo-Cazurra
and Genc, 2008; Darby et al., 2009). It may be because of this advantage that emergent investors
are disproportionately attracted to poorly governed institutions relative to their more established
counterparts.
The fourth consideration pertains to the way bilateral relations influence capital flows.
Although most of this literature focuses on trade, the evidence overwhelmingly shows that
political affinity, whether manifested in formal alliances or common political systems, have a
significant impact on increasing bilateral trade (Gowa and Mansfield, 2004, Morrow et. al., 1998,
Dixon and Moon, 1993). Li and Liang (2012) find that political relations play an important role
in determining where Chinese companies invest. By this logic if China has stronger bilateral ties
with autocracies or weakly governed states, Chinese investments will flow more readily to these
countries, yielding a higher observed risk profile overall. Regardless of actual political ties,
perception of the political climate perhaps matters even more. Given CNOOC’s failed bid for
Unocal and Huawei’s thwarted attempts to access North American markets, it is conceivable that
Chinese companies have developed some tentative aversion to western hosts.
Lastly, analysts have pointed to the role of state-owned enterprises and rise of state
capitalism in shaping the global investment landscape. Unlike private companies, SOEs are
instruments of the government, bearing policy burdens and political incentives (Lin and Tan
1998, 1999). They also face a soft budget constraint, which has perverse impacts on firms’
conduct and efficiency (Kornai 1980, 1986). Despite these features, we understand little about

7
how SOEs behave as global investors. Our expectation that political risks deter firm entry is
based almost exclusively on studying private investors from developed countries. An UNCTAD
2007 report notes that SOEs from developing countries appear to be less deterred by poor
institutions in host countries than large private multinationals from developed countries. Indeed,
we anecdotally observe that many of China’s mega-projects in fragile parts of the world are
spearheaded by SOEs, but whether SOEs have a higher propensity for risky destinations has not
been examined systematically. Nor have we established what aspects of SOEs may be
contributing to their seemingly higher risk profile.
This paper aims to fill these gaps. I compare the choices of investment destinations by
Chinese SOEs and private companies. Taking a subnational approach, I am able to hold constant
several variables that mediate firms’ choices of investment destinations, including China’s
bilateral relations with host governments and institutional distance, and focus instead on isolating
the effects of firm-level characteristics. In addition to empirically verifying the perception that
Chinese SOEs invest in riskier places, I explore the reasons why we observe this outcome. In
particular, I explore the extent to which SOEs’ sectoral focus, policy liability, and particularly
their soft budget constraints influence their chosen level of risk in investment projects.
3. SOEs and China’s Go Out Strategy
After thirty-five years of reform and opening the state sector still plays a prominent role in the
Chinese economy. As a percentage of the total economy the state sector has declined markedly,
but the remaining SOEs control a considerable concentration of resources and assets thanks to
the continuous restructuring and recentralization efforts beginning the late 1990s. According to

8
the National Economic Census of 2008, SOEs control some 30% of the assets in industrial and
service sectors and they have an average size of 13.4 times that of non-SOEs (Xu, 2010).
A number of studies have pointed out that SOEs possess a special status in transitional
economies because, as a remnant of the Stalinist planned economy, they bear policy burdens and
provide public goods including employment and a stable supply of raw inputs (Lin and Tan 1999,
Lin and Li 2006, Dong and Putterman 2003). Indeed, China’s SOEs dominate the “strategic
arteries” of the economy including natural resources and utilities, telecommunication,
infrastructure and transport, as well as the financial sector: areas the Chinese government regards
as fundamental for supporting the growth of the rest of economy. As such, SOEs are powerful
agents of China’s political elites in ensuring steady and rapid growth, which the Communist
party considers to be imperative to social stability and regime survival. State-owned enterprises
are widely regarded as “the foundation of governance” (zhi zheng ji chu) for the Chinese
Communist Party in the Chinese political lexicon. Increasingly, being the head of a major
Chinese SOE is associated with obtaining a seat or alternate membership on the Party’s Central
Committee.
Political elites and SOEs hold each other as mutual hostages. On the one hand, the elites
are dependent on SOEs to ensure the provision of key public goods, i.e. stable raw inputs and
infrastructure for growth and employment. To meet their policy priorities SOEs are given the
latitude of a soft budget constraint (Lin and Tan 1999). SOEs have been found to have greater
access to credit and face fewer capital constraints (Hericourt & Poncet 2008, Cull and Xu 2003,
Lin 2011). Political elites also depend on SOEs to seek rents. Policy perks enjoyed by SOEs
allow them to earn extra-normal profits – rents – which they in turn share with political elites.
On the other hand, the SOEs are dependent on the elites for obtaining these rents and are thus

9
incentivized to fulfill policy burdens and demonstrate compliance. The political elites, namely
the CCP’s organizational department, also control the appointments of the executives of China’s
major SOEs. The executives are ultimately accountable to the party elites, not the shareholders,
or the public.
Although the role of SOEs in China’s domestic economy has been studied, there has been
little systematic research on their role in China’s outbound investments: The Chinese
government promotes outbound investments through a set of coordinated policies known as the
“Go Out” strategy. The strategy not only comes with subsidies and low-interest loans that soften
a firm’s budget constraint – these perks have gone predominantly to SOEs (CCPIT 2013) – but
it is also manifested in China’s many bilateral agreements with less-developed host countries to
access resources and infrastructure. The Go Out strategy has a strong sectoral focus. An original
rationale for developing the strategy was precisely to ensure energy security for China. In
addition, Chinese overseas investments are highly intertwined with development assistance,
which concentrates most heavily on infrastructure.
The Go Out strategy gives Chinese SOEs both a policy liability and also a still softer
budget constraint when investing overseas. In a related paper, Shi (2013) shows that SOEs do
respond to these interventions and incentives: Controlling for productivity, SOEs in the resource
sector are more likely to invest overseas than private Chinese companies. In the manufacturing
sector where the government’s priority is to keep jobs at home and generate local revenues and
rents, SOEs are less likely to invest overseas.
4. Risk Implications of a Soft Budget Constraint: Toward a General Model

10
The previous section outlined the political logic of a soft budget constraint. Here I formalize its
implications for firms’ preferences toward investment risk. I present a general model linking
soft budget constraints (bailouts) to risk preferences, useful not only for understanding the
Chinese phenomenon at hand, but also applicable in other economies.
As Kornai (1980) notes, SOEs exhibit an insatiable appetite for inputs because their
managers stand to benefit from profitable expansion of output, but have little to lose if the
enterprise incurs losses. Essentially, a soft budget constraint eliminates part or all of the
downside risk for SOEs. This incentivizes them to pursue riskier investments, a key component
in the stylized model I lay out below.
For simplicity, assume that there are four salient actors in a given economy: a unitary
political elite, two companies that possess equal amounts of capital, one state-owned and the
other private, and a representative member of the public.
The political elite relies on the state-owned company for i) state revenue where the
enterprise’s profit is shared with the state at rate m and ii) the provision of key public goods P
(e.g. strategic raw input, employment) produced at rate x per unit of profit. Since m and x are
expressed per unit of profit, 𝜋, this leaves the residual 1−𝑚 − 𝑥 𝜋 for the SOE itself. Assume
also that the public’s support function V is increasing in the provision of the key public goods.
For easier derivation we assign V=P. Following Grossman and Helpman (1994), I write the
political elite’s optimization problem with respect to a unit increase in the SOE’s profit in an
additive utility setting:
𝑑𝑈 𝑎,𝑚, 𝑥𝑑𝜋 = 𝑎 ∗𝑚 + 1− 𝑎 ∗ 𝑥
where a portrays the politician’s relative preferences for rents vs. public support (0 < a < 1). I
assume for simplicity that the private company in this highly stylized economy does not

11
contribute to state revenue or public goods provision and that the welfare of the public is
captured entirely by the amount of key public goods provided.
Next I assume, again for simplicity, that there are only two investment options available,
A and B. Option A generates 1% return with certainty; Option B generates a 100% return 10%
of the time and a negative 10% return 90% of the time. Note that the expected returns from the
two investments are the same, 1%, but Option B is riskier. How would the actors in our model
choose between these two assets?
Simple algebra gives us the expected payoff for each actor, summarized in the table
below. Note that for Option B I present two scenarios, one in which the political elite chooses
to bail out the state-owned company, and the other in which there is no bailout. For the bailout
scenario I demonstrate the limiting case when the political elite does not pass any of the costs on
to the private enterprise or the public. I choose this case since it is the most conservative: In
reality the political elite will be able to pass some of the bailout costs on to others, further raising
the likelihood of a bailout.
Following these payoffs even when the political elite has to absorb the entire cost of a
bailout, it will still choose to bail out the SOE as long as 𝑥 > !(!!!)(!!!)
, or equivalently when
𝑥 > ( !!!!
− 1)(1−𝑚). Note that this condition is easier to satisfy the larger is x, the smaller is
a, and the smaller is m. Intuitively this means political elites will tend to bail out the SOE if
they care a great deal about public support, there is minimal rent sharing between the elite and
Option A Option B Option Bwith bailout without bailout
Political elite 1% am +1%(1-a)x a(10%m-9%)+10%(1-a)x 1% am +1% (1-a)x
SOE 1% (1-m-x) 10%(1-m-x) 1% (1-m-x)Private firm 1% 1% 1%

12
SOE, or the SOE provides more public goods. As the assumption of cost absorption is relaxed,
the model will predict that bailouts occur over a much wider range of values for a, m, and x.
SOEs will be bailed out even when they are relatively inefficient at providing public goods.
Equilibrium conditions in the joint problem faced by the SOE and political elite will support
greater rent seeking (a) and rent sharing (m). From the political elite’s perspective, SOEs are
being bailed out for two competing aims: providing rents to the state and providing key public
goods (which in turn translates into public support for the political regime.)
It is also apparent from the table of payoffs that the SOE will tend to choose Option B,
the riskier option, over Option A, whereas a private firm would be indifferent between the two
investment options. The political elite will choose to bail out the SOE if 1) it cares about public
welfare and the SOE can provide sufficient key public goods; or 2) it cares about rents and is
able to pass on the costs to the rest of the economy. In either case, the presence of the soft
budget constraint has permitted and encouraged the SOE to pursue riskier investments.
This paper tests two main hypotheses:
First, I expect that Chinese SOEs should go to riskier destinations than private Chinese
companies.
Second, I expect that SOEs’ soft budget constraints contribute to their higher risk profiles.
The first hypothesis demonstrates an empirical regularity. The second hypothesis is more
difficult to test in that I will need to separate the effect of the soft budget constraint from a
number of other mediating factors I addressed in Section 2. It will be an added bonus if we can
also tease apart the effect of the soft budget constraint as an enabler of policy priorities versus an
incentive to seek rents. These alternative hypotheses (AH) include:
13
AH 1 Chinese SOEs make politically riskier investments because they are more
concentrated in the natural resource sector.
Since we expect natural resource investments to be associated with higher political risks, Chinese
SOEs will appear to make politically riskier investments if they are more concentrated in natural
resource investments. In addition, to a certain extent AH1 captures SOEs’ policy liability, given
the Chinese government’s strategic priority to secure natural resources overseas to ensure the
stability of supply at home. If we find that SOEs are going to riskier destinations even after
controlling for AH1, we are more confident that SOEs are attracted to riskier investments
because of rent seeking.
AH 2 Chinese SOEs make politically riskier investments because they are influenced to a
greater extent by bilateral agreements.
Taking bilateral relations between any host country and China as given, SOEs may be influenced
differently by these relations than private companies. AH2 to a certain extent also captures
SOEs’ policy burdens. If we are able to tease out the confounding effect of AH2, we are another
step closer to differentiating between the two aspects of the soft budget constraint (policy
enabling vs. rent seeking).
AH 3 Chinese SOEs make politically riskier investments because they face hostility or
discrimination from developed economies.
There are two aspects to this hypothesis. The first is the actual rejection faced by Chinese
companies. However, while there are a few high profile cases where Chinese companies were
refused entry into North American and European markets (e.g. CNOOC and Huawei), the actual
incidence is extremely low relative to the large volume of Chinese investments now flowing into
these markets. From 2009 to 2011, a total of 269 cases out of 3,800 mergers and acquisition

14
cases by foreign investors were reviewed by the Committee on Foreign Investment in the United
States (CIFIUS). Only 20 cases were Chinese. And 90% of the 269 cases went forward without
any changes or conditions to the original proposals.2 These numbers suggest that, in spite of the
media hype, the actual rejections faced by Chinese companies are quite limited. The second
aspect of this hypothesis has to do with perception. Even if there is negligible actual resistance
from western economies, it is possible that perception alone makes Chinese companies,
especially SOEs, avoid investments in developed countries. I address the issue of risk
perception in Section 7 of this paper.
I use two new sources of data to test my hypotheses. The empirical evidence presented
below is strongly suggestive of the risk implications of Chinese SOEs’ soft budget constraint.
5. Data and Summary Statistics
Empirical study of Chinese OFDI has long been hampered by a lack of data. This study employs
two previously unexplored sources of data. One is compiled from the registry of China Ministry
of Commerce which catalogues all officially approved and archived outward investment projects.
This set of data includes over 20,000 projects by more than 15,000 Chinese companies. The
other is the 2013 China Outward Direct Investment Survey with a sample of over 1000 Chinese
companies, which I designed and implemented in cooperation with China Council for the
Promotion of International Trade (CCPIT) and Tsinghua University.
The MOFCOM Registry
2 Keynote speech by Gary Locke, September 24, 2013, at the international conference on “Chinese Outbound Direct Investment: Risks and Remedies,” at Tsinghua University, Beijing, China.

15
The MOFCOM registry, in spite of its limitations, is perhaps the most comprehensive firm-level
data we currently have on Chinese outbound investments. The registry provides good coverage
due to China’s internal rules regulating outward investors. China’s capital markets are tightly
controlled so, in order to access foreign exchange through official channels, companies
regardless of ownership must file an application with MOFCOM. After 2005, investments under
a certain amount no longer need to apply for approval, but they are still required to archive their
projects with MOFCOM’s registry before they can obtain a certificate allowing access to foreign
exchange. The MOFCOM registry is a publicly searchable database. Though not downloadable,
the relatively simple structure of the database makes it possible to extract with a web crawler.
Data included in this paper cover projects that were filed through October 2012, when the
crawler was last applied.
Firm-level international investment data are scant to begin with, and they are even scarcer
when it comes to investments originating from China. Generally investments into developed
economies in North America and Europe are better tracked, but data are quite limited if we want
to map out Chinese investments throughout the world. Analysts mainly rely on sources such as
the Heritage Foundation’s China Global Investment Tracker (CGIT), commercial databases such
as fDimarkets.com, or MOFCOM’s annual reports on Chinese OFDI. The drawback of CGIT is
that it only tracks investments over $100m, which biases the sample heavily toward large-scale
projects in energy, mining, and infrastructure. fDimarkets.com reportedly covers over 80% of
cross-border transactions in the world, but it relies heavily on media reports and also runs the
risk of biasing toward large, high-profile projects. MOFCOMs’ reports are more comprehensive,
capturing all officially registered OFDI projects originating from companies registered in China,
but data are only available at the country level.

16
The MOFCOM registry offers an alternative because its coverage is as comprehensive as
MOFCOM’s reports, but records are available at the project level. Each record contains the
approval date, destination country, and a description for the project but no amount of investment;
this does not severely constrain this study because I am primarily interested in choice of risk
rather than size. The registry also provides information on the provincial original of the company
and whether the company is centrally owned (i.e. under the direct administration of SASAC). I
code the project description into industries using a combination of manual and automatic content
analysis techniques.3
The broad trends and patterns in the MOFCOM registry are presented in Figure 1.
Chinese OFDI, as measured by the number of projects, took off around 2005 and had another
upward inflection at the Global financial crisis, especially in trade and services. This observation
is consistent with accounts by most analysts and media outlets. It is noteworthy that, although
China’s large-scale investments have attracted the most attention, Chinese investments in
manufacturing and services are far greater in terms of the number of projects. Table 1 breaks
down these projects by industry and by firm ownership status. It is apparent that China’s central
SOEs have a rather different sectoral focus than other Chinese companies. Their number of
projects is relatively few, but according to various sources, SOEs account for anywhere between
50% to 70% of Chinese OFDI, confirming the common perception that Chinese SOEs are more
focused on large projects in energy, mining, and infrastructure.
2013 Chinese Outbound Direct Investment Survey
Although the MOFCOM registry is one of the most comprehensive project-level data we can get
on Chinese OFDI, it provides relatively little in terms of firm-level covariates. Using the 3 Additional details about the dataset are available at http://pages.ucsd.edu/~w3shi

17
MOFCOM registry data alone, I may be able to establish that Chinese SOEs have a different risk
profile after controlling for their sectoral focus, but we still won’t be able to determine whether
this difference stems from their different perception of risks, their sensitivity to bilateral relations,
or other factors. I am able to gather these additional covariates through the 2013 CODIS survey.
The 2013 CODIS survey was implemented in cooperation with China Council on the
Promotion of International Trade (CCPIT) and Tsinghua University in Beijing. Relying on an
extensive local network, CCPIT is uniquely positioned to reach a large number of Chinese
companies. Adopting the method of stratified random sampling, I construct twenty-four strata
based on the company’s size (three brackets are set according to total revenue, with the 40th and
80th percentile as cut-off points), industry (whether a company is engaged in an extractive
industry or not), ownership (state-owned vs. other ownership arrangement), and whether the
company has already invested abroad (determined by whether the company has an existing
investment certificate on file with MOFCOM). I then assign sampling fractions to each stratum
to best approximate equal samples for each comparison of potential interest (e.g. equal samples
of state-owned vs. non-state-owned firms, equal samples of firms in extractive industries vs. non-
extractive). In effect, this approach allows for oversampling of firms that are state-owned, larger,
in extractive industries, and already invested overseas. The same sampling fractions for each
stratum are applied to each province. This means that our samples draw proportionally from
every province: the more companies a province has, the larger the sample we draw.
The 2013 survey had a sampling list of 3000 respondents. 1091 companies returned
surveys. After removing incomplete and duplicate entries, the final sample for analysis includes
1056 companies. Of these, 142 are state-owned enterprises. 333 companies, roughly one third,

18
have already invested abroad. In spite of our best efforts, SOEs and companies in extractive
industries had significantly lower response rates.
6. Empirical Analyses and Results
The dependent variable in my analyses is firms’ chosen political risk levels for their investment
projects. I use standardized International Country Risk Guide (ICRG) ratings to measure firms’
chosen levels of political risk, averaged across all twelve subcomponents. A lower value
indicates worse (higher) risks.
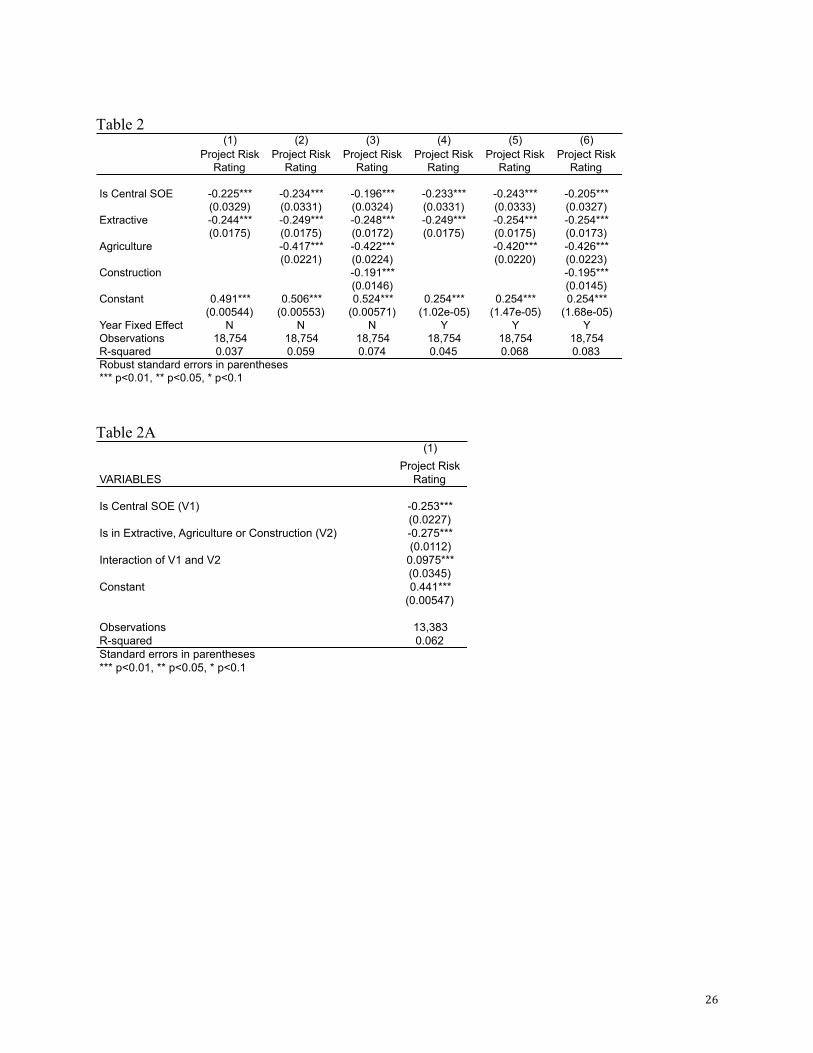
The first set of models use the MOFCOM registry data at the project level. I run linear
regressions with standard errors clustered by firm. The results are shown in Table 2. In models
(1) through (3) we see that, consistent with the literature, being in an extractive industry is
correlated with a nearly 0.25 standard deviation drop in projected risk scores. Being in the
agricultural sector is associated with an even larger drop of 0.4 standard deviations. Being in the
construction sector is also correlated with a decrease in the ICRG ratings of the chosen project
destinations. The construction sector, and to some extent also agriculture, happen to be focal
areas of Chinese bilateral aid which has a heavy component of infrastructure development,
suggesting that AH2 could be at play here. The main finding here, however, is that the sizable
negative coefficient in front of being a central SOE is highly significant and persistent even after
controlling for the sector of the investment project. This first demonstrates the empirical
regularity that Chinese central SOEs do tend to make politically riskier investments. In addition,
sectoral focus cannot fully account for the higher political risks they choose for their investment
projects.

19
Models (3) and (6) include year fixed effects. These help to account for the possibility
that in some years companies on average choose riskier destinations. We see that, when
including year fixed effects, the negative effect of being a central SOE is actually more
significant, suggesting that SOEs are choosing even riskier places after conditioning upon the
average choices of other firms in a given year.
The specification of these models assumes that the effect of being an SOE is the same
across all sectors. Next I relax this assumption by interacting the SOE dummy with an umbrella
sector indicator that assumes a value of 1 if the project is in the extractive, agriculture, or
construction industries, and a value of zero otherwise. The results are shown in Table 2A. We
see that the effect of being a central SOE remains strong and significant. In fact, the effect of
SOE on the chosen level of risk for a given project is more negative in sectors other than
extractive, agriculture, and construction by another 0.08 standard deviations.4
To summarize, using the MOFCOM registry data we find that central SOEs’ overseas
investments are riskier than those of other Chinese companies. Furthermore, we find that this
risk gap cannot be fully accounted for by SOEs’ sectoral focus. This result lends supportive
evidence to my hypothesis.
Next I turn to data from the 2013 CODIS, which also is available at the project level (the
survey asks firms to list their three most significant overseas investment projects). Here I have a
smaller sample, including the 333 firms in the survey that have already invested abroad with a
total of 525 overseas projects, but I am able to control for a larger number of covariates. Apart
from firm’s sector and estimated revenue, the first group of additional covariates measure firms’
primary motivations for investing overseas. The survey asks respondents to rank, on a Likert
scale, the extent to which their overseas investment decisions were influenced by China’s 4 (0.17-0)-(0.44-0.19)=-0.08, and this difference is statistically significant.
20
bilateral agreements with potential host countries, by China’s Go Out policy, and by host country
policies. These measures allow me to control directly for the differential influence of bilateral
agreements and other policies on Chinese SOEs and private companies, which can be thought of
as proxy measure for the policy liability facing SOEs. The second additional covariate in this
model is a direct measure for whether the firm receives governmental support for their overseas
investments (in the forms of subsidies, low interest loans, etc.). This measure to some extent
captures firms’ soft budget constraint, but it is far from a complete or perfect measure. The
difficulty with testing for the soft budget constraint is precisely that it cannot be measured
directly. A soft budget constraint does not only manifest itself in the form of explicit policy
perks. Rather, it provides an implicit form of insurance in the event of investments going badly.
The results are shown in Table 3. The first thing to note is that firms that rate China’s
bilateral agreements as important to their investment decisions make riskier investments,
suggesting that China’s bilateral relations could be pushing investments to riskier destinations.
However, being an SOE still has a negative effect after controlling for the extent to which firms
are motivated by bilateral agreements, suggesting other factors are also at work. Obtaining
government support for overseas investments is, perhaps not surprisingly, correlated with
making riskier project choices. Including this control somewhat weakens the magnitude as well
as significance of the coefficient on the SOE indicator, but SOE still has a negative residual
effect. This is consistent with my expectation that the government support variable captures to a
certain extent the effect of a soft budget constraint but cannot completely subsume it.
Interestingly I find no significance on the sector variable. This result is likely due to the small
sample size and that there are relatively few firms in the extractive sector in the sample.

21
To summarize, findings from the 2013 CODIS data further corroborates evidence from
the MOFCOM registry data. Using 2013 CODIS I am able to measure directly the influence of
China’s bilateral agreements. The results show that the guiding effects of these agreements
cannot fully account for SOEs’ riskier investment profiles. Rather, the findings are consistent
with my expectation that the soft budget constraint, and the rent-seeking aspect of the soft budget
constraint in particular, explains in part SOEs’ propensity for higher political risks.
7. Risk Perception
Alternative Hypothesis 3 suggests that SOEs may be selecting out of safer investments due to
actual or perceived hostility from the developed world. The 2013 CODIS’s assessment of
investor risk perception helps to address this potentially confounding factor.
The survey lists eight countries, including the United States, Germany, Viet Nam,
Zambia, Zimbabwe, Brazil and Venezuela, to ensure an eclectic set of countries in different
regions, at different stages of development, and with varying governance systems. Survey
respondents, including both those who have invested overseas and those who have not, are asked
to choose any two countries they feel relatively knowledgeable about and evaluate a range of
risks as they pertain to their investment decisions. This design is concise and easy to execute.
Yet it is still able to reduce both anchoring bias and random error from lacking information.
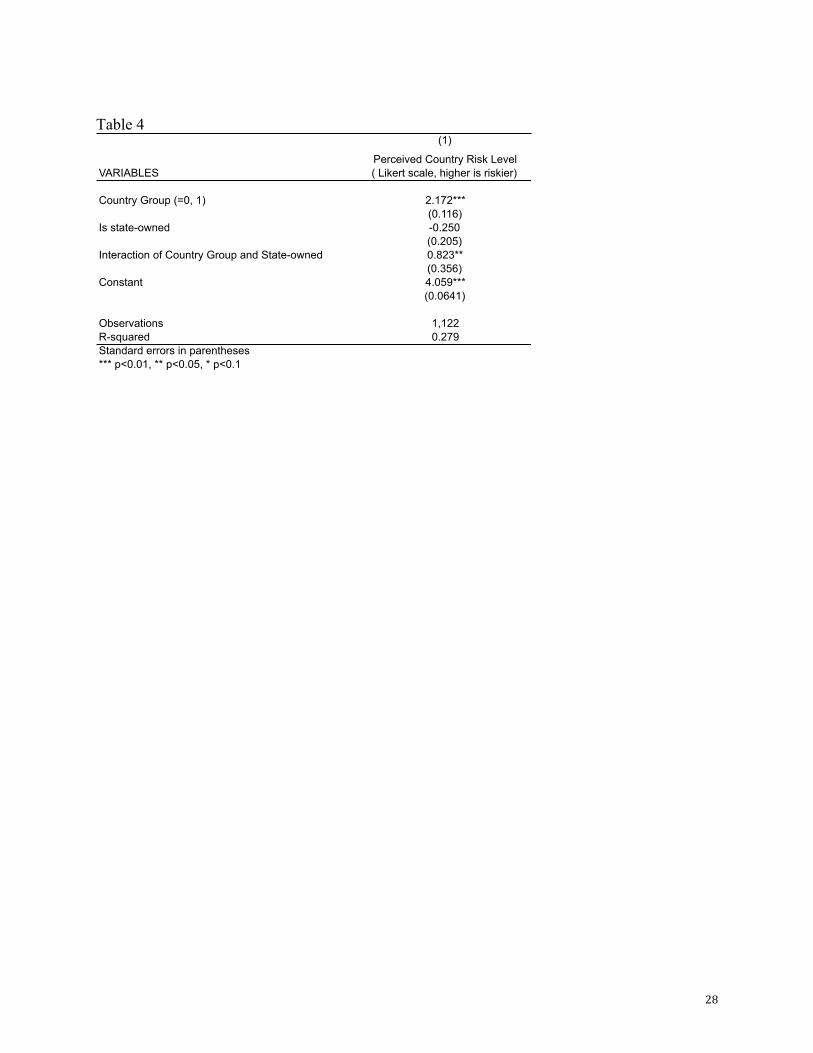
I then consider two groups of countries. Group 0 represents mature democracies, where I
include the United States and Germany. Group 1 represents poorly governed or authoritarian
states, where I include Venezuela and Zimbabwe. I have chosen these four countries as
representatives of the opposite extremes on the risk spectrum. They are considered the safest and
the riskiest countries respectively when I pool ratings from all respondents for all eight countries.

22
Next I compare SOEs’ and private companies’ differential ratings for these two groups of
countries on average. The results are shown graphically in Figure 2. The dark gray area
represents how much riskier the Group 1 countries are relative to Group 0. Note that, relative to
private companies, SOEs are actually more keenly aware of the risk differential between the two
groups of countries. Results from regression analyses are presented in Table 4. Here I find that
SOEs on average perceive the risk differential between Group 0 and Group 1 countries to be
higher (0.8 higher on Likert scale of 1 to 10) than private companies and this difference is
statistically significant. Perhaps more telling than the average rating across different dimensions
of risks is firms’ sensitivity to one specific type of risk, “national security inspection or other
politically motivated interference.” Here we see that Chinese companies indeed are highly
concerned with this risk relative to other dimensions of risks in Group 0 countries, suggesting the
presence of perceived hostility from developed economies, but two additional comparisons are
relevant: One is that, in spite of sensitivity to the inspection risk, companies still find risk levels
to be much lower in Group 0 countries overall as they pertain to their investments. The second
comparison is that both SOEs and private Chinese companies find the inspection risks worrisome.
This perception of western hostility is by no means unique to SOEs. As such, distorted risk
perception is not very likely to contribute to SOEs’ riskier investment profiles compared to
private companies, alleviating concerns about the confounding effects of AH3.
8. Conclusion and Discussion
This paper explores some of the mechanisms underlying the puzzling empirical regularity that
Chinese outbound investments are associated with higher host country risks than investments
from other countries. Although analysts have pointed to the role of Chinese state-owned
23
enterprises in contributing to this phenomenon, the claim has not been tested empirically. Nor
do we understand what aspects of Chinese SOEs may have led them to riskier investment
profiles.
In this paper I theorize that Chinese SOEs, and other SOEs to varying extents, serve two
purposes. They provide revenue for the state and fulfill policy liabilities through providing
certain key public goods to the society at large, which in turn translates into public support for
the state. I construct a stylized model that predicts the conditions under which SOEs can expect
bailouts from the state for their unsuccessful investments, thus eliminating the downside risks of
investments and motivating them to seek out higher risks. I derive from this theory that SOEs
will indeed choose riskier investments and that a key factor contributing to their higher risk
profile is the soft budget constraint.
Empirically this paper fills an important gap by separating SOEs from the rest of Chinese
investors. Previous studies, limited largely by data, lump Chinese investments into a single
category. Using project level data from China Ministry of Commerce’s public registry of
overseas investment projects and the 2013 China Outbound Direct Investment Survey, I am able
to demonstrate the riskier investment profiles of SOEs relative to private Chinese companies.
Furthermore, I show that this riskier profile cannot be fully explained by a range of alternative
hypotheses, providing strong suggestive evidence that a soft budget constraint is motivating
Chinese SOEs pursuit of riskier investments.
Analyses in this paper also produce some additional findings. Chinese investments in the
extractive, agricultural, and construction sectors are found to be associated with riskier
destination choices than those of other industries. More interestingly, I find that firms who base

24
their investment decisions heavily on China’s bilateral agreements make riskier investments than
those who do not.
It should be noted that this paper does not entirely solve the puzzle of why Chinese
investments appear to be politically riskier. To do so one will also need to look at the behaviors
of private Chinese companies and compare them to private firms from other countries. However,
this paper does fill a significant missing piece of the puzzle. I find evidence that a soft budget
constraint makes Chinese SOEs more attracted to political risks and that they are better able to
absorb risks due to implicit insurance provided by the Chinese state.
This finding has important implications for global governance. The soft budget
constraint gives Chinese SOEs a competitive advantage for operating in risky environments.
Other considerations aside, their ability to stay the course where no others can helps provide a
much-needed stabilizing force in some of the world’s most fragile and volatile areas.

25
Figure 1
Source: MOFCOM ODI Registry. Table 1
Source: MOFCOM ODI Registry.
010
0020
0030
0040
00
1995 2000 2005 2010Year
Agriculture ExtractiveManufacturing ConstructionTransport and Logistics TradeExploration Services
Investment Projects by Industry: 1995-2011Go Out Strategy Financial Crisis
Central SOEs Other Companies All
Primary Industry/Activity # projectsAs % of total by
central SOEs # projectsAs % of total by
other companies # projects As % of total
Agriculture, Fishery, and Forestry 155 9.4% 1,043 5.4% 1,198 5.7%Oil, Gas, and Mineral Extraction 166 10.0% 1,291 6.7% 1,457 6.9%Manufacturing 64 3.9% 2,602 13.4% 2,666 12.7%Utilities 20 1.2% 36 0.2% 56 0.3%Construction 242 14.6% 647 3.3% 889 4.2%Transportation and Logistics 81 4.9% 506 2.6% 587 2.8%Telecom and Information Technology 22 1.3% 346 1.8% 368 1.7%Trade 298 18.0% 7,541 38.9% 7,839 37.2%Hospitality 2 0.1% 97 0.5% 99 0.5%Finance 4 0.2% 11 0.1% 15 0.1%Real estate 11 0.7% 250 1.3% 261 1.2%Business services 510 6.8% 4514 7.0% 5,024 7.0%Research and technical services 74 4.5% 456 2.4% 530 2.5%Entertainment and Culture 3 0.2% 47 0.2% 50 0.2%Business Development 398 24.1% 3159 16.2% 3,557 16.9%Exploration 161 9.7% 686 3.5% 847 4.0%Total Number of Projects 1,652 19,402 21,054
26
Table 2
Table 2A
(1) (2) (3) (4) (5) (6)Project Risk
RatingProject Risk
RatingProject Risk
RatingProject Risk
RatingProject Risk
RatingProject Risk
Rating
Is Central SOE -0.225*** -0.234*** -0.196*** -0.233*** -0.243*** -0.205***(0.0329) (0.0331) (0.0324) (0.0331) (0.0333) (0.0327)
Extractive -0.244*** -0.249*** -0.248*** -0.249*** -0.254*** -0.254***(0.0175) (0.0175) (0.0172) (0.0175) (0.0175) (0.0173)
Agriculture -0.417*** -0.422*** -0.420*** -0.426***(0.0221) (0.0224) (0.0220) (0.0223)
Construction -0.191*** -0.195***(0.0146) (0.0145)
Constant 0.491*** 0.506*** 0.524*** 0.254*** 0.254*** 0.254***(0.00544) (0.00553) (0.00571) (1.02e-05) (1.47e-05) (1.68e-05)
Year Fixed Effect N N N Y Y YObservations 18,754 18,754 18,754 18,754 18,754 18,754R-squared 0.037 0.059 0.074 0.045 0.068 0.083Robust standard errors in parentheses*** p<0.01, ** p<0.05, * p<0.1
(1)
VARIABLESProject Risk
Rating
Is Central SOE (V1) -0.253***(0.0227)
Is in Extractive, Agriculture or Construction (V2) -0.275***(0.0112)
Interaction of V1 and V2 0.0975***(0.0345)
Constant 0.441***(0.00547)
Observations 13,383R-squared 0.062Standard errors in parentheses*** p<0.01, ** p<0.05, * p<0.1

27
Table 3
Figure 2
(1) (2) (3)Project Risk
RatingProject Risk
RatingProject Risk
Rating
Log total revenue (2012 Estimate) 0.0284*** 0.0287*** 0.0292***(0.0104) (0.0102) (0.0101)
Importance of bilateral agreements to investment decision -0.0862*** -0.0751** -0.121***(Likert scale) (0.0327) (0.0341) (0.0426)Importance of Go Out policy to investment decision 0.00775(Likert scale) (0.0402)Importance of host country policy to investment decision 0.0608(Likert scale) (0.0463)Obtains government support for ODI -0.158** -0.165**
(0.0697) (0.0693)Is state-owned -0.178** -0.155* -0.165*
(0.0880) (0.0858) (0.0839)In the resource sector -0.0976 -0.0789 -0.0668
(0.0955) (0.0922) (0.0923)Constant 0.178 0.189 0.0806
(0.219) (0.213) (0.235)
Observations 397 397 394R-squared 0.048 0.065 0.074Robust standard errors in parentheses*** p<0.01, ** p<0.05, * p<0.1
28
Table 4
(1)
VARIABLESPerceived Country Risk Level( Likert scale, higher is riskier)
Country Group (=0, 1) 2.172***(0.116)
Is state-owned -0.250(0.205)
Interaction of Country Group and State-owned 0.823**(0.356)
Constant 4.059***(0.0641)
Observations 1,122R-squared 0.279Standard errors in parentheses*** p<0.01, ** p<0.05, * p<0.1
29
References: Amighini, A., Rabellotti, R. and Sanfilippo, M. 2010. “Outward FDI from Developing Country MNEs as a Channel for Technological Catch-Up,” Seoul Journal of Economics, 23 (2): 239-261. Aleksynska, Mariya and Olena Havrylchyk, 2013. “FDI from the south: The role of institutional distance and natural resources,” European Journal of Political Economy, 29: 38-53. Beazer, Quintin and Daniel Blake. 2011. “It’s All Relative: Home Country Risk and FDI Flows.” Paper presented at the Politics of FDI Conference, Niehaus Center for Globalization and Governance, Princeton University, September 23 - 24. Bellos, S. and T. Subasat. 2012a, “Corruption and foreign direct investment: A panel gravity model approach,” Bulletin of Economic Research 64(4): 565–74. Bellos, S. and T. Subasat. 2012b, “Governance and foreign direct investment: A panel gravity model approach,” International Review of Applied Economics 26(3): 303–28. Bénassy-Quéré, A., Coupet, M., Mayer, T., 2007. “Institutional determinants of foreign direct investment.” The World Economy 30, 764–782. Biglaiser, G. and J. Staats, 2010. “Do political institutions affect foreign direct investment? A survey of U.S. corporations in Latin America”, Political Research Quarterly 63(3): 508-522 Biglaiser, G. and J. Staats 2012, “Foreign Direct Investment in Latin America: The Importance of Judicial Strength and Rule of Law,” International Studies Quarterly, 56 (1): 193–202. Buckley, P., Clegg, J., Cross, A., Liu, X., Voss, H., Zheng, P., 2007. “The determinants of Chinese outward foreign direct investment.” Journal of International Business Studies 38, 499–518. Bunker, Stephen and Paul S. Ciccantell. 2005. Globalization and the Race for Resources, The Johns Hopkins University Press. Busse, M., Hefeker, C., 2007. “Political risk, institutions and foreign direct investment.” European Journal of Political Economy 23, 397–415. China Council for the Promotion of International Trade (CCPIT). 2013. Report for the 2013 Chinese Outbound Direct Investment Survey. Beijing, China. Child, John and Suzanna Rodrigez. 2005. “The Internationalization of Chinese Firms -A Case for Theoretical Extension.” Management and Organization Review, 1:3 381–410. Collier, P., Hoeffler, A., 2004. “Greed and grievance in civil wars.” Oxford Economic Papers 56, 663–695.

30
Collier, P., Hoeffler, A., Soderbom, M., 2004. “On the duration of civil war.” Journal of Peace Research 41, 253–273. Dong, Xiao-Yuan & Putterman, Louis, 2003. "Soft budget constraints, social burdens, and labor redundancy in China's state industry," Journal of Comparative Economics, vol. 31(1), pages 110-133, March. Cuervo-Cazurra, A., 2006. “Who cares about corruption?” Journal of International Business Studies 37, 807–822. Cuervo-Cazurra, A., Genc, M., 2008. “Transforming disadvantages into Advantages: developing-country MNEs in the least developed countries.” Journal of International Business Studies 39, 957–979. Cull, Robert & Linxin Xu, 2003. “Who gets credit? The behavior of bureaucrats and state banks in allocating credit to Chinese state-owned enterprises.” Journal of Development Economics 71 (2), 533–559. Darby, J., Desbordes, R., Wooton, I., 2009. “Does public governance always matter? How experience of poor institutional quality influences FDI to the South.” CEPR Discussion Paper 7533. Centre for Economic Policy Research, London. Daude, D., Stein, E., 2007. “The quality of institutions and foreign direct investment.” Economics and Politics 19, 317–344. Dixon, William and Bruce Moon. 1993. “Political Similarity and American Foreign Trade Patterns.” Political Research Quarterly 46(March): 5-25. Frieden J A 1994 “International investment and colonial control: a new interpretation.” International Organization 48: 559–93 Gani, A. 2007, “Governance and foreign direct investment links: Evidence from panel data estimations,” Applied Economics Letters 14: 753–6. Globerman, S., Shapiro, D. 2002, “Global foreign direct investment flows: The role of governance infrastructure,” World Development 30: 1898–919. Globerman, S. and D. Shapiro, 2003, “Governance infrastructure and US foreign direct investment,” Journal of International Business Studies 34(1): 19–39. Gowa, Joanne and Edward D. Mansfield, “Alliances, Imperfect Markets, and Major-Power Trade,” International Organization, 58, Fall 2004 Grossman, Gene, and Elhanan Helpman. 1994. “Protection for Sale.” The American Economic Review, Vol. 84, No. 4. pp. 833-850.

31
Habib, M., Zurawicki, L., 2002. “Corruption and foreign direct investment.” Journal of International Business Studies 33, 291–307. Harms, Philipp and Ursprung, Heinrich (2002), “Do Civil and Political Repression Really Boost Foreign Direct Investment?”, Economic Inquiry, Vol. 40, No. 4, pp. 651-663. Henisz, W. J. 2000. “The institutional environment for multinational investment”. Journal of Law, Economics and Organization 16(2): 334-364. Hericourt, Jerome & Sandra Poncet. 2008. “FDI and credit constraints: Firm-level evidence from China.” Economic Systems 33. 1–21. Hveem, Helge, Carl Henrik Knutsen and Asmund Rygh, 2009. “Foreign direct investment and host country institutions: Does state ownership matter?,” Working Paper, University of Oslo. Jensen, N. 2003, “Democratic governance and multinational corporations: Political regimes and inflows of foreign direct investment,” International Organization 57: 587–616. Jensen, N. 2005. Domestic political institutions and political risk insurance premiums. Paper presented at the annual meeting of the American Political Science Association, Washington DC. Jensen, N. 2006. Nation-states and the multinational corporation: Political economy of foreign direct investment. Princeton, NJ: Princeton University Press. Kang, Rongping. 2009. “Chinese Overseas Investment: Global Competition and Other Factors Are Fueling the Next Wave,” Knowledge@Wharton, accessed on October 30, 2013. Kolstad, I. and Wiig, A. 2012. "What determines Chinese outward FDI?", Journal of World Business 47(1): 26−34. Kornai, Janos. 1980. Economics of Shortage, North-Holland, Amsterdam. Kornai, Janos. 1986. “The Soft Budget Constraint.” Kyklos, 39 (1), pp. 3-30. Li, Q. and A. Resnick , 2003. “Reversal of fortunes: Democratic institutions and foreign direct investment inflows to developing countries,” International Organization 57(1): 175–211. Lin, Huidan. 2011. “Foreign bank entry and firms’ access to bank credit: Evidence from China.” Journal of Banking & Finance. 35(4), 1000–1010. Lin, Justin Yifu & Cai, Fang & Li, Zhou, 1998."Competition, Policy Burdens, and State-Owned Enterprise Reform," American Economic Review, vol. 88(2), pages 422-27, May. Lin, Justin Yifu, and Guofu Tan. 1999. "Policy Burdens, Accountability, and the Soft Budget Constraint." American Economic Review, 89(2): 426-431.

32
Lin, Justin Yifu, and Zhiyun Li. 2006. “Policy Burdens, Moral Hazard, and the Soft Budget Constraint,” CCER Working Paper. Eden, Lorraine, and Stewart R Miller. 2004, “Distance Matters: Liability of Foreignness, Institutional Distance and Ownership Strategy,” in Michael A. Hitt and Joseph L.C. Cheng (ed.) Theories of the Multinational Enterprise: Diversity, Complexity and Relevance, Emerald Group Publishing Limited, pp.187-221 Morrow, James D., Randolph M. Siverson and Tressa E. Tabares, “The Political Determinants of International Trade: The Major Powers, 1907-90,” The American Political Science Review, Vol. 92, No. 3 (Sep., 1998), pp. 649-661 North, Douglass C. and Barry Weingast. 1989. “Constitution and Commitment: The Evolution of Institutional Governing Public Choice in Seventeenth-Century England”, The Journal of Economic History, 49/4: 803-832. Ross, M., 2004. “What do we know about natural resources and civil war?” Journal of Peace Economics 41, 337–356. Schmalensee, R. 1981. “Economics of scale and barriers to entry,” Journal of Political Economy,, pp. 1228–1238 Shi, Weiyi. 2013. “Productivity and FDI with policy distortions: the case of Chinese outbound direct investments,” Working Paper. Stasavage, David. 2002. "Private Investment and Political Institutions." Economics and Politics 14(1): 41-63. Spence. M. 1981, ‘The learning curve and competition’, Bell Journal of Economics, pp. 49–70. UNCTAD, 2007. Transnational corporations, extractive industries and development. World Investment Report. United Nations, New York and Geneva. Van der Ploeg, R., 2011. “Natural resources: curse or blessing?” Journal of Economic Literature 49, 366–420. Wei, Shang-Jin. 1997. “Why is corruption so much more taxing than tax? Arbitrariness kills.” NBER Working Paper 6255. Wei, Shang-Jin. 2000. "How Taxing is Corruption on International Investors?" The Review of Economics and Statistics, vol. 82(1), pages 1-11, February. Xu, Gao, 2010. “State-owned enterprises in China: How big are they?” http://blogs.worldbank.org/eastasiapacific/state-owned-enterprises-in-china-how-big-are-they