risk report - deutsche bank bank 1 – management report 80 annual report 2015 introduction...
TRANSCRIPT

Risk Report
Introduction – 80
Risk and Capital Overview – 81Key Risk Metric – 81Overall Risk Assessment – 82Risk Profile – 83
Risk and Capital Framework – 85Risk Management Principles and Governance – 85Risk Governance – 86Risk Culture – 90Risk Appetite and Capacity – 91Risk and Capital Plan – 92Stress testing – 93Recovery and Resolution Planning – 95
Risk and Capital Management – 96Risk Identification and Assessment – 97Credit Risk Management – 98
Market Risk Management – 105Operational Risk – 112Liquidity Risk Management – 117Business (Strategic) Risk Management – 122Reputational Risk Management – 122Model Risk Management – 122Compliance Risk Management – 123Insurance Specific Risk – 124Risk Concentration and Risk Diversification – 124
Risk and Capital Performance – 125Capital and Leverage Ratio – 125Credit Risk Exposure – 138Asset Quality – 159Trading Market Risk Exposures – 169Nontrading Market Risk Exposures – 174Operational Risk Exposure – 175Liquidity Risk Exposure – 177

Deutsche Bank 1 – Management Report 80Annual Report 2015
Introduction
Disclosures in line with IFRS 7 and IAS 1, as well as IFRS 4
The following Risk Report provides qualitative and quantitative disclosures about credit, market and other risks in line with the requirements of International Financial Reporting Standard 7 (IFRS 7) Financial Instruments: Disclosures, and capital disclosures required by International Accounting Standard 1 (IAS 1) Presentation of Financial Statements, as well as qualitative and quantitative disclosures about insurance risks in line with the requirements of International Fi-nancial Reporting Standard 4 (IFRS 4) Insurance contracts. Information which forms part of and is incorporated by reference into the financial statements of this report is marked by a bracket in the margins throughout this Risk Report.
Disclosures according to Pillar 3 of the Basel 3 Capital Framework
Most disclosures according to Pillar 3 of the Basel 3 Capital Framework, which are implemented in the European Union by the CRR and supported by EBA Implementing Technical Standards are published in our re-established additional Pillar 3 report, which can be found on our webpage. In cases where disclosures in this Risk Report also support Pillar 3 disclosure requirements these are highlighted by references from the Pillar 3 Report into the Risk Report.
Disclosures according to principles and recommendations of the Enhanced Disclosure Task Force (EDTF)
In 2012 the Enhanced Disclosure Task Force (“EDTF”) was established as a private sector initiative under the auspice of the Financial Stability Board, with the primary objective to develop fundamental principles for enhanced risk disclo-sures and to recommend improvements to existing risk disclosures. As a member of the EDTF we adhered to the disclosure recommendations in this Risk Report and also partly in our re-established additional Pillar 3 Report.
81 Deutsche Bank Operating and Financial Review – 30 Employees – 230Annual Report 2015 Outlook – 70 Internal Control over Financial Reporting – 235
Risk and Opportunities – 77 Information pursuant to Section – 315 (4)Risk Report – 79 of the German Commercial Code and ► Risk and Capital Overview Explanatory Report – 239Compensation Report – 188Corporate Responsibility – 228
Risk and Capital Overview
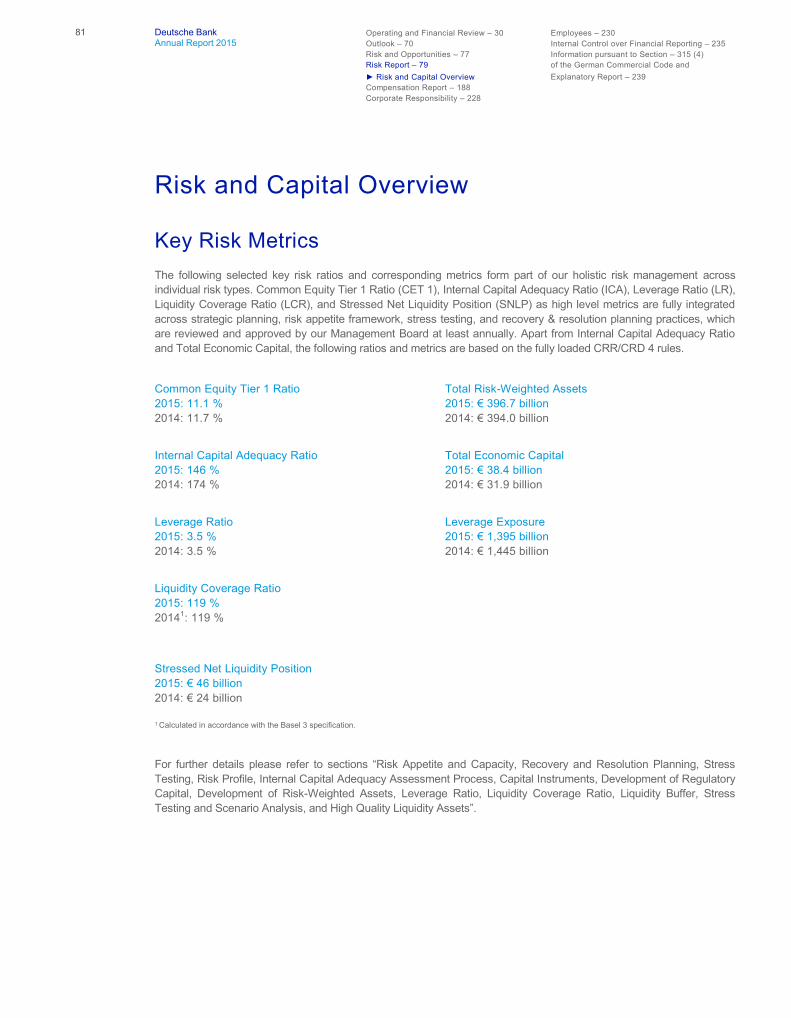
Key Risk MetricsThe following selected key risk ratios and corresponding metrics form part of our holistic risk management across individual risk types. Common Equity Tier 1 Ratio (CET 1), Internal Capital Adequacy Ratio (ICA), Leverage Ratio (LR), Liquidity Coverage Ratio (LCR), and Stressed Net Liquidity Position (SNLP) as high level metrics are fully integrated across strategic planning, risk appetite framework, stress testing, and recovery & resolution planning practices, which are reviewed and approved by our Management Board at least annually. Apart from Internal Capital Adequacy Ratio and Total Economic Capital, the following ratios and metrics are based on the fully loaded CRR/CRD 4 rules.
Common Equity Tier 1 Ratio2015: 11.1 %2014: 11.7 %
Total Risk-Weighted Assets2015: € 396.7 billion2014: € 394.0 billion
Internal Capital Adequacy Ratio2015: 146 %2014: 174 %
Total Economic Capital2015: € 38.4 billion2014: € 31.9 billion
Leverage Ratio2015: 3.5 %2014: 3.5 %
Leverage Exposure2015: € 1,395 billion2014: € 1,445 billion
Liquidity Coverage Ratio2015: 119 %20141: 119 %
Stressed Net Liquidity Position2015: € 46 billion2014: € 24 billion
1 Calculated in accordance with the Basel 3 specification.
For further details please refer to sections “Risk Appetite and Capacity, Recovery and Resolution Planning, Stress Testing, Risk Profile, Internal Capital Adequacy Assessment Process, Capital Instruments, Development of Regulatory Capital, Development of Risk-Weighted Assets, Leverage Ratio, Liquidity Coverage Ratio, Liquidity Buffer, Stress Testing and Scenario Analysis, and High Quality Liquidity Assets”.

Deutsche Bank 1 – Management Report 82Annual Report 2015
Overall Risk Assessment
Key risk categories include 1) financial risks such as credit risk (counterparty risk, industry risk, country risk and product risk), market risk (trading, non-trading and traded default risk), liquidity risk, business risk (including tax and strategic risk), and 2) non-financial risks (NFRs) including reputational risk and operational risk (with important sub-categories compliance risk, legal risk, model risk, information security risks, fraud risks, and money laundering risks). We manage the identification, assessment and mitigation of top and emerging risks through an internal governance process and the use of risk management tools and processes. Our approach to identification and impact assessment aims to ensure that we mitigate the impact of these risks on our financial results, long term strategic goals and reputation. Please refer to section "Risk and Capital Management" for detailed information on the management of our material risks.
As part of our regular risk and cross-risk analysis, sensitivities of the key portfolio risks are reviewed using a bottom-up risk assessment and through a top-down macro-economic and political scenario analysis. This two-pronged approach allows us to capture not only risks that have an impact across our risk inventories and business divisions but also those that are relevant only to specific portfolios.
Current portfolio-wide risks on which we continue to focus include: the economic slowdown and financial market volatil-ity in China and potential contagion to other economies, the impact of the ongoing slump in oil prices on key producing countries and related industries and the potential increases in interest rates by the U.S. Federal Reserve Bank, which could drive further capital outflows from Emerging Markets. In addition, global geopolitical risks remain elevated and have intensified in recent months.
Our credit exposure from the Oil & Gas sector accounts for less than 2 % of our total main credit exposure and ap-proximately € 16 billion, of which gross loans account for € 5 billion and irrevocable lending commitments account for € 8 billion. In our view we do not have over-sized concentrations in Emerging Markets countries. Our China credit portfolio is mainly with systemically important local Financial Institutions, financially strong state-owned, privately owned corporates and subsidiaries of Multinational Companies. More information is included in “Credit Risk Exposure” section.
The assessment of the potential impacts of these risks is made through integration into our group-wide stress tests which assess our ability to absorb these events should they occur. The results of these tests showed that we currently have adequate capital and liquidity reserves to absorb the impact of these risks if they were to materialize in line with the tests’ parameters. Information about risk and capital positions for our portfolios can be found in the “Risk and Capi-tal Performance” section.
Consistent with prior years, the year 2015 continued to demonstrate the trend of increasing global regulation of the financial services industry, which we view as likely to persist through the coming years. We are focused on identifying potential political and regulatory changes and assessing the possible impact on our business model and processes.
The overall focus of Risk and Capital Management throughout 2015 was on maintaining our risk profile in line with our risk strategy, increasing our capital base and supporting our strategic management initiatives with a focus on balance sheet optimization. This approach is reflected across the different risk metrics summarized below.

83 Deutsche Bank Operating and Financial Review – 30 Employees – 230 Annual Report 2015 Outlook – 70 Internal Control over Financial Reporting – 235 Risk and Opportunities – 77 Information pursuant to Section – 315 (4)
Risk Report – 79 of the German Commercial Code and ► Risk and Capital Overview Explanatory Report – 239
Compensation Report – 188 Corporate Responsibility – 228
Risk Profile The table below shows our overall risk position as measured by the economic capital usage calculated for credit, mar-ket, operational and business risk for the dates specified. To determine our overall (economic capital) risk position, we generally consider diversification benefits across risk types.
Overall risk position as measured by economic capital usage by risk type 2015 increase (decrease) from 2014
in € m. (unless stated otherwise) Dec 31, 2015 Dec 31, 2014 in € m. in % Credit risk 13,685 12,885 799 6 Market risk 17,436 14,852 2,583 17
Trading market risk 4,557 4,955 (397) (8) Nontrading market risk 12,878 9,898 2,981 30
Operational risk 10,243 7,598 2,644 35 Business risk 5,931 3,084 2,846 92 Diversification benefit1 (8,852) (6,554) (2,297) 35 Total economic capital usage 38,442 31,866 6,576 21 1 Diversification benefit across credit, market, operational and strategic risk (largest part of business risk).
As of December 31, 2015, our economic capital usage amounted to € 38.4 billion, which was € 6.6 billion, or 21 %, above the € 31.9 billion economic capital usage as of December 31, 2014. The higher overall risk position was mainly driven by a higher loss profile for strategic risk and operational risk, methodology enhancements in nontrading market risk and internal model recalibration in credit risk.
The economic capital usage for credit risk increased to € 13.7 billion as of December 31, 2015, € 799 million or 6 % higher compared to year-end 2014. This change mainly reflects increases from the internal model recalibration.
The economic capital usage for trading market risk decreased by € 397 million and was mainly driven by reductions in the credit spread and foreign exchange components. Nontrading market risk economic capital usage increased by € 3.0 billion or 30 % to € 12.9 billion as of December 31, 2015. The increase is mainly driven by methodology enhance-ments with regards to capturing credit spread risk of securities held as liquidity reserve, participation and equity com-pensation risk as well as an increased structural foreign exchange risk exposure mostly due to appreciation of the US dollar against the Euro.
The operational risk economic capital usage totaled € 10.2 billion as of December 31, 2015, which is € 2.6 billion or 35 % higher compared to year-end 2014. The increase was mainly driven by legal operational risk losses including legal provisions and an increased operational risk loss profile of the industry as a whole. This is reflected in the opera-tional risk loss data that has given rise to the increased economic capital usage and which is largely due to the outflows related to litigation, investigations and regulatory enforcement actions.
Our business risk economic capital methodology captures strategic risk, which also implicitly includes elements of non-standard risks including refinancing and reputational risk, and a tax risk component. The business risk increased by € 2.8 billion to € 5.9 billion as of December 31, 2015. This increase reflected a higher economic capital usage for the strategic risk component driven by a combination of planned restructuring costs and conservative earnings expecta-tions for 2016.
The inter-risk diversification effect of the economic capital usage across credit, market, operational and strategic risk increased by € 2.3 billion, or 35 %, as of December 31, 2015, due to an increase in economic capital usage before diversification and a methodology update in the first quarter 2015.
Our mix of various business activities results in diverse risk taking by our business divisions. We also measure the key risks inherent in their respective business models through the undiversified Total Economic Capital (EC) metric, which mirrors each business division’s risk profile before taking into account cross-risk effects at the Group level.

Deutsche Bank 1 – Management Report 84Annual Report 2015
Risk profile of our business divisions as measured by economic capital and risk-weighted assets Dec 31, 2015
in € m. (unless stated otherwise)
Corporate Banking & Securities
Private & Business Clients
Global Transaction Banking
Deutsche Asset & Wealth Management
Non-Core Operations Unit
Consoli- dation & Adjustments
Total in € m.
Total in %
Credit Risk 6,634 3,724 2,076 456 777 18 13,685 36 Market Risk 5,722 4,264 203 2,248 695 4,303 17,436 45 Operational Risk 6,778 871 1,077 1,054 463 0 10,243 27 Business Risk 5,662 0 7 1 261 0 5,931 15 Diversification Benefit1 (5,691) (1,314) (622) (714) (377) (133) (8,852) (23) Total EC in € m. 19,105 7,544 2,741 3,045 1,819 4,188 38,442 100 in % 50 20 7 8 5 11 100 N/M Risk-weighted assets2 195,096 80,016 52,062 23,795 34,463 11,283 396,714 N/M N/M - Not meaningful
1 Diversification benefit across credit, market, operational and strategic risk (largest part of business risk).2 Risk-weighted assets and capital ratios are based upon CRR/CRD 4 fully-loaded.
Dec 31, 2014
in € m. (unless stated otherwise)
Corporate Banking & Securities
Private & Business Clients
Global Transaction Banking
Deutsche Asset & Wealth Management
Non-Core Operations Unit
Consoli- dation & Adjustments
Total in € m.
Total in %
Credit Risk 5,799 3,547 2,302 323 868 46 12,885 40 Market Risk 5,153 3,200 185 1,987 1,308 3,020 14,852 47 Operational Risk 3,569 1,088 150 722 2,070 0 7,598 24 Business Risk 2,581 0 4 1 499 0 3,084 10 Diversification Benefit1 (3,441) (1,095) (262) (611) (1,087) (59) (6,554) (21) Total EC in € m. 13,661 6,740 2,379 2,420 3,658 3,008 31,866 100 in % 43 21 7 8 11 9 100 N/M Risk-weighted assets2 175,575 79,571 43,265 16,597 58,524 20,437 393,969 N/M N/M - Not meaningful
1 Diversification benefit across credit, market, operational and strategic risk (largest part of business risk).2 Risk-weighted assets and capital ratios are based upon CRR/CRD 4 fully-loaded. Amounts allocated to the business segments have been restated to reflect
comparatives according to the structure as of December 31, 2015.
Corporate Banking & Securities’ (CB&S) risk profile is dominated by its trading in support of origination, structuring and market making activities, which gives rise to market risk and credit risk. Further credit risks originate from exposures to corporates and financial institutions. The share of the operational risk in CB&S’ risk profile has increased significantly over the last year reflecting a higher loss profile in the industry, internal losses as well as a change in the allocation methodology within the Group. The remainder of CB&S’ risk profile is derived from strategic risk component of the business risk in light of the less optimistic earnings outlook for 2016.
Private & Business Clients’ (PBC) risk profile comprises credit risk from retail and small and medium-sized enterprises (SMEs) lending as well as nontrading market risk from investment risk, modeling of client deposits and credit spread risk. The increase in PBC’s overall risk profile over 2015 was mainly driven by methodology update for investment risk (primarily related to Hua Xia Bank Co. Ltd.) as well as higher credit spread risk.
Global Transaction Banking’s (GTB) revenues are generated from various products with different risk profiles. The vast majority of its risk relates to credit risk in the Trade Finance business and operational risk. The relatively low market risk mainly results from modeling of client deposits.
The main risk driver of Deutsche Asset & Wealth Management’s (Deutsche AWM) business are guarantees on invest-ment funds, which we report as nontrading market risk. Otherwise Deutsche AWM’s advisory and commission focused business attracts primarily operational risk. The increased economic capital usage over 2015 was mainly driven by a higher non-trading market risk from increased credit spread and default risk in guaranteed funds’ portfolio composition as well as an increased share from group operational risk capital based on the change in the divisional allocation methodology within the AMA model.
85 Deutsche Bank Operating and Financial Review – 30 Employees – 230 Annual Report 2015 Outlook – 70 Internal Control over Financial Reporting – 235 Risk and Opportunities – 77 Information pursuant to Section – 315 (4)
Risk Report – 79 of the German Commercial Code and
► Risk and Capital Framework Explanatory Report – 239 Compensation Report – 188 Corporate Responsibility – 228
The Non-Core Operations Unit (NCOU) portfolio includes activities that are non-core to the Bank’s future strategy; assets earmarked for de-risking; assets suitable for separation; assets with significant capital absorption but low returns; and assets exposed to legal risks. NCOU’s risk profile covers risks across the entire range of our operations primarily comprising credit and market risks targeted where possible for accelerated de-risking. The share of the operational risk in NCOU’s risk profile has decreased significantly over the last year reflecting a change in the allocation methodology within the Group.
Consolidation & Adjustments mainly comprises nontrading market risk for structural foreign exchange risk, pension risk and equity compensation risk. The increase in nontrading market risk compared to 2014 was mainly driven a higher structural foreign exchange risk and a methodology change for equity compensation risk.
Risk and Capital Framework
Risk Management Principles and Governance
The diversity of our business model requires us to identify, assess, measure, aggregate and manage our risks, and to allocate our capital among our businesses. Risk and capital are managed via a framework of principles, organizational structures and measurement and monitoring processes that are closely aligned with the activities of the divisions and business units:
‒ Core risk management responsibilities are embedded in the Management Board and delegated to senior risk man-agement committees responsible for execution and oversight. The Supervisory Board regularly monitors the risk and capital profile.
‒ We operate a Three Lines of Defense (“3LoD”) risk management model. The 1st Line of Defense (“1st LoD”) are all the business divisions and service providing infrastructure areas (Group Technology Operations and Corporate Services) who are the "owners" of the risks. The 2nd Line of Defense (“2nd LoD”) are all the independent risk and control infrastructure functions. The 3rd Line of Defense (“3rd LoD”) is Group Audit, which assures the effectiveness of our controls. The 3LoD model and the underlying design principles apply to all levels of the organization, i.e., group-level, regions, countries, branches and legal entities. All 3LoD are independent of one another and accounta-ble for maintaining structures that ensure adherence to the design principles at all levels.
‒ Risk strategy is approved by the Management Board on an annual basis and is defined based on the Group Risk Appetite and Strategic and Capital Plan in order to align risk, capital and performance targets.
‒ Cross-risk analysis reviews are conducted across the Group to validate that sound risk management practices and a holistic awareness of risk exist.
‒ All material risk types are managed via risk management processes, including: credit risk, market risk, operational risk, liquidity risk, business risk, reputational risk, model risk and compliance risk. Modeling and measurement ap-proaches for quantifying risk and capital demand are implemented across the material risk types. Non-standard risks (reputational risk, model risk, compliance risk) are implicitly covered in our economic capital framework, primar-ily within operational and strategic risk. For more details, refer to section “Risk and Capital Management” for the management process of our material risks.
‒ Monitoring, stress testing tools and escalation processes are in place for key capital and liquidity thresholds and metrics.
‒ Systems, processes and policies are critical components of our risk management capability. ‒ Recovery planning provides the escalation path for crisis management governance and supplies senior manage-
ment with a list of actions designed to improve the capital and liquidity positions in a stress event. ‒ Resolution planning is closely supervised by our resolution authority, the Single Resolution Board (“SRB”). It pro-
vides a strategy to manage Deutsche Bank in case of default. It is designed to prevent the need for tax payer bailout and strengthen financial stability by the continuation of critical services delivered to the wider economy.

Deutsche Bank 1 – Management Report 86Annual Report 2015
Risk Governance
Our operations throughout the world are regulated and supervised by relevant authorities in each of the jurisdictions in which we conduct business. Such regulation focuses on licensing, capital adequacy, liquidity, risk concentration, con-duct of business as well as organizational and reporting requirements. The European Central Bank in connection with the competent authorities of EU countries which joined the Single Supervisory Mechanism via the Joint Supervisory Team act in cooperation as our primary supervisors to monitor our compliance with the German Banking Act and other applicable laws and regulations as well as the CRR/CRD 4 framework and respective implementations into German law.
European banking regulators assess our capacity to assume risk in several ways, which are described in more detail in the section “Regulatory Capital” of this report.
Several layers of management provide cohesive risk governance:
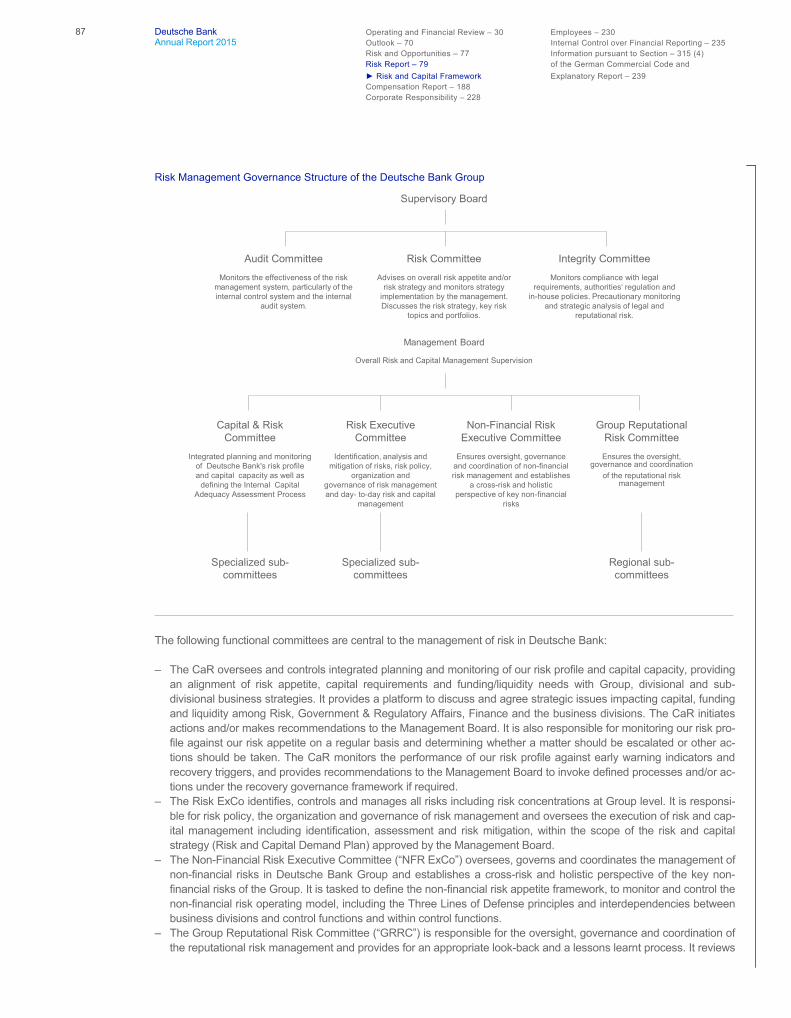
‒ The Supervisory Board is informed regularly and – as necessary – on special developments in our risk situation, risk management and risk controlling, as well as on our reputation and material litigation cases. It has formed various committees to handle specific tasks.
‒ At the meetings of the Risk Committee, the Management Board reports on credit, market, liquidity, business, com-pliance, model, operational as well as litigation and reputational risks. It also reports on credit risk strategy, credit portfolios, loans requiring a Supervisory Board resolution pursuant to law or the Articles of Association, questions of capital resources and matters of special importance due to the risks they entail. The Risk Committee deliberates with the Management Board on issues of the aggregate risk disposition and the risk strategy and supports the Su-pervisory Board in monitoring the implementation of this strategy.
‒ The Integrity Committee monitors the Management Board’s measures that promote the company’s compliance with legal requirements, authorities’ regulations and the company’s own in-house policies. It also reviews the Bank’s Code of Business Conduct and Ethics, monitors and analyzes the Bank’s legal and reputational risks and advocates their avoidance.
‒ The Audit Committee monitors, among other matters, the effectiveness of the risk management system, particularly the internal control system and the internal audit system.
‒ The Management Board is responsible for managing Deutsche Bank Group in accordance with the law, the Articles of Association and its Terms of Reference with the objective of creating sustainable value in the interest of the com-pany, thus taking into consideration the interests of the shareholders, employees and other stakeholders. The Man-agement Board is responsible for establishing a proper business organization, encompassing an appropriate and effective risk management. In agreement with the Supervisory Board and with the aim to ensure an effective gov-ernance of resources and risk, the Management Board has established the Capital and Risk Committee (“CaR”), the Risk Executive Committee (“Risk ExCo”),the Non-Financial Risk Executive Committee (“NFR ExCo”), and the Group Reputational Risk Committee (“GRRC”) whose roles are described in more detail below. In the fourth quarter of 2015, the Management Board streamlined the number of directly established committees. Hence, a revised committee governance structure is being prepared which will, going forward, combine risk management-relevant matters under one committee, starting 1. April 2016.
87 Deutsche Bank Operating and Financial Review – 30 Employees – 230 Annual Report 2015 Outlook – 70 Internal Control over Financial Reporting – 235 Risk and Opportunities – 77 Information pursuant to Section – 315 (4)
Risk Report – 79 of the German Commercial Code and
► Risk and Capital Framework Explanatory Report – 239 Compensation Report – 188 Corporate Responsibility – 228
Risk Management Governance Structure of the Deutsche Bank Group
The following functional committees are central to the management of risk in Deutsche Bank:
‒ The CaR oversees and controls integrated planning and monitoring of our risk profile and capital capacity, providing an alignment of risk appetite, capital requirements and funding/liquidity needs with Group, divisional and sub-divisional business strategies. It provides a platform to discuss and agree strategic issues impacting capital, funding and liquidity among Risk, Government & Regulatory Affairs, Finance and the business divisions. The CaR initiates actions and/or makes recommendations to the Management Board. It is also responsible for monitoring our risk pro-file against our risk appetite on a regular basis and determining whether a matter should be escalated or other ac-tions should be taken. The CaR monitors the performance of our risk profile against early warning indicators and recovery triggers, and provides recommendations to the Management Board to invoke defined processes and/or ac-tions under the recovery governance framework if required.
‒ The Risk ExCo identifies, controls and manages all risks including risk concentrations at Group level. It is responsi-ble for risk policy, the organization and governance of risk management and oversees the execution of risk and cap-ital management including identification, assessment and risk mitigation, within the scope of the risk and capital strategy (Risk and Capital Demand Plan) approved by the Management Board.
‒ The Non-Financial Risk Executive Committee (“NFR ExCo”) oversees, governs and coordinates the management of non-financial risks in Deutsche Bank Group and establishes a cross-risk and holistic perspective of the key non-financial risks of the Group. It is tasked to define the non-financial risk appetite framework, to monitor and control the non-financial risk operating model, including the Three Lines of Defense principles and interdependencies between business divisions and control functions and within control functions.
‒ The Group Reputational Risk Committee (“GRRC”) is responsible for the oversight, governance and coordination of the reputational risk management and provides for an appropriate look-back and a lessons learnt process. It reviews
Management Board
Overall Risk and Capital Management Supervision
Supervisory Board
Specialized sub-committees
Capital & RiskCommittee
Integrated planning and monitoring of Deutsche Bank's risk profile and capital capacity as well as
defining the Internal Capital Adequacy Assessment Process
Specialized sub-committees
Risk ExecutiveCommittee
Identification, analysis and mitigation of risks, risk policy,
organization and governance of risk management and day- to-day risk and capital
management
Audit Committee
Monitors the effectiveness of the risk management system, particularly of the internal control system and the internal
audit system.
Risk Committee
Advises on overall risk appetite and/orrisk strategy and monitors strategy
implementation by the management. Discusses the risk strategy, key risk
topics and portfolios.
Integrity Committee
Monitors compliance with legal requirements, authorities‘ regulation and
in-house policies. Precautionary monitoring and strategic analysis of legal and
reputational risk.
Non-Financial RiskExecutive Committee
Ensures oversight, governance and coordination of non-financial risk management and establishes
a cross-risk and holistic perspective of key non-financial
risks
Group ReputationalRisk Committee
Ensures the oversight,governance and coordination
of the reputational risk management
Regional sub-committees

Deutsche Bank 1 – Management Report 88Annual Report 2015
and decides all Reputational Risk issues escalated by the Regional Reputational Risk Committees (“RRRCs”) and RRRC decisions which have been appealed by the Units. It provides guidance on Group-wide reputational risk mat-ters, including communication of sensitive topics, to the appropriate levels of Deutsche Bank Group. The RRRCs which are sub-committees of the GRRC, are responsible for the oversight, governance and coordination of the management of reputational risk in the respective regions on behalf of the Management Board.
‒ The Portfolio Risk Committee (“PRC”) supports the Risk ExCo and the CaR with particular emphasis on the man-agement of Group-wide risk patterns including the review and governance of key concentration risks.
‒ The Living Wills Committee (“LWC”) is the dedicated sub-committee of the CaR with focus on recovery and resolu-tion planning. It oversees the implementation of our recovery and resolution plans and enhancements to the Group’s operational readiness to respond to severe stress or the threat of a severe stress.
‒ The Regulatory Capital Committee (“RCC”) is a further sub-committee of our Capital and Risk Committee. It is tasked with oversight on our risk quantification models. The RCC has also responsibility for the oversight and con-trol of our Internal Capital Adequacy Assessment Process (“ICAAP”). Together with the PRC, It oversees our Group-wide stress tests, reviews the results and proposes management action, if required. It monitors the effective-ness of the stress test process and aims to drive continuous improvement of our stress testing framework.
Multiple senior members are members of the CaR as well as the Risk ExCo, NFR ExCo and/or GRRC, which facilitates the information flow between these committees.
We will continue to enhance the aforementioned committee structure going forward culminating into a single committee overseeing risk matters that are established by the Management Board namely the Group Risk Committee.
Our Chief Risk Officer (“CRO”), who is a member of the Management Board, has Group-wide, supra-divisional respon-sibility for the management of all credit, market and operational risks as well as for the comprehensive control of risk, i.e., including liquidity risk, and continuing development of methods for risk measurement. In addition, the Chief Risk Officer is responsible for monitoring, analyzing and reporting risk on a comprehensive basis, including asset and liability gap, capital, liquidity, legal, compliance and regulatory risks, as well as other non-financial risks.
The CRO has direct management responsibility for the following risk management functions: Credit Risk Management, Market Risk Management, Operational Risk Management and Liquidity Risk Control.
These are established with the mandate to:
‒ Support that the business within each division is consistent with the risk appetite that the CaR has set within a framework established by the Management Board;
‒ Determine and implement risk and capital management policies, procedures and methodologies that are appropri-ate to the businesses within each division;
‒ Approve credit, market and liquidity risk limits; ‒ Conduct periodic portfolio reviews to keep the portfolio of risks within acceptable parameters; and ‒ Develop and implement risk and capital management infrastructures and systems that are appropriate for each
division.
Dedicated divisional Chief Risk Officers as well as regional Chief Risk Officers for Germany, for the Americas and for Asia-Pacific have been appointed to establish holistic risk management coverage. Since January 2016, along with Deutsche Bank’s business divisions, the responsibilities of the divisional CROs have been aligned.
The heads of the aforementioned risk management functions as well as the regional and divisional Chief Risk Officers have a reporting line into the CRO.
In 2015 our 3LoD program concluded and ownership for maintenance and development of the 3LoD framework was transferred to ORM. The 3LoD program established Divisional Control Officers (“DCO”) to strengthen capabilities across the 1st LoD as risk owners, while clarifying control accountabilities and enhanced standards across 2nd LoD control functions. A new non-financial Risk and Control Management framework and IT platform was established to
89 Deutsche Bank Operating and Financial Review – 30 Employees – 230 Annual Report 2015 Outlook – 70 Internal Control over Financial Reporting – 235 Risk and Opportunities – 77 Information pursuant to Section – 315 (4)
Risk Report – 79 of the German Commercial Code and
► Risk and Capital Framework Explanatory Report – 239 Compensation Report – 188 Corporate Responsibility – 228
manage the effectiveness of the control environment by the 1st and 2nd LoD and is currently being rolled out and further enhanced.
Several teams within the risk management functions cover overarching aspects of risk management. Their mandate is to provide an increased focus on holistic risk management and cross-risk oversight to further enhance our risk portfolio steering. Key objectives are to:
‒ Drive key strategic cross-risk initiatives and establish greater cohesion between defining portfolio strategy and gov-erning execution, including regulatory adherence;
‒ Provide a strategic and forward-looking perspective on the key risk issues for discussion at senior levels within the bank (risk appetite, stress testing framework);
‒ Strengthen risk culture in the bank; and ‒ Foster the implementation of consistent risk management standards.
Since January 2016, these tasks have been consolidated into the newly created Enterprise Risk Management (ERM) function. ERM also sets the bank-wide risk management framework aimed at identifying and controlling risks across the institution within the agreed risk appetite.
Also since January 1, 2016, the second line of defence oversight for both the Group Data Management Office (GDMO) and the Chief Information Security Office (CISO) transferred to the Risk organization as well as Corporate Security & Business Continuity (CSBC), demonstrating our increased focus on holistic management of non-financial risks.
Our Finance, Risk and Group Audit functions operate independently of our business divisions. It is the responsibility of the Finance and Risk departments to quantify and verify the risk that we assume and maintain the quality and integrity of our risk-related data. Group Audit as our 3rd Line of Defence, independently examines, evaluates and reports on the adequacy of both the design and effectiveness of the systems of internal control including the risk management sys-tems.
The integration of the risk management of our subsidiary Deutsche Postbank AG is promoted through harmonized processes for identifying, assessing, managing, monitoring, and communicating risk, the strategies and procedures for determining and safe guarding risk-bearing capacity, and corresponding internal control procedures. Key features of the joint governance are:
‒ Functional reporting lines from the Postbank Risk Management to Deutsche Bank Risk; ‒ Participation of voting members from Deutsche Bank from the respective risk functions in Postbank’s key risk com-
mittees and vice versa for selected key committees; and ‒ Implementation of key Group risk policies at Postbank.
The key risk management committees of Postbank, in all of which Postbank’s Chief Risk Officer or senior risk manag-ers of Deutsche Bank are voting members, are:
‒ The Bank Risk Committee, which advises Postbank’s Management Board with respect to the determination of over-all risk appetite and risk and capital allocation;
‒ The Credit Risk Committee, which is responsible for limit allocation and the definition of an appropriate limit frame-work;
‒ The Market Risk Committee, which decides on limit allocations as well as strategic positioning of Postbank’s bank-ing and trading book and the management of liquidity risk;
‒ The Operational Risk Management Committee, which defines the appropriate risk framework as well as the limit allocation for the individual business areas; and
‒ The Model and Validation Risk Committee, which monitors validation of all rating systems and risk management models.

Deutsche Bank 1 – Management Report 90Annual Report 2015
In 2014, the full integration of large clients was completed. These are now centrally managed on our credit platform and the regulator extended acceptance for the use of the joint model parameters for large cap corporate clients and finan-cial institutions.
Following the announcement of Strategy 2020 at the end of April 2015 – in the context of which we intend to de-consolidate and sell Postbank and its subsidiaries – further system integration was halted. However, the achieved level of integration and joint risk management described above is planned to be maintained unchanged until Postbank ceas-es to be a part of Deutsche Bank Group.
In parallel, work has commenced to prepare the complete separation of Postbank sub-group. The principal pre-condition guiding all preparations for a separation is to maintain Postbank’s continuous operational capability and its adherence to regulatory requirements at all times.
Risk Culture
We seek to promote a strong risk culture throughout our organization. Our aim is to help reinforce our resilience by encouraging a holistic approach to the management of risk and return throughout our organization as well as the effec-tive management of our risk, capital and reputational profile. We actively take risks in connection with our business and as such the following principles underpin risk culture within our group:
‒ Risk is taken within a defined risk appetite; ‒ Every risk taken needs to be approved within the risk management framework; ‒ Risk taken needs to be adequately compensated; and ‒ Risk should be continuously monitored and managed.
Employees at all levels are responsible for the management and escalation of risks. We expect employees to exhibit behaviors that support a strong risk culture. To promote this our policies require that behavior assessment is incorpo-rated into our performance assessment and compensation processes. We have communicated the following risk cul-ture behaviors through various communication vehicles:
‒ Being fully responsible for our risks; ‒ Being rigorous, forward looking and comprehensive in the assessment of risk; ‒ Inviting, providing and respecting challenges; ‒ Trouble shooting collectively; and ‒ Placing Deutsche Bank and its reputation at the heart of all decisions.
To reinforce these expected behaviors and strengthen our risk culture, we conduct a number of group-wide activities. Our Board members and senior management frequently communicate the importance of a strong risk culture to sup-port a consistent tone from the top. In addition, to drive staff understanding and knowledge of risk culture, a dedicated risk culture library of industry reports and articles has been established on DB’s internal social media platform.
Throughout 2015, and into 2016, there has been increased focus on the effectiveness of training. Rather than introduc-ing additional training modules, where feasible we are embedding new messages into existing courses to keep them up to date and timely, and to avoid ‘learner overload’.
In addition, along with other measures to strengthen our performance management processes, we have designed and implemented a process to tie formal measurement of risk culture-related behaviors to our employee performance as-sessment, promotion and compensation processes. This process was first piloted in CB&S and GTB in 2010, and subsequently implemented in all divisions, with PBC International being the latest to have rolled out the process in July 2015. This process is designed to further strengthen employee accountability.
91 Deutsche Bank Operating and Financial Review – 30 Employees – 230 Annual Report 2015 Outlook – 70 Internal Control over Financial Reporting – 235 Risk and Opportunities – 77 Information pursuant to Section – 315 (4)
Risk Report – 79 of the German Commercial Code and
► Risk and Capital Framework Explanatory Report – 239 Compensation Report – 188 Corporate Responsibility – 228
To aid with the holistic assessment of risk culture, 2015 saw the development of a Risk Culture Framework. The Framework defines the levers that contribute to the evolution of a strong risk culture, as well as the minimum criteria which should be met at Group and divisional level. 2016 will see the launch and application of this Framework across the Business.
Based on the newly developed Risk Culture Framework, a Risk Culture Annual Report was produced and presented to the Management Board as well as the Risk Committee of the Supervisory Board at the end of 2015. This forms part of DB’s commitment to ensure senior management are informed with regards to the risk culture of the Bank.
Risk Appetite and Capacity
Risk appetite expresses the level of risk that we are willing to assume within our risk capacity in order to achieve our business objectives, as defined by a set of minimum quantitative metrics and qualitative standards. Risk capacity is defined as the maximum level of risk we can assume in both normal and distressed situations before breaching regula-tory constraints and our obligations to stakeholders.
Risk appetite is an integral element in our business planning processes via our Risk and Capital Demand Plan, to promote the appropriate alignment of risk, capital and performance targets, while at the same time considering risk capacity and appetite constraints from both financial and non-financial risks. We leverage the stress testing process to test the compliance of the plan also under stressed market conditions. Top-down risk appetite serves as the limit for risk-taking for the bottom-up planning from the business functions.
The Management Board reviews and approves our risk appetite and capacity on an annual basis, or more frequently in the event of unexpected changes to the risk environment, with the aim of ensuring that they are consistent with our Group’s strategy, business and regulatory environment and stakeholders’ requirements.
In order to determine our risk appetite and capacity, we set different group level triggers and thresholds on a forward looking basis and define the escalation requirements for further action. We assign risk metrics that are sensitive to the material risks to which we are exposed and which are able to function as key indicators of financial health. In addition to that, we link our risk and recovery management governance framework with the risk appetite framework. In detail, we assess a suite of metrics under stress (CRR/CRD 4 fully loaded Common Equity Tier 1 (“CET 1”) ratio, Internal Capital Adequacy (“ICA”) ratio, and Stressed Net Liquidity Position (“SNLP”)) within the regularly performed benchmark and more severe group-wide stress tests and compare them to the Red-Amber-Green (“RAG”) levels as defined in the table below.
Risk Appetite Thresholds for key metrics
RAG levels CRR/CRD 4 fully loaded CET 1 ratio Internal capital adequacy Stressed net liquidity position
Normal > 8.5 % > 140 % > € 5 billion Critical 8.5 % – 5.5 % 140 % – 120 % € 5 billion – € 0 billion Crisis < 5.5 % < 120 % < € 0 billion
Reports relating to our risk profile as compared to our risk appetite and strategy and our monitoring thereof are pre-sented regularly up to the Management Board. Throughout the year 2015, our actual risk profile has remained in the normal levels as defined in the table above. In the event that our desired risk appetite is breached under either normal or stressed scenarios, a predefined escalation governance matrix is applied so these breaches are highlighted to the respective committees, and ultimately to the Chief Risk Officer and the Management Board. Amendments to the risk appetite and capacity must be approved by the Chief Risk Officer or the full Management Board, depending on their significance. In November 2015 as part of our annual risk appetite thresholds calibration exercise, we adjusted our normal and crisis level of CRR/CRD 4 fully loaded CET 1 ratio to >10 % and <7.25 % respectively. Furthermore, we enhanced the key metrics to include Liquidity Coverage Ratio (LCR) and Leverage Ratio (LR) with normal and crisis level of LCR set at >105 % and <100 % and LR (CRR/CRD 4 fully loaded) level at >3.2 % and <3.1 % respectively. All these changes are effective January 1, 2016.

Deutsche Bank 1 – Management Report 92Annual Report 2015
Risk and Capital Plan
Strategic and Capital Plan
We conduct annually an integrated strategic planning process which lays out the development of our future strategic direction as a group and for our business areas/units. The strategic plan aims to create a holistic perspective on capital, funding and risk under risk-return considerations. This process translates our long term strategic targets into measura-ble short to medium term financial targets and enables intra-year performance monitoring and management. Thereby we aim to identify optimal growth options by considering the risks involved and the allocation of available capital re-sources to drive sustainable performance. Risk specific portfolio strategies complement this framework and allow for an in-depth implementation of the risk strategy on portfolio level, addressing risk specifics including risk concentrations.
The strategic planning process consists of two phases: a top-down target setting and a bottom-up substantiation.
In a first phase – the top down target setting – our key targets for profit and loss (including revenues and costs), capital supply, and capital demand as well as leverage and funding and liquidity are discussed for the group and the key busi-ness areas. In this process, the targets for the next three years are based on our global macro-economic outlook and the expected regulatory framework. Subsequently, the targets are approved by the Management Board.
In a second phase, the top-down objectives are substantiated bottom-up by detailed business unit plans, which for the first year consist of a month by month operative plan; years two and three are annual plans. The proposed bottom-up plans are reviewed and challenged by Finance and Risk and are discussed individually with the business heads. Thereby, the specifics of the business are considered and concrete targets decided in line with our strategic direction. The bottom-up plans include targets for key legal entities to review local risk and capitalization levels. Stress tests complement the strategic plan to also consider stressed market conditions.
The resulting Strategic and Capital Plan is presented to the Board for discussion and approval. Following the approval of the Management Board, the final plan is presented to the Supervisory Board.
The Strategic and Capital Plan is designed to support our vision of being a leading client-centric global universal bank and aims to ensure:
‒ Balanced risk adjusted performance across business areas and units; ‒ High risk management standards with focus on risk concentrations; ‒ Compliance with regulatory requirements; ‒ Strong capital and liquidity position; and ‒ Stable funding and liquidity strategy allowing for the business planning within the liquidity risk appetite and regulato-
ry requirements.
The Strategic and Capital Planning process allows us to:
‒ Set earnings and key risk and capital adequacy targets considering the bank’s strategic focus and business plans; ‒ Assess our risk-bearing capacity with regard to internal and external requirements (i.e., economic capital and regu-
latory capital); and ‒ Apply an appropriate stress test to assess the impact on capital demand, capital supply and liquidity.
The specific limits e.g. for regulatory capital demand, economic capital, and leverage exposures are derived from the Strategic and Capital Plan to align risk, capital and performance targets at all relevant levels of the organization.
All externally communicated financial targets are monitored on an ongoing basis in appropriate management commit-tees. Any projected shortfall from targets is discussed together with potential mitigating strategies seeking to ensure that we remain on track to achieve our targets. Amendments to the strategic and capital plan must be approved by the Management Board. Achieving our externally communicated solvency targets ensures that we also comply with the

93 Deutsche Bank Operating and Financial Review – 30 Employees – 230 Annual Report 2015 Outlook – 70 Internal Control over Financial Reporting – 235 Risk and Opportunities – 77 Information pursuant to Section – 315 (4)
Risk Report – 79 of the German Commercial Code and
► Risk and Capital Framework Explanatory Report – 239 Compensation Report – 188 Corporate Responsibility – 228
Group Supervisory Review and Evaluation Process requirements as articulated by our home supervisor. In December 2015, the ECB informed Deutsche Bank that the consolidated Group has to keep a CET 1 ratio of at least 10.25 % on a phase-in basis at all times. Deutsche Bank´s G-SIB buffer of currently 2.0 % is not included in the minimum level sub-ject to a 4 year phase-in period.
Internal Capital Adequacy Assessment Process
The lnternal Capital Adequacy Assessment Process (“ICAAP”) requires banks to identify and assess risks, maintain sufficient capital to face these risks and apply appropriate risk-management techniques to maintain adequate capitali-zation on an ongoing and forward looking basis, i.e., internal capital supply to exceed internal capital demand (figures are described in more detail in the section “Internal Capital Adequacy”).
We, at a Group level, maintain compliance with the lCAAP as required under Pillar 2 of Basel 3 and its local implemen-tation in Germany, the Minimum Requirements for Risk Management (MaRisk), through a Group-wide risk manage-ment and governance framework, methodologies, processes and infrastructure.
In line with MaRisk and Basel requirements, the key instruments to help us maintain our adequate capitalization on an ongoing and forward looking basis are:
‒ A strategic planning process which aligns risk strategy and appetite with commercial objectives; ‒ A continuous monitoring process against approved risk, leverage and capital targets set; ‒ Regular risk, leverage and capital reporting to management; and ‒ An economic capital and stress testing framework which also includes specific stress tests to underpin our recovery
monitoring processes.
Stress testing
We have a strong commitment to stress testing performed on a regular basis in order to assess the impact of a severe economic downturn on our risk profile and financial position. These exercises complement traditional risk measures and represent an integral part of our strategic and capital planning process. Our stress testing framework comprises regular Group-wide stress tests based on internally defined benchmark and more severe macroeconomic global down-turn scenarios. We include all material risk types into our stress testing exercises. The time-horizon of internal stress tests is generally one year and can be extended to multi-year, if required by the scenario assumptions. Our methodolo-gies undergo regular scrutiny from internal experts as well as regulators to review whether they correctly capture the impact of a given stress scenario. These analyses are complemented by portfolio- and country-specific stress tests as well as regulatory requirements, such as annual reverse stress tests and additional stress tests requested by our regu-lators on group or legal entity level. Moreover, capital plan stress testing is performed to assess the viability of our capital plan in adverse circumstances and to demonstrate a clear link between risk appetite, business strategy, capital plan and stress testing. An integrated procedure allows us to assess the impact of ad-hoc scenarios that simulate potential imminent financial or geopolitical shocks.
The initial phase of our internal stress tests consists of defining a macroeconomic downturn scenario by dbResearch in cooperation with business specialists. dbResearch monitors the political and economic development around the world and maintains a macro-economic heat map that identifies potentially harmful scenarios. Based on quantitative models and expert judgments, economic parameters such as foreign exchange rates, interest rates, GDP growth or unem-ployment rates are set accordingly to reflect the impact on our business. The scenario parameters are translated into specific risk drivers by subject matter experts in the risk units. Based on our internal models framework for stress test-ing, the following major metrics are calculated under stress: risk-weighted assets, impacts on profit and loss and eco-nomic capital by risk type. These results are aggregated at the Group level, and key metrics such as the SNLP, the CET 1 ratio and ICA ratio under stress are derived. Stress testing results and the underlying scenarios are reviewed across risk types on various levels by senior managers within Risk, Finance and the business units. After comparing these results against our defined risk appetite, senior management decides on specific mitigation actions to remediate the stress impact in alignment with the overall strategic and capital plan if certain limits are breached. The results also

Deutsche Bank 1 – Management Report 94Annual Report 2015
feed into the recovery planning which is crucial for the recoverability of the bank in times of crisis. The outcome is pre-sented to senior management up to the Management Board to raise awareness on the highest level as it provides key insights into specific business vulnerabilities and contributes to the overall risk profile assessment of the bank. In 2015 we remained well capitalized within our internal stress testing program under various severe stress events. By choos-ing actions out of our pool of maintained recovery measures we would have been able to mitigate shortfalls under those stress scenarios directly. A reverse stress test is performed annually in order to challenge our business model to determine the severity of scenarios that would cause us to become unviable. Such a reverse stress test is based on a hypothetical macroeconomic scenario or idiosyncratic event and takes into account severe impacts of major risks on our results. Comparing the hypothetical macroeconomic scenario that would be necessary to result in our non-viability according to the reverse stress, to the current economic environment, we consider that the probability of occurrence of such a hypothetical macroeconomic scenario is extremely low. Given the extremely low probability of the reverse stress test scenario, we do not believe that our business continuity is at risk.
Stress Testing Framework of Deutsche Bank Group
Risk Reporting and Measurement Systems
Our risk data systems support regulatory reporting and external disclosures, as well as internal management reporting for credit, market, operational (including legal risk), business, reputational, liquidity risk, model risk and compliance risk.The risk infrastructure incorporates the relevant legal entities and business divisions and provides the basis for report-ing on risk positions, capital adequacy and limit utilization to the relevant functions on a regular and ad-hoc basis. Es-tablished units within Finance and Risk assume responsibility for measurement, analysis and reporting of risk while promoting sufficient quality and integrity of risk-related data. Our risk management systems are reviewed by Group Audit following a risk-based audit approach.
The main reports on risk and capital management that are used to provide the central governance bodies with informa-tion relating to Group risk exposures are the following:
‒ Our Risk and Capital Profile is presented monthly to the CaR and the Management Board and is subsequently submitted to the Risk Committee of the Supervisory Board for information. It comprises an overview of the current risk, capital and liquidity status of the Group, also incorporating information on regulatory capital and internal capital adequacy.
‒ An overview of our capital, liquidity and funding is presented to the CaR by Group Capital Management and the Group Treasurer every month. It comprises information on key metrics including CRR/CRD 4 Common Equity Tier 1 capital and the CRR/CRD 4 leverage ratio, as well as an overview of our current funding and liquidity status, the liquidity stress test results and contingency measures.
‒ Results of the group-wide macroeconomic stress tests that are performed twice per quarter and/or more frequently are reported to and discussed at the PRC.
DB Research:Scenario definition
Research defines scenario with several risk parameters such as FX, interest rates,
growth, etc.
Risk Units:Parameter translation
Scenario parameters are translated into risk-specific drivers
Risk Units:Calculation engines
Teams run risk-specific calculation engines to arrive at
stressed results
Central Function:Calculation of
aggregated impact
Calculation of aggregated stress impact based on capital plan for
several metrics such as RWA, CET1, etc.
Central Function:Comparison against
risk appetite
Stress results are compared against risk appetite and in case of breaches mitigation actions
are considered
Senior Management:
Actions
Strategic decision on adequate risk
mitigation or reduction from a catalogue of pre-
determined alternatives
Senior Management:No action required
Finance:Capital plan

95 Deutsche Bank Operating and Financial Review – 30 Employees – 230 Annual Report 2015 Outlook – 70 Internal Control over Financial Reporting – 235 Risk and Opportunities – 77 Information pursuant to Section – 315 (4)
Risk Report – 79 of the German Commercial Code and
► Risk and Capital Framework Explanatory Report – 239 Compensation Report – 188 Corporate Responsibility – 228
The above reports are complemented by a suite of other standard and ad-hoc management reports of Risk and Finance, which are presented to several different senior committees responsible for risk and capital management at Group level.
Recovery and Resolution Planning
The 2007/2008 financial crisis exposed banks and the broader financial market to unprecedented pressures. These pressures led to certain banks seeking significant support from their governments and to large scale interventions by central banks. The crisis also forced many financial institutions to significantly restructure their businesses and strengthen their capital, liquidity and funding bases. This crisis revealed that many financial institutions were insuffi-ciently prepared for a fast-evolving systemic crisis and thus were unable to act and respond in a way that would avoid potential failure and prevent material adverse impacts on the financial system and ultimately the economy and society.
In response to the crisis, the Financial Stability Board (FSB) has published a list of global systemically important banks (G-SIBs) and has advised its member institutions to mandate and to support the development of recovery and resolu-tion plans within G-SIBs. Corresponding legislation has been enacted or proposed, as the case may be, in several jurisdictions, including the member states of the European Union (EU), Germany, UK and the U.S. As we have been identified as one of the G-SIBs, we have developed the Group’s recovery plan (‘Recovery Plan’) and submitted this to our relevant regulators. The Recovery Plan is updated at least annually to reflect changes in the business and the regulatory requirements.
The Recovery Plan prepares us to restore our financial strength and viability during an extreme stress situation. The Recovery Plan’s more specific purpose is to outline how we can respond to a financial stress situation that would sig-nificantly impact our capital or liquidity position. Therefore it lays out a set of defined actions aimed to protect us, our customers and the markets and prevent a potentially more costly resolution event. In line with regulatory guidance, we have identified a wide range of recovery measures that will mitigate different types of stress scenarios. These scenar-ios originate from both idiosyncratic and market-wide events, which would have led to severe capital and liquidity im-pacts as well as impacts on our performance and balance sheet. The Recovery Plan, including its corresponding policy, is intended to enable us to effectively monitor, escalate, plan and execute recovery actions in the event of a crisis situation.
The Recovery Plan’s key objective is to help us to recover from a crisis situation by selecting appropriate recovery actions to stay sufficiently capitalised and funded. This plan extends beyond our risk management framework and can be executed in extreme scenarios where crises may threaten our survival (i.e., substantial loss of capital or inability to access market liquidity when needed). The Management Board determines when the Recovery Plan has to be invoked and which recovery measures are deemed appropriate.
The Recovery Plan is designed to cover multiple regulations including those applicable to us in the EU under the Bank Recovery and Resolution Directive (as implemented in Germany) and the Single Resolution Mechanism Regulation as well as other key jurisdictions. Furthermore, the plan incorporates feedback from extensive discussions with our Super-visory authority and the Crisis Management Group (CMG), formed by key home and host authorities. We report to this CMG with the objective of enhancing preparedness for, and facilitating the management and resolution of a cross-border financial crisis affecting us. This CMG is also intended to cooperate closely with authorities in other jurisdictions where we have a systemic presence.
We are also working closely with our resolution authority to create a Group Resolution Plan for Deutsche Bank as set out in the Bank Recovery and Resolution Directive, the Single Resolution Mechanism Regulation and the German Recovery and Resolution Act (“Sanierungs- und Abwicklungsgesetz” or “SAG”).
In addition, Title I of the Dodd-Frank Wall Street Reform and Consumer Protection Act and the implementing regulations issued by the Board of Governors of the Federal Reserve System and the Federal Deposit Insurance Corporation (“FDIC”) require each bank holding company with assets of U.S.$ 50 billion or more, including Deutsche Bank AG, to prepare and submit annually a plan for the orderly resolution of subsidiaries and operations in the event of future material financial distress or failure (the “Title I US Resolution Plan”). For foreign-based covered companies such

Deutsche Bank 1 – Management Report 96Annual Report 2015
as us, the Title I US Resolution Plan only relates to subsidiaries, branches, agencies and businesses that are domiciled in or conducted in whole or in material part in the United States. In addition to the Title I US Resolution Plan, in 2014, Deutsche Bank Trust Company Americas (“DBTCA”), one of our insured depository institutions (“IDIs”) in the United States, became subject to the FDIC’s final rule requiring IDIs with total assets of U.S.$ 50 billion or more to submit periodically to the FDIC a plan for resolution in the event of failure (the “IDI Plan” and, together with the Title I US Resolution Plan, the “US Resolution Plan”) under the Federal Deposit Insurance Act (the “IDI Rule”). In 2014, we expanded our Title I US Resolution Plan to also be responsive to the IDI Rule requirements. In 2015, DBTCA prepared and submitted a separate IDI Plan.
The core elements of the US Resolution Plan are Material Entities (“MEs”), Core Business Lines (“CBLs”), Critical Operations (“COs”) and, for purposes of the IDI Plan, Critical Services. The US Resolution Plan lays out the resolution strategy for each ME, defined as those entities significant to the activities of a CO or CBL and demonstrates how each ME, CBL and CO, as applicable, can be resolved in a rapid and orderly manner and without systemic impact on U.S. financial stability. The US Resolution Plan also discusses the strategy for continuing Critical Services in resolution. Key factors addressed in the US Resolution Plan include how to ensure:
‒ Continued access to services from other U.S. and non-U.S. legal entities as well as from third parties such as payment servicers, exchanges and key vendors;
‒ Availability of funding from both external and internal sources; ‒ Retention of key employees during resolution; and ‒ Efficient and coordinated close-out of cross-border contracts.
The US Resolution Plan is drafted in coordination with the U.S. businesses and infrastructure groups so that it accurately reflects the business, critical infrastructure and key interconnections.
Risk and Capital Management
Capital Management
Our Treasury function manages solvency, capital adequacy and leverage ratios at Group level and locally in each region. Treasury implements our capital strategy, which itself is developed by the Capital and Risk Committee and approved by the Management Board, including issuance and repurchase of shares and capital instruments, hedging of capital ratios against foreign exchange swings, limit setting for key financial resources, design of book equity allocation, and regional capital planning. We are fully committed to maintaining our sound capitalization both from an economic and regulatory perspective. We continously monitor and adjust our overall capital demand and supply in an effort to achieve the optimal balance of the economic and regulatory considerations at all times and from all perspectives. These perspectives include book equity based on IFRS accounting standards, regulatory and economic capital as well as specific capital requirements from rating agencies.
Treasury manages the issuance and repurchase of capital instruments, namely Common Equity Tier 1, Additional Tier 1 and Tier 2 capital instruments. Treasury constantly monitors the market for liability management trades. Such trades represent a countercyclical opportunity to create Common Equity Tier 1 capital by buying back our issuances below par.
Our core currencies are Euro, US Dollar and Pound Sterling. Treasury manages the sensitivity of our capital ratios against swings in core currencies. The capital invested into our foreign subsidiaries and branches in the other non-core currencies is largely hedged against foreign exchange swings. Treasury determines which currencies are to be hedged, develops suitable hedging strategies in close cooperation with Risk Management and finally executes these hedges.
97 Deutsche Bank Operating and Financial Review – 30 Employees – 230 Annual Report 2015 Outlook – 70 Internal Control over Financial Reporting – 235 Risk and Opportunities – 77 Information pursuant to Section – 315 (4)
Risk Report – 79 of the German Commercial Code and
► Risk and Capital Management Explanatory Report – 239 Compensation Report – 188 Corporate Responsibility – 228
Resource Limit Setting
Key financial resources are influenced through following governance processes and incentives.
Target resource capacities are reviewed in our annual strategic plan in line with our CET 1 and Leverage Ratio ambi-tions. In a quarterly process, the Capital and Risk Committee approves divisional resource limits for Total Capital De-mand and leverage exposure that are based on the strategic plan however account for market conditions and the short-term outlook. The limits are enforced through a close monitoring process and an excess mechanism.
During the reporting period, we have extended our methodology of internal capital allocation framework to acknowl-edge the growing importance of leverage requirements for the bank. Regulatory requirements are driven by the higher of CET 1 ratio (solvency) and leverage ratio (leverage) requirements. In terms of order for the internal capital allocation, solvency-based allocation comes first, then incremental leverage-driven allocation. The new methodology utilises a two step approach: Allocation of Average Active Equity solvency-based first until the externally communicated target of a 12.5 % CET 1 solvency ratio (CRR/CRD 4 calculated on a fully loaded basis) is met, and then incremental leverage capital allocation based on pro-rata leverage exposure of divisions to satisfy the externally communicated target of a 4.5 % leverage ratio (CRR/CRD 4 calculated on a fully loaded basis). The allocation will be reviewed if the externally communicated targets for the CET 1 and leverage ratio should be adjusted. The new methodology also applies differ-ent rates for the cost of equity for each of the business segments, reflecting in a more differentiated way the earnings volatility of the individual business models. This enables improved performance management and investment decisions.
Regional capital plans covering the capital needs of our branches and subsidiaries across the globe are prepared on an annual basis and presented to the Group Investment Committee. Most of our subsidiaries are subject to legal and regulatory capital requirements. In developing, implementing and testing our capital and liquidity, we fully take such legal and regulatory requirements into account.
Further, Treasury is represented on the Investment Committee of the largest Deutsche Bank pension fund which sets the investment guidelines. This representation is intended to ensure that pension assets are aligned with pension liabili-ties, thus protecting our capital base.
Risk Identification and Assessment
We face a variety of risks as a result of our business activities, these risks include credit risk, market risk, business risk,liquidity risk, operational risk, compliance risk, reputational risk and model risk as described in the following sections below. Our risk identification and assessment processes leverage intelligence across organisational levels and utilise existing information whenever possible. Operating processes are in place across the organisation to capture relevant measures and indicators. The core aim of all processes is to provide adequate transparency and understanding of the existing and emerging risk issues, and to ensure a holistic cross-risk perspective. We update the risk inventory at least once a year or at other times if needed, by running a risk identification and materiality assessment process in line with MaRisk.
To align with the Three Lines of Defense taxonomy, we categorize our material risks into financial risks and non-financial risks effective January 1, 2016. Financial risks comprise credit risk (including counterparty, country, product and industry risks), market risk (including non-trading, trading and traded default risk), liquidity risk, and business risk. Non-financial risks comprise operational risks and reputational risks with compliance risk, legal risk, model risk and information security risk captured in our operational risk framework. The aim is to have a better control environment over our material risks.

Deutsche Bank 1 – Management Report 98Annual Report 2015
Credit risk, market risk and operational risk attract regulatory capital. As part of our internal capital adequacy assess-ment process, we calculate the amount of economic capital for credit, market, operational and business risk to cover risks generated from our business activities taking into account diversification effects across those risk types. Further-more, our economic capital framework implicitly covers additional risks, e.g. reputational risk and refinancing risk, for which no dedicated economic capital models exist. We exclude liquidity risk from economic capital and govern this in a dedicated liquidity risk management.
Credit Risk Management
Credit Risk Framework
Credit risk arises from all transactions where actual, contingent or potential claims against any counterparty, borrower, obligor or issuer (which we refer to collectively as “counterparties”) exist, including those claims that we plan to distrib-ute. These transactions are typically part of our traditional nontrading lending activities (such as loans and contingent liabilities), traded bonds and debt securities available for sale or our direct trading activity with clients (such as OTC derivatives like foreign exchange forwards and Forward Rate Agreements). Carrying values of equity investments are also disclosed in our Credit Risk section. We manage the respective positions within our market risk and credit risk frameworks.
Based on the annual risk identification and materiality assessment, credit risk contains four material categories, namely default risk, industry risk, country risk, and product risk.
‒ Default risk, the most significant element of credit risk, is the risk that counterparties fail to meet contractual obliga-tions in relation to the claims described above;
‒ Industry risk is the risk of adverse developments in the operating environment for a specific industry segment lead-ing to deterioration in the financial profile of counterparties operating in that segment and resulting in increased credit risk across this portfolio of counterparties;
‒ Country risk is the risk that we may experience unexpected default or settlement risk and subsequent losses, in a given country, due to a range of macro-economic or social events primarily affecting counterparties in that jurisdic-tion including: a material deterioration of economic conditions, political and social upheaval, nationalization and ex-propriation of assets, government repudiation of indebtedness, or disruptive currency depreciation or devaluation. Country risk also includes transfer risk which arises when debtors are unable to meet their obligations owing to an inability to transfer assets to non-residents due to direct sovereign intervention; and
‒ Product Risk captures product-specific credit risk of transactions that could arise with respect to specific borrowers. These take into account the likelihood of having an actual credit exposure at the time of a default, recovery expecta-tions and the tenor of exposure. This category also includes “Settlement risk”; the risk that the settlement or clear-ance of a transaction may fail and arises whenever the exchange of cash, securities and/or other assets is not simultaneous leaving us exposed to a potential loss should the counterparty default.
We measure, manage/mitigate and report/monitor our credit risk using the following philosophy and principles:
‒ Our credit risk management function is independent from our business divisions and in each of our divisions, credit decision standards, processes and principles are consistently applied.
‒ A key principle of credit risk management is client credit due diligence. Our client selection is achieved in collabora-tion with our business division counterparts who stand as a first line of defence.
‒ We aim to prevent undue concentration and tail-risks (large unexpected losses) by maintaining a diversified credit portfolio. Client, industry, country and product-specific concentrations are assessed and managed against our risk appetite.
‒ We maintain underwriting standards aiming to avoid large directional credit risk on a counterparty and portfolio level. In this regard we assume unsecured cash positions and actively use hedging for risk mitigation purposes. Addition-ally, we strive to secure our derivative portfolio through collateral agreements and may additionally hedge concen-tration risks to further mitigate credit risks from underlying market movements.
99 Deutsche Bank Operating and Financial Review – 30 Employees – 230 Annual Report 2015 Outlook – 70 Internal Control over Financial Reporting – 235 Risk and Opportunities – 77 Information pursuant to Section – 315 (4)
Risk Report – 79 of the German Commercial Code and
► Risk and Capital Management Explanatory Report – 239 Compensation Report – 188 Corporate Responsibility – 228
‒ Every new credit facility and every extension or material change of an existing credit facility (such as its tenor, col-lateral structure or major covenants) to any counterparty requires credit approval at the appropriate authority level. We assign credit approval authorities to individuals according to their qualifications, experience and training, and we review these periodically.
‒ We measure and consolidate all our credit exposures to each obligor across our consolidated Group on a global basis, in line with regulatory requirements.
‒ We manage credit exposures on the basis of the “one obligor principle”, under which all facilities to a group of bor-rowers which are linked to each other (i.e., by one entity holding a majority of the voting rights or capital of another) are consolidated under one group.
‒ We have established within Credit Risk Management – where appropriate – specialized teams for deriving internal client ratings, analyzing and approving transactions, monitoring the portfolio or covering workout clients. The credit coverage for assets transferred to the NCOU utilizes the expertise of our core credit organization.
Measuring Credit Risk
Credit risk is measured by credit rating, regulatory and internal capital demand and key credit metrics mentioned below.
The credit rating is an essential part of the Bank’s underwriting and credit process and builds the basis for risk appetite determination on a counterparty and portfolio level, credit decision and transaction pricing as well the determination of credit risk regulatory capital. Each borrower must be rated and each rating has to be reviewed at least annually. Ongo-ing monitoring of counterparties helps keep ratings up-to-date. There must be no credit limit without a credit rating. For each credit rating the appropriate rating approach has to be applied and the derived credit rating has to be established in the relevant systems. Different rating approaches have been established to best reflect the specific characteristics of exposure classes, including central governments and central banks, institutions, corporates and retail.
Counterparties in our non-homogenous portfolios are rated by our independent Credit Risk Management function. Country risk related ratings are provided by dbResearch.
Our rating analysis is based on a combination of qualitative and quantitative factors. When rating a counterparty we apply in-house assessment methodologies, scorecards and our 21-grade rating scale for evaluating the credit-worthiness of our counterparties.
All of our rating methodologies, excluding Postbank, have to be approved by the Capital Methodology Committee (“CMC”), a sub-committee of the Regulatory Capital Committee, before the methodologies are used for credit decisions and capital calculation for the first time or before they are significantly changed. Regulatory approval may be required in addition. The methodology validation is performed independently of model development by Global Model Validation and Governance. The results of the regular validation processes as stipulated by internal policies have to be brought to the attention of the CMC, even if the validation results do not lead to a change. The validation plan for rating method-ologies is presented to CMC at the beginning of the calendar year and a status update is given on a quarterly basis.
For Postbank, responsibility for implementation and monitoring of internal rating systems effectiveness rests with Post-bank’s Risk Analytics unit and Postbank’s validation committee, chaired by Postbank’s Head of Credit Risk Controlling. All rating systems are subject to approval by Postbank’s Bank Risk Committee chaired by the Chief Risk Officer. Effec-tiveness of rating systems and rating results are reported to the Postbank Management Board on a regular basis. Joint governance is ensured via a cross committee membership of Deutsche Bank senior managers joining Postbank com-mittees and vice versa.
Besides the credit rating the key credit risk metric we apply for managing our credit portfolio, including transaction approval and the setting of risk appetite, are internal limits and credit exposures under these limits. Credit limits set forth maximum credit exposures we are willing to assume over specified periods. In determining the credit limit for a counterparty, we consider the counterparty’s credit quality by reference to our internal credit rating. Credit limits and credit exposures are both measured on a gross and net basis where net is derived by deducting hedges and certain

Deutsche Bank 1 – Management Report 100Annual Report 2015
collateral from respective gross figures. For derivatives, we look at current market values and the potential future expo-sure over the lifetime of a transaction. We generally also take into consideration the Risk-Return characteristics of individual transactions and portfolios. Risk-Return metrics explain the development of client revenues as well as capital consumption. In this regard we also look at the client revenues with respect to the balance sheet consumption.
We measure the risk-weighted assets to determine the regulatory capital demand for credit risk using advanced, foun-dation and standard approaches of which advanced and foundation are approved by our regulator.
The advanced Internal Ratings Based Approach (“IRBA”) is the most sophisticated approach available under the regu-latory framework for credit risk and allows us to make use of our internal credit rating methodologies as well as internal estimates of specific other risk parameters. These methods and parameters represent long-used key components of the internal risk measurement and management process supporting the credit approval process, the economic capital and expected loss calculation and the internal monitoring and reporting of credit risk. The relevant parameters include the probability of default (“PD”), the loss given default (“LGD”) and the maturity (“M”) driving the regulatory risk-weight and the credit conversion factor (“CCF”) as part of the regulatory exposure at default (“EAD”) estimation. For the major-ity of derivative counterparty exposures as well as securities financing transactions (“SFT”), we make use of the inter-nal model method (“IMM”) in accordance with CRR and SolvV to calculate EAD. For most of our internal rating systems more than seven years of historical information is available to assess these parameters. Our internal rating methodolo-gies reflect a point-in-time rather than a through-the-cycle rating.
We apply the foundation IRBA to the majority of our remaining foundation IRBA eligible credit portfolios at Postbank to the extent these have not been newly assigned to the advanced IRBA during 2015. The foundation IRBA is an ap-proach available under the regulatory framework for credit risk allowing institutions to make use of their internal rating methodologies while using pre-defined regulatory values for all other risk parameters. Parameters subject to internal estimates include the probability of default (“PD”) while the loss given default (“LGD”) and the credit conversion factor (“CCF”) are defined in the regulatory framework.
We apply the standardized approach to a subset of our credit risk exposures. The standardized approach measures credit risk either pursuant to fixed risk weights, which are predefined by the regulator, or through the application of external ratings. We assign certain credit exposures permanently to the standardized approach in accordance with Article 150 CRR. These are predominantly exposures to the Federal Republic of Germany and other German public sector entities as well as exposures to central governments of other European Member States that meet the required conditions. These exposures make up more than half of the exposures carried in the standardized approach and re-ceive predominantly a risk weight of zero percent. For internal purposes, however, these exposures are subject to an internal credit assessment and fully integrated in the risk management and economic capital processes.
In addition to the above described regulatory capital demand, we determine the internal capital demand for credit risk via an economic capital model.
We calculate economic capital for the default risk, country risk and settlement risk as elements of credit risk. In line with our economic capital framework, economic capital for credit risk is set at a level to absorb with a probability of 99.98 % very severe aggregate unexpected losses within one year. Our economic capital for credit risk is derived from the loss distribution of a portfolio via Monte Carlo Simulation of correlated rating migrations. The loss distribution is modeled in two steps. First, individual credit exposures are specified based on parameters for the probability of default, exposure at default and loss given default. In a second step, the probability of joint defaults is modeled through the introduction of economic factors, which correspond to geographic regions and industries. The simulation of portfolio losses is then performed by an internally developed model, which takes rating migration and maturity effects into account. Effects due to wrong-way derivatives risk (i.e., the credit exposure of a derivative in the default case is higher than in nondefault scenarios) are modeled by applying our own alpha factor when deriving the exposure at default for derivatives and securities financing transactions under the CRR. The alpha factor is identical with the one used for the risk-weighted assets calculation, yet subject to a lower floor of 1.0. For December 31, 2015 the alpha factor was calibrated to 1.13. We allocate expected losses and economic capital derived from loss distributions down to transaction level to enable management on transaction, customer and business level.

101 Deutsche Bank Operating and Financial Review – 30 Employees – 230 Annual Report 2015 Outlook – 70 Internal Control over Financial Reporting – 235 Risk and Opportunities – 77 Information pursuant to Section – 315 (4)
Risk Report – 79 of the German Commercial Code and
► Risk and Capital Management Explanatory Report – 239 Compensation Report – 188 Corporate Responsibility – 228
Managing and Mitigation of Credit Risk
Managing Credit Risk on Counterparty Level
Credit-related counterparties are principally allocated to credit officers within credit teams which are aligned to types of counterparty (such as financial institutions, corporates or private individuals) or economic area (i.e., emerging markets) and dedicated rating analyst teams. The individual credit officers have the relevant expertise and experience to man-age the credit risks associated with these counterparties and their associated credit related transactions. For retail clients credit decision making and credit monitoring is highly automated for efficiency reasons. Credit Risk Manage-ment has full oversight of the respective processes and tools used in the retail credit process. It is the responsibility of each credit officer to undertake ongoing credit monitoring for their allocated portfolio of counterparties. We also have procedures in place intended to identify at an early stage credit exposures for which there may be an increased risk of loss.
In instances where we have identified counterparties where there is a concern that the credit quality has deteriorated or appears likely to deteriorate to the point where they present a heightened risk of loss in default, the respective expo-sure is generally placed on a “watch list”. We aim to identify counterparties that, on the basis of the application of our risk management tools, demonstrate the likelihood of problems well in advance in order to effectively manage the credit exposure and maximize the recovery. The objective of this early warning system is to address potential problems while adequate options for action are still available. This early risk detection is a tenet of our credit culture and is intended to ensure that greater attention is paid to such exposures.
Credit limits are established by the Credit Risk Management function via the execution of assigned credit authorities. This also applies to settlement risk that must fall within limits pre-approved by CRM considering risk appetite and in a manner that reflects expected settlement patterns for the subject counterparty. Credit approvals are documented by the signing of the credit report by the respective credit authority holders and retained for future reference.
Credit authority is generally assigned to individuals as personal credit authority according to the individual’s profes-sional qualification and experience. All assigned credit authorities are reviewed on a periodic basis to help ensure that they are adequate to the individual performance of the authority holder.
Where an individual’s personal authority is insufficient to establish required credit limits, the transaction is referred to a higher credit authority holder or where necessary to an appropriate credit committee such as the Underwriting Commit-tee. Where personal and committee authorities are insufficient to establish appropriate limits, the case is referred to the Management Board for approval.
Mitigation of Credit Risk on Counterparty Level
In addition to determining counterparty credit quality and our risk appetite, we also use various credit risk mitigation techniques to optimize credit exposure and reduce potential credit losses. Credit risk mitigants are applied in the follow-ing forms:
‒ Comprehensive and enforceable credit documentation with adequate terms and conditions.
‒ Collateral held as security to reduce losses by increasing the recovery of obligations.
‒ Risk transfers, which shift the probability of default risk of an obligor to a third party including hedging executed by our Credit Portfolio Strategies Group.
‒ Netting and collateral arrangements which reduce the credit exposure from derivatives and repo- and repo-style transactions.

Deutsche Bank 1 – Management Report 102Annual Report 2015
Collateral We regularly agree on collateral to be received from or to be provided to customers in contracts that are subject to credit risk. Collateral is security in the form of an asset or third-party obligation that serves to mitigate the inherent riskof credit loss in an exposure, by either substituting the borrower default risk or improving recoveries in the event of a default. While collateral can be an alternative source of repayment, it generally does not replace the necessity of high quality underwriting standards and a thorough assessment of the debt service ability of the borrower
We segregate collateral received into the following two types:
‒ Financial and other collateral, which enables us to recover all or part of the outstanding exposure by liquidating the collateral asset provided, in cases where the borrower is unable or unwilling to fulfil its primary obligations. Cash col-lateral, securities (equity, bonds), collateral assignments of other claims or inventory, equipment (i.e., plant, machin-ery and aircraft) and real estate typically fall into this category.
‒ Guarantee collateral, which complements the borrower’s ability to fulfil its obligation under the legal contract and as such is provided by third parties. Letters of credit, insurance contracts, export credit insurance, guarantees, credit derivatives and risk participations typically fall into this category.
Our processes seek to ensure that the collateral we accept for risk mitigation purposes is of high quality. This includes seeking to have in place legally effective and enforceable documentation for realizable and measureable collateral assets which are evaluated regularly by dedicated teams. The assessment of the suitability of collateral for a specific transaction is part of the credit decision and must be undertaken in a conservative way, including collateral haircuts that are applied. We have collateral type specific haircuts in place which are regularly reviewed and approved. In this regard, we strive to avoid “wrong-way” risk characteristics where the borrower’s counterparty risk is positively correlated with the risk of deterioration in the collateral value. For guarantee collateral, the process for the analysis of the guarantor’s creditworthiness is aligned to the credit assessment process for borrowers.
Risk Transfers Risk transfers to third parties form a key part of our overall risk management process and are executed in various forms, including outright sales, single name and portfolio hedging, and securitizations. Risk transfers are conducted by the respective business units and by our Credit Portfolio Strategies Group (CPSG), in accordance with specifically approved mandates.
CPSG manages the residual credit risk of loans and lending-related commitments of the institutional and corporate credit portfolio; the leveraged portfolio and the medium-sized German companies’ portfolio within our Corporate Divi-sions of CB&S and GTB.
Acting as a central pricing reference, CPSG provides the respective CB&S and GTB Division businesses with an ob-served or derived capital market rate for loan applications; however, the decision of whether or not the business can enter into the credit risk remains exclusively with Credit Risk Management.
CPSG is concentrating on two primary objectives within the credit risk framework to enhance risk management disci-pline, improve returns and use capital more efficiently:
‒ to reduce single-name credit risk concentrations within the credit portfolio and
‒ to manage credit exposures by utilizing techniques including loan sales, securitization via collateralized loan obliga-tions, default insurance coverage and single-name and portfolio credit default swaps.
103 Deutsche Bank Operating and Financial Review – 30 Employees – 230 Annual Report 2015 Outlook – 70 Internal Control over Financial Reporting – 235 Risk and Opportunities – 77 Information pursuant to Section – 315 (4)
Risk Report – 79 of the German Commercial Code and
► Risk and Capital Management Explanatory Report – 239 Compensation Report – 188 Corporate Responsibility – 228
Netting and Collateral Arrangements for Derivatives and Securities Financing Transactions Netting is applicable to both exchange traded derivatives and OTC derivatives. Netting is also applied to securities financing transactions as far as documentation, structure and nature of the risk mitigation allow netting with the underly-ing credit risk.
All exchange traded derivatives are cleared through central counterparties (“CCPs”), which interpose themselves be-tween the trading entities by becoming the counterparty to each of the entities. Where available and to the extent agreed with our counterparties, we also use CCP clearing for our OTC derivative transactions. The Dodd-Frank Wall Street Reform and Consumer Protection Act (“DFA”) introduced mandatory CCP clearing for certain standardized OTC derivative transactions in 2013. The European Regulation (EU) No 648/2012 on OTC Derivatives, Central Counterpar-ties and Trade Repositories (“EMIR”) will introduce mandatory CCP clearing for standardized OTC derivatives transac-tions; mandatory CCP clearing for certain interest rate derivatives will start on 21 June 2016. The rules and regulations of CCPs usually provide for the bilateral set off of all amounts payable on the same day and in the same currency (“payment netting”) and thereby reducing our settlement risk. Depending on the business model applied by the CCP, this payment netting applies either to all of our derivatives cleared by the CCP or at least to those that form part of the same class of derivatives. Many CCP rules and regulations also provide for the termination, close-out and netting of all cleared transactions upon the CCP’s default (“close-out netting”), which reduced our credit risk. In our risk measure-ment and risk assessment processes we apply close-out netting only to the extent we have satisfied ourselves of the legal validity and enforceability of the relevant CCP’s close-out netting provisions.
In order to reduce the credit risk resulting from OTC derivative transactions, where CCP clearing is not available, we regularly seek the execution of standard master agreements (such as master agreements for derivatives published by the International Swaps and Derivatives Association, Inc. (ISDA) or the German Master Agreement for Financial De-rivative Transactions) with our counterparts. A master agreement allows for the close-out netting of rights and obliga-tions arising under derivative transactions that have been entered into under such a master agreement upon the counterparty’s default, resulting in a single net claim owed by or to the counterparty. For parts of the derivatives busi-ness (i.e., foreign exchange transactions) we also enter into master agreements under which payment netting applies in respect to transactions covered by such master agreements, reducing our settlement risk. In our risk measurement and risk assessment processes we apply close-out netting only to the extent we have satisfied ourselves of the legal validity and enforceability of the master agreement in all relevant jurisdictions.
Also, we enter into credit support annexes (“CSA”) to master agreements in order to further reduce our derivatives-related credit risk. These annexes generally provide risk mitigation through periodic, usually daily, margining of the covered exposure. The CSAs also provide for the right to terminate the related derivative transactions upon the coun-terparty’s failure to honour a margin call. As with netting, when we believe the annex is enforceable, we reflect this in our exposure measurement.
Certain CSAs to master agreements provide for rating dependent triggers, where additional collateral must be pledged if a party’s rating is downgraded. We also enter into master agreements that provide for an additional termination event upon a party’s rating downgrade. These downgrading provisions in CSAs and master agreements usually apply to both parties but may also apply to us only. We analyze and monitor our potential contingent payment obligations resulting from a rating downgrade in our stress testing approach for liquidity risk on an ongoing basis. For an assessment of the quantitative impact of a downgrading of our credit rating please refer to table “Stress Testing Results” in the section “Liquidity Risk”.
Concentrations within Credit Risk Mitigation Concentrations within credit risk mitigations taken may occur if a number of guarantors and credit derivative providers with similar economic characteristics are engaged in comparable activities with changes in economic or industry condi-tions affecting their ability to meet contractual obligations. We use a range of quantitative tools and metrics to monitor our credit risk mitigating activities. These also include monitoring of potential concentrations within collateral types supported by dedicated stress tests.
For more qualitative and quantitative details in relation to the application of credit risk mitigation and potential concen-tration effects please refer to the section “Maximum Exposure to Credit Risk”.
Deutsche Bank 1 – Management Report 104Annual Report 2015
Managing Credit Risk on Portfolio Level
On a portfolio level, significant concentrations of credit risk could result from having material exposures to a number of counterparties with similar economic characteristics, or who are engaged in comparable activities, where these similari-ties may cause their ability to meet contractual obligations to be affected in the same manner by changes in economic or industry conditions.
Our portfolio management framework supports a comprehensive assessment of concentrations within our credit risk portfolio in order to keep concentrations within acceptable levels.
Industry Risk Management To manage industry risk, we have grouped our corporate and financial institutions counterparties into various industry sub-portfolios. For each of these sub-portfolios an “Industry Batch report” is prepared usually on an annual basis. This report highlights industry developments and risks to our credit portfolio, reviews concentration risks, analyses the risk/reward profile of the portfolio and incorporates an economic downside stress test. Finally, this analysis is used to define the credit strategies for the portfolio in question.
The Industry Batch reports are presented to the CRM Portfolio Committee, a sub-committee of the Portfolio Risk Committee, which is a sub-committee of our Risk Executive Committee and Capital and Risk Committee, and are submitted afterwards to the Management Board. In accordance with an agreed schedule, a select number of Industry Batch reports are also submitted to the Risk Committee of the Supervisory Board. In addition to these Industry Batch reports, the development of the industry sub-portfolios is regularly monitored during the year and is compared with the approved sub-portfolio strategies. Regular overviews are prepared for the CRM Portfolio Committee to discuss recent developments and to agree on actions where necessary.
Country Risk Management Avoiding undue concentrations from a regional perspective is also an integral part of our credit risk management framework. In order to achieve this, country risk limits are applied to Emerging Markets as well as selected Developed Markets countries (based on internal country risk ratings). Emerging Markets are grouped into regions and for each region, as well as for the Higher Risk Developed Markets, a “Country Batch report” is prepared, usually on an annual basis. These reports assess key macroeconomic developments and outlook, review portfolio composition and concen-tration risks and analyse the risk/reward profile of the portfolio. Based on this, limits and strategies are set for countries and, where relevant, for the region as a whole. Country risk limits are approved by either our Management Board or by our Portfolio Risk Committee, pursuant to delegated authority, and by the Postbank Management Board for respective portfolios.
In our Country Limit framework, limits are established for counterparty credit risk exposures in a given country to man-age the aggregated credit risk subject to country-specific economic and political events. These limits include exposures to entities incorporated locally as well as subsidiaries of foreign multinational corporations. Separate Transfer Risk limits are established which apply to any cross-border exposures (credit and trading) with our clients in above countries. Also, gap risk limits are set to control the risk of loss due to intra-country wrong-way risk exposure.
Beyond credit risk, our Country Risk Framework comprises Market Risk in trading positions in emerging markets and is set based on the P&L impact of potential stressed market events on these positions. Furthermore we take in consideration treasury risk comprising capital positions and exposure of Deutsche Bank entities in above coun-tries (Funding, Margin or Guarantees) which are subject to limits given the transfer risk inherent in these cross-border positions.
105 Deutsche Bank Operating and Financial Review – 30 Employees – 230 Annual Report 2015 Outlook – 70 Internal Control over Financial Reporting – 235 Risk and Opportunities – 77 Information pursuant to Section – 315 (4)
Risk Report – 79 of the German Commercial Code and ► Risk and Capital Management Explanatory Report – 239
Compensation Report – 188 Corporate Responsibility – 228
Our country risk ratings represent a key tool in our management of country risk. They are established by the independ-ent dbResearch function within Deutsche Bank and include:
‒ Sovereign rating: A measure of the probability of the sovereign defaulting on its foreign or local currency obligations. ‒ Transfer risk rating: A measure of the probability of a “transfer risk event”, i.e., the risk that an otherwise solvent
debtor is unable to meet its obligations due to inability to obtain foreign currency or to transfer assets as a result of direct sovereign intervention.
‒ Event risk rating: A measure of the probability of major disruptions in the market risk factors relating to a country (interest rates, credit spreads, etc.). Event risks are measured as part of our event risk scenarios, as described in the section “Market Risk Monitoring” of this report.
All sovereign and transfer risk ratings are reviewed, at least quarterly, by the Portfolio Risk Committee, although more frequent reviews are undertaken when deemed necessary.
Product specific Risk Management Complementary to our counterparty, industry and country risk approach, we focus on product specific risk concentra-tions and selectively set limits where required for risk management purposes. Specific product limits are set in particu-lar if a concentration of transactions of a specific type might lead to significant losses under certain cases. In this respect, correlated losses might result from disruptions of the functioning of financial markets, significant moves in market parameters to which the respective product is sensitive, macroeconomic default scenarios or other factors affecting certain credit products. Specific product limits can either be set with regards to exposure to certain industries or affecting the total credit portfolio. We manage credit related product limits within CB&S and GTB under a uniform framework .Exposures are monitored regularly; re-mediatory action is required in case of an excess of utilization over the approved limit.
A key focus is put on underwriting caps. These caps limit the combined risk for transactions where we underwrite commitments with the intention to sell down or distribute part of the risk to third parties. These commitments include the undertaking to fund bank loans and to provide bridge loans for the issuance of public bonds. The risk is that we may not be successful in the distribution of the facilities, meaning that we would have to hold more of the underlying risk for longer periods of time than originally intended. These underwriting commitments are additionally exposed to market risk in the form of widening credit spreads. We dynamically hedge this credit spread risk to be within the approved market risk limit framework.
Furthermore, in our PBC businesses, we apply product-specific strategies setting our risk appetite for sufficiently ho-mogeneous portfolios where tailored client analysis is secondary, such as the retail portfolios of mortgages, business and consumer finance products. In Wealth Management, target levels are set for global concentrations along products as well as based on the liquidity of the underlying collateral.
Market Risk Management Market Risk Framework
The vast majority of our businesses are subject to market risk, defined as the potential for change in the market value of our trading and invested positions. Risk can arise from changes in interest rates, credit spreads, foreign exchange rates, equity prices, commodity prices and other relevant parameters, such as market volatility and market implied default probabilities.
Deutsche Bank 1 – Management Report 106Annual Report 2015
One of the primary objectives of Market Risk Management, a part of our independent Risk function, is to ensure that our business units do not expose us to unacceptable losses outside of our risk appetite. To achieve this objective, Market Risk Management works closely together with risk takers (“the business units”) and other control and support groups.
We distinguish between three substantially different types of market risk:
‒ Trading market risk arises primarily through the market-making activities of the CB&S Division. This involves taking positions in debt, equity, foreign exchange, other securities and commodities as well as in equivalent derivatives.
‒ Traded default risk arising from defaults and rating migrations relating to trading instruments. ‒ Nontrading market risk arises from market movements, primarily outside the activities of our trading units, in our
banking book and from off-balance sheet items. This includes interest rate risk, credit spread risk, investment risk and foreign exchange risk as well as market risk arising from our pension schemes, guaranteed funds and equity compensation. Nontrading market risk also includes risk from the modeling of client deposits as well as savings and loan products.
Market Risk Management governance is designed and established to promote oversight of all market risks, effective decision-making and timely escalation to senior management.
Market Risk Management defines and implements a framework to systematically identify, assess, monitor and report our market risk. Market risk managers identify market risks through active portfolio analysis and engagement with the business areas.
Market Risk Measurement
We aim to accurately measure all types of market risks by a comprehensive set of risk metrics reflecting economic and regulatory requirements.
In accordance with economic and regulatory requirements, we measure market risks by several internally developed key risk metrics and regulatory defined market risk approaches.
Trading Market Risk
Our primary mechanism to manage trading market risk is the application of our Risk Appetite framework of which the limit framework is a key component. Our Management Board supported by Market Risk Management, sets group-wide value-at-risk, economic capital and portfolio stress testing limits for market risk in the trading book. Market Risk Man-agement allocates this overall appetite to our Corporate Divisions and individual business units within CB&S (i.e., Structured Finance, Equities, etc.) based on established and agreed business plans. We also have business aligned heads within Market Risk Management to establish business limits, by allocating the limit down to individual portfolios or geographical regions.
Value-at-risk, economic capital and Portfolio Stress Testing limits are used for managing all types of market risk at an overall portfolio level. As an additional and complementary tool for managing certain portfolios or risk types, Market Risk Management performs risk analysis and business specific stress testing. Limits are also set on sensitivity and concentration/liquidity, business-level stress testing and event risk scenarios.
Business units are responsible for adhering to the limits against which exposures are monitored and reported. The market risk limits set by Market Risk Management are monitored on a daily, weekly and monthly basis.

107 Deutsche Bank Operating and Financial Review – 30 Employees – 230 Annual Report 2015 Outlook – 70 Internal Control over Financial Reporting – 235 Risk and Opportunities – 77 Information pursuant to Section – 315 (4)
Risk Report – 79 of the German Commercial Code and
► Risk and Capital Management Explanatory Report – 239 Compensation Report – 188 Corporate Responsibility – 228
Internally developed Market Risk Models
Value-at-Risk (VaR)
VaR is a quantitative measure of the potential loss (in value) of Fair Value positions due to market movements that will not be exceeded in a defined period of time and with a defined confidence level.
Our value-at-risk for the trading businesses is based on our own internal model. In October 1998, the German Banking Supervisory Authority (now the BaFin) approved our internal model for calculating the regulatory market risk capital for our general and specific market risks. Since then the model has been continually refined and approval has been main-tained.
We calculate VaR using a 99 % confidence level and a one day holding period. This means we estimate there is a 1 in 100 chance that a mark-to-market loss from our trading positions will be at least as large as the reported VaR. For regulatory purposes, which include the calculation of our capital requirements and risk-weighted assets, the holding period is ten days.
We use one year of historical market data as input to calculate VaR. The calculation employs a Monte Carlo Simulation technique, and we assume that changes in risk factors follow a well-defined distribution, e.g. normal or non-normal (t, skew-t, Skew-Normal). To determine our aggregated VaR, we use observed correlations between the risk factors during this one year period.
Our VaR model is designed to take into account a comprehensive set of risk factors across all asset classes. Key risk factors are swap/government curves, index and issuer-specific credit curves, funding spreads, single equity and index prices, foreign exchange rates, commodity prices as well as their implied volatilities. To help ensure completeness in the risk coverage, second order risk factors, e.g. CDS index vs. constituent basis, money market basis, implied divi-dends, option-adjusted spreads and precious metals lease rates are considered in the VaR calculation.
For each business unit a separate VaR is calculated for each risk type, e.g. interest rate risk, credit spread risk, equity risk, foreign exchange risk and commodity risk. For each risk type this is achieved by deriving the sensitivities to the relevant risk type and then simulating changes in the associated risk drivers. “Diversification effect” reflects the fact that the total VaR on a given day will be lower than the sum of the VaR relating to the individual risk types. Simply adding the VaR figures of the individual risk types to arrive at an aggregate VaR would imply the assumption that the losses in all risk types occur simultaneously.
The model incorporates both linear and, especially for derivatives, nonlinear effects through a combination of sensitiv-ity-based and revaluation approaches on grids.
The VaR measure enables us to apply a consistent measure across all of our trading businesses and products. It allows a comparison of risk in different businesses, and also provides a means of aggregating and netting positions within a portfolio to reflect correlations and offsets between different asset classes. Furthermore, it facilitates compari-sons of our market risk both over time and against our daily trading results.
When using VaR estimates a number of considerations should be taken into account. These include:
‒ The use of historical market data may not be a good indicator of potential future events, particularly those that are extreme in nature. This “backward-looking” limitation can cause VaR to understate risk (as in 2008), but can also cause it to be overstated.
‒ Assumptions concerning the distribution of changes in risk factors, and the correlation between different risk factors, may not hold true, particularly during market events that are extreme in nature. The one day holding period does not fully capture the market risk arising during periods of illiquidity, when positions cannot be closed out or hedged with-in one day.

Deutsche Bank 1 – Management Report 108Annual Report 2015
‒ VaR does not indicate the potential loss beyond the 99th quantile. ‒ Intra-day risk is not reflected in the end of day VaR calculation. ‒ There may be risks in the trading book that are partially or not captured by the VaR model.
We are committed to the ongoing development of our internal risk models, and we allocate substantial resources to reviewing, validating and improving them. Additionally, we have further developed and improved our process of sys-tematically capturing and evaluating risks currently not captured in our value-at-risk model. An assessment is made to determine the level of materiality of these risks and material risks are prioritized for inclusion in our internal model. All risks not in value-at-risk are monitored and assessed on a regular basis through our RNIV framework.
Stressed Value-at-Risk
Stressed Value-at-Risk calculates a stressed value-at-risk measure based on a one year period of significant market stress. We calculate a stressed value-at-risk measure using a 99 % confidence level. The holding period is one day for internal purposes and ten days for regulatory purposes. Our stressed value-at-risk calculation utilizes the same sys-tems, trade information and processes as those used for the calculation of value-at-risk. The only difference is that historical market data from a period of significant financial stress (i.e., characterized by high volatilities) is used as an input for the Monte Carlo Simulation.
The time window selection process for the stressed value-at-risk calculation is based on the identification of a time window characterized by high levels of volatility and extreme movements in the top value-at-risk contributors. The results from these two indicators (volatility and number of outliers) are combined using chosen weights intended to ensure qualitative aspects are also taken into account (i.e., inclusion of key crisis periods).
Incremental Risk Charge
Incremental Risk Charge captures default and credit migration risks for credit-sensitive positions in the trading book. It applies to credit products over a one-year capital horizon at a 99.9 % confidence level, taking into account the liquidity horizons of individual positions or sets of positions. We use a Monte Carlo Simulation for calculating incremental risk charge as the 99.9 % quantile of the portfolio loss distribution and for allocating contributory incremental risk charge to individual positions.
The model captures the default and migration risk in an accurate and consistent quantitative approach for all portfolios. Important parameters for the incremental risk charge calculation are exposures, recovery rates and default probabilities, ratings migrations, maturity, and liquidity horizons of individual positions.
Comprehensive Risk Measure
Comprehensive Risk Measure captures incremental risk for the correlation trading portfolio calculated using an internal model subject to qualitative minimum requirements as well as stress testing requirements. The comprehensive risk measure for the correlation trading portfolio is based on our own internal model.
We calculate the comprehensive risk measure based on a Monte Carlo Simulation technique to a 99.9 % confidence level and a capital horizon of one year. Our model is applied to the eligible corporate correlation trading positions where typical products include collateralized debt obligations, nth-to-default credit default swaps, and commonly traded index- and single-name credit default swaps.
Trades subject to the comprehensive risk measure have to meet minimum liquidity standards to be eligible. The model incorporates concentrations of the portfolio and nonlinear effects via a full revaluation approach.
For regulatory reporting purposes, the comprehensive risk measure represents the higher of the internal model spot value at the reporting dates, their preceding 12-week average calculation, and the floor, where the floor is equal to 8 % of the equivalent capital charge under the standardized approach securitization framework.

109 Deutsche Bank Operating and Financial Review – 30 Employees – 230 Annual Report 2015 Outlook – 70 Internal Control over Financial Reporting – 235 Risk and Opportunities – 77 Information pursuant to Section – 315 (4)
Risk Report – 79 of the German Commercial Code and
► Risk and Capital Management Explanatory Report – 239 Compensation Report – 188 Corporate Responsibility – 228
Market Risk Standardized Approach
Market Risk Management monitors exposures and addresses risk issues and concentrations for certain exposures under the specific Market Risk Standardized Approach (“MRSA”). We use the MRSA to determine the regulatory capi-tal charge for the specific market risk of trading book securitizations which fall outside the scope of the regulatory corre-lation trading portfolio.
We also use the MRSA to determine the regulatory capital charge for longevity risk as set out in CRR/CRD 4 regula-tions. Longevity risk is the risk of adverse changes in life expectancies resulting in a loss in value on longevity linked policies and transactions. For risk management purposes, stress testing and economic capital allocations are also used to monitor and manage longevity risk. Furthermore, certain types of investment funds require a capital charge under the MRSA. For risk management purposes, these positions are also included in our internal reporting framework.
Market Risk Stress Testing
Stress testing is a key risk management technique, which evaluates the potential effects of extreme market events and extreme movements in individual risk factors. It is one of the core quantitative tools used to assess the market risk of Deutsche Bank’s positions and complements VaR and Economic Capital. Market Risk Management performs several types of stress testing to capture the variety of risks: Portfolio stress testing, individual specific stress tests, Event RiskScenarios, and also contributes to Group-wide stress testing
Trading Market Risk Economic Capital (TMR EC)
Our trading market risk economic capital model - scaled Stressed VaR based EC (SVaR based EC) - comprises two core components, the “common risk” component covering risk drivers across all businesses and the “business-specific risk” component, which enriches the Common Risk via a suite of Business Specific Stress Tests (BSSTs). Both com-ponents are calibrated to historically observed severe market shocks. Common risk is calculated using a scaled ver-sion of the Regulatory SVaR framework while BSSTs is desired to capture more product/business-related bespoke risks (e.g. complex basis risks) as well as higher order risks (e.g. for equity options) not captured in the common risk component.
Traded Default Risk Economic Capital (TDR EC)
TDR captures the credit exposures across our trading books and it is monitored via single name concentration and portfolio limits which are set based upon rating, size and liquidity. Single name concentration risk limits are set for two key metrics: Default Exposure, i.e., the P&L impact of an instantaneous default at the current recovery rate (RR), and bond equivalent Market Value (MV), i.e. default exposure at 0 % recovery. In order to capture diversification and con-centration effects we perform a joint calculation for traded default risk economic capital and credit risk economic capital. Important parameters for the calculation of traded default risk are exposures, recovery rates and default probabilities as well as maturities. The probability of joint rating downgrades and defaults is determined by the default and rating corre-lations of the portfolio model. These correlations are specified through systematic factors that represent countries, geographical regions and industries.
Trading Market Risk Reporting
Market Risk Management reporting creates transparency on the risk profile and facilitates the understanding of core market risk drivers to all levels of the organization. The Management Board and Senior Governance Committees re-ceive regular reporting, as well as ad hoc reporting as required, on market risk, regulatory capital and stress testing. Senior Risk Committees receive risk information at a number of frequencies, including weekly or monthly.
Additionally, Market Risk Management produces daily and weekly Market Risk specific reports and daily limit excess reports for each asset class.

Deutsche Bank 1 – Management Report 110Annual Report 2015
Regulatory prudent valuation of assets carried at fair value
Pursuant to Article 34 CRR institutions shall apply the prudent valuation requirements of Article 105 CRR to all assets measured at fair value and shall deduct from CET 1 capital the amount of any additional value adjust-ments necessary.
We determined the amount of the additional value adjustments based on the methodology defined in the EBA final draft Regulatory Technical Standard.
We agreed with the ECB to apply this standard in our regulatory capital calculation from 30 September 2015.
At 31 December 2015 the amount of the additional value adjustments was € 1.9 billion.
Based on Article 159 CRR the total amount of general and specific credit risk adjustments and additional value adjustments for exposures that are treated under the Internal Ratings Based Approach for credit risk and that are in scope of the expected loss calculation may be subtracted from the total expected loss amount related to these exposures. Any remaining positive difference must be deducted from CET 1 capital pursuant to Article 36 (1) lit. d. CRR.
At 31 December 2015 the reduction of the expected loss from subtracting the additional value adjustments was € 0.6 billion, which partly mitigated the negative impact of the additional value adjustments on our CET 1 capi-tal.
Nontrading Market Risk
Nontrading market risk arises primarily from outside the activities of our trading units, in our banking book and from certain off-balance sheet items. Significant market risk factors the bank is exposed to and are overseen by risk man-agement groups in that area are:
‒ Interest rate risk (including model risk from embedded optionality and from modeling behavioral assumptions for certain product types), credit spread risk, foreign exchange risk, equity risk (including investments in public and pri-vate equity as well as real estate, infrastructure and fund assets).
‒ Market risks from off-balance sheet items such as pension schemes and guarantees as well as structural foreign exchange risk and equity compensation risk.
Interest Rate Risk in the Banking Book
The majority of our interest rate risk arising from nontrading asset and liability positions, with the exception of some entities and portfolios, has been transferred through internal transactions to the CB&S division. This internally trans-ferred interest rate risk is managed on the basis of value-at-risk, as reflected in trading portfolio figures. The treatment of interest rate risk in our trading portfolios and the application of the value-at-risk model is discussed in the “Trading Market Risk” section of this document.
The most notable exceptions from the aforementioned paragraph are in the PBC Corporate Division in Germany in-cluding Postbank and the Deutsche AWM mortgage business in the U.S. Unit. These entities manage interest rate risk separately through dedicated Asset and Liability Management departments subject to banking book value-at-risk limits set and monitored by Market Risk Management. The measurement and reporting of interest rate risk managed by these dedicated Asset and Liability functions is performed daily. In addition, the Group holds selected positions man-aged by Treasury, where the measurement and reporting of interest rate risk is performed also daily. The global inter-est rate risk in the banking book is reported on a monthly basis.

111 Deutsche Bank Operating and Financial Review – 30 Employees – 230 Annual Report 2015 Outlook – 70 Internal Control over Financial Reporting – 235 Risk and Opportunities – 77 Information pursuant to Section – 315 (4)
Risk Report – 79 of the German Commercial Code and
► Risk and Capital Management Explanatory Report – 239 Compensation Report – 188 Corporate Responsibility – 228
The maximum negative change of present values of the banking book positions when applying the regulatory required parallel yield curve shifts of (200) and +200 basis points floored by a rate of zero was less than 2 % of our total regula-tory capital at December 31, 2015.
Our PBC, GTB and Deutsche AWM businesses are subject to risk of behavioral change with regard to client deposits as well as savings and loan products. Measuring interest rate risks for these product types in the banking book is based upon assumptions with respect to client behavior, future availability of deposit balances and sensitivities of de-posit rates versus market interest rates resulting in a longer than contractual effective duration. Those parameters are subject to stress testing within our Economic Capital framework. Additionally, consideration is made regarding early prepayment behavior for loan products. The parameters are based on historical observations, statistical analyses and expert assessments. If the future evolution of balances, rates or client behavior differs from these assumptions, then this could have an impact on our interest rate risks in the banking book.
Credit Spread Risk in the Banking Book
Deutsche Bank is exposed to credit spread risk of bonds held in the banking book. This risk category is closely associ-ated with interest rate risk in the banking book.
Foreign Exchange Risk
Foreign exchange risk arises from our nontrading asset and liability positions, denominated in currencies other than the functional currency of the respective entity. The majority of this foreign exchange risk is transferred through internal hedges to trading books within CB&S and is therefore reflected and managed via the value-at-risk figures in the trading books. The remaining foreign exchange risks that have not been transferred are mitigated through match funding the investment in the same currency, therefore only residual risk remains in the portfolios. Small exceptions to above ap-proach follow the general MRM monitoring and reporting process, as outlined for the trading portfolio.
The bulk of nontrading foreign exchange risk is related to unhedged structural foreign exchange exposure, mainly in our U.S., U.K. and China entities. Structural foreign exchange exposure arises from local capital (including retained earnings) held in the Bank’s consolidated subsidiaries and branches and from investments accounted for at equity. Change in foreign exchange rates of the underlying functional currencies result in revaluation of capital and retained earnings and are recognized in other comprehensive income booked as Currency Translation Adjustments (“CTA”).
The primary objective for managing our structural foreign exchange exposure is to stabilize consolidated capital ratios from the effects of fluctuations in exchange rates. Therefore the exposure remains unhedged for a number of core currencies with considerable amounts of risk-weighted assets denominated in that currency in order to avoid volatility in the capital ratio for the specific entity and the Group as a whole.
Investment Risk
Nontrading market risk from investment exposure is predominantly the equity risk arising from our non-consolidated investment holdings in the banking book categorized into strategic and alternative investment assets.
Strategic investments typically relate to acquisitions made to support our business franchise and are undertaken with a medium to long-term investment horizon. Alternative assets are comprised of principal investments and other non-strategic investment assets. Principal investments are direct investments in private equity (including leveraged buy-out fund commitments and equity bridge commitments), real estate (including mezzanine debt) and venture capital, under-taken for capital appreciation. In addition, principal investments are made in hedge funds and mutual funds in order to establish a track record for sale to external clients. Other non-strategic investment assets comprise assets recovered in the workout of distressed positions or other legacy investment assets in private equity and real estate of a non-strategic nature.

Deutsche Bank 1 – Management Report 112Annual Report 2015
Pension Risk
Deutsche Bank is exposed to market risk from a number of defined benefit pension schemes for past and current em-ployees. The ability of the pension schemes to meet the projected pension payments, is maintained through invest-ments and ongoing plan contributions. Market risk materializes due to a potential decline in the market value of the assets or an increase in the liability of each of the pension plans. Market Risk Management monitors and reports all market risks both on the asset and liability side of our defined benefit pension plans including interest rate risk, inflation risk, credit spread risk, equity risk and longevity risk. For details on our defined benefit pension obligation see additional Note 35 “Employee Benefits”.
Other Risks
In addition to the above risks, Market Risk Management has the mandate to monitor and manage market risks that arise from capital, funding and liquidity risk management activities of our treasury department. Besides the structural foreign exchange capital hedging process this includes market risks arising from our equity compensation plans.
Market risks in our asset management activities in Deutsche AWM, primarily results from principal guaranteed funds or accounts, but also from co-investments in our funds.
Nontrading market risk measurement.
Non-trading market risk economic capital is being calculated either by applying the standard traded market risk EC methodology (SVaR based EC model) or through the use of non-traded market risk models that are specific to each risk class and which consider, among other factors, large historically observed market moves, the liquidity of each asset class, and changes in client behavior in relation to deposit products.
Operational Risk Management
Operational Risk Framework
Operational risk is the risk of loss resulting from inadequate or failed internal processes, people and systems, or from external events. It includes legal risk but excludes business and reputational risk.
In 2015, Deutsche Bank further enhanced its capabilities in Operational Risk Management (“ORM”), in con-junction with the Three Lines of Defence (“3LoD”) Program. This included the increased clarification of the roles and responsibilities of the first and second line in managing operational risk, strengthening governance and delivery of improved tools to support risk identification and assessment. As of 2016 the responsibility for the 3LoD program resides at Group ORM.
Group Operational Risk Management (Group ORM) has responsibility for the design, implementation and maintenanceof the Operational Risk Management Framework (ORMF) including the associated governance structures. Group ORM also has the responsibility for providing a cross-risk assessment and aggregation of risks to provide a holistic portfolio view of the non-financial risk profile of the Bank, which includes oversight of risk and control mitigation plans to return risk within risk tolerance, where required.
We take decisions to manage operational risks, both strategically as well as in day-to-day business. Four principles form the foundation of operational risk management at Deutsche Bank:

113 Deutsche Bank Operating and Financial Review – 30 Employees – 230 Annual Report 2015 Outlook – 70 Internal Control over Financial Reporting – 235 Risk and Opportunities – 77 Information pursuant to Section – 315 (4)
Risk Report – 79 of the German Commercial Code and
► Risk and Capital Management Explanatory Report – 239 Compensation Report – 188 Corporate Responsibility – 228
Operational Risk Principle I: Risk Owners have full accountability for their operational risks and have to manage against a defined risk specific appetite. Risk owners are defined to be: First LoD (CB&S, GTB, AWM, PBC, NCOU and first LoD Infrastructure Functions GTO, CS), for all of their operational risks and second LoD (Infrastructure Functions), for the operational risks that arise in their control processes.
Risk owners are accountable for managing all operational risks in their business/processes with an end-to-end process view, within defined operational risk specific appetite and for identifying, establishing and maintaining first level controls.In addition they mitigate identified and assessed risk within the risk specific appetite through remediation actions, insur-ance, risk acceptance or by ceasing/reducing business activities.
Divisional Control Officers (“DCO”) support the Risk Owners. They are responsible for embedding the framework within the relevant business division or infrastructure function. They assess the first level controls effectiveness, monitor the aggregated risk profile and put the appropriate control and mitigating actions in place within the relevant division. The DCOs also establish appropriate governance forums to oversee the Operational Risk (OR) profile and support decision making.
Operational Risk Principle II: Risk Type Controllers (Second LoD control functions) establish the risk management framework and define specific Risk Appetite statements for the Risk Type they own and perform independent controls. Risk Type Controllers are independent second LoD control functions which control specific risk types as identified in the risk taxonomy. We are working towards full implementation of these responsibilities.
The Risk Type Controllers are responsible for establishing an effective risk management framework for the risk type, including setting and monitoring minimum control standards. They challenge, assess and report risks within their risk types and set the risk specific appetite in accordance with the Group’s Risk Appetite statement. Risk Type Controllers monitor group-wide tolerances, perform second level controls, complementary to the first level controls and define the risk taxonomy for the risk type they own. Finally they establish independent non-financial risk governance, and prepare aggregated reporting into the Group Non-Financial Risk Executive Committee (“NFR ExCo”).
Operational Risk Principle III: Group Operational Risk Management establishes and maintains the Group Operational Risk Management Framework. Group ORM develops and maintains the Group's framework, defining the roles and responsibilities for the management of operational risk across the bank and for defining the process to identify, assess, mitigate, monitor, report and escalate operational risks. Group ORM also maintains an operational risk taxonomy and oversees the completeness of coverage of risk types identified in the taxonomy by 2nd Line Control Functions. It also monitors execution and results of Deutsche Bank Group’s Risk and Control Assessment process and operational risk concentrations.
Group ORM also provides independent challenge of the Group’s operational risk profile providing independent risk views to facilitate forward looking management of the risks. The function independently monitors, reviews and as-sesses material risks and key controls at a divisional and infrastructure level across the Bank. It further monitors and reports on the Group's operational risk profile in comparison to the Bank’s Group Risk Appetite, to systematically iden-tify operational risk themes and concentrations, and to agree risk mitigating measures and priorities. To adhere to reporting requirements, Group ORM establishes reporting and escalating procedures up to the Management Board for risk assessment results and identified material control gaps, while informing Group Audit of material control gaps.
Operational Risk Principle IV: Group Operational Risk Management aims to maintain sufficient capital to underpin Operational Risk. Group ORM is accountable for the design, implementation and maintenance of an appropriate ap-proach to determine a sufficient level of capital demand for Operational Risk for recommendation to the Management Board. To fulfil this requirement Group ORM is accountable for the calculation and allocation of Operational Risk Capi-tal demand and Expected Loss planning under the Advanced Measurement Approach (“AMA”) approach. Group ORM is also accountable for the execution of data input controls for the Operational Risk capital calculation and for the facili-tation of the annual OR Capital budgeting and monthly review process.
Deutsche Bank 1 – Management Report 114Annual Report 2015
Organizational & Governance Structure
Group Operational Risk Management is part of the Group Risk function which is headed by the Chief Risk Officer (“CRO”). The CRO appoints the Head of Group Operational Risk Management.
Within Group ORM the Head of Group Operational Risk Management is accountable for the design, implementation and maintenance of an effective and efficient Group Operational Risk Management Framework.
The NFR ExCo, which is chaired by the Chief Risk Officer, is responsible for the oversight, governance and coordina-tion of the Non-Financial Risk management in the Deutsche Bank Group on behalf of the Management Board by estab-lishing a cross-risk and holistic perspective of the key Non-Financial Risks of the Group. The decision-making and policy related authorities include the review, advice and management in a diligent manner of all Non-Financial Risk issues which may impact the holistic / cross risk profile reported by a business division or infrastructure function.
The Regulatory Capital Committee (“RCC”) has delegated parts of its authority for operational risk capital demand management to the AMA Committee (“AMAC”) within defined limits. The AMAC is mandated to oversee the regulatory and economic capital process for operational risk. It aims to ensure adherence to regulatory requirements for the AMA model and its calculation process as well as their adherence to internal policies. The committee either directly approves, or endorses to the RCC for approval, all quantitative and qualitative changes impacting Deutsche Bank's regulatory or economic capital. Additionally, the committee oversees all relevant aspects of model risk for operational risk models.
While the day-to-day management of operational risk is the primary responsibility of our business divisions and infrastructure functions, Group ORM manages the cross divisional and cross regional operational risk as well as risk concentrations and promotes a consistent application of the ORMF across the bank. Through our busi-ness partnership model, we aim to maintain close monitoring and high awareness of operational risks.
Managing Our Operational Risk
We manage operational risk using the Group Operational Risk Management framework which enables us to determine our operational risk profile in comparison to our risk tolerance, to systematically identify operational risk themes and concentrations, and to define risk mitigating measures and priorities.
In order to cover the broad range of risk types underlying operational risk, our framework contains a number of opera-tional risk management techniques. These aim to efficiently manage the operational risk in our business and are used to identify, assess and mitigate operational risks:
‒ Loss Data Collection: The continuous collection of operational risk loss events, as a prerequisite for operational risk management, includes detailed analyses, the identification of mitigating actions, and provision of timely information to senior management. All losses above € 10,000 are collected in our incident reporting system (“dbIRS”).
‒ The Lessons Learned process is triggered for events, including near misses, above € 500 thousand. This process includes, but is not limited to: — systematic risk analyses, including a description of the business environment in which the loss occurred, previ-
ous events, near misses and event-specific Key Risk Indicators (“KRI”), — root cause analysis, — review of control improvements and other actions to prevent or mitigate the recurrence, and — assessment of the residual risk exposure. The execution of corrective actions identified in this process are systematically tracked and reported monthly to sen-ior management.

115 Deutsche Bank Operating and Financial Review – 30 Employees – 230 Annual Report 2015 Outlook – 70 Internal Control over Financial Reporting – 235 Risk and Opportunities – 77 Information pursuant to Section – 315 (4)
Risk Report – 79 of the German Commercial Code and
► Risk and Capital Management Explanatory Report – 239 Compensation Report – 188 Corporate Responsibility – 228
‒ Scenario Analyses: We complete our risk profile using a set of scenarios including relevant external cases provided by a public database and additional internal scenarios. We thereby systematically utilize information on external loss events occurring in the banking industry to prevent similar incidents from happening to us, for example through par-ticular deep dive analyses or risk profile reviews.
‒ Emerging Risk Identification: We assess and approve the impact of changes on our risk profile as a result of new products, outsourcing activities, strategic initiatives, acquisitions and divestments as well as material systems and process changes. Once operational risks are identified and assessed, they are compared to the relevant specific risk appetite statement and either mitigated or accepted. Risks which violate applicable national or international reg-ulations and legislation cannot be accepted; once identified, such risks must always be mitigated.
‒ Read-across Analysis: We continuously seek to enhance the process to assess whether identified issues require a broader approach across multiple entities and locations within Deutsche Bank. A review of material findings is per-formed in order to assess their relevance to areas of the Bank other than where they originated. We are developing business intelligence software to identify risk clusters across the bank accessing various sources of information. We aim to increase our predictive analysis and clustering capabilities and to identify risk concentrations in a timely man-ner through the use of this tool.
‒ Risk Mitigation: When we implement risk mitigating measures, we systematically monitor their resolution. Residual operational risks rated significant or above need to be accepted by the risk bearing division and reviewed for deci-sion by the Head of Group ORM.
‒ We perform Top Risk Analyses in which the results of the aforementioned activities are considered. The Top Risk Analyses are a primary input for the annual operational risk management strategy and planning process and aim to identify our most critical risks in terms of probability and severity.
‒ Key Risk Indicators are used to monitor the operational risk profile and alert the organization to impending problems in a timely fashion. KRIs enable the monitoring of the bank’s control culture and business environment and trigger risk mitigating actions. They facilitate the forward looking management of operational risks, based on early warning signals.
‒ In our bottom-up Self-Assessment (“SA”) process, which is conducted at least annually, areas with high risk poten-tial are highlighted, and risk mitigating measures to resolve issues are identified. On a regular basis we conduct risk workshops aiming to evaluate risks specific to local legal entities and the countries we operate in, and take appro-priate risk mitigating actions. We are in the course of replacing this existing SA process by an enhanced Risk and Control Assessment process, supported by a group wide IT tool. We plan to substantially cover the Bank’s nonfi-nancial operating units under this enhanced approach in 2016.
Additional functions, methodologies and tools implemented by the responsible second line Risk Type Controllers are utilized to complement the Group Operational Risk Framework and specifically address the risk types. These include but are not limited to: ‒ Legal Risk is a significant risk factor for DB, which as described in detail in the “Provisions” note of our Consolidated
Financial Statements. A Legal Risk Management (“LRM”) function within our Legal Depart-ment is exclusively dedi-cated to the identification and management of legal risk. It undertakes a broad variety of tasks aimed at proactively managing legal risk, including: devising, implementing and overseeing an annual Legal Risk Assessment Program analyzing existing and historic legal risks; agreeing and participating in resulting portfolio reviews and mitigation plans; and administering the Legal Lessons Learned process.
‒ The operational risk from outsourcing is managed by the Vendor Risk Management (“VRM”) Process. The outsourc-ing risk is assessed and managed for all outsourcing arrangements individually, following our Vendor Risk Man-agement Policy and in line with the overall Group Operational Risk Management Framework. A broad governance structure is established to promote appropriate risk levels.
‒ Fraud Risk is managed based on section 25a of the German Banking Act (“KWG”) as well as other legal and regula-tory requirements via a risk based approach, governed by our Global Anti-Fraud Policy and corresponding Compli-ance and Anti-Money-Laundering (“AML”) framework. In line with regulatory requirements, a global risk assessment is performed on a regular basis. Within the general management of operational risks, dedicated Fraud Risk relevant aspects are part of the self-assessment process.

Deutsche Bank 1 – Management Report 116Annual Report 2015
‒ We manage Business Continuity Risk with its Business Continuity Management (“BCM”) Program which outlines core procedures for the relocation or the recovery of operations in response to varying levels of disruption. Within this program, each of our core businesses functions and infrastructure groups set up, maintain and periodically test business continuity plans to promote continuous and reliable service. The BCM Program has defined roles and re-sponsibilities which are documented in corporate standards. Compliance with these standards is monitored region-ally by dedicated business continuity teams. Furthermore, key information on the established BCM control environment feed into operational risk KRIs.
‒ The Operational Risk in Technology is managed within the Group Technology Organization, following international standards for IT management. Applications and IT infrastructure are catalogued and assessed on a regular basis. Stability monitoring is established. Key outcomes of the established assessment and control environment are used as input for KRIs or self-assessments.
Measuring Our Operational Risks
We calculate and measure the regulatory and economic capital requirements for operational risk using the Advanced Measurement Approach (AMA) methodology. Our AMA capital calculation is based upon the loss distribution approach (“LDA”). Gross losses from historical internal and external loss data (Operational Riskdata eXchange Association (ORX) consortium data) and external scenarios from a public database (IBM OpData) complemented by internal scenario data are used to estimate the risk profile (i.e., a loss frequency and a loss severity distribution). Our LDA model includes conservatism by recognizing losses on events that arise over multiple years as single events in our historical loss profile.
Moreover, we have submitted an additional model change request to our Germany supervisory authority BaFin to replace the € 1 billion regulatory capital safety margin, which we have continuously applied since its implementation in 2011. This change will make our model more risk sensitive by including reasonably possible litigation losses in our “Relevant Loss Data” set. Reasonably possible litigation losses may result from ongoing and new legal matters which are reviewed quarterly and are based on the judgment provided by our Legal Department.
While our dialogue with the joint supervisory team on these model enhancements is ongoing, management had de-cided to recognize the impact of material model changes in the second quarter 2014 wherever they will lead to an increase in the capital requirement over the models that have previously been approved by BaFin.
Within the LDA model, the frequency and severity distributions are combined in a Monte Carlo simulation to generate potential losses over a one year time horizon. Finally, the risk mitigating benefits of insurance are applied to each loss generated in the Monte Carlo simulation. Correlation and diversification benefits are applied to the net losses in a man-ner compatible with regulatory requirements to arrive at a net loss distribution at Group level, covering expected and unexpected losses. Capital is then allocated to each of the business divisions after considering qualitative adjustments and expected loss.
The regulatory capital requirement for operational risk is derived from the 99.9 % percentile. The economic capital is set at a level to absorb at a 99.98 % percentile very severe aggregate unexpected losses within one year. Both regula-tory and economic capital requirements are calculated for a time horizon of one year.
The Regulatory and Economic Capital demand calculations are performed on a quarterly basis. Group ORM aims to ensure that for the approach for capital demand quantification appropriate development, validation and change gov-ernance processes are in place, whereby the validation is performed by an independent validation function and in line with Deutsche Bank’s model risk management process.
117 Deutsche Bank Operating and Financial Review – 30 Employees – 230 Annual Report 2015 Outlook – 70 Internal Control over Financial Reporting – 235 Risk and Opportunities – 77 Information pursuant to Section – 315 (4)
Risk Report – 79 of the German Commercial Code and
► Risk and Capital Management Explanatory Report – 239 Compensation Report – 188 Corporate Responsibility – 228
Liquidity Risk Management
Liquidity risk is the risk arising from our potential inability to meet all payment obligations when they come due or only being able to meet these obligations at excessive costs. The objective of the Group’s liquidity risk management frame-work is to ensure that the Group can fulfil its payment obligations at all times and can manage liquidity and funding risks within its risk appetite. The framework considers relevant and significant drivers of liquidity risk, whether on-balance sheet or off-balance sheet.
Our liquidity risk management framework has been an important factor in maintaining adequate liquidity and in manag-ing our funding profile during 2015.
Liquidity Risk Management Framework
In accordance with the ECB’s Supervisory Review and Evaluation Process (SREP), Deutsche Bank has implemented an annual Internal Liquidity Adequacy Assessment Process (“ILAAP”), which is reviewed and approved by the Man-agement Board. The ILAAP provides comprehensive documentation of the Bank’s Liquidity Risk Management frame-work, including: identifying the key liquidity and funding risks to which the Group is exposed; how these risks are identified, monitored and measured and describes the techniques and resources used to manage and mitigate these risks.
The Management Board defines the liquidity and funding risk strategy for the bank, as well as the risk appetite, based on recommendations made by the Capital and Risk Committee (“CaR”). At least annually the Management Board reviews and approves the limits which are applied to the Group to measure and control liquidity risk as well as our long-term funding and issuance plan.
Treasury is mandated to manage the overall liquidity and funding position of the bank, with Liquidity Risk Control acting as an independent control function, responsible for the validation of Liquidity Risk models which are developed by Treasury, to measure and manage the Group’s liquidity risk profile.
Treasury manages liquidity and funding, in accordance with the Management Board approved risk appetite across a range of relevant metrics, and implements a number of tools to monitor these and ensure compliance. In addition, Treasury works closely in conjunction with Liquidity Risk Control (“LRC”), and the business, to analyse and understand the underlying liquidity characteristics of the business portfolios. These parties are engaged in regular and frequent dialogue to understand changes in the bank’s position arising from business activities and market circumstances. Dedicated business targets are allocated to ensure the Group meets its overall liquidity and funding appetite.
The Management Board is informed of performance against these risk appetite metrics, via a weekly Liquidity Score-card. As part of the annual strategic planning process, we project the development of the key liquidity and funding metrics based on the underlying business plans to ensure that the plan is in compliance with our risk appetite.
Capital Markets Issuance
Deutsche Bank has a wide range of funding sources, including retail and institutional deposits, unsecured and secured wholesale funding and debt issuance in the capital markets. Debt issuance, encompassing senior unsecured bonds, covered bonds as well as capital securities, is a key source of term funding for the Bank and is managed directly by Treasury. At least once a year Treasury submits an annual long-term Funding Plan to the Capital and Risk Committee for recommendation and then to the Management Board for approval. This plan is driven by global and local funding and liquidity requirements based on expected business development. Our capital markets portfolio is dynamically managed through our yearly issuance plans to avoid excessive maturity concentrations.

Deutsche Bank 1 – Management Report 118Annual Report 2015
Short-term Liquidity and Wholesale Funding
Deutsche Bank tracks all contractual cash flows from wholesale funding sources, on a daily basis, over a 12-month horizon. For this purpose, we consider wholesale funding to include unsecured liabilities raised primarily by Treasury Pool Management, as well as secured liabilities raised by our Markets Division. Our wholesale funding counterparties typically include corporates, banks and other financial institutions, governments and sovereigns.
The Group has implemented a set of Management Board approved limits to restrict DB’s exposure to wholesale coun-terparties, which have historically shown to be the most susceptible to market stress. These wholesale funding limits are calibrated against monthly stress-testing results, to ensure the Group remains liquid under our most severe stress scenario, even if limits are fully utilized.
The wholesale funding limits are monitored daily, and apply to the total combined currency amount of all wholesale funding currently outstanding, both secured and unsecured with specific tenor limits covering the first 8 weeks. Our Liquidity Reserves are the primary mitigant against potential stress in short-term wholesale funding market.
The tables starting on page 184 show the contractual maturity of our short-term wholesale funding and capital markets issuance.
Liquidity Stress Testing and Scenario Analysis
Global liquidity stress testing and scenario analysis is one of the key tools for measuring liquidity risk and evaluating the Group’s short-term liquidity position within the liquidity framework. It complements the intraday operational liquidity management process and the long-term liquidity strategy, represented by the Funding Matrix.
Our global liquidity stress testing process is managed by Treasury in accordance with the Management Board ap-proved risk appetite. Treasury is responsible for the design of the overall methodology, including the definition of the stress scenarios, the choice of liquidity risk drivers and the determination of appropriate assumptions (parameters) to translate input data into model results. Liquidity Risk Control Oversight and Validation (“LRC O&V”) are responsible for the independent validation of methodologies and Liquidity Risk Control Reporting and Analytics (“LRC R&A”) for im-plementing these methodologies in conjunction with Treasury and IT. LRC R&A is also responsible for the stress test calculation.
We use stress testing and scenario analysis to evaluate the impact of sudden and severe stress events on our liquidity position. The scenarios we apply are based on historic events, such as the 2008 financial markets crisis.
Deutsche Bank has selected five scenarios to calculate the Group’s stressed Net Liquidity Position (“sNLP”). These scenarios capture the historical experience of Deutsche Bank during periods of idiosyncratic and/or market-wide stress and are assumed to be both plausible and sufficiently severe as to materially impact the Group’s liquidity position. A global market crisis, for example, is covered by a specific stress scenario (systemic market risk) that models the poten-tial consequences as seen, e.g., during the recent financial crisis. Additionally, we have introduced regional market stress scenarios. Under each of the scenarios we assume a high degree of maturing loans to non-wholesale customers is rolled-over, to support our business franchise. Wholesale funding, from the most risk sensitive counterparties (includ-ing banks, and money-market mutual funds) is assumed to roll-off at contractual maturity or even be bought back, in the acute phase of the stress.
In addition, we include the potential funding requirements from contingent liquidity risks which might arise, including credit facilities, increased collateral requirements under derivative agreements, and outflows from deposits with a con-tractual rating linked trigger.
We then model the actions we would take to counterbalance the outflows incurred. Countermeasures include our Li-quidity Reserves and asset liquidity from other unencumbered securities.

119 Deutsche Bank Operating and Financial Review – 30 Employees – 230 Annual Report 2015 Outlook – 70 Internal Control over Financial Reporting – 235 Risk and Opportunities – 77 Information pursuant to Section – 315 (4)
Risk Report – 79 of the German Commercial Code and
► Risk and Capital Management Explanatory Report – 239 Compensation Report – 188 Corporate Responsibility – 228
Stress testing is conducted at a global and individual legal entity level and across significant non-eurozone currencies, in particular, U.S. dollar and GBP as the major non-EUR funding currencies. We review our stress-testing assumptions on a regular basis and have increased the severity of a number of these assumptions throughout the course of 2015.
We run the liquidity stress test over an eight-week horizon, which we consider the most critical time span in a liquidity crisis, and apply the relevant stress assumptions to risk drivers from on-balance sheet and off-balance sheet products on a daily basis. Beyond the eight week time horizon, we analyze the impact of a more prolonged stress period, ex-tending to twelve months. This stress testing analysis is performed monthly.
Our internal risk appetite is to maintain a surplus of at least € 5 billion throughout the 8 week stress horizon under all scenarios for our monthly aggregate currency stress test.
The table on page 181 shows the results of our internal liquidity stress test under the various different scenarios.
Liquidity Coverage Ratio
In addition to our internal stress test result, the Group has a Management Board approved risk appetite for the Liquidity Coverage Ratio (“LCR”). Finalized by the Basel Committee in January 2013, the LCR is intended to promote the short-term resilience of a bank’s liquidity risk profile over a 30 day stress scenario. The ratio is defined as the amount of High Quality Liquid Assets (“HQLA”) that could be used to raise liquidity, measured against the total volume of net cash outflows, arising from both actual and contingent exposures, in a stressed scenario.
This requirement has been implemented into European law, via the Commission Delegated Regulation (EU) 2015/61, adopted in October 2014. Compliance with the LCR was required in Europe from October 1, 2015. The Liquidity Cov-erage Ratio is subject to a transitional phase-in period, which started at 60 % on October 1, 2015, rising to 70 % from January 1,, 2016, 80 % in 2017 and 100 % in 2018.
The LCR complements the internal stress testing framework. By maintaining a ratio in excess of minimum regulatory requirements, the LCR ensure that the Group holds adequate liquidity resources to mitigate a short-term liquidity stress.
Our internal risk appetite is to maintain a LCR ratio of at least 105 %.
Key differences between the liquidity stress test and LCR include the time horizon (eight weeks versus 30 days), classi-fication and haircut differences between Liquidity Reserves and the LCR HQLA, outflow rates for various categories of funding, and inflow assumption for various assets (for example, loan repayments).Our liquidity stress test also includes outflows related to intraday liquidity assumptions, which the LCR excludes.
Funding Risk Management
Structural Funding
Deutsche Bank’s primary tool for monitoring and managing funding risk is the Funding Matrix. The Funding Matrix assesses the Group’s structural funding profile for the greater than one year time horizon. To produce the Funding Matrix, all funding-relevant assets and liabilities are mapped into time buckets corresponding to their contractual or modeled maturities. This allows the Group to identify expected excesses and shortfalls in term liabilities over assets in each time bucket, facilitating the management of potential liquidity exposures.
The liquidity maturity profile is based on contractual cash flow information. If the contractual maturity profile of a product does not adequately reflect the liquidity maturity profile, it is replaced by modelling assumptions. Short-term balance sheet items (<1yr) or matched funded structures (asset and liabilities directly matched with no liquidity risk) can be excluded from the term analysis.

Deutsche Bank 1 – Management Report 120Annual Report 2015
The bottom-up assessment by individual business line is combined with a top-down reconciliation against the Group’s IFRS balance sheet. From the cumulative term profile of assets and liabilities beyond 1 year, any long-funded sur-pluses or short-funded gaps in the Group’s maturity structure can be identified. The cumulative profile is thereby built up starting from the above 10 year bucket down to the above 1 year bucket.
The funding matrix analysis together with the strategic liquidity planning process, which forecasts the funding supply and demand across business units, provides the key input parameter for our annual capital market issuance plan. Upon approval by the Management Board the capital markets issuance plan establishes issuing targets for securities by tenor, volume and instrument. We also maintain a stand-alone U.S. dollar and GBP funding matrix which limits the maximum short position in any time bucket (>1 year to >10 years) to € 10 billion and € 5 billion respectively. This sup-plements the risk appetite for our aggregate currency funding matrix which requires us to maintain a positive funding position in any time bucket (>1 year to > 10 years).
Net Stable Funding Ratio
The Net Stable Funding Ratio was proposed as part of Basel 3, as the regulatory metric for assessing a bank’s struc-tural funding profile. The NSFR is intended to reduce medium to long-term funding risks by requiring banks to maintain a stable funding profile in relation to their on- and off-balance sheet activities. The ratio is defined as the amount of Available Stable Funding (the portion of capital and liabilities expected to be a stable source of funding), relative to the amount of Required Stable Funding (a function of the liquidity characteristics of various assets held).
Although the NSFR is scheduled to become a minimum standard internationally, by January 1, 2018, the ratio is sub-ject to national implementation. In Europe, rules on the NSFR are due to be finalized by the European Commission, in the form of a Legislative Proposal due at the end of 2016. Therefore, for European banks, the final format of the ratio and associated implementation timeframe has not yet been confirmed.
We are currently in the process of assessing the impacts of the NSFR, and would expect to formally embed this metric within our overall liquidity risk management framework, once the relevant rules and timing within Europe have been finally determined.
Funding Diversification
Diversification of our funding profile in terms of investor types, regions, products and instruments is an important ele-ment of our liquidity risk management framework. Our most stable funding sources come from capital markets and equity, retail, and transaction banking clients. Other customer deposits and secured funding and shorts are additional sources of funding. Unsecured wholesale funding represents unsecured wholesale liabilities sourced primarily by our Treasury Pool division. Given the relatively short-term nature of these liabilities, they are primarily used to fund cash and liquid trading assets.
To promote the additional diversification of our refinancing activities, we hold a Pfandbrief license allowing us to issue mortgage Pfandbriefe. In addition, we have established a program for the purposes of issuing Covered Bonds under Spanish law (Cedulas).
Unsecured wholesale funding comprises a range of unsecured products e.g. Certificates of Deposit (CDs), Commercial Paper (CP) as well as term, call and overnight deposits across tenors primarily up to one year.
To avoid any unwanted reliance on these short-term funding sources, and to promote a sound funding profile, which complies with the defined risk appetite, we have implemented limits (across tenors) on these funding sources, which are derived from our monthly stress testing analysis. In addition, we limit the total volume of unsecured wholesale funding to manage the reliance on this funding source as part of the overall funding diversification.
The chart on page 178 shows the composition of our external funding sources that contribute to the liquidity risk posi-tion, both in EUR billion and as a percentage of our total external funding sources.

121 Deutsche Bank Operating and Financial Review – 30 Employees – 230 Annual Report 2015 Outlook – 70 Internal Control over Financial Reporting – 235 Risk and Opportunities – 77 Information pursuant to Section – 315 (4)
Risk Report – 79 of the German Commercial Code and
► Risk and Capital Management Explanatory Report – 239 Compensation Report – 188 Corporate Responsibility – 228
Funds Transfer Pricing
The funds transfer pricing framework applies to all businesses and regions and promotes pricing of (i) assets in accor-dance with their underlying liquidity risk, (ii) liabilities in accordance with their liquidity value and funding maturity and (iii) contingent liquidity exposures in accordance with the cost of providing for commensurate liquidity reserves to fund unexpected cash requirements.
Deutsche Bank’s funds transfer pricing framework reflects regulatory principles and guidelines. Within this framework all funding and liquidity risk costs and benefits are allocated to the firm’s business units based on market rates. Those market rates reflect the economic costs of liquidity for Deutsche Bank. Treasury might set further financial incentives in line with the bank’s liquidity risk guidelines. While the framework promotes a diligent group-wide allocation of the bank's funding costs to the liquidity users, it also provides an incentive based compensation framework for businesses gener-ating stable long-term and stress compliant funding. Funding relevant transactions are subject to liquidity (term) premi-ums and/or other funds transfer pricing mechanisms depending on market conditions. Liquidity premiums are set by Treasury and reflected in a segregated Treasury liquidity account which is the aggregator of liquidity costs and benefits. The management and allocation of the liquidity account cost base is the key variable for funds transfer pricing within Deutsche Bank.
Liquidity Reserves
Liquidity reserves comprise available cash and cash equivalents, highly liquid securities (includes government, agency and government guaranteed) as well as other unencumbered central bank eligible assets.
The volume of our liquidity reserves is a function of our expected daily stress result, both at an aggregate level as well as at an individual currency level. To the extent we receive incremental short-term wholesale liabilities which attract a high stress roll-off, we will largely keep the proceeds of such liabilities in cash or highly liquid securities as a stress mitigant. Accordingly, the total volume of our liquidity reserves will fluctuate as a function of the level of short-term wholesale liabilities held, although this has no material impact on our overall liquidity position under stress. Our liquidity reserves include only assets that are freely transferable within the Group, or can be applied against local entity stress outflows. We hold the vast majority of our liquidity reserves centrally, at our parent and our foreign branches with fur-ther reserves held at key locations in which we are active. While we hold our reserves across major currencies, their size and composition are subject to regular senior management review.
Asset Encumbrance
Encumbered assets primarily comprise those on- and off-balance sheet assets that are pledged as collateral against secured funding, collateral swaps, and other collateralized obligations. We generally encumber loans to support long-term capital markets secured issuance such as Pfandbriefe or other self-securitisation structures, while financing debt and equity inventory on a secured basis is a regular activity for our Global Markets business. Additionally, in line with the EBA technical standards on regulatory asset encumbrance reporting, we consider assets placed with settlement systems, including default funds and initial margins as encumbered, as well as other assets pledged which cannot be freely withdrawn such as mandatory minimum reserves at central banks. We also include derivative margin receivable assets as encumbered under these EBA guidelines.
Deutsche Bank 1 – Management Report 122Annual Report 2015
Business (Strategic) Risk Management
Strategic Risk is the risk of a potential earnings downside due to revenues and/or costs underperforming plan targets. Strategic Risk may arise from poor strategic positioning, failure to execute strategy or lack of effective responses to material negative plan deviations caused by either external or internal factors (including macro, financial and idiosyn-cratic drivers). Strategic Risk has been defined as part of overall Business Risk.
The key aim of Strategic Risk Management is to strengthen the bank´s earnings resilience and protect it against undue earnings volatility to support overall risk appetite targets (especially CET 1 ratio and Leverage Ratios). We aim to achieve this by identifying, assessing, limiting, mitigating and monitoring key strategic risks.
Currently, the modelling and quantitative measurement of Strategic Risk is primarily covered by our internal economic capital (EC) framework. In 2016, we will implement a comprehensive framework to manage Strategic Risk.
Reputational Risk Management
Within our risk management process, we define reputational risk as the risk of possible damage to DB’s brand and reputation, and the associated risk to earnings, capital or liquidity, arising from any association, action or inaction which could be perceived by stakeholders to be inappropriate, unethical or inconsistent with DB’s values and beliefs.
Our reputational risk is governed by the Reputational Risk Framework (the Framework). The Framework was estab-lished to provide consistent standards for the identification, assessment and management of reputational risk issues. While every employee has a responsibility to protect DB’s reputation, the primary responsibility for the identification, assessment, management, monitoring and, if necessary, referring or reporting, of reputational risk matters lies with DB’s Business Divisions. Each employee is under an obligation, within the scope of his/her activities, to be alert to any potential causes of reputational risk and to address them according to the Framework.
If a potential reputational risk is identified, it is required to be referred for further consideration within the Business Divi-sion through their Unit Reputational Risk Assessment Process. In the event that a matter is deemed to carry a material reputational risk and/or meets one of the mandatory referral criteria, it must be referred through to one of the four Re-gional Reputational Risk Committees (RRRCs) for further review as the 2nd line of defence. The RRRCs are sub-committees of the Group Reputational Risk Committee (GRRC) and are responsible for the oversight, governance and coordination of the management of reputational risk in their respective regions of Deutsche Bank on behalf of the Man-agement Board. In exceptional circumstances, matters can also be referred by the RRRCs to the GRRC.
The modelling and quantitative measurement of reputational risk internal capital is implicitly covered in our economic capital framework primarily within operational and strategic risk.
Model Risk Management
Model Risk is the risk of possible adverse consequences of decisions based on models that are inappropriate, incorrect, or misused. In this context, a model is defined as a quantitative method, system, or approach that applies statistical, economic, financial, or mathematical theories, techniques, and assumptions to process input data into quantitative estimates.
123 Deutsche Bank Operating and Financial Review – 30 Employees – 230 Annual Report 2015 Outlook – 70 Internal Control over Financial Reporting – 235 Risk and Opportunities – 77 Information pursuant to Section – 315 (4)
Risk Report – 79 of the German Commercial Code and
► Risk and Capital Management Explanatory Report – 239 Compensation Report – 188 Corporate Responsibility – 228
A new Model risk function was established in 2014, aggregating all core model risk management activities across the bank into one independent function:
‒ Model validation provides independent validation of the methodological aspects of models. The key objectives of model validation are to verify that models are performing as expected, in line with their design objectives and busi-ness uses, and to aim to ensure that models are logically and conceptually sound and assess the appropriateness and accuracy of the implementation methodology;
‒ Model risk governance supports establishment of a front-to-back model risk management framework which includes defining common standards for model development, usage and validation; identification and remediation of issues and inconsistencies in modeling; and maintenance of a bank-wide model inventory; and
‒ Key senior management forums to address model risk are the Group Model Risk Management Committee (“GMRMC”) and the Pricing Model Risk Management Committee (“PMRMC”). Both are subcommittees of the CaR and act on behalf of the Management Board. The PMRMC is responsible for management and oversight of model risk from valuation models (front office models that are used for official pricing and risk management of trading positions). The GMRMC is responsible for management and oversight of model risk from risk and capital models.
The modeling and quantitative measurement of model risk internal capital is implicitly covered in our economic capital framework primarily within operational and strategic risk.
Compliance Risk Management
Compliance Risk is defined as the current or prospective risk to earnings and capital arising from violations or non-compliance with laws, rules, regulations, agreements, prescribed practices or ethical standards and can lead to fines, damages and/ or the voiding of contracts and can diminish an institution’s reputation.
Compliance manages this risk through the following:
‒ Identifying material rules and regulations where non-compliance could lead to endangerment of the Bank’s assets (supported by the bank’s business divisions, infrastructure functions or Regional Management);
‒ Advising and supporting the Management Board concerning the adherence to material rules and regulations as well as acting to implement effective procedures for compliance with applicable material rules and regulations, and the setup of the corresponding controls;
‒ Monitoring the coverage of new or changed material rules and regulations by our business divisions, infrastructure functions or Regional Management including potential implementation plans for appropriate controls. Compliance is not explicitly requested to run its own monitoring programs but has the right to carry out monitoring activities;
‒ Assessing the coverage of all existing material rules and regulations by the bank’s business divisions, infrastructure functions or Regional Management and existence of a corresponding control environment; and
‒ Reporting to the Management and Supervisory Boards on at least an annual basis and on an ad hoc basis.
The modeling and quantitative measurement of compliance risk internal capital is implicitly covered in our economic capital framework primarily within operational and strategic risk.
Deutsche Bank 1 – Management Report 124Annual Report 2015
Insurance Specific Risk Management
Our exposure to insurance risk relates primarily to Abbey Life Assurance Company Limited and our defined benefit pension obligations. There is also some insurance-related risk within the Pensions and Insurance Risk Markets busi-ness. In our risk management framework, we consider insurance-related risks primarily as nontrading market risk that has been classified as material risk. We monitor the underlying assumptions in the calculation of these risks regularly and seek risk mitigating measures such as reinsurances, if we deem this appropriate. We are primarily exposed to the following insurance-related risks:
‒ Longevity risk: the risk of faster or slower than expected improvements in life expectancy on immediate and de-ferred annuity products;
‒ Mortality and morbidity risks: the risks of a higher or lower than expected number of death or disability claims on insurance products and of an occurrence of one or more large claims;
‒ Expenses risk: the risk that policies cost more or less to administer than expected; and ‒ Persistency risk: the risk of a higher or lower than expected percentage of lapsed policies.
To the extent that actual experience is less favorable than the underlying assumptions, or it is necessary to increase provisions due to more onerous assumptions, the amount of capital required in the insurance entities may increase.
Risk Concentration and Risk Diversification
Risk Concentrations
Risk concentrations refer to clusters of the same or similar risk drivers within specific risk types (intra-risk concentra-tions in credit, market, operational, liquidity and other risks) as well as across different risk types (inter-risk concentra-tions). They could occur within and across counterparties, businesses, regions/countries, industries and products. The management of concentrations is integrated as part of the management of individual risk types and monitored on an ongoing basis. The key objective is to avoid any undue concentrations in the portfolio, which is achieved through a quantitative and qualitative approach, as follows:
‒ Intra-risk concentrations are assessed, monitored and mitigated by the individual risk disciplines (credit, market, operational, liquidity risk management and others). This is supported by limit setting on different levels and/or man-agement according to risk type.
‒ Inter-risk concentrations are managed through quantitative top-down stress-testing and qualitative bottom-up re-views, identifying and assessing risk themes independent of any risk type and providing a holistic view across the bank.
The most senior governance body for the oversight of risk concentrations throughout 2015 was the Portfolio Risk Committee (PRC), which is a subcommittee of the Capital and Risk Committee (CaR) and the Risk Executive Commit-tee (Risk ExCo).
Risk Type Diversification Benefit
The risk type diversification benefit quantifies diversification effects between credit, market, operational and strategic risk in the economic capital calculation. To the extent correlations between these risk types fall below 1.0, a risk type diversification benefit results. The calculation of the risk type diversification benefit is intended to ensure that the standalone economic capital figures for the individual risk types are aggregated in an economically meaningful way.
125 Deutsche Bank Operating and Financial Review – 30 Employees – 230 Annual Report 2015 Outlook – 70 Internal Control over Financial Reporting – 235 Risk and Opportunities – 77 Information pursuant to Section – 315 (4)
Risk Report – 79 of the German Commercial Code and
► Risk and Capital Performance Explanatory Report – 239 Compensation Report – 188 Corporate Responsibility – 228
Risk and Capital Performance
Capital and Leverage Ratio
Regulatory Capital
The calculation of our regulatory capital incorporates the capital requirements following the “Regulation (EU) No 575/2013 on prudential requirements for credit institutions and investment firms” (Capital Requirements Regulation or “CRR”) and the “Directive 2013/36/EU on access to the activity of credit institutions and the prudential supervision of credit institutions and investment firms” (Capital Requirements Directive 4 or “CRD 4”) as implemented into German law. The information in this section as well as in the section “Development of risk-weighted Assets” is based on the regulatory principles of consolidation.
When referring to results according to full application of the final CRR/CRD 4 framework (without consideration of applicable transitional methodology) we use the term “CRR/CRD 4 fully loaded”. In some cases, CRR/CRD 4 main-tains transitional rules that had been adopted in earlier capital adequacy frameworks through Basel 2 or Basel 2.5. These relate e.g. to the risk weighting of certain categories of assets and include rules permitting the grandfathering of equity investments at a risk-weight of 100 %. In these cases, our CRR/CRD 4 fully loaded methodology assumes that the impact of the expiration of these transitional rules will be mitigated through sales of the underlying assets or other measures prior to the expiration of the grandfathering provisions.
This section refers to the capital adequacy of the group of institutions consolidated for banking regulatory purposes pursuant to the CRR and the German Banking Act (“Kreditwesengesetz” or “KWG”). Therein not included are insur-ance companies or companies outside the finance sector. Our insurance companies are included in an additional capital adequacy (also “solvency margin”) calculation under the German Solvency Regulation for Financial Conglomer-ates. Our solvency margin as a financial conglomerate remains dominated by our banking activities.
The total regulatory capital pursuant to the effective regulations as of year-end 2015 comprises Tier 1 and Tier 2 (T2) capital. Tier 1 capital is subdivided into Common Equity Tier 1 (CET 1) capital and Additional Tier 1 (AT1) capital.
Common Equity Tier 1 (CET 1) capital consists primarily of common share capital (reduced by own holdings) including related share premium accounts, retained earnings (including losses for the financial year, if any) and accumulated other comprehensive income, subject to regulatory adjustments (i.e. prudential filters and deductions). Prudential filters for CET 1, according to Articles 32 to 35 CRR, include (i) securitization gain on sale, (ii) cash flow hedges and changes in the value of own liabilities, and (iii) additional value adjustments. CET 1 capital deductions comprise (i) intangible assets, (ii) deferred tax assets that rely on future profitability, (iii) negative amounts resulting from the calculation of expected loss amounts, and (iv) net defined benefit pension fund assets, (v) reciprocal cross holdings in the capital of financial sector entities, (vi) significant and non-significant investments in the capital (CET 1, AT1, T2) of financial sec-tor entities above certain thresholds. All items not deducted (i.e. amounts below the threshold) are subject to risk-weighting.
Additional Tier 1 (AT1) capital consists of AT1 capital instruments and related share premium accounts as well as noncontrolling interests qualifying for inclusion in consolidated AT1, and during the transitional period grandfathered instruments eligible under earlier frameworks. To qualify as AT1 under CRR/CRD 4 instruments must have principal loss absorption through a conversion to common shares or a write-down mechanism allocating losses at a trigger point and must also meet further requirements (perpetual with no incentive to redeem; institution must have full divi-dend/coupon discretion at all times, etc.).

Deutsche Bank 1 – Management Report 126Annual Report 2015
Tier 2 (T2) capital comprises eligible capital instruments, the related share premium accounts and subordinated long-term debt, certain loan loss provisions and noncontrolling interests that qualify for inclusion in consolidated T2. To qualify as T2 capital instruments or subordinated debt must have an original maturity of at least five years. Moreover, eligible capital instruments may inter alia not contain an incentive to redeem, a right of investors to accelerate repay-ment, or a credit sensitive dividend feature.
Capital instruments that no longer qualify as AT1 or T2 capital under the CRR/CRD 4 fully loaded rules are subject to grandfathering rules during transitional period and are phased out from 2013 to 2022 with their recognition capped at 70 % in 2015 and the cap decreasing by 10 % every year.
Capital Instruments
The 2014 Annual General Meeting granted our Management Board the authority to buy back up to 101.9 million shares before the end of April 2019. Thereof 51.0 million shares can be purchased by using derivatives. These authorizations replaced the authorizations of the 2013 Annual General Meeting. We have received approval from the BaFin for the execution of these authorizations for 2014 as required under new CRR/CRD 4 rules. During the period from the 2014 Annual General Meeting until the 2015 Annual General Meeting (May 21, 2015), we purchased 25.6 million shares. The shares purchased were used for equity compensation purposes in the same period so that the number of shares held in Treasury from buybacks was 0.2 million as of the 2015 Annual General Meeting.
Our Management Board received approval from the 2015 Annual General Meeting to buy back up to 137.9 million shares before the end of April 2020. Thereof 69.0 million shares can be purchased by using derivatives. These authori-zations substitute the authorizations of the previous year. We have received approval from the BaFin for share buy-backs for 2015 according to new CRR/CRD 4 rules. During the period from the 2015 Annual General Meeting until December 31, 2015, 20.7 million shares have been purchased, of which 4.7 million shares through exercise of call options. The shares purchased were used for equity compensation purposes in the same period so that the number of shares held in Treasury from buybacks was 0.3 million as of December 31, 2015. For 2016, we have received approval from the ECB for share buybacks according to new CRR/CRV 4 rules up to a maximum amount of 28 million shares.
Until the 2015 Annual General meeting, the authorized capital available to the Management Board was € 257 million (100 million shares). The conditional capital stood at € 486 million (190 million shares). Moreover, the 2014 Annual General Meeting authorized the issuance of participatory notes for the purpose of Additional Tier 1 capital.
New authorized capital of € 1,760 million (688 million shares) replacing old authorizations has been approved by the 2015 Annual General Meeting and the new authorizations have been legally registered. The conditional capital remains unchanged at € 486 million (190 million shares).
Our legacy Hybrid Tier 1 capital instruments (substantially all noncumulative trust preferred securities) are no longer fully recognized under fully loaded CRR/CRD 4 rules, mainly because they have no write-down or equity conversion feature. However, they are to a large extent recognized as Additional Tier 1 capital under CRR/CRD 4 transitional provisions and can still be partially recognized as Tier 2 capital under the fully loaded CRR/CRD 4 rules. During the transitional phase-out period the maximum recognizable amount of Additional Tier 1 instruments from Basel 2.5 com-pliant issuances as of December 31, 2012 will be reduced at the beginning of each financial year by 10 % or € 1.3 billion, through 2022. For December 31, 2015, this resulted in eligible Additional Tier 1 instruments of € 11.1 billion (i.e. € 4.6 billion newly issued AT1 Notes plus € 6.5 billion of legacy Hybrid Tier 1 instruments recogniz-able during the transition period). Eight Hybrid Tier 1 capital instruments with a notional of € 4.7 billion and an eligible equivalent amount of € 4.4 billion have been called in 2015. € 5.9 billion of the legacy Hybrid Tier 1 instruments can still be recognized as Tier 2 capital under the fully loaded CRR/CRD 4 rules.
127 Deutsche Bank Operating and Financial Review – 30 Employees – 230 Annual Report 2015 Outlook – 70 Internal Control over Financial Reporting – 235 Risk and Opportunities – 77 Information pursuant to Section – 315 (4)
Risk Report – 79 of the German Commercial Code and
► Risk and Capital Performance Explanatory Report – 239 Compensation Report – 188 Corporate Responsibility – 228
On February 17, 2015, we issued new fixed rate subordinated Tier 2 notes with an aggregate amount of € 1.25 billion. The notes pay a coupon of 2.75 %, have a denomination of € 1,000 and are due February 17, 2025. They were issued in transactions outside of the United States not subject to the registration requirements of the Securities Act of 1933, as amended, and were not offered or sold in the United States.
On April 1, 2015, we issued new fixed rate subordinated Tier 2 notes with an aggregate amount of U.S.$ 1.50 billion. The notes pay a coupon of 4.50 %, have a denomination of U.S.$ 200,000 and integral multiples of U.S.$ 1,000 in excess thereof and are due April 1, 2025. They were issued as transactions under the registration requirements of the US Securities Act of 1933.
Furthermore, we issued new callable fixed to fixed reset rate subordinated Tier 2 notes with an aggregate amount of CNY 1.41 billion on April 10, 2015. The notes have a denomination of CNY 1,000,000 and are due April 10, 2025. They were issued in transactions outside of the United States, not subject to the registration requirements of the US Securi-ties Act of 1933, as amended, and were not offered or sold in the United States.
The total of our Tier 2 capital instruments as of December 31, 2015 recognized during the transition period under CRR/CRD 4 was € 6.6 billion. As of December 31, 2015, there are no further legacy Hybrid Tier 1 instruments that are counted as Tier 2 capital under transitional rules. The gross notional value of the Tier 2 capital instruments was € 8.0 billion. Four Tier 2 capital instruments with a notional of € 0.7 billion and an eligible equivalent amount of € 0.2 billion have been called in 2015.
Minimum capital requirements and additional capital buffers
The CET 1 minimum capital requirements applicable to the Group increased from 4 % of risk-weighted assets (RWA) in 2014 to 4.5 % of RWA from 2015 onwards. The total capital requirement of 8 % demands further resources that may be met with up to 1.5 % AT1 capital and up to 2 % Tier 2 capital from 2015 onwards.
Failure to meet minimum capital requirements can result in supervisory measures such as restrictions of profit distribu-tions or limitations on certain businesses such as lending. We complied with the regulatory capital adequacy require-ments in 2015. Our subsidiaries which were not included in our regulatory consolidation due to their immateriality did not have to comply with own minimum capital standards in 2015.
In addition to these minimum capital requirements, the following capital buffer requirements will be phased-in starting 2016 (other than the systemic risk buffer, if any, which is not subject to any phase-in) and will become fully effective from 2019 onwards. The buffer requirements must be met in addition to the minimum capital requirements, but can be drawn down in times of economic stress.
In March 2015, Deutsche Bank was designated as a global systemically important institution (G-SII) by the German Federal Financial Supervisory Authority (BaFin) in agreement with the Deutsche Bundesbank resulting in a G-SII buffer requirement of 2 % CET 1 capital of RWA in 2019. This is in line with the Financial Stability Board (FSB) assessment of systemic importance based on the indicators as published in 2014. The additional buffer requirement of 2 % for G-SIIs will be phased in starting 2016 with 0.5 %. We will continue to publish our indicators on our website.
The capital conservation buffer is implemented in Section 10c German Banking Act, based on Article 129 CRD 4 and equals a requirement of 2.5 % CET 1 of RWA. The additional buffer requirement of 2.5 % will be phased in starting 2016 with 0.625 %.
The countercyclical capital buffer is deployed in a jurisdiction when excess credit growth is associated with an in-crease in system wide risk. It may vary between 0 % and 2.5 % CET 1 of RWA by 2019. In exceptional cases, it could also be higher than 2.5 %. The institution-specific countercyclical buffer that applies to Deutsche Bank is the weighted average of the countercyclical capital buffers that apply in the jurisdictions where our relevant credit exposures are located. No institution-specific countercyclical buffer applied to Deutsche Bank in 2015. The countercyclical capital buffer is expected to be insignificant in 2016.

Deutsche Bank 1 – Management Report 128Annual Report 2015
In addition to the aforementioned buffers, national authorities, such as the BaFin, may require a systemic risk buffer to prevent and mitigate long-term non-cyclical systemic or macro-prudential risks that are not covered by the CRR. They can require an additional buffer of up to 5 % CET 1 of RWA. It is to be noted that unless certain exceptions apply only the higher of the systemic risk buffer and the G-SII buffer must be applied. As of year-end 2015, no systemic risk buffer applied to Deutsche Bank.
The following graph gives an overview of the different minimum capital requirements and capital buffer requirements:
Overview total capital requirements and capital buffers
In addition, pursuant to the Supervisory Review and Evaluation Process (SREP), the ECB may impose capital re-quirements on individual banks which are more stringent than statutory requirements. On February 20, 2015, the ECBnotified us that we are required to maintain a CET 1 ratio of at least 10.00 % (on a phase-in basis) going forward. OnDecember 4, 2015, the ECB informed Deutsche Bank that the consolidated Group has to keep a CET 1 ratio of atleast 10.25 % on a phase-in basis under applicable transitional rules under CRR/CRD 4 at all times. This requirementincludes the capital conservation buffer, but does not include all other buffers (e.g. the G-SII buffer).
Consequently, in December 2015 our SREP CET 1 requirements amounted to 10.25 %. Considering the phasing of theG-SII buffer but not the countercyclical buffer, our 2016 SREP CET 1 requirements increase to 10.75 %.
5
0
10
15
Capital requirements in % of RWA
20
2013 2014 2015 2016 2017 2018 2019
2.0
2.0
4.0
8.0 8.0
13.0
14.75
16.5
18.25
20.0
4.0
1.5
2.5
4.5
1.5
2.0
4.5
1.5
2.00.5
0.6250.625
4.5
1.5
2.0
1.01.251.25
4.5
1.5
2.0
1.5
1.875
1.875
5.0
5.0
5.0
5.0
4.5
1.5
2.0
2.0
2.5
2.5
5.0
Institution-specific countercyclical capital buffer (0-2.5%)Systemic risk buffer (0-5%)(no phase-in)
Capital conservation bufferG-SII buffer (1-2.5%) (currently 2%)Tier 2 capitalAdditional Tier 1 capitalCommon Equity Tier 1 capital
Usually onlyhigher of

129 Deutsche Bank Operating and Financial Review – 30 Employees – 230 Annual Report 2015 Outlook – 70 Internal Control over Financial Reporting – 235 Risk and Opportunities – 77 Information pursuant to Section – 315 (4)
Risk Report – 79 of the German Commercial Code and
► Risk and Capital Performance Explanatory Report – 239 Compensation Report – 188 Corporate Responsibility – 228
Development of regulatory capital
Our CRR/CRD 4 Tier 1 capital as of December 31, 2015 amounted to € 58.2 billion, consisting of a Common Equity Tier 1 (CET 1) capital of € 52.4 billion and Additional Tier 1 (AT1) capital of € 5.8 billion. The CRR/CRD 4 Tier 1 capital was € 5.7 billion lower than at the end of 2014, primarily driven by a decrease in CET 1 capital of € 7.7 billion since year end 2014 while AT1 capital increased by € 2.0 billion in the same period.
The € 7.7 billion decrease of CRR/CRD 4 CET 1 capital was largely the result of the net loss attributable to Deutsche Bank shareholders and additional equity components of € 6.8 billion in 2015. The € 5.8 billion net loss attributable to the impairment of goodwill and other intangible assets in the third quarter of 2015 was to the extent neutral to which goodwill and other intangible assets were deducted from CET 1 and AT1 capital on a phase-in basis before the im-pairment. The Decision (EU) (2015/4) of the ECB enforces the recognition of the year end loss in CET 1 capital. Deutsche Bank’s revised common share dividend policy refers to the ECB decision as long as the Management Board does not decide and officially announce a different dividend level for the respective year. Following the announcement in 2015 to pay no dividend to common shareholders, no common share dividend has been accrued for 2015. The decrease in CET 1 capital was furthermore driven by the first-time consideration of additional value adjustments (based on the Regulatory Technical Standard on prudent valuation issued by the EBA) in September 30, 2015. Additional value adjustments amounted to € 1.9 billion as per December 31, 2015. The effect on CRR/CRD 4 CET 1 capital was partly compensated by a benefit from the related reduction of the negative amounts resulting from the calculation of expected loss amounts. Deductions of deferred tax assets increased by € 1.0 billion in 2015 mainly as a result of higher deferred tax assets largely due to the net loss as well as threshold effects under the 10/15 % rule. Overall, regulatory adjustments increased due the higher phase-in rate of 40 % in 2015 compared to 20 % in 2014. CRR/CRD 4 CET 1 capital was positively impacted by Currency Translation Adjustments of € 2.0 billion and further positive foreign ex-change effects in 2015.
The € 2.0 billion increase in CRR/CRD 4 AT1 capital was mainly the result of reduced regulatory adjustments (€ 5.5 billion lower than at year end 2014, also impacted by the impairments of goodwill and other intangible assets) that were phased out from AT1 capital. These deductions reflect the residual amount of certain CET 1 deductions that are subtracted from CET 1 capital under fully loaded rules, but are allowed to reduce AT1 capital during the transitional period. The phase-in rate for these deductions on the level of CET 1 capital increased to 40 % in 2015 (20 % in 2014) and decreased correspondingly on the level of AT1 capital to 60 % in 2015 (80 % in 2014). The reduction of regulatory adjustments on the level of AT1 capital over-compensated the decrease in our CRR/CRD 4 AT1 capital instruments of € 3.5 billion (compared to December 31, 2014) that resulted mainly from our redemptions of legacy Hybrid Tier 1 capi-tal instruments.
Our fully loaded CRR/CRD 4 Tier 1 capital as of December 31, 2015 was € 48.7 billion, compared to € 50.7 billion at the end of 2014. Our fully loaded CRR/CRD 4 CET 1 capital amounted to € 44.1 billion as of December 31, 2015, compared to € 46.1 billion as of December 31, 2014. Our fully loaded CRR/CRD 4 Additional Tier 1 capital amounted to € 4.6 billion as per end of December 2015, nearly unchanged compared to year end 2014.
The decrease of our fully loaded CET 1 capital of € 2.0 billion compared to year end 2014 was due to the fact that the negative impacts (net loss of € 6.8 billion, first-time prudent valuation deduction of € 1.9 billion) were partially reduced by positive counter-effects. These constitute predominantly lower deductions of goodwill and other intangible assets mainly due to impairments (€ 4.5 billion lower deduction compared to year end 2014), a reduced deduction of negative amounts from the calculation of expected loss amounts (€ 0.6 billion lower deduction compared to year end 2014 as a consequence of the prudent valuation assessment) and a positive impact from the change of the foreign currency exchange rates since year end 2014.

Deutsche Bank 1 – Management Report 130Annual Report 2015
Transitional template for regulatory capital, RWA and capital ratios Dec 31, 2015 Dec 31, 2014
in € m. CRR/CRD 4 fully-loaded CRR/CRD 4
CRR/CRD 4 fully loaded CRR/CRD 4
Common Equity Tier 1 (CET 1) capital: instruments and reserves Capital instruments and the related share premium accounts 37,088 37,088 37,144 37,144 Retained earnings 27,607 27,607 26,509 26,509 Accumulated other comprehensive income (loss), net of tax 4,096 4,281 1,617 1,923 Independently reviewed interim profits net of any foreseeable charge or dividend (7,025) (7,025) 481 481 Other 0 92 0 118
Common Equity Tier 1 (CET 1) capital before regulatory adjustments 61,766 62,042 65,750 66,175
Common Equity Tier 1 (CET 1) capital: regulatory adjustments Additional value adjustments (negative amount) (1,877) (1,877) 0 0 Other prudential filters (other than additional value adjustments) (622) (330) (725) (391) Goodwill and other intangible assets (net of related tax liabilities) (negative amount) (8,439) (3,376) (12,979) (2,596) Deferred tax assets that rely on future profitability excluding those arising from temporary differences (net of related tax liabilities where the conditions in Art. 38 (3)CRR are met) (negative amount) (3,310) (1,324) (2,620) (524) Negative amounts resulting from the calculation of expected loss amounts (106) (58) (712) (147) Defined benefit pension fund assets (negative amount) (1,173) (469) (961) (192) Direct, indirect and synthetic holdings by an institution of own CET 1 instruments (negative amount) (76) (39) (54) (11) Direct, indirect and synthetic holdings by the institution of the CET 1 instruments of financial sector entities where the institution has a significant investment in those entities (amount above the 15 % threshold and net of eligible short positions) (nega-tive amount) (818) (278) (499) (84) Deferred tax assets arising from temporary differences (net of related tax liabilities where the conditions in Art. 38 (3) CRR are met) (amount above the 15 % thresh-old) (negative amount) (953) (324) (778) (133) Other regulatory adjustments (291) (1,537) (345) (1,994)
Total regulatory adjustments to Common Equity Tier 1 (CET 1) capital (17,665) (9,613) (19,674) (6,072) Common Equity Tier 1 (CET 1) capital 44,101 52,429 46,076 60,103
Additional Tier 1 (AT1) capital: instruments Capital instruments and the related share premium accounts 4,676 4,676 4,676 4,676 Amount of qualifying items referred to in Art. 484 (4) CRR and the related share premium accounts subject to phase out from AT1 N/M 6,482 N/M 10,021
Additional Tier 1 (AT1) capital before regulatory adjustments 4,676 11,157 4,676 14,696
Additional Tier 1 (AT1) capital: regulatory adjustments Direct, indirect and synthetic holdings by an institution of own AT1 instruments (negative amount) (125) (48) (57) (57) Residual amounts deducted from AT1 capital with regard to deduction from CET 1 capital during the transitional period pursuant to Art. 472 CRR N/M (5,316) N/M (10,845) Other regulatory adjustments 0 0 0 0
Total regulatory adjustments to Additional Tier 1 (AT1) capital (125) (5,365) (57) (10,902) Additional Tier 1 (AT1) capital 4,551 5,793 4,619 3,794 Tier 1 capital (T1 = CET 1 + AT1) 48,651 58,222 50,695 63,898
Tier 2 (T2) capital 12,325 6,299 12,376 4,395 Total capital (TC = T1 + T2) 60,976 64,522 63,072 68,293 Total risk-weighted assets 396,714 397,382 393,969 396,648
Capital ratios Common Equity Tier 1 capital ratio (as a percentage of risk-weighted assets) 11.1 13.2 11.7 15.2 Tier 1 capital ratio (as a percentage of risk-weighted assets) 12.3 14.7 12.9 16.1 Total capital ratio (as a percentage of risk-weighted assets) 15.4 16.2 16.0 17.2

131 Deutsche Bank Operating and Financial Review – 30 Employees – 230 Annual Report 2015 Outlook – 70 Internal Control over Financial Reporting – 235 Risk and Opportunities – 77 Information pursuant to Section – 315 (4)
Risk Report – 79 of the German Commercial Code and ► Risk and Capital Performance Explanatory Report – 239
Compensation Report – 188 Corporate Responsibility – 228
Reconciliation of shareholders’ equity to regulatory capital Dec 31, 2015 Dec 31, 2014
in € m. CRR/CRD 4 CRR/CRD 4 Total shareholders’ equity per accounting balance sheet 62,678 68,351 Deconsolidation/Consolidation of entities (681) (1,419)
Thereof: Additional paid-in capital (5) (5)Retained earnings (369) (1,107)Accumulated other comprehensive income (loss), net of tax (307) (306)
Total shareholders' equity per regulatory balance sheet 61,997 66,932 Noncontrolling interest based on transitional rules 92 118 Accrual for dividend and AT1 coupons (231) (1,182)Reversal of deconsolidation/consolidation of the position Accumulated other comprehensive income (loss), net of tax, during transitional period 184 306 Common Equity Tier 1 (CET 1) capital before regulatory adjustments 62,042 66,175 Additional value adjustments (1,877) 0 Other prudential filters (other than additional value adjustments) (330) (391)Regulatory adjustments relating to unrealized gains and losses pursuant to Art. 467 and 468 CRR (1,246) (1,648)Goodwill and other intangible assets (net of related tax liabilities) (3,376) (2,596)Deferred tax assets that rely on future profitability (1,648) (657)Defined benefit pension fund assets (469) (192)Direct, indirect and synthetic holdings by the institution of the CET 1 instruments of financial sector entities where the institution has a significant investment in those entities (278) (84)Other regulatory adjustments (389) (503)Common Equity Tier 1 capital 52,429 60,103
Development of regulatory capital CRR/CRD 4
in € m. Dec 31, 2015 Dec 31, 2014 Common Equity Tier 1 (CET 1) capital - opening amount 60,103 38,534
Common shares, net effect 0 921 Additional paid-in capital (53) 7,429 Retained earnings (6,097) 1,077 Common shares in treasury, net effect/(+) sales (–) purchase (3) 6 Movements in accumulated other comprehensive income 2,759 2,947 Accrual for dividend and AT1 coupons (231) (1,182)Additional value adjustments (1,877) 0 Goodwill and other intangible assets (net of related tax liabilities) (780) 8,870 Deferred tax assets that rely on future profitability (excluding those arising from temporary differences) (800) (524)Negative amounts resulting from the calculation of expected loss amounts 89 283 Defined benefit pension fund assets (277) (192)Direct, indirect and synthetic holdings by the institution of the CET 1 instruments of financial sector entities where the institution has a significant investment in those entities (194) 1,505 Securitization positions not included in risk-weighted assets 0 945 Deferred tax assets arising from temporary differences (amount above 10 % and 15 % threshold, net of related tax liabilities where the conditions in Art. 38 (3) CRR are met) (191) (133)Other, including regulatory adjustments (19) (383)
Common Equity Tier 1 (CET 1) capital - closing amount 52,429 60,103 Additional Tier 1 (AT1) Capital – opening amount 3,794 12,182
New Additional Tier 1 eligible capital issues 0 0 Matured and called instruments (4,289) (2,512)Transitional arrangements 5,529 (11,292)
Thereof: Goodwill and other intangible assets (net of related tax liabilities) 5,320 (10,383)
Other, including regulatory adjustments 759 5,416 Additional Tier 1 (AT1) Capital – closing amount 5,793 3,794 Tier 1 capital 58,222 63,898 Tier 2 (T2) capital – closing amount 6,299 4,395 Total regulatory capital 64,522 68,293

Deutsche Bank 1 – Management Report 132Annual Report 2015
Development of risk-weighted assets
The table below provides an overview of RWA broken down by model approach and business division. They include the aggregated effects of the segmental reallocation of infrastructure related positions, if applicable, as well as realloca-tions between the segments.
Within credit risk, the line item “Other” in advanced IRBA reflects RWA from securitization positions in the banking book, specific equity positions and other non-credit obligation assets. Within the Standardized Approach, the line item “Other” includes RWA from banking book securitizations as well as exposures assigned to the further exposure classes apart from central governments or central banks, institutions, corporates and retail.
Risk-weighted assets by model approach and business division according to transitional rulesDec 31, 2015
in m.
CorporateBanking &Securities
Private &Business
Clients
GlobalTransaction
Banking
DeutscheAsset &Wealth
Management
on-CoreOperations
nit
Consolidation &Adjustments
and Other TotalCredit Risk 89,811 72,171 42,435 12,942 13,028 11, 33 242,019Segment reallocation (3,515) 53 4,854 37 7 (2,328) 0
Advanced IRBA 85,249 1, 55 32,253 10,34 7,858 12,8 2 210,223Central Governments and Central Banks 3,990 45 1,077 1 9,500 14, 19Institutions 8,497 1,303 3,472 140 382 355 14,149Corporates 59,482 11,3 9 2 ,837 3,945 2,944 882 105,459Retail 192 38,910 23 130 725 0 39,980Other 13,088 10,028 844 ,131 3,801 2,125 3 ,01
Foundation IRBA 2,083 3,07 174 0 0 0 5,333Central Governments and Central Banks 0 0 0 0 0 0 0Institutions 0 5 0 0 0 0 5Corporates 2,083 3,072 174 0 0 0 5,329
Standardized Approach 5,172 ,792 5,154 2,219 5,093 1,099 25,530Central Governments or Central Banks 24 14 30 2 0 0 202Institutions 539 8 33 11 2 0 71Corporates 2,473 1,441 3,511 1,147 739 573 9,884Retail 4,172 239 34 5 7 0 5,018Other 2,129 948 1,342 1,027 3,785 525 9,755
Risk exposure amount for default funds contributions 821 111 0 0 0 0 933
Settlement Risk 9 0 0 0 0 0 9Credit ValuationAdjustment (CVA) 12,012 434 2 347 3,083 0 15,877
Internal Model Approach 11,957 39 2 343 3,082 0 15,780Standardized Approach 55 38 0 4 1 0 97
Market Risk 33,795 32 173 1,2 8 14,28 0 49,553Internal Model Approach 28,77 0 173 373 8,741 0 38,0 3Standardized Approach 5,019 32 0 895 5,545 0 11,491
Operational Risk1 59,503 7, 44 9,45 9,252 4,0 9 0 89,923Advanced measurement approach 59,503 7, 44 9,45 9,252 4,0 9 0 89,923
Total 195,130 80,280 52,0 23,808 34,4 5 11, 33 397,3821 The movements for the business divisions are due to a change in the allocation methodology performed in the first quarter 2015.

133 Deutsche Bank Operating and Financial Review – 30 Employees – 230Annual Report 2015 Outlook – 70 Internal Control over Financial Reporting – 235
Risk and Opportunities – 77 Information pursuant to Section – 315 (4)Risk Report – 79 of the German Commercial Code and
Risk and Capital Performance Explanatory Report – 239Compensation Report – 188Corporate Responsibility – 228
Dec 31, 2014
in m.
CorporateBanking &Securities
Private &Business
Clients
GlobalTransaction
Banking
DeutscheAsset &Wealth
Management
on-CoreOperations
nit
Consolidation &Adjustments
and Other TotalCredit Risk 83,548 9,584 41,740 7,310 19,280 22, 244,128Segment reallocation (2,200) 520 3,327 330 94 (2,071) 0
Advanced IRBA 77,2 3 58,78 31,7 3 3,910 13,0 2 14, 38 199,422Central Governments and Central Banks 3,948 124 1,020 0 74 218 5,385Institutions 8,359 1,538 3,103 73 23 171 13,8 9Corporates 55, 78 9,938 2 ,91 2,740 5,0 2 1,199 101,533Retail 121 37,852 30 91 773 0 38,8 7Other 9,157 9,334 94 1,00 ,529 13,049 39,7 9
Foundation IRBA 2,079 3,303 107 0 1 0 5,491Central Governments and Central Banks 0 0 0 0 0 0 0Institutions 0 0 0 0 0 0 0Corporates 2,079 3,303 107 0 1 0 5,490
Standardized Approach 4,804 ,884 ,542 3,070 ,122 10,099 37,522Central Governments or Central Banks 21 3 27 3 0 0 114Institutions 593 124 51 4 3 35 810Corporates 2,841 1,401 4,747 1,111 1,075 584 11,759Retail 7 4,0 4 422 45 1,141 18 5, 97Other 1,341 1,232 1,29 1,908 3,903 9,4 2 19,142
Risk exposure amount for default funds contributions 1, 01 90 1 0 1 0 1, 93
Settlement Risk 25 0 0 0 0 1 27Credit ValuationAdjustment (CVA) 1 ,024 445 7 445 4,019 2 2 21,203
Internal Model Approach 15,953 417 7 443 3,953 1 20,774Standardized Approach 71 28 0 2 2 1 428
Market Risk 44,4 9 92 199 2,483 1 ,9 7 0 4,209Internal Model Approach 31,439 0 199 1,339 8, 25 0 41, 02Standardized Approach 13,029 92 0 1,144 8,342 0 22, 07
Operational Risk 31,512 9, 05 1,321 ,3 8 18,275 0 7,082Advanced measurement approach 31,512 9, 05 1,321 ,3 8 18,275 0 7,082
Total 175,578 79,725 43,2 8 1 , 07 58,541 22,929 39 , 48
The RWA according to CRR/CRD 4 were 397.4 billion as of December 31, 2015, compared with 39 . billion at the end of 2014. The overall increase of 0.8 billion largely reflects an increase in operational risk RWA assets of 22.8 billion that is offset by reductions in the other risk categories. Operational Risk RWA are up primarily due to legal
operational risk losses including legal provisions as well as an increased operational risk loss profile of the banking industry. Credit Risk RWA are 2.1 billion lower mainly as a result of a revised treatment of pension fund exposure calculation as well as de-risking activities partly offset by increases from foreign exchange movements. The lower RWA for market risk are largely attributable to lower risk levels coming from the market risk standardized approach for secu-ritisation positions. The 5.3 billion reduction in RWA for CVA is mainly driven by de-risking and hedging activities.
RWA calculated on CRR/CRD 4 fully loaded basis were 39 .7 billion as of December 31, 2015 compared with 394.0 billion at the end of 2014. The increase was driven by the same movements as outlined for transitional rules.
The fully loaded RWA were 8 million lower than the risk-weighted assets under the transitional rules due to lower risk-weighted assets coming from our deferred tax assets that arise from temporary differences and from our significant holdings of CET 1 instruments of financial sector entities, which are both subject to the threshold exemptions as out-lined in Article 48 CRR.
More specifically the following key drivers of RWA movements have been observed.
Credit Risk RWA decreased by 0.9 or 2.1 billion, reflecting:
Deutsche Bank 1 – Management Report 134Annual Report 2015
‒ Book size, reflecting organic changes in our portfolio size and composition, decreased by € 4.8 billion in 2015, com-pared to a decline of € 5 billion in 2014. This decline was primarily driven by derivatives and security financing transaction positions mainly in our Core Bank reflecting de-risking activities.
‒ Methodology and policy, reflecting RWA movements resulting from externally, regulatory-driven changes, de-creased by € 3.3 billion in 2015, compared to an increase of € 24 billion in 2014, mainly as a result from the applica-tion of a revised treatment to defined benefit pension fund exposure, partly offset by a change in the applicable risk weight exposure to insurance companies.
‒ Book quality, representing the effects from portfolio rating migrations, loss given default, model parameter recalibra-tions as well as collateral coverage activities, decreased by € 2.1 billion in 2015, compared to € 2.3 billion in 2014, driven by improvements in the underlying exposure risk profile partly offset by the impact from recalibrations of risk parameter and process enhancements.
‒ The decrease in the category “Other”, which represents changes not included in the other categories described in this paragraph, of € 2.7 billion in 2015, compared to an increase of € 5.0 billion in 2014, was mainly driven by movements resulting from the transitional treatment of our defined benefit pension fund assets as well as from movements applying the 10/15 % threshold rule.
‒ Credit Risk RWA were also impacted by foreign exchange movements € 10.4 billion in 2015, compared to € 11.8 billion in 2014, mainly resulting from a strengthening US Dollar.
Market Risk RWA decreased by 23 % or € 14.7 billion, reflecting:
‒ Movements in risk levels, reflecting movements in our internal models for value-at-risk, stressed value-at-risk, in-cremental risk charge and comprehensive risk measure as well as results from the market risk standardized ap-proach, contributed to € 27.7 billion in 2015, compared to a decline of € 10.2 billion in 2014, and were predominantly due to lower risk levels in the Market Risk Standard Approach, Value-at-Risk, Stressed Value-at-Risk and Incremen-tal Risk Charge components, mainly reflecting de-risking activities in the Non-Core Operations Unit (which particu-larly impacted the Market Risk Standardized Approach).
‒ Offsetting effects in the category methodology and policy, representing changes in our internal models, such as methodology enhancements, of € 5.7 billion in 2015, compared to € 20.1 billion in 2014, resulted from the termina-tion of the transitional period granted by Article 337 (4) CRR for the Market Risk Standardized Approach, as well as in market data changes and recalibrations by € 3.9 billion. As a result, the calculation is now based on the sum of the weighted net long positions and the sum of the weighted net short positions rather than the larger of the two sums.
‒ Market data changes, resulting from fluctuations in market data levels, volatilities, correlations, liquidity and ratings, resulted in a market risk RWA impact of € 3.9 billion, compared to a decrease of € 0.7 billion in 2014.
‒ Market risk RWA were also impacted by foreign exchange movements of € 1.9 billion compared to € 2.7 billion in 2014, which were predominately reflected in the Market Risk Standardized Approach.
Operational Risk RWA increased by 34 % or € 22.8 billion reflecting:
‒ Loss profile changes (internal and external) contributed € 24.2 billion in 2015, compared to € 9.3 billion in 2014, mainly driven by the early recognition of enhancements to our Advanced Measurement Approach model (contrib-uting additional RWA of € 7.7 billion), further effects from a model change related to reasonable possible litigation losses and by large external market operational risk events, which are reflected in our AMA model, such as settle-ments of regulatory matters by financial institutions. From the third quarter 2014, further effects from the model change related to reasonably possible litigation losses are shown under the category “loss profile changes”.
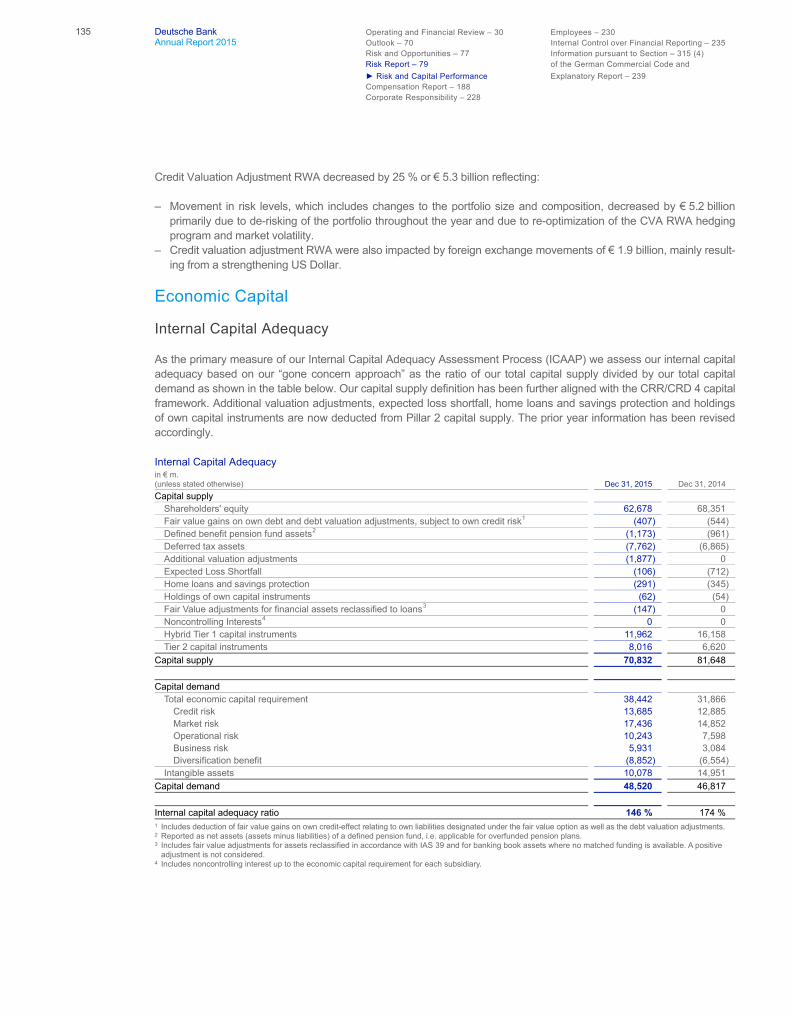
135 Deutsche Bank Operating and Financial Review – 30 Employees – 230 Annual Report 2015 Outlook – 70 Internal Control over Financial Reporting – 235 Risk and Opportunities – 77 Information pursuant to Section – 315 (4)
Risk Report – 79 of the German Commercial Code and ► Risk and Capital Performance Explanatory Report – 239
Compensation Report – 188 Corporate Responsibility – 228
Credit Valuation Adjustment RWA decreased by 25 % or € 5.3 billion reflecting:
‒ Movement in risk levels, which includes changes to the portfolio size and composition, decreased by € 5.2 billion primarily due to de-risking of the portfolio throughout the year and due to re-optimization of the CVA RWA hedging program and market volatility.
‒ Credit valuation adjustment RWA were also impacted by foreign exchange movements of € 1.9 billion, mainly result-ing from a strengthening US Dollar.
Economic Capital
Internal Capital Adequacy
As the primary measure of our Internal Capital Adequacy Assessment Process (ICAAP) we assess our internal capital adequacy based on our “gone concern approach” as the ratio of our total capital supply divided by our total capital demand as shown in the table below. Our capital supply definition has been further aligned with the CRR/CRD 4 capital framework. Additional valuation adjustments, expected loss shortfall, home loans and savings protection and holdings of own capital instruments are now deducted from Pillar 2 capital supply. The prior year information has been revised accordingly.
Internal Capital Adequacy in € m. (unless stated otherwise) Dec 31, 2015 Dec 31, 2014 Capital supply
Shareholders' equity 62,678 68,351 Fair value gains on own debt and debt valuation adjustments, subject to own credit risk1 (407) (544) Defined benefit pension fund assets2 (1,173) (961) Deferred tax assets (7,762) (6,865) Additional valuation adjustments (1,877) 0 Expected Loss Shortfall (106) (712) Home loans and savings protection (291) (345) Holdings of own capital instruments (62) (54) Fair Value adjustments for financial assets reclassified to loans3 (147) 0 Noncontrolling Interests4 0 0 Hybrid Tier 1 capital instruments 11,962 16,158 Tier 2 capital instruments 8,016 6,620
Capital supply 70,832 81,648
Capital demand Total economic capital requirement 38,442 31,866
Credit risk 13,685 12,885 Market risk 17,436 14,852 Operational risk 10,243 7,598 Business risk 5,931 3,084 Diversification benefit (8,852) (6,554)
Intangible assets 10,078 14,951 Capital demand 48,520 46,817
Internal capital adequacy ratio 146 % 174 % 1 Includes deduction of fair value gains on own credit-effect relating to own liabilities designated under the fair value option as well as the debt valuation adjustments. 2 Reported as net assets (assets minus liabilities) of a defined pension fund, i.e. applicable for overfunded pension plans. 3 Includes fair value adjustments for assets reclassified in accordance with IAS 39 and for banking book assets where no matched funding is available. A positive
adjustment is not considered. 4 Includes noncontrolling interest up to the economic capital requirement for each subsidiary.
Deutsche Bank 1 – Management Report 136Annual Report 2015
A ratio of more than 100 % signifies that the total capital supply is sufficient to cover the capital demand determined by the risk positions. This ratio was 146 % as of December 31, 2015, compared with 174 % as of December 31, 2014. The change of the ratio was driven by a decrease in capital supply and a higher economic capital usage. Shareholders’ equity decreased by € 5.7 billion mainly driven by goodwill impairments. Hybrid Tier 1 capital instruments decreased by € 4.2 billion mainly driven by called capital instruments. Tier 2 capital instruments increased by 1.4 billion mainly due to the issuance of new instruments. The increase in capital demand was driven by higher economic capital requirement as explained in the section “Risk Profile”, partly offset by a decrease in intangible assets due to goodwill impairments as explained in the section “Goodwill and Other Intangible Assets”.
The above capital adequacy measures apply to the consolidated Group as a whole (including Postbank) and form an integral part of our Risk and Capital Management framework.
Leverage Ratio
We manage our balance sheet on a Group level and, where applicable, locally in each region. In the allocation of finan-cial resources we favour business portfolios with the highest positive impact on our profitability and shareholder value. We monitor and analyze balance sheet developments and track certain market-observed balance sheet ratios. Based on this we trigger discussion and management action by the Capital and Risk Committee. Following the publication of the CRR/CRD 4 framework, we established a leverage ratio calculation according to that framework.
Leverage Ratio according to revised CRR/CRD 4 framework (fully loaded)
The CRR/CRD 4 framework introduced a non-risk based leverage ratio that is intended to act as a supplementary measure to the risk based capital requirements. Its objectives are to constrain the build-up of leverage in the banking sector, helping avoid destabilizing deleveraging processes which can damage the broader financial system and the economy, and to reinforce the risk based requirements with a simple, non-risk based “backstop” measure.
We calculate our leverage ratio exposure on a fully loaded basis in accordance with Art. 429 of the CRR as per Dele-gated Regulation (EU) 2015/62 of 10 October 2014 published in the Official Journal of the European Union on January 17, 2015 amending Regulation (EU) No 575/2013.
Our total leverage ratio exposure consists of the components derivatives, securities financing transactions (SFTs), off-balance sheet exposure and other on-balance sheet exposure (excluding derivatives and SFTs).
The leverage exposure for derivatives is calculated by using the regulatory mark-to-market method for derivatives comprising the current replacement cost plus a regulatory defined add-on for the potential future exposure. Variation margin received in cash from counterparties is deducted from the current replacement cost portion of the leverage ratio exposure measure and variation margin paid to counterparties is deducted from the leverage ratio exposure measure related to receivables recognized as an asset on the balance sheet, provided certain conditions are met. The effective notional amount of written credit derivatives, i.e., the notional reduced by any negative fair value changes that have been incorporated in Tier 1 capital is included in the leverage ratio exposure measure; the resulting exposure measure is further reduced by the effective notional amount of a purchased credit derivative on the same reference name pro-vided certain conditions are met.
The SFT component includes the gross receivables for SFTs, which are netted with SFT payables if specific conditions are met. In addition to the gross exposure a regulatory add-on for the counterparty credit risk is included.
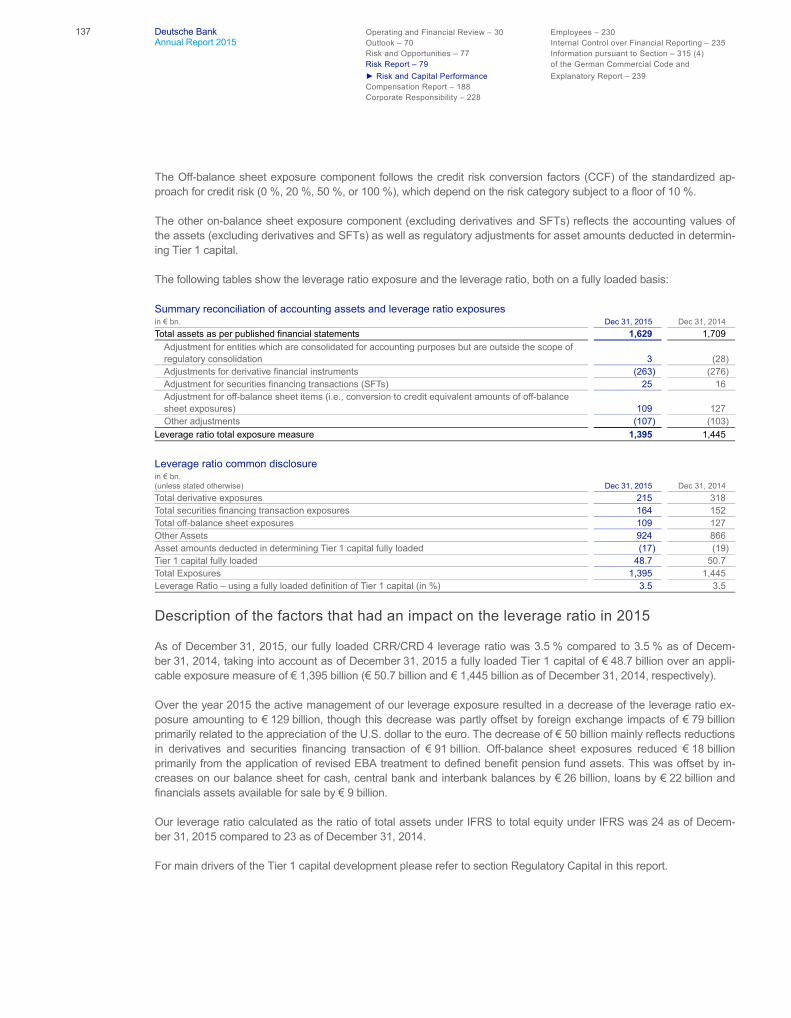
137 Deutsche Bank Operating and Financial Review – 30 Employees – 230 Annual Report 2015 Outlook – 70 Internal Control over Financial Reporting – 235 Risk and Opportunities – 77 Information pursuant to Section – 315 (4)
Risk Report – 79 of the German Commercial Code and ► Risk and Capital Performance Explanatory Report – 239
Compensation Report – 188 Corporate Responsibility – 228
The Off-balance sheet exposure component follows the credit risk conversion factors (CCF) of the standardized ap-proach for credit risk (0 %, 20 %, 50 %, or 100 %), which depend on the risk category subject to a floor of 10 %.
The other on-balance sheet exposure component (excluding derivatives and SFTs) reflects the accounting values of the assets (excluding derivatives and SFTs) as well as regulatory adjustments for asset amounts deducted in determin-ing Tier 1 capital.
The following tables show the leverage ratio exposure and the leverage ratio, both on a fully loaded basis:
Summary reconciliation of accounting assets and leverage ratio exposures in € bn. Dec 31, 2015 Dec 31, 2014 Total assets as per published financial statements 1,629 1,709
Adjustment for entities which are consolidated for accounting purposes but are outside the scope of regulatory consolidation 3 (28) Adjustments for derivative financial instruments (263) (276) Adjustment for securities financing transactions (SFTs) 25 16 Adjustment for off-balance sheet items (i.e., conversion to credit equivalent amounts of off-balance sheet exposures) 109 127 Other adjustments (107) (103)
Leverage ratio total exposure measure 1,395 1,445
Leverage ratio common disclosure in € bn. (unless stated otherwise) Dec 31, 2015 Dec 31, 2014 Total derivative exposures 215 318 Total securities financing transaction exposures 164 152 Total off-balance sheet exposures 109 127 Other Assets 924 866 Asset amounts deducted in determining Tier 1 capital fully loaded (17) (19) Tier 1 capital fully loaded 48.7 50.7 Total Exposures 1,395 1,445 Leverage Ratio – using a fully loaded definition of Tier 1 capital (in %) 3.5 3.5
Description of the factors that had an impact on the leverage ratio in 2015
As of December 31, 2015, our fully loaded CRR/CRD 4 leverage ratio was 3.5 % compared to 3.5 % as of Decem-ber 31, 2014, taking into account as of December 31, 2015 a fully loaded Tier 1 capital of € 48.7 billion over an appli-cable exposure measure of € 1,395 billion (€ 50.7 billion and € 1,445 billion as of December 31, 2014, respectively).
Over the year 2015 the active management of our leverage exposure resulted in a decrease of the leverage ratio ex-posure amounting to € 129 billion, though this decrease was partly offset by foreign exchange impacts of € 79 billion primarily related to the appreciation of the U.S. dollar to the euro. The decrease of € 50 billion mainly reflects reductions in derivatives and securities financing transaction of € 91 billion. Off-balance sheet exposures reduced € 18 billion primarily from the application of revised EBA treatment to defined benefit pension fund assets. This was offset by in-creases on our balance sheet for cash, central bank and interbank balances by € 26 billion, loans by € 22 billion and financials assets available for sale by € 9 billion.
Our leverage ratio calculated as the ratio of total assets under IFRS to total equity under IFRS was 24 as of Decem-ber 31, 2015 compared to 23 as of December 31, 2014.
For main drivers of the Tier 1 capital development please refer to section Regulatory Capital in this report.
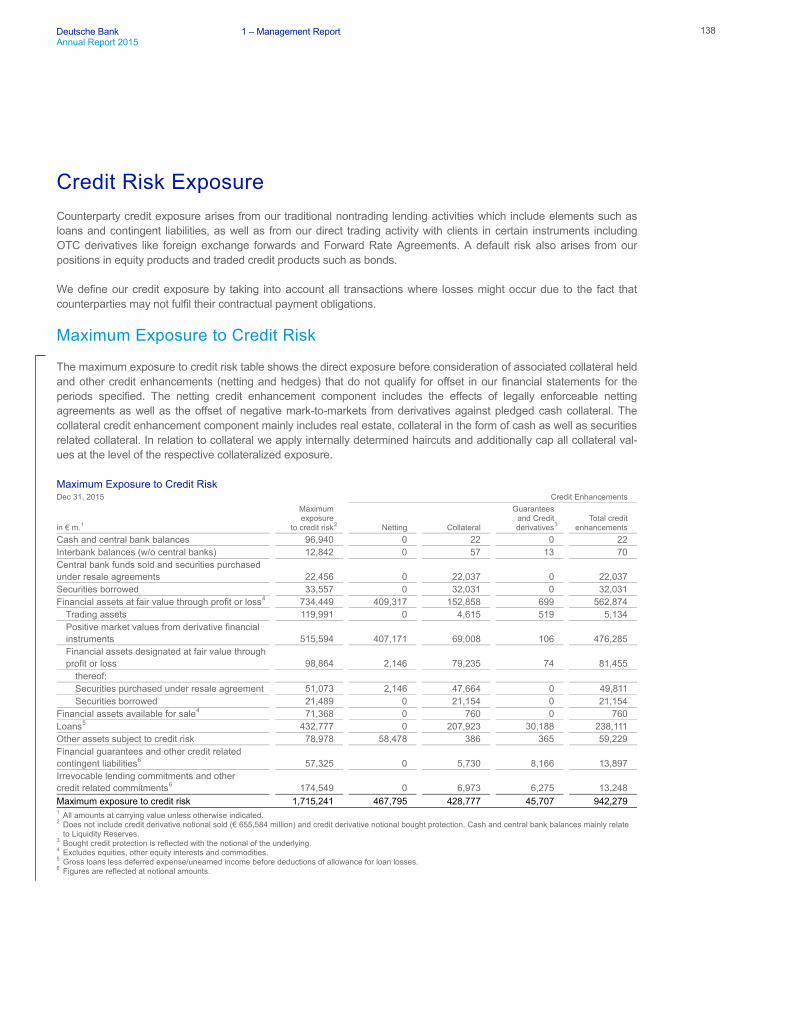
Deutsche Bank 1 – Management Report 138Annual Report 2015
Credit Risk Exposure Counterparty credit exposure arises from our traditional nontrading lending activities which include elements such as loans and contingent liabilities, as well as from our direct trading activity with clients in certain instruments including OTC derivatives like foreign exchange forwards and Forward Rate Agreements. A default risk also arises from our positions in equity products and traded credit products such as bonds.
We define our credit exposure by taking into account all transactions where losses might occur due to the fact that counterparties may not fulfil their contractual payment obligations.
Maximum Exposure to Credit Risk
The maximum exposure to credit risk table shows the direct exposure before consideration of associated collateral held and other credit enhancements (netting and hedges) that do not qualify for offset in our financial statements for the periods specified. The netting credit enhancement component includes the effects of legally enforceable netting agreements as well as the offset of negative mark-to-markets from derivatives against pledged cash collateral. The collateral credit enhancement component mainly includes real estate, collateral in the form of cash as well as securities related collateral. In relation to collateral we apply internally determined haircuts and additionally cap all collateral val-ues at the level of the respective collateralized exposure.
Maximum Exposure to Credit Risk Dec 31, 2015 Credit Enhancements
in € m.1
Maximum exposure to credit risk2 Netting Collateral
Guarantees and Credit derivatives3
Total credit enhancements
Cash and central bank balances 96,940 0 22 0 22 Interbank balances (w/o central banks) 12,842 0 57 13 70 Central bank funds sold and securities purchased under resale agreements 22,456 0 22,037 0 22,037 Securities borrowed 33,557 0 32,031 0 32,031 Financial assets at fair value through profit or loss4 734,449 409,317 152,858 699 562,874
Trading assets 119,991 0 4,615 519 5,134 Positive market values from derivative financial instruments 515,594 407,171 69,008 106 476,285 Financial assets designated at fair value through profit or loss 98,864 2,146 79,235 74 81,455
thereof: Securities purchased under resale agreement 51,073 2,146 47,664 0 49,811 Securities borrowed 21,489 0 21,154 0 21,154
Financial assets available for sale4 71,368 0 760 0 760 Loans5 432,777 0 207,923 30,188 238,111 Other assets subject to credit risk 78,978 58,478 386 365 59,229 Financial guarantees and other credit related contingent liabilities6 57,325 0 5,730 8,166 13,897 Irrevocable lending commitments and other credit related commitments6 174,549 0 6,973 6,275 13,248 Maximum exposure to credit risk 1,715,241 467,795 428,777 45,707 942,279 1 All amounts at carrying value unless otherwise indicated. 2 Does not include credit derivative notional sold (€ 655,584 million) and credit derivative notional bought protection. Cash and central bank balances mainly relate
to Liquidity Reserves. 3 Bought credit protection is reflected with the notional of the underlying. 4 Excludes equities, other equity interests and commodities. 5 Gross loans less deferred expense/unearned income before deductions of allowance for loan losses. 6 Figures are reflected at notional amounts.

139 Deutsche Bank Operating and Financial Review – 30 Employees – 230 Annual Report 2015 Outlook – 70 Internal Control over Financial Reporting – 235 Risk and Opportunities – 77 Information pursuant to Section – 315 (4)
Risk Report – 79 of the German Commercial Code and ► Risk and Capital Performance Explanatory Report – 239
Compensation Report – 188 Corporate Responsibility – 228
Dec 31, 2014 Credit Enhancements
in € m.1
Maximum exposure to credit risk2 Netting Collateral
Guarantees and Credit derivatives3
Total credit enhancements
Cash and central bank balances4 74,482 0 7 0 7 Interbank balances (w/o central banks)4 9,090 0 53 21 74 Central bank funds sold and securities purchased under resale agreements 17,796 0 16,988 0 16,988 Securities borrowed 25,834 0 24,700 0 24,700 Financial assets at fair value through profit or loss5 862,035 522,373 163,576 1,102 687,051
Trading assets 125,130 0 3,537 533 4,070 Positive market values from derivative financial instruments 629,958 519,590 76,512 336 596,439 Financial assets designated at fair value through profit or loss 106,947 2,782 83,527 233 86,542
thereof: Securities purchased under resale agreement 60,473 2,415 58,058 0 60,4736
Securities borrowed 20,404 368 19,955 0 20,3236
Financial assets available for sale5 62,038 0 938 − 938 Loans7 410,825 0 205,376 28,496 233,872 Other assets subject to credit risk 85,061 67,009 768 363 68,140 Financial guarantees and other credit related contingent liabilities8 62,087 0 6,741 8,723 15,464 Irrevocable lending commitments and other credit related commitments8 154,446 0 5,958 8,582 14,540 Maximum exposure to credit risk 1,763,695 589,381 425,106 47,287 1,061,774 1 All amounts at carrying value unless otherwise indicated. 2 Does not include credit derivative notional sold (€ 680,699 million) and credit derivative notional bought protection. Cash and central bank balances mainly relate
to Liquidity Reserves. 3 Bought credit protection is reflected with the notional of the underlying. 4 In 2015, comparatives have been restated. See Note 1 “Significant Accounting Policies and Critical Accounting Estimates – Significant Changes in Estimates and
Changes in Presentation” for detailed information. 5 Excludes equities, other equity interests and commodities. 6 Comparatives have been restated to include Netting. 7 Gross loans less deferred expense/unearned income before deductions of allowance for loan losses. 8 Figures are reflected at notional amounts.
The overall decrease in maximum exposure to credit risk for December 31, 2015 was predominantly driven by a € 114.4 billion decrease in positive market values from derivative financial instruments during the period, partly offset by a € 22.5 billion increase in cash and central bank balances, € 22.0 billion increase in loans, € 20.1 billion increase in irrevocable loan commitments and other credit related commitments as well as foreign exchange impacts across vari-ous products.
Included in the category of trading assets as of December 31, 2015, were traded bonds of € 103.2 billion (€ 107.8 billion as of December 31, 2014) that are over 79 % investment-grade (over 80 % as of December 31, 2014). The above mentioned financial assets available for sale category primarily reflected debt securities of which more than 95 % were investment-grade (more than 94 % as of December 31, 2014).
Credit Enhancements are split into three categories: netting, collateral, and guarantees and credit derivatives. A pru-dent approach is taken with respect to haircuts, parameter setting for regular margin calls as well as expert judgements for collateral valuation to prevent market developments from leading to a build-up of uncollateralized exposures. All categories are monitored and reviewed regularly. Overall credit enhancements received are diversified and of ade-quate quality being largely cash, highly rated government bonds and third-party guarantees mostly from well rated banks and insurance companies. These financial institutions are mainly domiciled in Western European countries and the United States. Furthermore we have collateral pools of highly liquid assets and mortgages (principally consisting of residential properties mainly in Germany) for the homogeneous retail portfolio.

Deutsche Bank 1 – Management Report 140Annual Report 2015
Credit Quality of Financial Instruments neither Past Due nor Impaired
We derive our credit quality from internal ratings and group our exposures into classes as shown below. Please refer to section “Measuring Credit Risk” for more details about our internal ratings.
Credit Quality of Financial Instruments neither Past Due nor Impaired Dec 31, 2015
in € m.1 iAAA–iAA iA iBBB iBB iB iCCC and below Total
Cash and central bank balances 91,154 2,377 1,918 1,311 68 111 96,940 Interbank balances (w/o central banks) 4,606 5,450 877 957 18 935 12,842 Central bank funds sold and securities purchased under resale agreements 3,607 15,590 1,870 1,234 37 118 22,456 Securities borrowed 24,306 5,380 1,461 2,361 49 0 33,557 Financial assets at fair value through profit or loss2 287,102 302,873 65,479 59,148 13,177 6,669 734,449
Trading assets 55,319 14,526 15,837 24,971 5,558 3,780 119,991 Positive market values from derivative financial instruments 184,183 271,328 36,100 17,265 4,894 1,824 515,594 Financial assets designated at fair value through profit or loss 47,601 17,019 13,543 16,912 2,724 1,065 98,864
thereof: Securities purchased under resale agreement 15,371 10,120 10,053 13,699 968 863 51,073 Securities borrowed 17,629 3,819 8 33 0 0 21,489
Financial assets available for sale2 59,157 4,519 2,070 3,404 159 219 69,528 Loans3 52,022 59,376 123,334 136,404 40,348 9,387 420,871
thereof: IAS 39 reclassified loans 1,672 461 878 627 76 397 4,110
Other assets subject to credit risk 30,724 26,465 6,924 13,615 941 308 78,978 Financial guarantees and other credit related contingent liabilities4 6,384 15,464 18,283 10,827 4,668 1,700 57,325 Irrevocable lending commitments and other credit related commitments4 23,035 46,220 44,603 37,643 21,212 1,834 174,549 Total 582,099 483,714 266,820 266,904 80,678 21,282 1,701,495 1 All amounts at carrying value unless otherwise indicated. 2 Excludes equities, other equity interests and commodities. 3 Gross loans less deferred expense/unearned income before deductions of allowance for loan losses. 4 Figures are reflected at notional amounts.
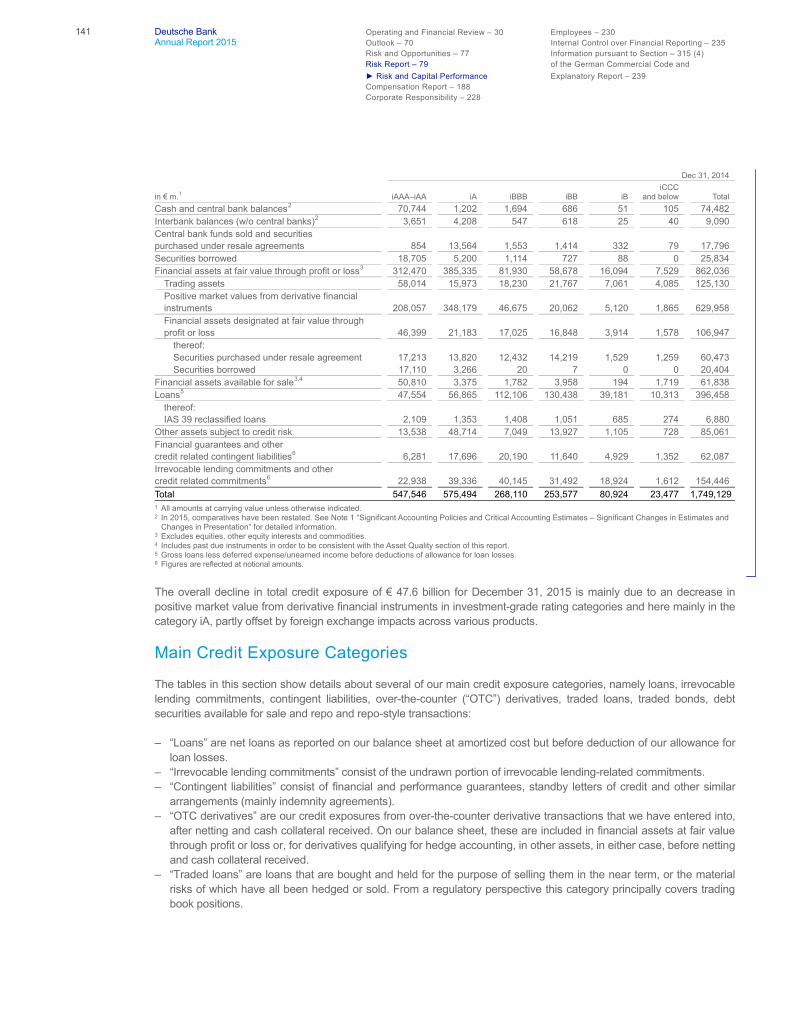
141 Deutsche Bank Operating and Financial Review – 30 Employees – 230 Annual Report 2015 Outlook – 70 Internal Control over Financial Reporting – 235 Risk and Opportunities – 77 Information pursuant to Section – 315 (4)
Risk Report – 79 of the German Commercial Code and ► Risk and Capital Performance Explanatory Report – 239
Compensation Report – 188 Corporate Responsibility – 228
Dec 31, 2014
in € m.1 iAAA–iAA iA iBBB iBB iB iCCC and below Total
Cash and central bank balances2 70,744 1,202 1,694 686 51 105 74,482 Interbank balances (w/o central banks)2 3,651 4,208 547 618 25 40 9,090 Central bank funds sold and securities purchased under resale agreements 854 13,564 1,553 1,414 332 79 17,796 Securities borrowed 18,705 5,200 1,114 727 88 0 25,834 Financial assets at fair value through profit or loss3 312,470 385,335 81,930 58,678 16,094 7,529 862,036
Trading assets 58,014 15,973 18,230 21,767 7,061 4,085 125,130 Positive market values from derivative financial instruments 208,057 348,179 46,675 20,062 5,120 1,865 629,958 Financial assets designated at fair value through profit or loss 46,399 21,183 17,025 16,848 3,914 1,578 106,947
thereof: Securities purchased under resale agreement 17,213 13,820 12,432 14,219 1,529 1,259 60,473 Securities borrowed 17,110 3,266 20 7 0 0 20,404
Financial assets available for sale3,4 50,810 3,375 1,782 3,958 194 1,719 61,838 Loans5 47,554 56,865 112,106 130,438 39,181 10,313 396,458
thereof: IAS 39 reclassified loans 2,109 1,353 1,408 1,051 685 274 6,880
Other assets subject to credit risk 13,538 48,714 7,049 13,927 1,105 728 85,061 Financial guarantees and other credit related contingent liabilities6 6,281 17,696 20,190 11,640 4,929 1,352 62,087 Irrevocable lending commitments and other credit related commitments6 22,938 39,336 40,145 31,492 18,924 1,612 154,446 Total 547,546 575,494 268,110 253,577 80,924 23,477 1,749,1291 All amounts at carrying value unless otherwise indicated. 2 In 2015, comparatives have been restated. See Note 1 “Significant Accounting Policies and Critical Accounting Estimates – Significant Changes in Estimates and
Changes in Presentation” for detailed information. 3 Excludes equities, other equity interests and commodities. 4 Includes past due instruments in order to be consistent with the Asset Quality section of this report. 5 Gross loans less deferred expense/unearned income before deductions of allowance for loan losses. 6 Figures are reflected at notional amounts.
The overall decline in total credit exposure of € 47.6 billion for December 31, 2015 is mainly due to an decrease in positive market value from derivative financial instruments in investment-grade rating categories and here mainly in the category iA, partly offset by foreign exchange impacts across various products.
Main Credit Exposure Categories
The tables in this section show details about several of our main credit exposure categories, namely loans, irrevocable lending commitments, contingent liabilities, over-the-counter (“OTC”) derivatives, traded loans, traded bonds, debt securities available for sale and repo and repo-style transactions:
‒ “Loans” are net loans as reported on our balance sheet at amortized cost but before deduction of our allowance for loan losses.
‒ “Irrevocable lending commitments” consist of the undrawn portion of irrevocable lending-related commitments. ‒ “Contingent liabilities” consist of financial and performance guarantees, standby letters of credit and other similar
arrangements (mainly indemnity agreements). ‒ “OTC derivatives” are our credit exposures from over-the-counter derivative transactions that we have entered into,
after netting and cash collateral received. On our balance sheet, these are included in financial assets at fair value through profit or loss or, for derivatives qualifying for hedge accounting, in other assets, in either case, before netting and cash collateral received.
‒ “Traded loans” are loans that are bought and held for the purpose of selling them in the near term, or the material risks of which have all been hedged or sold. From a regulatory perspective this category principally covers trading book positions.
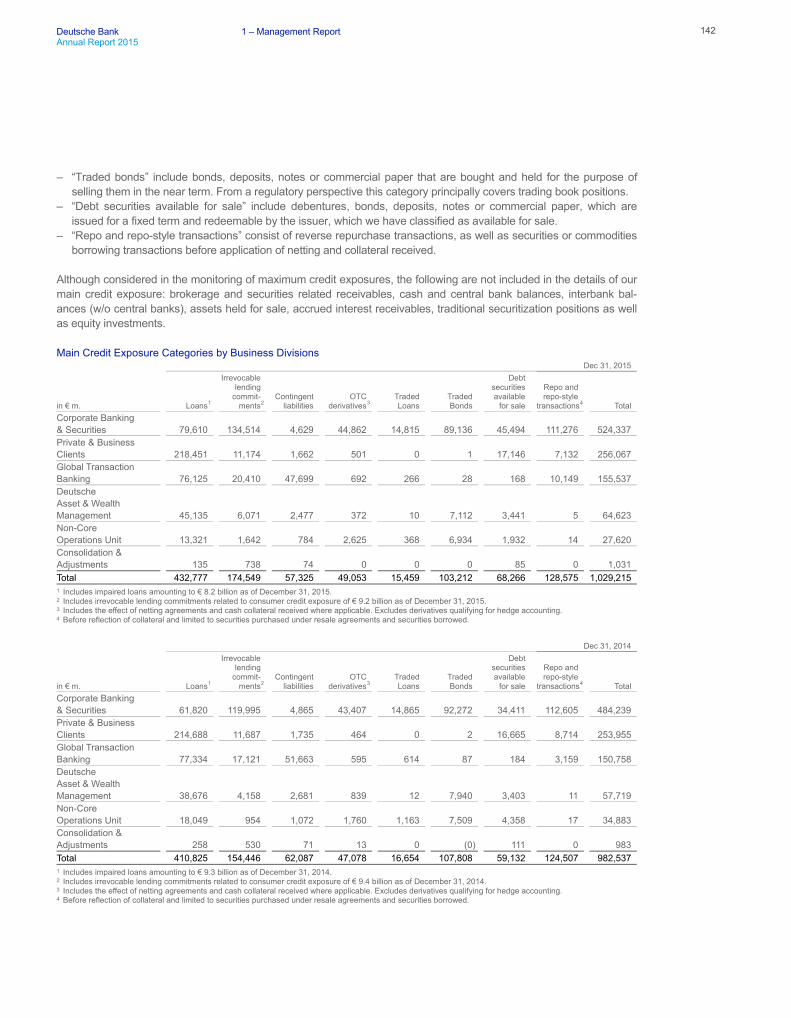
Deutsche Bank 1 – Management Report 142Annual Report 2015
‒ “Traded bonds” include bonds, deposits, notes or commercial paper that are bought and held for the purpose of selling them in the near term. From a regulatory perspective this category principally covers trading book positions.
‒ “Debt securities available for sale” include debentures, bonds, deposits, notes or commercial paper, which are issued for a fixed term and redeemable by the issuer, which we have classified as available for sale.
‒ “Repo and repo-style transactions” consist of reverse repurchase transactions, as well as securities or commodities borrowing transactions before application of netting and collateral received.
Although considered in the monitoring of maximum credit exposures, the following are not included in the details of our main credit exposure: brokerage and securities related receivables, cash and central bank balances, interbank bal-ances (w/o central banks), assets held for sale, accrued interest receivables, traditional securitization positions as well as equity investments.
Main Credit Exposure Categories by Business Divisions Dec 31, 2015
in € m. Loans1
Irrevocable lending commit- ments2
Contingent liabilities
OTC derivatives3
Traded Loans
Traded Bonds
Debt securities available for sale
Repo and repo-style transactions4 Total
Corporate Banking & Securities 79,610 134,514 4,629 44,862 14,815 89,136 45,494 111,276 524,337 Private & Business Clients 218,451 11,174 1,662 501 0 1 17,146 7,132 256,067 Global Transaction Banking 76,125 20,410 47,699 692 266 28 168 10,149 155,537 Deutsche Asset & Wealth Management 45,135 6,071 2,477 372 10 7,112 3,441 5 64,623 Non-Core Operations Unit 13,321 1,642 784 2,625 368 6,934 1,932 14 27,620 Consolidation & Adjustments 135 738 74 0 0 0 85 0 1,031 Total 432,777 174,549 57,325 49,053 15,459 103,212 68,266 128,575 1,029,215 1 Includes impaired loans amounting to € 8.2 billion as of December 31, 2015. 2 Includes irrevocable lending commitments related to consumer credit exposure of € 9.2 billion as of December 31, 2015. 3 Includes the effect of netting agreements and cash collateral received where applicable. Excludes derivatives qualifying for hedge accounting. 4 Before reflection of collateral and limited to securities purchased under resale agreements and securities borrowed.
Dec 31, 2014
in € m. Loans1
Irrevocable lending commit- ments2
Contingent liabilities
OTC derivatives3
Traded Loans
Traded Bonds
Debt securities available for sale
Repo and repo-style transactions4 Total
Corporate Banking & Securities 61,820 119,995 4,865 43,407 14,865 92,272 34,411 112,605 484,239 Private & Business Clients 214,688 11,687 1,735 464 0 2 16,665 8,714 253,955 Global Transaction Banking 77,334 17,121 51,663 595 614 87 184 3,159 150,758 Deutsche Asset & Wealth Management 38,676 4,158 2,681 839 12 7,940 3,403 11 57,719 Non-Core Operations Unit 18,049 954 1,072 1,760 1,163 7,509 4,358 17 34,883 Consolidation & Adjustments 258 530 71 13 0 (0) 111 0 983 Total 410,825 154,446 62,087 47,078 16,654 107,808 59,132 124,507 982,537 1 Includes impaired loans amounting to € 9.3 billion as of December 31, 2014. 2 Includes irrevocable lending commitments related to consumer credit exposure of € 9.4 billion as of December 31, 2014. 3 Includes the effect of netting agreements and cash collateral received where applicable. Excludes derivatives qualifying for hedge accounting. 4 Before reflection of collateral and limited to securities purchased under resale agreements and securities borrowed.
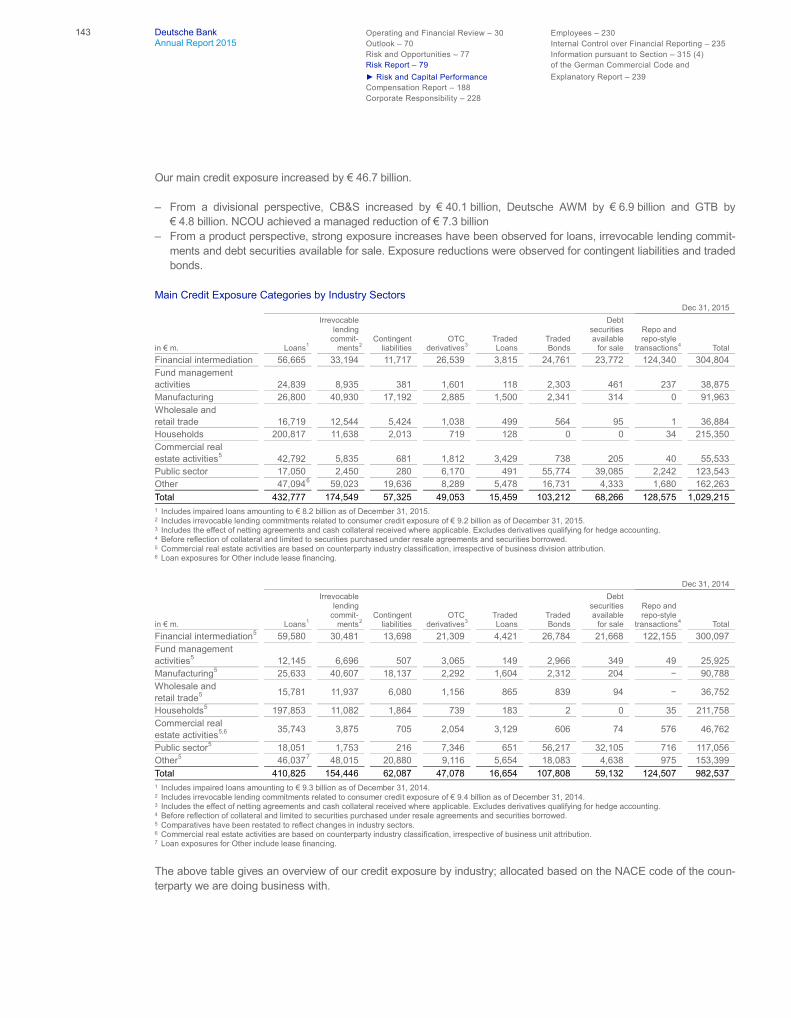
143 Deutsche Bank Operating and Financial Review – 30 Employees – 230Annual Report 2015 Outlook – 70 Internal Control over Financial Reporting – 235
Risk and Opportunities – 77 Information pursuant to Section – 315 (4)Risk Report – 79 of the German Commercial Code and
Risk and Capital Performance Explanatory Report – 239Compensation Report – 188Corporate Responsibility – 228
Our main credit exposure increased by 4 .7 billion.
‒ From a divisional perspective, CB&S increased by 40.1 billion, Deutsche AWM by .9 billion and GTB by 4.8 billion. CO achieved a managed reduction of 7.3 billion
‒ From a product perspective, strong exposure increases have been observed for loans, irrevocable lending commit-ments and debt securities available for sale. Exposure reductions were observed for contingent liabilities and traded bonds.
Main Credit Exposure Categories by Industry SectorsDec 31, 2015
in m. Loans1
Irrevocablelending
commit-ments2
Contingentliabilities
OTCderivatives3
TradedLoans
TradedBonds
Debtsecuritiesavailable
for sale
Repo andrepo-style
transactions4 TotalFinancial intermediation 5 , 5 33,194 11,717 2 ,539 3,815 24,7 1 23,772 124,340 304,804Fund managementactivities 24,839 8,935 381 1, 01 118 2,303 4 1 237 38,875Manufacturing 2 ,800 40,930 17,192 2,885 1,500 2,341 314 0 91,9 3Wholesale andretail trade 1 ,719 12,544 5,424 1,038 499 5 4 95 1 3 ,884Households 200,817 11, 38 2,013 719 128 0 0 34 215,350Commercial realestate activities5 42,792 5,835 81 1,812 3,429 738 205 40 55,533Public sector 17,050 2,450 280 ,170 491 55,774 39,085 2,242 123,543Other 47,094 59,023 19, 3 8,289 5,478 1 ,731 4,333 1, 80 1 2,2 3Total 432,777 174,549 57,325 49,053 15,459 103,212 8,2 128,575 1,029,2151 Includes impaired loans amounting to 8.2 billion as of December 31, 2015. 2 Includes irrevocable lending commitments related to consumer credit exposure of 9.2 billion as of December 31, 2015. 3 Includes the effect of netting agreements and cash collateral received where applicable. Excludes derivatives qualifying for hedge accounting. 4 Before reflection of collateral and limited to securities purchased under resale agreements and securities borrowed. 5 Commercial real estate activities are based on counterparty industry classification, irrespective of business division attribution. Loan exposures for Other include lease financing.
Dec 31, 2014
in m. Loans1
Irrevocablelending
commit-ments2
Contingentliabilities
OTCderivatives3
TradedLoans
TradedBonds
Debtsecuritiesavailable
for sale
Repo andrepo-style
transactions4 TotalFinancial intermediation5 59,580 30,481 13, 98 21,309 4,421 2 ,784 21, 8 122,155 300,097Fund managementactivities5 12,145 , 9 507 3,0 5 149 2,9 349 49 25,925Manufacturing5 25, 33 40, 07 18,137 2,292 1, 04 2,312 204 90,788Wholesale andretail trade5 15,781 11,937 ,080 1,15 8 5 839 94 3 ,752
Households5 197,853 11,082 1,8 4 739 183 2 0 35 211,758Commercial realestate activities5, 35,743 3,875 705 2,054 3,129 0 74 57 4 ,7 2
Public sector5 18,051 1,753 21 7,34 51 5 ,217 32,105 71 117,05Other5 4 ,0377 48,015 20,880 9,11 5, 54 18,083 4, 38 975 153,399Total 410,825 154,44 2,087 47,078 1 , 54 107,808 59,132 124,507 982,5371 Includes impaired loans amounting to 9.3 billion as of December 31, 2014. 2 Includes irrevocable lending commitments related to consumer credit exposure of 9.4 billion as of December 31, 2014. 3 Includes the effect of netting agreements and cash collateral received where applicable. Excludes derivatives qualifying for hedge accounting. 4 Before reflection of collateral and limited to securities purchased under resale agreements and securities borrowed. 5 Comparatives have been restated to reflect changes in industry sectors.
Commercial real estate activities are based on counterparty industry classification, irrespective of business unit attribution. 7 Loan exposures for Other include lease financing.
The above table gives an overview of our credit exposure by industry allocated based on the ACE code of the coun-terparty we are doing business with.
Deutsche Bank 1 – Management Report 144Annual Report 2015
From an industry perspective, our credit exposure is higher compared with last year mainly due to an increase in Fund management activities of € 13.0 billion and Commercial real estate activities of € 8.8 billion, driven by higher loan expo-sure, as well as increases in the category Other by € 8.9 billion mainly attributable to Irrevocable lending commitments.
Loan exposures to the industry sectors financial intermediation, manufacturing and public sector comprise predomi-nantly investment-grade loans. The portfolio is subject to the same credit underwriting requirements stipulated in our “Principles for Managing Credit Risk”, including various controls according to single name, country, industry and prod-uct-specific concentration.
Material transactions, such as loans underwritten with the intention to syndicate, are subject to review by senior credit risk management professionals and (depending upon size) an underwriting credit committee and/or the Management Board. High emphasis is placed on structuring such transactions so that de-risking is achieved in a timely and cost effective manner. Exposures within these categories are mostly to good quality borrowers and also subject to further risk mitigation as outlined in the description of our Credit Portfolio Strategies Group’s activities.
Our household loans exposure amounting to € 200.8 billion as of December 31, 2015 (€ 197.9 billion as of December 2014) is principally associated with our PBC portfolio. € 155.5 billion (78 %) of the portfolio comprises mortgages, of which € 120.0 billion are held in Germany. The remaining exposures (€ 45.3 billion, 22 %) are predominantly consumer finance business related. Given the largely homogeneous nature of this portfolio, counterparty credit worthiness and ratings are predominately derived by utilizing an automated decision engine.
Mortgage business is principally the financing of owner occupied properties sold by various business channels in Europe, primarily in Germany but also in Spain, Italy and Poland, with exposure normally not exceeding real estate value. Consumer finance is divided into personal instalment loans, credit lines and credit cards. Various lending re-quirements are stipulated, including (but not limited to) maximum loan amounts and maximum tenors and are adapted to regional conditions and/or circumstances of the borrower (i.e., for consumer loans a maximum loan amount taking into account household net income). Interest rates are mostly fixed over a certain period of time, especially in Germany. Second lien loans are not actively pursued.
The level of credit risk of the mortgage loan portfolio is determined by assessing the quality of the client and the under-lying collateral. The loan amounts are generally larger than consumer finance loans and they are extended for longer time horizons. Consumer finance loan risk depends on client quality. Given that they are uncollateralized, compared with mortgages they are also smaller in value and are extended for shorter time. Based on our underwriting criteria and processes, diversified portfolio (customers/properties) and low loan-to-value (LTV) ratios, the mortgage portfolio is categorized as lower risk and consumer finance medium risk.
Our commercial real estate loans are generally secured by first mortgages on the underlying real estate property, and follow the credit underwriting requirements stipulated in the “Principles for Managing Credit Risk” noted above (i.e., rating followed by credit approval based on assigned credit authority) and are subject to additional underwriting and policy guidelines such as LTV ratios of generally less than 75 %. Additionally, given the significance of the underlying collateral independent external appraisals are commissioned for all secured loans by our valuation team (part of the independent Credit Risk Management function). Our valuation team is responsible for reviewing and challenging the reported real estate values regularly.

145 Deutsche Bank Operating and Financial Review – 30 Employees – 230 Annual Report 2015 Outlook – 70 Internal Control over Financial Reporting – 235 Risk and Opportunities – 77 Information pursuant to Section – 315 (4)
Risk Report – 79 of the German Commercial Code and
► Risk and Capital Performance Explanatory Report – 239 Compensation Report – 188 Corporate Responsibility – 228
Excluding the exposures transferred into the NCOU, the Commercial Real Estate Group only in exceptional cases retains mezzanine or other junior tranches of debt (although we do underwrite mezzanine loans), though the Postbank portfolio holds an insignificant sub-portfolio of junior tranches. Loans originated for securitization are carefully monitored under a pipeline limit. Securitized loan positions are entirely sold (except where regulation requires retention of eco-nomic risk), while we frequently retain a portion of syndicated bank loans. This hold portfolio, which is held at amortized cost, is also subject to the aforementioned principles and policy guidelines. We also participate in conservatively un-derwritten unsecured lines of credit to well-capitalized real estate investment trusts and other public companies (gener-ally investment-grade). We provide both fixed rate (generally securitized product) and floating rate loans, with interest rate exposure subject to hedging arrangements. In addition, sub-performing and non-performing loans and pools of loans are acquired from other financial institutions at generally substantial discounts to both the notional amounts and current collateral values. The underwriting process for these is stringent and the exposure is managed under separate portfolio limits. Commercial real estate property valuations and rental incomes can be significantly impacted by macro-economic conditions and underlying properties to idiosyncratic events. Accordingly, the portfolio is categorized as higher risk and hence subject to the aforementioned tight restrictions on concentration.
The category other loans, with exposure of € 47.1 billion as of December 31, 2015 (€ 46.0 billion as of Decem-ber 31, 2014), relates to numerous smaller industry sectors with no individual sector greater than 5 % of total loans.
Our credit exposure to our ten largest counterparties accounted for 7 % of our aggregated total credit exposure in these categories as of December 31, 2015 compared with 7 % as of December 31, 2014. Our top ten counterparty expo-sures were with well-rated counterparties or otherwise related to structured trades which show high levels of risk miti-gation.
Our credit exposure to each of the focus industries “Oil and Gas”, “Metals, Mining & Steel” and “Shipping” is less than 2 % of our total credit exposure.
Our credit exposure to the “Oil & Gas” industry is approximately € 16 billion, of which gross loans account for € 5 billion, and irrevocable lending commitments account for € 8 billion. Around 60 % of our credit exposure is to investment-grade rated borrowers, mainly in the more resilient segments Oil Majors and National Oil & Gas companies. Less than 20 % of our “Oil & Gas” credit portfolio is to sectors that we consider higher risk and more impacted by the low oil price, namely sub-investment-grade Exploration & Production (predominantly senior secured) and Oil & Gas Services & Equipment segments.
Our credit exposure in our “Metals, Mining and Steel” portfolio is approximately € 10 billion, of which gross loans ac-count for € 5 billion, and irrevocable lending commitments account of € 3 billion. This portfolio is of lower quality com-pared to our overall Corporate credit portfolio, and has an investment-grade ratio of just 35 %. In line with the structure of the industry, a significant share of our portfolio is in Emerging Markets countries. Our strategy is to reduce this credit portfolio due to elevated risks of this industry, namely material oversupply with resulting pressure on prices and mar-gins.
Out credit exposure to Shipping accounts for approximately € 7 billion, of which gross loans account for € 6 billion, and is largely collateralised. The portfolio is diversified across ship types with global associated risks due to diversified trading income albeit the counterparties mainly domiciled in Europe. A high proportion of the portfolio is sub invest-ment-grade rated in reflection of the pro-longed challenging market conditions over recent years. Exposure to the Ger-man “KG” sector (non-recourse financing of vessels via closed end funds) is less than 10 % of the total Shipping exposure.
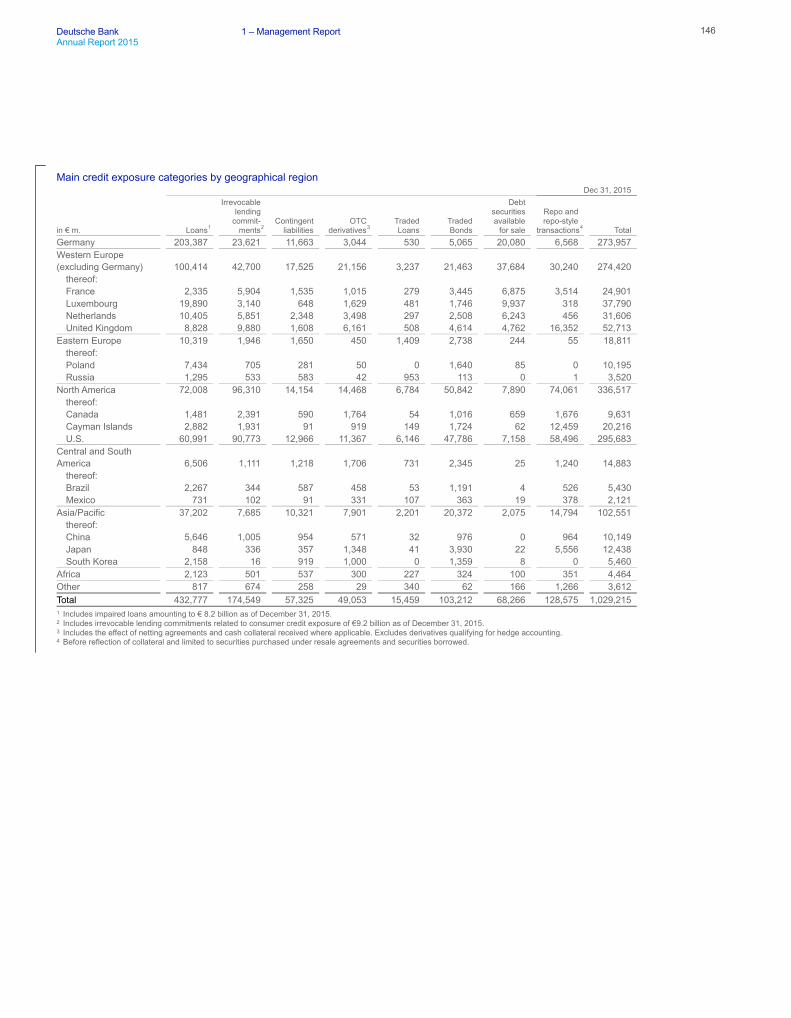
Deutsche Bank 1 – Management Report 146Annual Report 2015
Main credit exposure categories by geographical region Dec 31, 2015
in € m. Loans1
Irrevocable lending commit- ments2
Contingent liabilities
OTC derivatives3
Traded Loans
Traded Bonds
Debt securities available for sale
Repo and repo-style transactions4 Total
Germany 203,387 23,621 11,663 3,044 530 5,065 20,080 6,568 273,957 Western Europe (excluding Germany) 100,414 42,700 17,525 21,156 3,237 21,463 37,684 30,240 274,420
thereof: France 2,335 5,904 1,535 1,015 279 3,445 6,875 3,514 24,901 Luxembourg 19,890 3,140 648 1,629 481 1,746 9,937 318 37,790 Netherlands 10,405 5,851 2,348 3,498 297 2,508 6,243 456 31,606 United Kingdom 8,828 9,880 1,608 6,161 508 4,614 4,762 16,352 52,713
Eastern Europe 10,319 1,946 1,650 450 1,409 2,738 244 55 18,811 thereof: Poland 7,434 705 281 50 0 1,640 85 0 10,195 Russia 1,295 533 583 42 953 113 0 1 3,520
North America 72,008 96,310 14,154 14,468 6,784 50,842 7,890 74,061 336,517 thereof: Canada 1,481 2,391 590 1,764 54 1,016 659 1,676 9,631 Cayman Islands 2,882 1,931 91 919 149 1,724 62 12,459 20,216 U.S. 60,991 90,773 12,966 11,367 6,146 47,786 7,158 58,496 295,683
Central and South America 6,506 1,111 1,218 1,706 731 2,345 25 1,240 14,883
thereof: Brazil 2,267 344 587 458 53 1,191 4 526 5,430 Mexico 731 102 91 331 107 363 19 378 2,121
Asia/Pacific 37,202 7,685 10,321 7,901 2,201 20,372 2,075 14,794 102,551 thereof: China 5,646 1,005 954 571 32 976 0 964 10,149 Japan 848 336 357 1,348 41 3,930 22 5,556 12,438 South Korea 2,158 16 919 1,000 0 1,359 8 0 5,460
Africa 2,123 501 537 300 227 324 100 351 4,464 Other 817 674 258 29 340 62 166 1,266 3,612 Total 432,777 174,549 57,325 49,053 15,459 103,212 68,266 128,575 1,029,215 1 Includes impaired loans amounting to € 8.2 billion as of December 31, 2015. 2 Includes irrevocable lending commitments related to consumer credit exposure of €9.2 billion as of December 31, 2015. 3 Includes the effect of netting agreements and cash collateral received where applicable. Excludes derivatives qualifying for hedge accounting. 4 Before reflection of collateral and limited to securities purchased under resale agreements and securities borrowed.
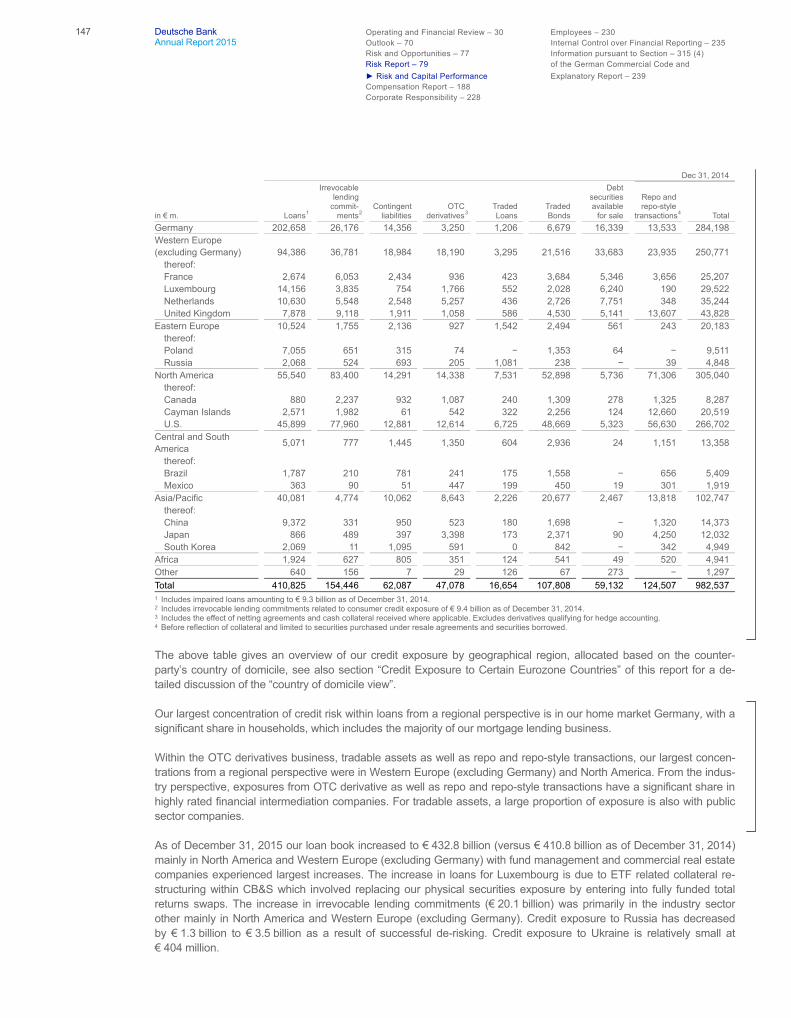
147 Deutsche Bank Operating and Financial Review – 30 Employees – 230 Annual Report 2015 Outlook – 70 Internal Control over Financial Reporting – 235 Risk and Opportunities – 77 Information pursuant to Section – 315 (4)
Risk Report – 79 of the German Commercial Code and ► Risk and Capital Performance Explanatory Report – 239
Compensation Report – 188 Corporate Responsibility – 228
Dec 31, 2014
in € m. Loans1
Irrevocable lending commit- ments2
Contingent liabilities
OTC derivatives3
Traded Loans
Traded Bonds
Debt securities available for sale
Repo and repo-styletransactions4 Total
Germany 202,658 26,176 14,356 3,250 1,206 6,679 16,339 13,533 284,198 Western Europe (excluding Germany) 94,386 36,781 18,984 18,190 3,295 21,516 33,683 23,935 250,771
thereof: France 2,674 6,053 2,434 936 423 3,684 5,346 3,656 25,207 Luxembourg 14,156 3,835 754 1,766 552 2,028 6,240 190 29,522 Netherlands 10,630 5,548 2,548 5,257 436 2,726 7,751 348 35,244 United Kingdom 7,878 9,118 1,911 1,058 586 4,530 5,141 13,607 43,828
Eastern Europe 10,524 1,755 2,136 927 1,542 2,494 561 243 20,183 thereof: Poland 7,055 651 315 74 − 1,353 64 − 9,511 Russia 2,068 524 693 205 1,081 238 − 39 4,848
North America 55,540 83,400 14,291 14,338 7,531 52,898 5,736 71,306 305,040 thereof: Canada 880 2,237 932 1,087 240 1,309 278 1,325 8,287 Cayman Islands 2,571 1,982 61 542 322 2,256 124 12,660 20,519 U.S. 45,899 77,960 12,881 12,614 6,725 48,669 5,323 56,630 266,702
Central and South America 5,071 777 1,445 1,350 604 2,936 24 1,151 13,358
thereof: Brazil 1,787 210 781 241 175 1,558 − 656 5,409 Mexico 363 90 51 447 199 450 19 301 1,919
Asia/Pacific 40,081 4,774 10,062 8,643 2,226 20,677 2,467 13,818 102,747 thereof: China 9,372 331 950 523 180 1,698 − 1,320 14,373 Japan 866 489 397 3,398 173 2,371 90 4,250 12,032 South Korea 2,069 11 1,095 591 0 842 − 342 4,949
Africa 1,924 627 805 351 124 541 49 520 4,941 Other 640 156 7 29 126 67 273 − 1,297 Total 410,825 154,446 62,087 47,078 16,654 107,808 59,132 124,507 982,537 1 Includes impaired loans amounting to € 9.3 billion as of December 31, 2014. 2 Includes irrevocable lending commitments related to consumer credit exposure of € 9.4 billion as of December 31, 2014. 3 Includes the effect of netting agreements and cash collateral received where applicable. Excludes derivatives qualifying for hedge accounting. 4 Before reflection of collateral and limited to securities purchased under resale agreements and securities borrowed.
The above table gives an overview of our credit exposure by geographical region, allocated based on the counter-party’s country of domicile, see also section “Credit Exposure to Certain Eurozone Countries” of this report for a de-tailed discussion of the “country of domicile view”.
Our largest concentration of credit risk within loans from a regional perspective is in our home market Germany, with a significant share in households, which includes the majority of our mortgage lending business.
Within the OTC derivatives business, tradable assets as well as repo and repo-style transactions, our largest concen-trations from a regional perspective were in Western Europe (excluding Germany) and North America. From the indus-try perspective, exposures from OTC derivative as well as repo and repo-style transactions have a significant share in highly rated financial intermediation companies. For tradable assets, a large proportion of exposure is also with public sector companies.
As of December 31, 2015 our loan book increased to € 432.8 billion (versus € 410.8 billion as of December 31, 2014) mainly in North America and Western Europe (excluding Germany) with fund management and commercial real estate companies experienced largest increases. The increase in loans for Luxembourg is due to ETF related collateral re-structuring within CB&S which involved replacing our physical securities exposure by entering into fully funded total returns swaps. The increase in irrevocable lending commitments (€ 20.1 billion) was primarily in the industry sector other mainly in North America and Western Europe (excluding Germany). Credit exposure to Russia has decreased by € 1.3 billion to € 3.5 billion as a result of successful de-risking. Credit exposure to Ukraine is relatively small at € 404 million.
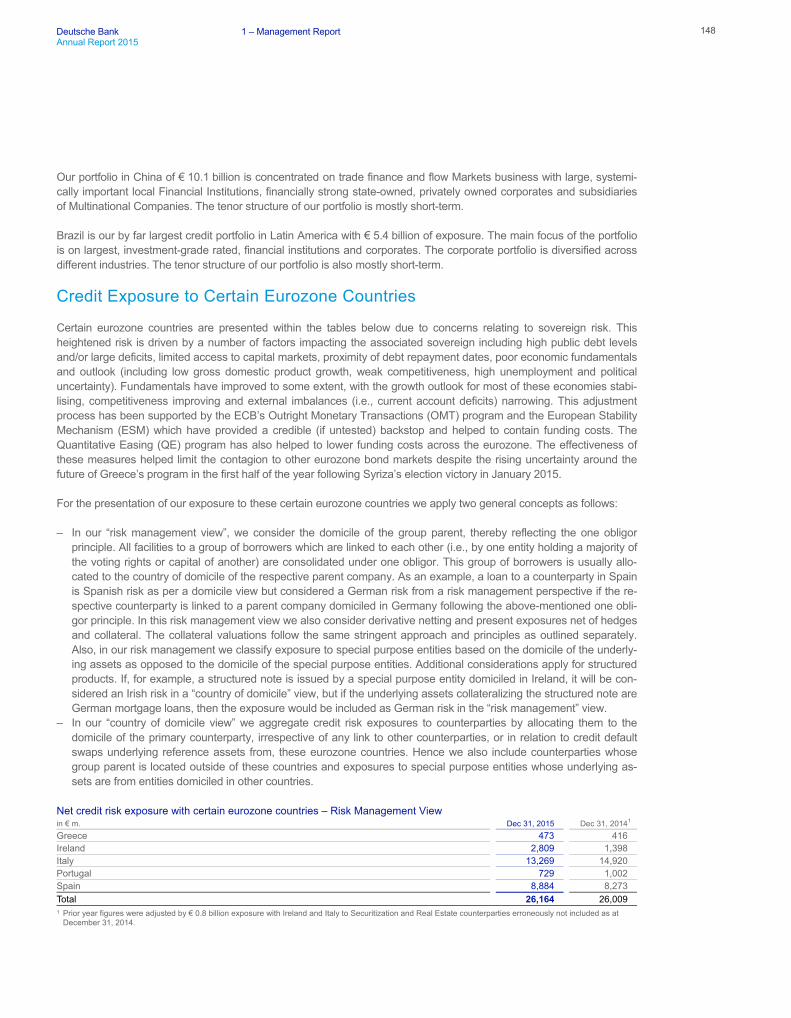
Deutsche Bank 1 – Management Report 148Annual Report 2015
Our portfolio in China of € 10.1 billion is concentrated on trade finance and flow Markets business with large, systemi-cally important local Financial Institutions, financially strong state-owned, privately owned corporates and subsidiaries of Multinational Companies. The tenor structure of our portfolio is mostly short-term.
Brazil is our by far largest credit portfolio in Latin America with € 5.4 billion of exposure. The main focus of the portfolio is on largest, investment-grade rated, financial institutions and corporates. The corporate portfolio is diversified across different industries. The tenor structure of our portfolio is also mostly short-term.
Credit Exposure to Certain Eurozone Countries
Certain eurozone countries are presented within the tables below due to concerns relating to sovereign risk. This heightened risk is driven by a number of factors impacting the associated sovereign including high public debt levels and/or large deficits, limited access to capital markets, proximity of debt repayment dates, poor economic fundamentals and outlook (including low gross domestic product growth, weak competitiveness, high unemployment and political uncertainty). Fundamentals have improved to some extent, with the growth outlook for most of these economies stabi-lising, competitiveness improving and external imbalances (i.e., current account deficits) narrowing. This adjustment process has been supported by the ECB’s Outright Monetary Transactions (OMT) program and the European Stability Mechanism (ESM) which have provided a credible (if untested) backstop and helped to contain funding costs. The Quantitative Easing (QE) program has also helped to lower funding costs across the eurozone. The effectiveness of these measures helped limit the contagion to other eurozone bond markets despite the rising uncertainty around the future of Greece’s program in the first half of the year following Syriza’s election victory in January 2015.
For the presentation of our exposure to these certain eurozone countries we apply two general concepts as follows:
‒ In our “risk management view”, we consider the domicile of the group parent, thereby reflecting the one obligor principle. All facilities to a group of borrowers which are linked to each other (i.e., by one entity holding a majority of the voting rights or capital of another) are consolidated under one obligor. This group of borrowers is usually allo-cated to the country of domicile of the respective parent company. As an example, a loan to a counterparty in Spain is Spanish risk as per a domicile view but considered a German risk from a risk management perspective if the re-spective counterparty is linked to a parent company domiciled in Germany following the above-mentioned one obli-gor principle. In this risk management view we also consider derivative netting and present exposures net of hedges and collateral. The collateral valuations follow the same stringent approach and principles as outlined separately. Also, in our risk management we classify exposure to special purpose entities based on the domicile of the underly-ing assets as opposed to the domicile of the special purpose entities. Additional considerations apply for structured products. If, for example, a structured note is issued by a special purpose entity domiciled in Ireland, it will be con-sidered an Irish risk in a “country of domicile” view, but if the underlying assets collateralizing the structured note are German mortgage loans, then the exposure would be included as German risk in the “risk management” view.
‒ In our “country of domicile view” we aggregate credit risk exposures to counterparties by allocating them to the domicile of the primary counterparty, irrespective of any link to other counterparties, or in relation to credit default swaps underlying reference assets from, these eurozone countries. Hence we also include counterparties whose group parent is located outside of these countries and exposures to special purpose entities whose underlying as-sets are from entities domiciled in other countries.
Net credit risk exposure with certain eurozone countries – Risk Management View in € m. Dec 31, 2015 Dec 31, 20141
Greece 473 416 Ireland 2,809 1,398 Italy 13,269 14,920 Portugal 729 1,002 Spain 8,884 8,273 Total 26,164 26,009 1 Prior year figures were adjusted by € 0.8 billion exposure with Ireland and Italy to Securitization and Real Estate counterparties erroneously not included as at
December 31, 2014.

149 Deutsche Bank Operating and Financial Review – 30 Employees – 230 Annual Report 2015 Outlook – 70 Internal Control over Financial Reporting – 235 Risk and Opportunities – 77 Information pursuant to Section – 315 (4)
Risk Report – 79 of the German Commercial Code and ► Risk and Capital Performance Explanatory Report – 239
Compensation Report – 188 Corporate Responsibility – 228
Net credit risk exposure slightly up by € 0.2 billion since year-end 2014. This was mainly driven by increases in Ireland Securitization portfolio and Spain short-term liquidity exposure, partly offset by decrease in Italy and Portugal largely driven by lower traded credit positions. Greece exposure marginally up driven by vessel collateral revaluations and USD strengthening, excluding the U.S. dollar denominated Shipping portfolio of € 0.3 billion, remaining exposure stands at € 0.1 billion and continues to be closely monitored.
Our above exposure is principally to highly diversified, low risk retail portfolios and small and medium enterprises in Italy and Spain, as well as stronger corporate and diversified mid-cap clients. Our financial institutions exposure is predominantly geared towards larger banks in Spain and Italy, typically collateralised. Sovereign exposure is at what we view as a manageable level.
The following tables, which are based on the country of domicile view, present our gross position, the included amount thereof of undrawn exposure and our net exposure to these eurozone countries. The gross exposure reflects our net credit risk exposure grossed up for net credit derivative protection purchased with underlying reference assets domi-ciled in one of these countries, guarantees received and collateral. Such collateral is particularly held with respect to the retail portfolio, but also for financial institutions predominantly based on derivative margining arrangements, as well as for corporates. In addition the amounts also reflect the allowance for credit losses. In some cases, our counterpar-ties’ ability to draw on undrawn commitments is limited by terms included in the specific contractual documentation. Net credit exposures are presented after effects of collateral held, guarantees received and further risk mitigation, including net notional amounts of credit derivatives for protection sold/(bought). The provided gross and net exposures to certain European countries do not include credit derivative tranches and credit derivatives in relation to our correlation busi-ness which, by design, is structured to be credit risk neutral. Additionally the tranche and correlated nature of these positions does not allow a meaningful disaggregated notional presentation by country, e.g., as identical notional expo-sures represent different levels of risk for different tranche levels.
Gross position, included undrawn exposure and net exposure to certain eurozone countries – Country of Domicile View Sovereign Financial Institutions Corporates Retail Other Total1
Dec 31, Dec 31, Dec 31, Dec 31, Dec 31, Dec 31, Dec 31, Dec 31, Dec 31, Dec 31, Dec 31, Dec 31, in € m. 2015 2014 2015 20142 2015 20142 2015 20142 2015 20142 20151 20142
Greece Gross 0 100 732 716 1,539 1,167 7 6 0 34 2,277 2,022
Undrawn 0 0 23 20 118 63 0 1 0 0 142 84 Net 0 89 237 107 95 125 1 2 0 34 333 357
Ireland Gross 459 553 998 1,100 8,752 8,230 35 39 4,3613 2,3503 14,605 12,273
Undrawn 0 0 23 48 2,568 2,206 0 0 3933 4763 2,984 2,730 Net 28 (21) 528 524 5,327 5,103 5 5 4,3473 2,3503 10,235 7,960
Italy Gross 4,048 4,673 2,421 5,736 10,642 8,509 17,841 19,310 470 1,310 35,421 39,537
Undrawn 25 0 73 952 4,622 3,061 148 179 24 28 4,892 4,220 Net 507 244 754 3,431 7,093 5,897 6,989 6,749 448 1,229 15,792 17,551
Portugal Gross 112 (5) 260 404 1,509 1,052 1,743 2,023 59 205 3,684 3,679
Undrawn 0 0 22 37 210 121 25 30 0 0 258 189 Net 64 (76) 181 357 1,111 503 202 220 59 205 1,616 1,209
Spain Gross 729 696 1,292 2,465 9,350 9,332 9,928 10,580 257 839 21,556 23,911
Undrawn 0 0 203 738 4,235 3,819 298 476 14 15 4,750 5,048 Net 757 275 516 2,084 6,838 6,8284 1,872 1,890 476 790 10,458 11,8674
Total gross 5,348 6,018 5,703 10,421 31,792 28,290 29,553 31,958 5,147 4,736 77,544 81,423 Total undrawn 25 0 344 1,795 11,754 9,271 472 687 431 519 13,026 12,272
Total net5 1,356 511 2,216 6,503 20,463 18,4574 9,069 8,866 5,330 4,608 38,434 38,9444
1 Approximately 63 % of the overall exposure will mature within the next 5 years.2 Comparatives as per Financial Report 2014 have been restated down by € 107 million gross exposure and € 101 million net exposure in order to exclude
revocable loan commitments in line with other credit exposure disclosures in this report.3 Other exposures to Ireland include exposures to counterparties where the domicile of the group parent is located outside of Ireland as well as exposures to special
purpose entities whose underlying assets are from entities domiciled in other countries. 4 Decrease of CRE collateral of € 4 million in comparison to the Financial Statement in September 2015 due to valuation adjustments in the Postbank portfolio. 5 Total net exposure excludes credit valuation reserves for derivatives amounting to € 159 million as of December 31, 2015 and € 300 million as of Decem-
ber 31, 2014.

Deutsche Bank 1 – Management Report 150Annual Report 2015
Total net exposure to the above selected eurozone countries decreased by € 510 million in 2015 driven largely by reductions in exposure to Italy and Spain, partially offset by increased exposure in Ireland and Portugal.
Aggregate net credit risk to certain eurozone countries by type of financial instrument
Financial assets carried at amortized cost
Financial assets measured at fair value
Financial instruments at fair value through profit or loss Dec 31, 2015
in € m.
Loans before loan loss allowance
Loans after loan loss allowance Other1
Financial assets available for sale2 Derivatives Other Total3
Greece 139 104 177 0 54 28 363 Ireland 3,616 3,615 2,845 852 988 2,092 10,392 Italy 11,249 10,298 4,094 671 3,433 1,480 19,976 Portugal 604 545 392 12 39 776 1,763 Spain 5,205 4,598 3,355 198 335 1,539 10,025 Total 20,813 19,160 10,863 1,733 4,849 5,915 42,520 1 Primarily includes contingent liabilities and undrawn lending commitments.2 Excludes equities and other equity interests. 3 After loan loss allowances.
Financial assets carried at amortized cost
Financial assets measured at fair value
Financial instruments at fair value through profit or loss Dec 31, 2014
in € m.
Loans before loan loss allowance1
Loans after loan loss allowance1 Other1,2
Financial assets available for sale3 Derivatives Other Total1,4
Greece 191 172 92 0 85 28 377 Ireland 2,049 2,016 2,706 481 843 1,728 7,775 Italy 10,764 9,753 3,791 672 4,071 3,085 21,372 Portugal 638 587 306 20 36 558 1,506 Spain 5,6175 4,9785 3,635 231 510 2,015 11,3695
Total 19,2595 17,5065 10,530 1,404 5,545 7,414 42,3995
1 Comparatives as per Financial Report 2014 have been restated down by € 101 million in order to exclude revocable loan commitments in line with other credit exposure disclosures in this report.
2 Primarily includes contingent liabilities and undrawn lending commitments. 3 Excludes equities and other equity interests. 4 After loan loss allowances. 5 Decrease of CRE collateral of € 4 million in comparison to the Financial Statement in September 2015 due to valuation adjustments in the Postbank portfolio.
The above tables exclude credit derivative exposure, which is separately reported in the following table. For our credit derivative exposure with these eurozone countries we present the notional amounts for protection sold and protection bought on a gross level as well as the resulting net notional position and its fair value.
Credit derivative exposure with underlying assets domiciled in certain eurozone countries Notional amounts Dec 31, 2015
in € m. Protection sold
Protection bought
Net protection sold/(bought) Net fair value
Greece 1,144 (1,174) (31) (2) Ireland 3,332 (3,489) (157) 4 Italy 44,132 (48,316) (4,184) (35) Portugal 4,497 (4,645) (147) 23 Spain 18,489 (18,056) 433 (2) Total 71,594 (75,680) (4,086) (13)
Notional amounts Dec 31, 2014
in € m. Protection sold
Protection bought
Net protection sold/(bought) Net fair value
Greece 901 (921) (20) 2 Ireland 4,344 (4,158) 186 4 Italy 41,433 (45,253) (3,821) 156 Portugal 5,876 (6,173) (297) 6 Spain 18,061 (17,563) 498 10 Total 70,614 (74,068) (3,454) 177

151 Deutsche Bank Operating and Financial Review – 30 Employees – 230 Annual Report 2015 Outlook – 70 Internal Control over Financial Reporting – 235 Risk and Opportunities – 77 Information pursuant to Section – 315 (4)
Risk Report – 79 of the German Commercial Code and ► Risk and Capital Performance Explanatory Report – 239
Compensation Report – 188 Corporate Responsibility – 228
In line with common industry practice, we use credit default swaps (CDS) as one important instrument to manage credit risk in order to avoid any undue concentrations in the credit portfolio. CDS contracts are governed by standard ISDA documentation which defines trigger events which result in settlement payouts. Examples of these triggers include bankruptcy of the reference entity, failure of reference entity to meeting contractual obligations (i.e., interest or principalrepayment) and debt restructuring of the reference entity. These triggers also apply to credit default protection con-tracts sold. Our purchased credit default swap protection acting as a risk mitigant is predominantly issued by highly rated financial institutions governed under collateral agreements. While we clearly focus on net risk including hedg-ing/collateral we also review our gross positions before any CDS hedging in reflection of the potential risk that a CDS trigger event does not occur as expected.
The exposures associated with these countries noted above are managed and monitored using the credit process explained within the “Credit Risk Management” section of this Risk Report including detailed counterparty ratings, ongoing counterparty monitoring as well as our framework for managing concentration risk as documented within our “Country Risk Management” and “Industry Risk Management” sections as outlined above. This framework is comple-mented by regular management reporting including targeted portfolio reviews of these countries and portfolio de-risking initiatives.
For credit protection purposes we strive to avoid any maturity mismatches. However, this depends on the availability of required hedging instruments in the market. Where maturity mismatches cannot be avoided, these positions are tightly monitored. We take into account the sensitivities of hedging instruments and underlying assets to neutralize the matur-ity mismatch.
Our governance framework is intended to enable adequate preparation for and an ability to manage euro crisis events in terms of risk mitigation and operational contingency measures, which we consider to have been effective when Cyprus stresses escalated, with close coordination between Risk, Legal, business and other infrastructure functions to promote consistent operational and strategic responses across the Bank.
Overall, we have managed our exposures to certain eurozone countries since the early stages of the debt crisis and believe our credit portfolio to be well-positioned following selective early de-risking focused on sovereign risk and weaker counterparties.
Sovereign Credit Risk Exposure to Certain Eurozone Countries
The amounts below reflect a net “country of domicile view” of our sovereign exposure.
Sovereign credit risk exposure to certain eurozone countries Dec 31, 2015 Dec 31, 2014
in € m.
Direct Sovereign exposure1
Net Notional ofCDS referencing sovereign debt
Net sovereign exposure
Memo Item: Netfair value of CDS referencing sovereign debt2
Direct Sovereign exposure1
Net Notional of CDS referencing sovereign debt
Net sovereign exposure
Memo Item: Netfair value of CDS referencing sovereign debt2
Greece 0 0 0 0 100 (11) 89 1 Ireland 55 (28) 28 1 (26) 4 (21) 2 Italy 3,989 (3,482) 507 36 4,600 (4,356) 244 133 Portugal 112 (48) 64 (9) (5) (71) (76) 2 Spain 725 32 757 (12) 688 (413) 275 1 Total 4,881 (3,526) 1,356 17 5,358 (4,848) 511 139 1 Includes sovereign debt classified as financial assets/liabilities at fair value through profit or loss, available for sale and loans carried at amortized cost. 2 The amounts reflect the net fair value in relation to credit default swaps referencing sovereign debt of the respective country representing the counterparty
credit risk.
The increase of € 845 million in net sovereign exposure compared with year-end 2014 mainly reflects movements from credit default swaps, derivative positions and debt securities. The movement in our net sovereign exposure is mainly driven by a significant increase in Italian and Spanish exposure, which primarily reflects exposure changes in credit default swaps, trading debt securities and positive market values from derivatives.

Deutsche Bank 1 – Management Report 152Annual Report 2015
The above represented direct sovereign exposure included the carrying value of loans held at amortized cost to sover-eigns, which as of December 31, 2015, amounted to € 273 million for Italy and € 478 million for Spain and as of De-cember 31,2014 amounted to € 279 million for Italy and € 580 million for Spain.
Fair value of sovereign credit risk exposure to certain eurozone countries classified as financial assets at fair value throughprofit or loss
Dec 31, 2015 Dec 31, 2014
in € m. Fair value of sovereign debt
Fair value of derivatives with sovereign counterparties (net position)1
Total fair value of sovereign exposures
Fair value of sovereign debt
Fair value of derivatives with sovereign counterparties (net position)1
Total fair value of sovereign exposures
Greece 0 0 0 20 80 100 Ireland 60 (4) 55 (22) 0 (22) Italy 5162 3,104 3,620 3852 3,459 3,844 Portugal (111) (1) (112) (8) 0 (8) Spain 232 15 247 66 20 86 Total 697 3,114 3,811 441 3,559 4,000 1 Includes the impact of master netting and collateral arrangements. 2 Long sovereign debt position for Italy predominantly related to structured trades with corresponding credit derivatives offset.
Sovereign credit risk exposure to certain eurozone countries classified as financial assets available for sale Dec 31, 2015 Dec 31, 2014
in € m. Fair value of sovereign debt
Original carrying amount
Accumulated impairment losses recognized in net income (after tax)
Fair value of sovereign debt
Original carrying amount
Accumulated impairment losses recognized in net income (after tax)
Greece 0 0 0 0 0 0 Ireland 0 0 0 0 0 0 Italy 72 72 0 77 81 0 Portugal 4 4 0 4 4 0 Spain 0 0 0 0 0 0 Total 76 76 0 81 85 0
Credit Exposure Classification
We also classify our credit exposure under two broad headings: consumer credit exposure and corporate credit expo-sure.
‒ Our consumer credit exposure consists of our smaller-balance standardized homogeneous loans, primarily in Ger-many, Italy and Spain, which include personal loans, residential and non-residential mortgage loans, overdrafts and loans to self-employed and small business customers of our private and retail business.
‒ Our corporate credit exposure consists of all exposures not defined as consumer credit exposure.

153 Deutsche Bank Operating and Financial Review – 30 Employees – 230 Annual Report 2015 Outlook – 70 Internal Control over Financial Reporting – 235 Risk and Opportunities – 77 Information pursuant to Section – 315 (4)
Risk Report – 79 of the German Commercial Code and ► Risk and Capital Performance Explanatory Report – 239
Compensation Report – 188 Corporate Responsibility – 228
Corporate Credit Exposure
The tables below show our Corporate Credit Exposure by product types and internal rating bands. Please refer to section "Measuring Credit Risk" for more details about our internal ratings.
Main corporate credit exposure categories according to our internal creditworthiness categories of our counterparties – gross in € m. (unless stated otherwise) Dec 31, 2015
Ratingband Probability of default in %1 Loans
Irrevocable lending commitments2
Contingent liabilities
OTC derivatives3
Debt securities available for sale Total
iAAA–iAA > 0.00 ≤ 0.04 50,712 23,035 6,384 22,753 59,157 162,042 iA > 0.04 ≤ 0.11 49,197 46,220 15,464 10,998 4,515 126,394 iBBB > 0.11 ≤ 0.5 62,044 44,603 18,283 7,871 1,911 134,711 iBB > 0.5 ≤ 2.27 51,454 37,643 10,827 5,358 2,621 107,904 iB > 2.27 ≤ 10.22 20,610 21,212 4,668 1,558 57 48,105 iCCC and below > 10.22 ≤ 100 9,853 1,834 1,700 515 4 13,906 Total 243,871 174,548 57,325 49,053 68,266 593,063 1 Reflects the probability of default for a one year time horizon. 2 Includes irrevocable lending commitments related to consumer credit exposure of € 9.2 billion as of December 31, 2015. 3 Includes the effect of netting agreements and cash collateral received where applicable.
in € m. (unless stated otherwise) Dec 31, 2014
Ratingband Probability of default in %1 Loans
Irrevocable lending commitments2
Contingent liabilities
OTC derivatives3
Debt securities available for sale Total
iAAA–iAA > 0.00 ≤ 0.04 46,493 22,938 6,281 23,068 50,808 149,589 iA > 0.04 ≤ 0.11 44,799 39,336 17,696 9,469 3,371 114,670 iBBB > 0.11 ≤ 0.5 54,167 40,145 20,190 7,810 1,746 124,057 iBB > 0.5 ≤ 2.27 50,183 31,492 11,640 3,926 3,140 100,380 iB > 2.27 ≤ 10.22 19,359 18,924 4,929 2,253 17 45,482 iCCC and below > 10.22 ≤ 100 9,417 1,612 1,352 552 50 12,983 Total 224,418 154,446 62,087 47,078 59,132 547,161 1 Reflects the probability of default for a one year time horizon. 2 Includes irrevocable lending commitments related to consumer credit exposure of € 9.4 billion as of December 31, 2014. 3 Includes the effect of netting agreements and cash collateral received where applicable.
The above table shows an overall increase in our corporate credit exposure in 2015 of € 45.9 billion or 8.4 %. The increase in irrevocable lending commitments of € 20.1 billion was primarily attributable to North America and Western Europe (excluding Germany). Loans increased by € 19.5 billion, mainly attributable to North America and Western Europe (excluding Germany) with more than half of the increase relating to foreign exchange rate movements. This includes a significant increase of € 16.5 billion in the investment-grade rating band, which is mainly driven by collateral restructuring related to ETF business within CB&S. Debt securities available for sale increased by € 9.1 billion mainly driven by increase in highly liquid securities held in the Group’s Strategic Liquidity Reserve. These increases are the result of the ongoing optimization of our liquidity reserves. The increase in debt securities available for sale is almost entirely related to the top rating band. The quality of the corporate credit exposure before risk mitigation has remained stable at 71 % share of investment-grade rated exposures compared to December 31, 2014.
We use risk mitigation techniques as described above to optimize our corporate credit exposure and reduce potential credit losses. The tables below disclose the development of our corporate credit exposure net of collateral, guarantees and hedges.
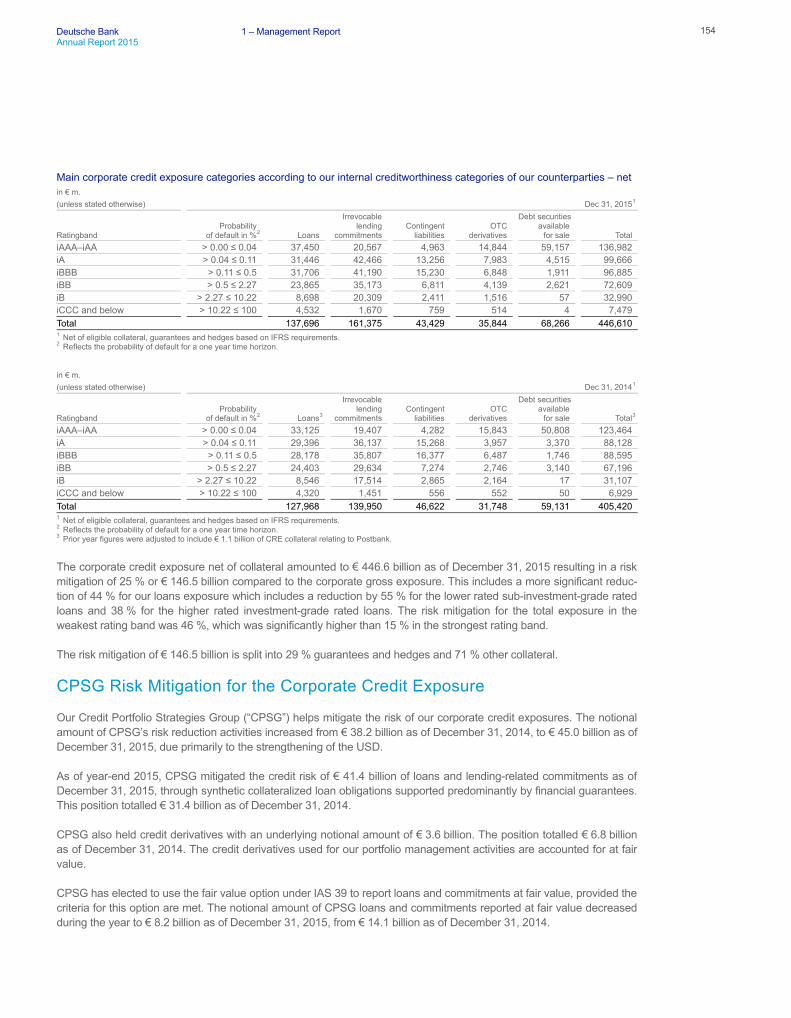
Deutsche Bank 1 – Management Report 154Annual Report 2015
Main corporate credit exposure categories according to our internal creditworthiness categories of our counterparties – net in € m. (unless stated otherwise) Dec 31, 20151
Ratingband Probability of default in %2 Loans
Irrevocable lending commitments
Contingent liabilities
OTC derivatives
Debt securities available for sale Total
iAAA–iAA > 0.00 ≤ 0.04 37,450 20,567 4,963 14,844 59,157 136,982 iA > 0.04 ≤ 0.11 31,446 42,466 13,256 7,983 4,515 99,666 iBBB > 0.11 ≤ 0.5 31,706 41,190 15,230 6,848 1,911 96,885 iBB > 0.5 ≤ 2.27 23,865 35,173 6,811 4,139 2,621 72,609 iB > 2.27 ≤ 10.22 8,698 20,309 2,411 1,516 57 32,990 iCCC and below > 10.22 ≤ 100 4,532 1,670 759 514 4 7,479 Total 137,696 161,375 43,429 35,844 68,266 446,610 1 Net of eligible collateral, guarantees and hedges based on IFRS requirements. 2 Reflects the probability of default for a one year time horizon.
in € m. (unless stated otherwise) Dec 31, 20141
Ratingband Probability of default in %2 Loans3
Irrevocable lending commitments
Contingent liabilities
OTC derivatives
Debt securities available for sale Total3
iAAA–iAA > 0.00 ≤ 0.04 33,125 19,407 4,282 15,843 50,808 123,464 iA > 0.04 ≤ 0.11 29,396 36,137 15,268 3,957 3,370 88,128 iBBB > 0.11 ≤ 0.5 28,178 35,807 16,377 6,487 1,746 88,595 iBB > 0.5 ≤ 2.27 24,403 29,634 7,274 2,746 3,140 67,196 iB > 2.27 ≤ 10.22 8,546 17,514 2,865 2,164 17 31,107 iCCC and below > 10.22 ≤ 100 4,320 1,451 556 552 50 6,929 Total 127,968 139,950 46,622 31,748 59,131 405,420 1 Net of eligible collateral, guarantees and hedges based on IFRS requirements. 2 Reflects the probability of default for a one year time horizon. 3 Prior year figures were adjusted to include € 1.1 billion of CRE collateral relating to Postbank.
The corporate credit exposure net of collateral amounted to € 446.6 billion as of December 31, 2015 resulting in a risk mitigation of 25 % or € 146.5 billion compared to the corporate gross exposure. This includes a more significant reduc-tion of 44 % for our loans exposure which includes a reduction by 55 % for the lower rated sub-investment-grade rated loans and 38 % for the higher rated investment-grade rated loans. The risk mitigation for the total exposure in the weakest rating band was 46 %, which was significantly higher than 15 % in the strongest rating band.
The risk mitigation of € 146.5 billion is split into 29 % guarantees and hedges and 71 % other collateral.
CPSG Risk Mitigation for the Corporate Credit Exposure
Our Credit Portfolio Strategies Group (“CPSG”) helps mitigate the risk of our corporate credit exposures. The notional amount of CPSG’s risk reduction activities increased from € 38.2 billion as of December 31, 2014, to € 45.0 billion as of December 31, 2015, due primarily to the strengthening of the USD.
As of year-end 2015, CPSG mitigated the credit risk of € 41.4 billion of loans and lending-related commitments as of December 31, 2015, through synthetic collateralized loan obligations supported predominantly by financial guarantees. This position totalled € 31.4 billion as of December 31, 2014.
CPSG also held credit derivatives with an underlying notional amount of € 3.6 billion. The position totalled € 6.8 billion as of December 31, 2014. The credit derivatives used for our portfolio management activities are accounted for at fair value.
CPSG has elected to use the fair value option under IAS 39 to report loans and commitments at fair value, provided the criteria for this option are met. The notional amount of CPSG loans and commitments reported at fair value decreased during the year to € 8.2 billion as of December 31, 2015, from € 14.1 billion as of December 31, 2014.
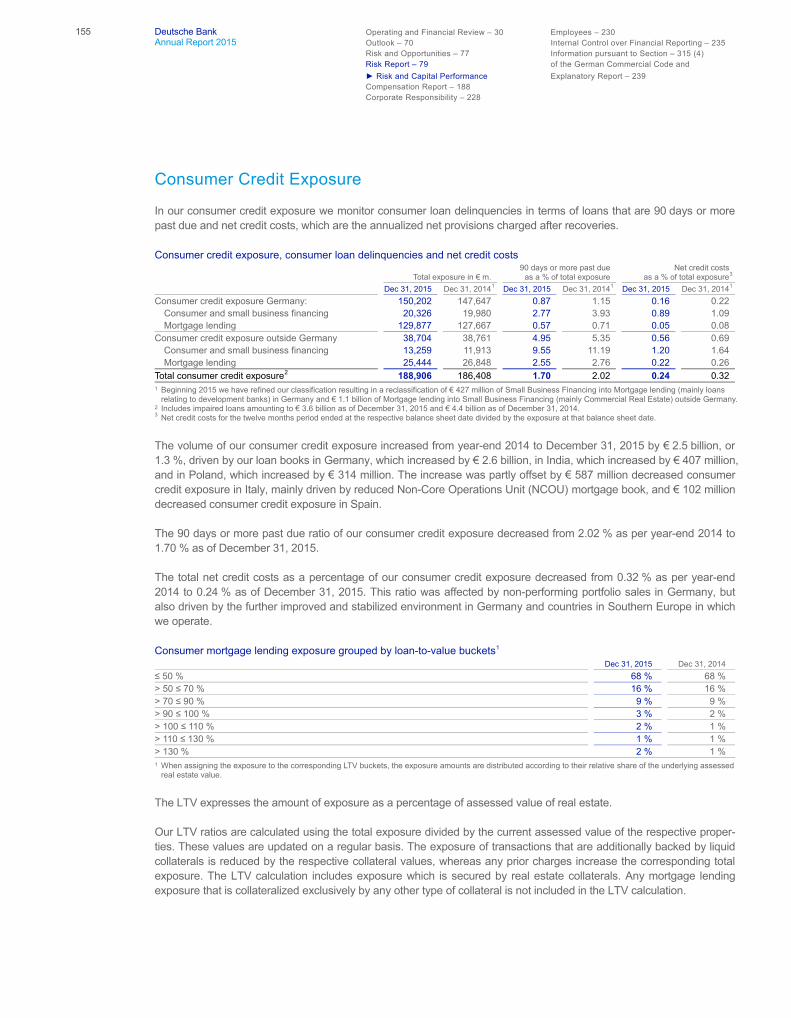
155 Deutsche Bank Operating and Financial Review – 30 Employees – 230 Annual Report 2015 Outlook – 70 Internal Control over Financial Reporting – 235 Risk and Opportunities – 77 Information pursuant to Section – 315 (4)
Risk Report – 79 of the German Commercial Code and ► Risk and Capital Performance Explanatory Report – 239
Compensation Report – 188 Corporate Responsibility – 228
Consumer Credit Exposure
In our consumer credit exposure we monitor consumer loan delinquencies in terms of loans that are 90 days or more past due and net credit costs, which are the annualized net provisions charged after recoveries.
Consumer credit exposure, consumer loan delinquencies and net credit costs
Total exposure in € m. 90 days or more past due as a % of total exposure
Net credit costs as a % of total exposure3
Dec 31, 2015 Dec 31, 20141 Dec 31, 2015 Dec 31, 20141 Dec 31, 2015 Dec 31, 20141
Consumer credit exposure Germany: 150,202 147,647 0.87 1.15 0.16 0.22 Consumer and small business financing 20,326 19,980 2.77 3.93 0.89 1.09 Mortgage lending 129,877 127,667 0.57 0.71 0.05 0.08
Consumer credit exposure outside Germany 38,704 38,761 4.95 5.35 0.56 0.69 Consumer and small business financing 13,259 11,913 9.55 11.19 1.20 1.64 Mortgage lending 25,444 26,848 2.55 2.76 0.22 0.26
Total consumer credit exposure2 188,906 186,408 1.70 2.02 0.24 0.32 1 Beginning 2015 we have refined our classification resulting in a reclassification of € 427 million of Small Business Financing into Mortgage lending (mainly loans
relating to development banks) in Germany and € 1.1 billion of Mortgage lending into Small Business Financing (mainly Commercial Real Estate) outside Germany. 2 Includes impaired loans amounting to € 3.6 billion as of December 31, 2015 and € 4.4 billion as of December 31, 2014. 3 Net credit costs for the twelve months period ended at the respective balance sheet date divided by the exposure at that balance sheet date.
The volume of our consumer credit exposure increased from year-end 2014 to December 31, 2015 by € 2.5 billion, or 1.3 %, driven by our loan books in Germany, which increased by € 2.6 billion, in India, which increased by € 407 million, and in Poland, which increased by € 314 million. The increase was partly offset by € 587 million decreased consumer credit exposure in Italy, mainly driven by reduced Non-Core Operations Unit (NCOU) mortgage book, and € 102 million decreased consumer credit exposure in Spain.
The 90 days or more past due ratio of our consumer credit exposure decreased from 2.02 % as per year-end 2014 to 1.70 % as of December 31, 2015.
The total net credit costs as a percentage of our consumer credit exposure decreased from 0.32 % as per year-end 2014 to 0.24 % as of December 31, 2015. This ratio was affected by non-performing portfolio sales in Germany, but also driven by the further improved and stabilized environment in Germany and countries in Southern Europe in which we operate.
Consumer mortgage lending exposure grouped by loan-to-value buckets1
Dec 31, 2015 Dec 31, 2014 ≤ 50 % 68 % 68 % > 50 ≤ 70 % 16 % 16 % > 70 ≤ 90 % 9 % 9 % > 90 ≤ 100 % 3 % 2 % > 100 ≤ 110 % 2 % 1 % > 110 ≤ 130 % 1 % 1 % > 130 % 2 % 1 % 1 When assigning the exposure to the corresponding LTV buckets, the exposure amounts are distributed according to their relative share of the underlying assessed
real estate value.
The LTV expresses the amount of exposure as a percentage of assessed value of real estate.
Our LTV ratios are calculated using the total exposure divided by the current assessed value of the respective proper-ties. These values are updated on a regular basis. The exposure of transactions that are additionally backed by liquid collaterals is reduced by the respective collateral values, whereas any prior charges increase the corresponding total exposure. The LTV calculation includes exposure which is secured by real estate collaterals. Any mortgage lending exposure that is collateralized exclusively by any other type of collateral is not included in the LTV calculation.

Deutsche Bank 1 – Management Report 156Annual Report 2015
The creditor’s creditworthiness, the LTV and the quality of collateral is an integral part of our risk management when originating loans and when monitoring and steering our credit risks. In general, we are willing to accept higher LTV’s, the better the creditor’s creditworthiness is. Nevertheless, restrictions of LTV apply for countries with negative eco-nomic outlook or expected declines of real estate values.
As of December 31, 2015, 68 % of our exposure related to the mortgage lending portfolio had a LTV ratio below or equal to 50 %, unchanged to the previous year.
Credit Exposure from Derivatives
All exchange traded derivatives are cleared through central counterparties (“CCPs”), the rules and regulations of which provide for daily margining of all current and future credit risk positions emerging out of such transactions. To the extent possible, we also use central counterparty clearing services for OTC derivative transactions (“OTC clearing”); we thereby benefit from the credit risk mitigation achieved through the central counterparty’s settlement system.
The Dodd-Frank Wall Street Reform and Consumer Protection Act (“DFA”) introduced mandatory OTC clearing for certain standardized OTC derivative transactions in 2013. The European Regulation (EU) No 648/2012 on OTC De-rivatives, Central Counterparties and Trade Repositories (“EMIR”) introduced a number of risk mitigation techniques for non-centrally cleared OTC derivatives in 2013 and the reporting of OTC and exchange traded derivatives in 2014. Mandatory clearing for certain standardized OTC derivatives transactions is expected to start from June 2016, and margin requirements for uncleared OTC derivative transactions are expected to be phased in from September 2016.

157 Deutsche Bank Operating and Financial Review – 30 Employees – 230 Annual Report 2015 Outlook – 70 Internal Control over Financial Reporting – 235 Risk and Opportunities – 77 Information pursuant to Section – 315 (4)
Risk Report – 79 of the German Commercial Code and ► Risk and Capital Performance Explanatory Report – 239
Compensation Report – 188 Corporate Responsibility – 228
The following table shows a breakdown of notional amounts and gross market value of derivative transactions along with a breakdown of notional amounts of OTC derivative assets and liabilities on the basis of clearing channel.
Notional amounts of OTC derivatives on basis of clearing channel and type of derivative Dec 31, 2015
Notional amount maturity distribution
in € m. Within 1 year > 1 and
≤ 5 years After 5 years Total
Positive market value
Negative market value
Net market value
Interest rate related: OTC 10,955,593 9,682,810 6,375,377 27,013,781 345,998 325,179 20,819
Bilateral (Amt) 3,906,875 4,952,043 3,205,837 12,064,755 316,736 298,220 18,516 CCP (Amt) 7,048,718 4,730,767 3,169,540 14,949,025 29,261 26,959 2,302
Exchange-traded 4,452,134 1,400,495 3,742 5,856,371 272 237 35 Total Interest rate related 15,407,727 11,083,305 6,379,119 32,870,152 346,270 325,416 20,854 Currency related:
OTC 4,672,846 1,134,801 531,085 6,338,731 116,007 115,379 628 Bilateral (Amt) 4,644,414 1,134,686 531,085 6,310,184 115,900 115,270 630 CCP (Amt) 28,432 115 0 28,547 107 109 (2)
Exchange-traded 33,064 15 0 33,079 109 174 (65) Total Currency related 4,705,910 1,134,815 531,085 6,371,810 116,116 115,553 563 Equity/index related:
OTC 394,193 197,092 23,521 614,806 25,063 28,818 (3,756) Bilateral (Amt) 394,193 197,092 23,521 614,806 25,063 28,818 (3,756) CCP (Amt) 0 0 0 0 0 0 0
Exchange-traded 501,706 66,571 8,993 577,270 5,533 6,164 (631) Total Equity/index related 895,899 263,663 32,514 1,192,076 30,596 34,983 (4,387) Credit derivatives related
OTC 270,524 949,312 129,622 1,349,458 23,548 20,992 2,556 Bilateral (Amt) 176,492 445,572 72,423 694,486 14,784 12,386 2,399 CCP (Amt) 94,032 503,741 57,199 654,972 8,763 8,606 157
Exchange-traded 0 0 0 0 0 0 0 Total Credit derivatives related 270,524 949,312 129,622 1,349,458 23,548 20,992 2,556 Commodity related:
OTC 5,998 1,260 9,516 16,775 776 891 (115) Bilateral (Amt) 5,998 1,260 9,516 16,775 776 891 (115) CCP (Amt) 0 0 0 0 0 0 0
Exchange-traded 78,204 27,066 10 105,279 497 604 (107) Total Commodity related 84,202 28,326 9,526 122,054 1,273 1,496 (223) Other:
OTC 20,621 5,378 43 26,043 906 1,953 (1,048) Bilateral (Amt) 20,618 5,378 43 26,039 902 1,953 (1,051) CCP (Amt) 3 0 0 3 3 0 3
Exchange-traded 8,430 11 0 8,441 22 49 (27) Total Other 29,051 5,389 43 34,484 928 2,002 (1,074) Total OTC business 16,319,775 11,970,654 7,069,164 35,359,593 512,297 493,213 19,084
Total bilateral business 9,148,589 6,736,032 3,842,425 19,727,045 474,162 457,538 16,623 Total CCP business 7,171,186 5,234,622 3,226,739 15,632,548 38,135 35,674 2,461
Total exchange-traded business 5,073,538 1,494,157 12,746 6,580,441 6,433 7,229 (795) Total 21,393,313 13,464,811 7,081,910 41,940,034 518,730 500,441 18,289 Positive market values after netting and cash collateral received 0 0 0 0 53,202 0 0
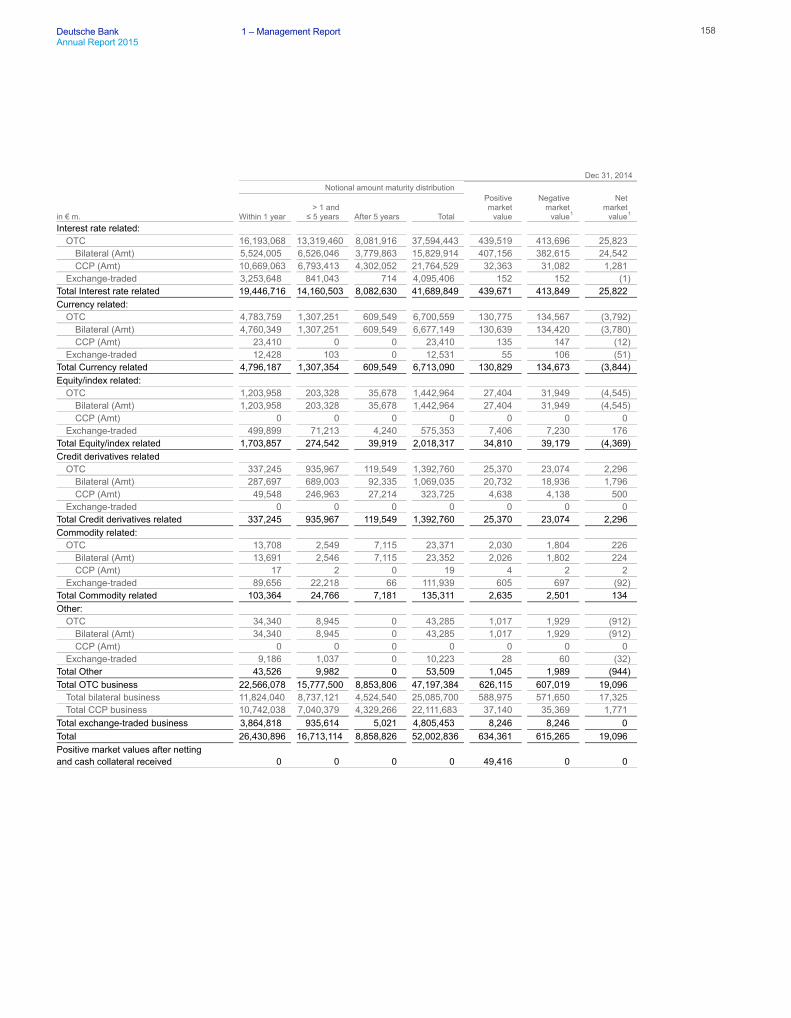
Deutsche Bank 1 – Management Report 158Annual Report 2015
Dec 31, 2014 Notional amount maturity distribution
in € m. Within 1 year > 1 and
≤ 5 years After 5 years Total
Positive market value
Negative market value1
Net market value1
Interest rate related: OTC 16,193,068 13,319,460 8,081,916 37,594,443 439,519 413,696 25,823
Bilateral (Amt) 5,524,005 6,526,046 3,779,863 15,829,914 407,156 382,615 24,542 CCP (Amt) 10,669,063 6,793,413 4,302,052 21,764,529 32,363 31,082 1,281
Exchange-traded 3,253,648 841,043 714 4,095,406 152 152 (1) Total Interest rate related 19,446,716 14,160,503 8,082,630 41,689,849 439,671 413,849 25,822 Currency related:
OTC 4,783,759 1,307,251 609,549 6,700,559 130,775 134,567 (3,792) Bilateral (Amt) 4,760,349 1,307,251 609,549 6,677,149 130,639 134,420 (3,780) CCP (Amt) 23,410 0 0 23,410 135 147 (12)
Exchange-traded 12,428 103 0 12,531 55 106 (51) Total Currency related 4,796,187 1,307,354 609,549 6,713,090 130,829 134,673 (3,844) Equity/index related:
OTC 1,203,958 203,328 35,678 1,442,964 27,404 31,949 (4,545) Bilateral (Amt) 1,203,958 203,328 35,678 1,442,964 27,404 31,949 (4,545) CCP (Amt) 0 0 0 0 0 0 0
Exchange-traded 499,899 71,213 4,240 575,353 7,406 7,230 176 Total Equity/index related 1,703,857 274,542 39,919 2,018,317 34,810 39,179 (4,369) Credit derivatives related
OTC 337,245 935,967 119,549 1,392,760 25,370 23,074 2,296 Bilateral (Amt) 287,697 689,003 92,335 1,069,035 20,732 18,936 1,796 CCP (Amt) 49,548 246,963 27,214 323,725 4,638 4,138 500
Exchange-traded 0 0 0 0 0 0 0 Total Credit derivatives related 337,245 935,967 119,549 1,392,760 25,370 23,074 2,296 Commodity related:
OTC 13,708 2,549 7,115 23,371 2,030 1,804 226 Bilateral (Amt) 13,691 2,546 7,115 23,352 2,026 1,802 224 CCP (Amt) 17 2 0 19 4 2 2
Exchange-traded 89,656 22,218 66 111,939 605 697 (92) Total Commodity related 103,364 24,766 7,181 135,311 2,635 2,501 134 Other:
OTC 34,340 8,945 0 43,285 1,017 1,929 (912) Bilateral (Amt) 34,340 8,945 0 43,285 1,017 1,929 (912) CCP (Amt) 0 0 0 0 0 0 0
Exchange-traded 9,186 1,037 0 10,223 28 60 (32) Total Other 43,526 9,982 0 53,509 1,045 1,989 (944) Total OTC business 22,566,078 15,777,500 8,853,806 47,197,384 626,115 607,019 19,096
Total bilateral business 11,824,040 8,737,121 4,524,540 25,085,700 588,975 571,650 17,325 Total CCP business 10,742,038 7,040,379 4,329,266 22,111,683 37,140 35,369 1,771
Total exchange-traded business 3,864,818 935,614 5,021 4,805,453 8,246 8,246 0 Total 26,430,896 16,713,114 8,858,826 52,002,836 634,361 615,265 19,096 Positive market values after netting and cash collateral received 0 0 0 0 49,416 0 0

159 Deutsche Bank Operating and Financial Review – 30 Employees – 230 Annual Report 2015 Outlook – 70 Internal Control over Financial Reporting – 235 Risk and Opportunities – 77 Information pursuant to Section – 315 (4)
Risk Report – 79 of the German Commercial Code and ► Risk and Capital Performance Explanatory Report – 239
Compensation Report – 188 Corporate Responsibility – 228
Equity Exposure
The table below presents the carrying values of our equity investments according to IFRS definition split by trading and nontrading for the respective reporting dates. We manage our respective positions within our market risk and other appropriate risk frameworks.
Composition of our Equity Exposure in € m. Dec 31, 2015 Dec 31, 2014 Trading Equities 76,044 69,831 Nontrading Equities1 3,228 6,402 Total Equity Exposure 79,273 76,233 1 Includes equity investment funds amounting to € 642 million as of December 31, 2015 and € 338 million as of December 31, 2014.
As of December 31, 2015, our Trading Equities exposure was mainly comprised of € 71.4 billion from CB&S activities and € 4.6 billion from Deutsche AWM business. Overall Trading Equities increased by € 6.2 billion year on year driven by increased exposure in CB&S.
Asset Quality This section describes the asset quality of our loans. All loans where known information about possible credit problems of borrowers causes our management to have serious doubts as to the collectability of the borrower’s contractual obli-gations are included in this section.
Overview of performing, renegotiated, past due and impaired loans by customer groups Dec 31, 2015 Dec 31, 20141
in € m. Corporate loans
Consumer loans Total
Corporate loans
Consumer loans Total
Loans neither past due, nor renegotiated or impaired 237,758 182,306 420,064 217,672 177,904 395,576 Past due loans, neither renegotiated nor impaired 1,143 2,544 3,687 1,304 3,650 4,954 Loans renegotiated, but not impaired 438 437 875 452 496 947 Impaired loans 4,532 3,619 8,151 4,990 4,358 9,348 Total 243,871 188,906 432,777 224,418 186,408 410,825 1 Comparatives for forborne assets as per Financial Report 2014 have been restated. As a result, the renegotiated not impaired volume has been increased by
€ 126 million erroneously not included in prior disclosure. The volume for past due and performing exposure have been adjusted by € 126 million accordingly.
Past Due Loans
Loans are considered to be past due if contractually agreed payments of principal and/or interest remain unpaid by the borrower, except if those loans are acquired through consolidation. The latter are considered to be past due if pay-ments of principal and/or interest, which were expected at a certain payment date at the time of the initial consolidation of the loans, are unpaid by the borrower.
Non-impaired past due loans at amortized cost by past due status in € m. Dec 31, 2015 Dec 31, 2014 Loans less than 30 days past due 2,387 3,223 Loans 30 or more but less than 60 days past due 547 534 Loans 60 or more but less than 90 days past due 281 363 Loans 90 days or more past due 540 898 Total 3,755 5,018

Deutsche Bank 1 – Management Report 160Annual Report 2015
Non-impaired past due loans at amortized cost by industry in € m. Dec 31, 2015 Dec 31, 20141
Financial intermediation 69 104 Fund management activities 2 95 Manufacturing 100 141 Wholesale and retail trade 91 159 Households 2,495 3,388 Commercial real estate activities 672 801 Public sector 3 5 Other 323 326 Total 3,755 5,018 1 Comparatives have been restated to reflect changes in industry sectors.
Non-impaired past due loans at amortized cost by region in € m. Dec 31, 2015 Dec 31, 2014 Germany 1,430 2,410 Western Europe (excluding Germany) 1,417 1,694 Eastern Europe 139 143 North America 641 678 Central and South America 8 29 Asia/Pacific 106 63 Africa 15 1 Other 0 0 Total 3,755 5,018
Our non-impaired past due loans decreased by € 1.3 billion to € 3.8 billion as of December 31, 2015, mainly driven by PBC amongst others reflecting the benign environment in the German credit market.
Aggregated value of collateral – with the fair values of collateral capped at loan outstandings – held against our non-impaired past due loans in € m. Dec 31, 2015 Dec 31, 2014 Financial and other collateral 2,254 2,854 Guarantees received 133 226 Total 2,387 3,080
Our aggregated value of collateral held against our non-impaired past due loans as of December 31, 2015 decreased in line with the reduction of non-impaired past due loans compared to prior year.
Forborne Loans
For economic or legal reasons we might enter into a forbearance agreement with a borrower who faces or will face financial difficulties in order to ease the contractual obligation for a limited period of time. A case by case approach is applied for our corporate clients considering each transaction and client specific facts and circumstances. For con-sumer loans we offer forbearances for a limited period of time, in which the total or partial outstanding or future instal-ments are deferred to a later point of time. However, the amount not paid including accrued interest during this period must be re-compensated at a later point of time. Repayment options include distribution over residual tenor, a one-off payment or a tenor extension. Forbearances are restricted and depending on the economic situation of the client, our risk management strategies and the local legislation. In case of a forbearance agreement is entered into, an impair-ment measurement is conducted as described below, an impairment charge is taken if necessary and the loan is sub-sequently recorded as impaired.
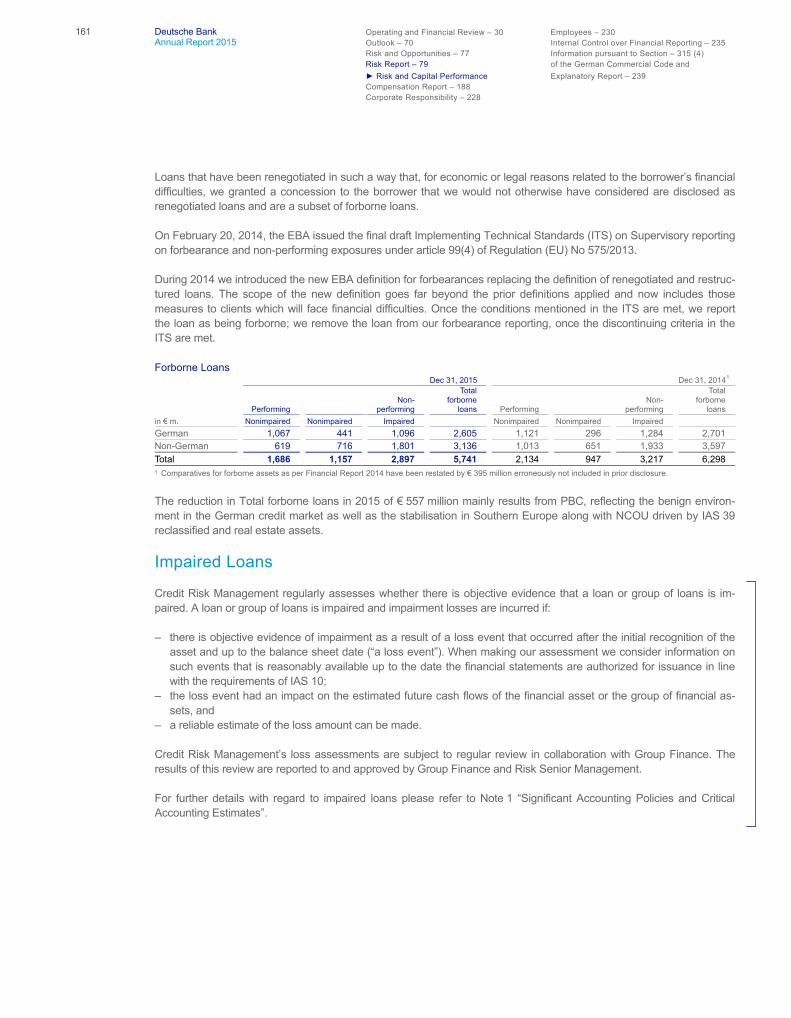
161 Deutsche Bank Operating and Financial Review – 30 Employees – 230 Annual Report 2015 Outlook – 70 Internal Control over Financial Reporting – 235 Risk and Opportunities – 77 Information pursuant to Section – 315 (4)
Risk Report – 79 of the German Commercial Code and ► Risk and Capital Performance Explanatory Report – 239
Compensation Report – 188 Corporate Responsibility – 228
Loans that have been renegotiated in such a way that, for economic or legal reasons related to the borrower’s financial difficulties, we granted a concession to the borrower that we would not otherwise have considered are disclosed as renegotiated loans and are a subset of forborne loans.
On February 20, 2014, the EBA issued the final draft Implementing Technical Standards (ITS) on Supervisory reporting on forbearance and non-performing exposures under article 99(4) of Regulation (EU) No 575/2013.
During 2014 we introduced the new EBA definition for forbearances replacing the definition of renegotiated and restruc-tured loans. The scope of the new definition goes far beyond the prior definitions applied and now includes those measures to clients which will face financial difficulties. Once the conditions mentioned in the ITS are met, we report the loan as being forborne; we remove the loan from our forbearance reporting, once the discontinuing criteria in the ITS are met.
Forborne Loans Dec 31, 2015 Dec 31, 20141
Performing Non- performing
Total forborne loans Performing
Non- performing
Total forborne loans
in € m. Nonimpaired Nonimpaired Impaired Nonimpaired Nonimpaired Impaired German 1,067 441 1,096 2,605 1,121 296 1,284 2,701 Non-German 619 716 1,801 3,136 1,013 651 1,933 3,597 Total 1,686 1,157 2,897 5,741 2,134 947 3,217 6,298 1 Comparatives for forborne assets as per Financial Report 2014 have been restated by € 395 million erroneously not included in prior disclosure.
The reduction in Total forborne loans in 2015 of € 557 million mainly results from PBC, reflecting the benign environ-ment in the German credit market as well as the stabilisation in Southern Europe along with NCOU driven by IAS 39 reclassified and real estate assets.
Impaired Loans
Credit Risk Management regularly assesses whether there is objective evidence that a loan or group of loans is im-paired. A loan or group of loans is impaired and impairment losses are incurred if:
‒ there is objective evidence of impairment as a result of a loss event that occurred after the initial recognition of the asset and up to the balance sheet date (“a loss event”). When making our assessment we consider information on such events that is reasonably available up to the date the financial statements are authorized for issuance in line with the requirements of IAS 10;
‒ the loss event had an impact on the estimated future cash flows of the financial asset or the group of financial as-sets, and
‒ a reliable estimate of the loss amount can be made.
Credit Risk Management’s loss assessments are subject to regular review in collaboration with Group Finance. The results of this review are reported to and approved by Group Finance and Risk Senior Management.
For further details with regard to impaired loans please refer to Note 1 “Significant Accounting Policies and Critical Accounting Estimates”.

Deutsche Bank 1 – Management Report 162Annual Report 2015
Impairment Loss and Allowance for Loan Losses
If there is evidence of impairment the impairment loss is generally calculated on the basis of discounted expected cash flows using the original effective interest rate of the loan. If the terms of a loan are renegotiated or otherwise modified because of financial difficulties of the borrower without qualifying for de-recognition of the loan, the impairment loss is measured using the original effective interest rate before modification of terms. We reduce the carrying amount of the impaired loan by the use of an allowance account and recognize the amount of the loss in the consolidated statement of income as a component of the provision for credit losses. We record increases to our allowance for loan losses as an increase of the provision for loan losses in our income statement. Charge-offs reduce our allowance while recover-ies, if any, are credited to the allowance account. If we determine that we no longer require allowances which we have previously established, we decrease our allowance and record the amount as a reduction of the provision for loan losses in our income statement. When it is considered that there is no realistic prospect of recovery and all collateral has been realized or transferred to us, the loan and any associated allowance for loan losses is charged off (i.e., the loan and the related allowance for loan losses are removed from the balance sheet).
While we assess the impairment for our corporate credit exposures individually, we assess the impairment of our smaller-balance standardized homogeneous loans collectively.
Our collectively assessed allowance for non-impaired loans reflects allowances to cover for incurred losses that have neither been individually identified nor provided for as part of the impairment assessment of smaller-balance homoge-neous loans.
For further details regarding our accounting policies regarding impairment loss and allowance for credit losses please refer to Note 1 “Significant Accounting Policies and Critical Accounting Estimates”.
Impaired loans, allowance for loan losses and coverage ratios by business division
Dec 31, 2015 Dec 31, 2014 2015 increase (decrease) from 2014
in € m. Impaired loans
Loan loss allowance
Impaired loan coverage ratio in %
Impaired loans
Loan loss allowance
Impaired loan coverage ratio in %
Impaired loans
Impaired loan coverage ratio in ppt
Corporate Banking & Securities 852 537 63 637 318 50 215 13 Private & Business Clients 3,800 2,365 62 4,269 2,486 58 (469) 4 Global Transaction Banking 1,306 921 71 1,574 995 63 (268) 7 Deutsche Asset & Wealth Man-agement 76 34 45 66 33 50 10 (5) Non-Core Operations Unit 2,117 1,168 55 2,803 1,380 49 (686) 6
thereof: assets reclassified to loans and receivables according to IAS 39 667 389 58 986 518 53 (319) 6
Total 8,151 5,028 62 9,348 5,212 56 (1,197) 6

163 Deutsche Bank Operating and Financial Review – 30 Employees – 230 Annual Report 2015 Outlook – 70 Internal Control over Financial Reporting – 235 Risk and Opportunities – 77 Information pursuant to Section – 315 (4)
Risk Report – 79 of the German Commercial Code and ► Risk and Capital Performance Explanatory Report – 239
Compensation Report – 188 Corporate Responsibility – 228
Impaired loans, allowance for loan losses and coverage ratios by industry Dec 31, 2015
Impaired Loans Loan loss allowance
in € m. Individually assessed
Collectively assessed Total
Individually assessed allowance
Collectively assessed allowance for impaired loans
Collectively assessed allowance for non-impaired loans Total
Impaired loan coverage ratio in %
Financial intermediation 150 5 155 38 5 55 98 63 Fund management activities 6 2 8 1 0 7 8 95 Manufacturing 498 215 712 470 149 70 688 97 Wholesale and retail trade 275 222 497 182 154 45 381 77 Households 332 2,931 3,263 324 1,805 74 2,202 67 Commercial real estate activities 1,365 281 1,646 503 36 36 576 35 Public sector 16 0 16 2 0 2 5 29 Other1 1,594 260 1,854 733 186 153 1,071 58 Total 4,236 3,915 8,151 2,252 2,335 442 5,028 62 1 Thereof “Transportation, storage and communication’: Total Impaired Loans € 858 million (44 %), Total Loan loss allowance € 375 million (35 %). The rest is split
across various industries (of which no single one contributes 25 % or more o the total of the category ‘Other’).
Dec 31, 20141
Impaired Loans Loan loss allowance
in € m. Individually assessed
Collectively assessed Total
Individually assessed allowance
Collectively assessed allowance for impaired loans
Collectively assessed allowance for non-impaired loans Total
Impaired loan coverage ratio in %
Financial intermediation 263 7 270 91 2 19 111 41 Fund management activities 64 0 64 1 0 5 6 9 Manufacturing 525 232 757 428 126 71 625 83 Wholesale and retail trade 362 229 591 211 148 36 395 67 Households 451 3,299 3,750 370 1,947 85 2,402 64 Commercial real estate activities 1,734 314 2,048 475 39 21 535 26 Public sector 54 0 54 29 0 0 30 55 Other2 1,539 277 1,815 758 193 157 1,108 61 Total 4,990 4,359 9,348 2,364 2,455 393 5,212 56 1 Comparatives have been restated to reflect changes in industry sectors. 2 Thereof ‘Transportation, storage and communication’: Total Impaired Loans € 804 million (39 %), Total Loan loss allowance € 303 million (28 %). The rest is split
across various industries (of which no single one contributes 25 % or more o the totals of the category ‘Other’).
Impaired loans, allowance for loan losses and coverage ratios by region Dec 31, 2015
Impaired Loans Loan loss allowance
in € m. Individually assessed
Collectively assessed Total
Individually assessed allowance
Collectively assessed allowance for impaired loans
Collectively assessed allowance for non-impaired loans Total
Impaired loan coverage ratio in %
Germany 1,362 1,642 3,004 647 930 105 1,682 56 Western Europe (excluding Germany) 2,280 2,057 4,337 1,294 1,237 132 2,662 61 Eastern Europe 76 179 255 38 165 10 213 83 North America 340 2 342 150 0 107 257 75 Central and South Ameri-ca 0 6 6 0 0 12 12 187 Asia/Pacific 155 23 178 100 2 60 162 91 Africa 21 5 26 23 0 5 28 107 Other 2 0 2 0 0 10 10 553 Total 4,236 3,915 8,151 2,252 2,335 442 5,028 62

Deutsche Bank 1 – Management Report 164Annual Report 2015
Dec 31, 2014 Impaired Loans Loan loss allowance
in € m. Individually assessed
Collectively assessed Total
Individually assessed allowance
Collectively assessed allowance for impaired loans
Collectively assessed allowance for non-impaired loans Total
Impaired loan coverage ratio in %
Germany 1,604 1,896 3,499 740 1,017 116 1,873 54 Western Europe (excluding Germany) 2,683 2,303 4,986 1,302 1,311 128 2,741 55 Eastern Europe 107 152 259 51 125 10 186 72 North America 423 2 425 204 0 70 274 64 Central and South Ameri-ca 2 0 3 3 0 6 9 356 Asia/Pacific 170 5 174 63 1 50 114 65 Africa 0 1 1 0 0 3 4 346 Other 1 0 1 0 0 11 11 0 Total 4,990 4,359 9,348 2,364 2,455 393 5,212 56
Development of Impaired Loans Dec 31, 2015 Dec 31, 2014
in € m. Individually assessed
Collectively assessed Total
Individually assessed
Collectively assessed Total
Balance, beginning of year 4,990 4,359 9,348 5,922 4,221 10,143 Classified as impaired during the year 898 1,176 2,073 2,112 2,181 4,293 Transferred to not impaired during the year1 (1,010) (859) (1,869) (1,425) (1,182) (2,607) Charge-offs (537) (717) (1,254) (1,037) (613) (1,651) Disposals of impaired loans (239) (53) (292) (514) (254) (768) Exchange rate and other movements 135 10 145 (68) 6 (62) Balance, end of year 4,236 3,915 8,151 4,990 4,359 9,348 1 Includes repayments.
In 2015 our impaired loans decreased by € 1.2 billion or 12.8 % to € 8.2 billion. The reduction in our individually as-sessed impaired loans portfolio is mainly driven by NCOU among others resulting from charge-offs and disposals of primarily IAS 39 reclassified assets, partly offset by an increase in CB&S mainly caused by our Shipping and Lever-aged Finance Portfolios. The reduction in our collectively assessed impaired loans portfolio mainly reflects charge-offs (also largely related to disposals) in Postbank and PBC Italy.
The impaired loans coverage ratio (defined as total on-balance sheet allowances for all loans individually impaired or collectively assessed divided by IFRS impaired loans (excluding collateral) slightly increased from 56 % as of year-end 2014 to 62 %.
Our impaired loans included € 667 million of loans reclassified to loans and receivables in accordance with IAS 39, down € 319 million from prior year’s level.
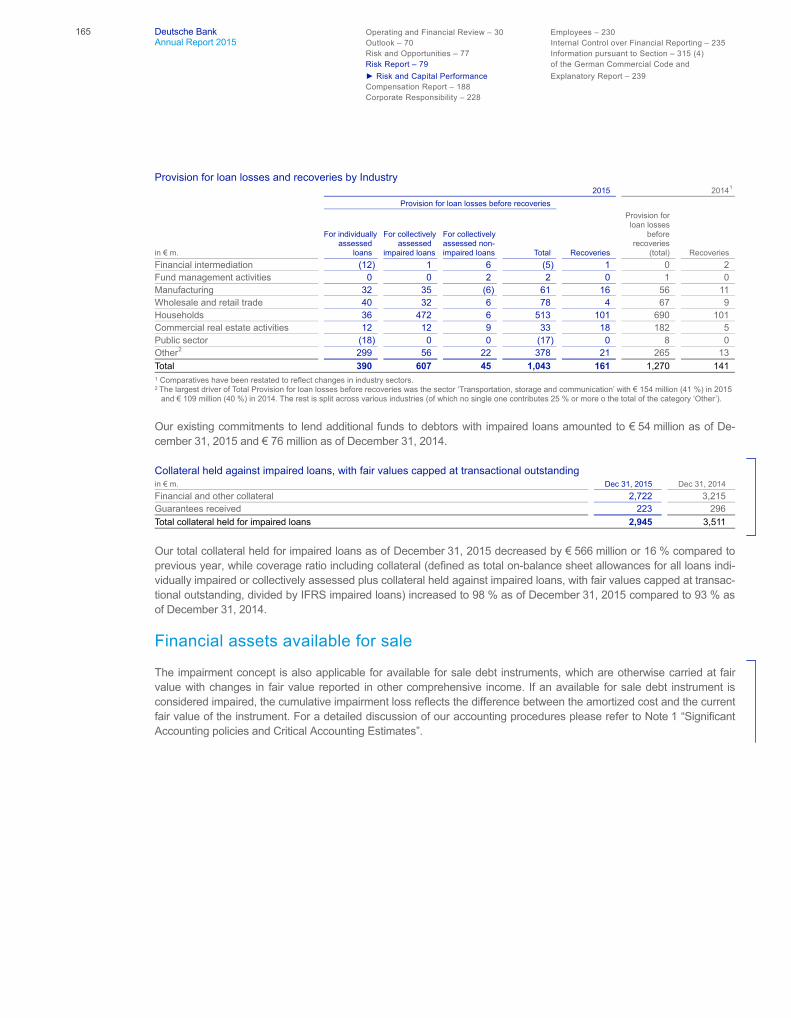
165 Deutsche Bank Operating and Financial Review – 30 Employees – 230 Annual Report 2015 Outlook – 70 Internal Control over Financial Reporting – 235 Risk and Opportunities – 77 Information pursuant to Section – 315 (4)
Risk Report – 79 of the German Commercial Code and ► Risk and Capital Performance Explanatory Report – 239
Compensation Report – 188 Corporate Responsibility – 228
Provision for loan losses and recoveries by Industry 2015 20141
Provision for loan losses before recoveries
in € m.
For individually assessed loans
For collectively assessedimpaired loans
For collectivelyassessed non-impaired loans Total Recoveries
Provision for loan losses before recoveries (total) Recoveries
Financial intermediation (12) 1 6 (5) 1 0 2 Fund management activities 0 0 2 2 0 1 0 Manufacturing 32 35 (6) 61 16 56 11 Wholesale and retail trade 40 32 6 78 4 67 9 Households 36 472 6 513 101 690 101 Commercial real estate activities 12 12 9 33 18 182 5 Public sector (18) 0 0 (17) 0 8 0 Other2 299 56 22 378 21 265 13 Total 390 607 45 1,043 161 1,270 141 1 Comparatives have been restated to reflect changes in industry sectors. 2 The largest driver of Total Provision for loan losses before recoveries was the sector ‘Transportation, storage and communication’ with € 154 million (41 %) in 2015
and € 109 million (40 %) in 2014. The rest is split across various industries (of which no single one contributes 25 % or more o the total of the category ‘Other’).
Our existing commitments to lend additional funds to debtors with impaired loans amounted to € 54 million as of De-cember 31, 2015 and € 76 million as of December 31, 2014.
Collateral held against impaired loans, with fair values capped at transactional outstanding in € m. Dec 31, 2015 Dec 31, 2014 Financial and other collateral 2,722 3,215 Guarantees received 223 296 Total collateral held for impaired loans 2,945 3,511
Our total collateral held for impaired loans as of December 31, 2015 decreased by € 566 million or 16 % compared to previous year, while coverage ratio including collateral (defined as total on-balance sheet allowances for all loans indi-vidually impaired or collectively assessed plus collateral held against impaired loans, with fair values capped at transac-tional outstanding, divided by IFRS impaired loans) increased to 98 % as of December 31, 2015 compared to 93 % as of December 31, 2014.
Financial assets available for sale
The impairment concept is also applicable for available for sale debt instruments, which are otherwise carried at fair value with changes in fair value reported in other comprehensive income. If an available for sale debt instrument is considered impaired, the cumulative impairment loss reflects the difference between the amortized cost and the current fair value of the instrument. For a detailed discussion of our accounting procedures please refer to Note 1 “Significant Accounting policies and Critical Accounting Estimates”.

Deutsche Bank 1 – Management Report 166Annual Report 2015
Non-impaired past due and impaired financial assets available for sale, accumulated impairments, coverage ratio and collateral held against impaired financial assets available for sale in € m. Dec 31, 20151 Dec 31, 2014 Financial assets non-impaired past due available for sale 1,610 N/M
thereof: Less than 30 days past due 47 N/M 30 or more but less than 60 days past due 0 N/M 60 or more but less than 90 days past due 0 N/M 90 days or more past due 1,563 N/M
Impaired financial assets available for sale 229 200 Accumulated impairment for financial assets available for sale 109 68 Impaired financial assets available for sale coverage ratio in % 47 34 Collateral held against impaired financial assets available for sale 19 N/M
thereof: Financial and other collateral 19 N/M Guarantees received 0 N/M
1 First time data collection for non-impaired past due and collateral held against impaired financial assets available for sale.
Collateral Obtained
We obtain collateral on the balance sheet by taking possession of collateral held as security or by calling upon other credit enhancements. Collateral obtained is made available for sale in an orderly fashion or through public auctions, with the proceeds used to repay or reduce outstanding indebtedness. Generally we do not occupy obtained properties for our business use. The commercial and residential real estate collateral obtained in 2015 refers predominantly to our exposures in Spain.
Collateral obtained during the reporting periods in € m. 2015 2014 Commercial real estate 5 21 Residential real estate 43 44 Other 0 0 Total collateral obtained during the reporting period 48 65
The collateral obtained, as shown in the table above, excludes collateral recorded as a result of consolidating securiti-zation trusts under IFRS 10. In 2015, the group did not obtain any collateral related to these trusts compared to € 6 million in 2014.

167 Deutsche Bank Operating and Financial Review – 30 Employees – 230 Annual Report 2015 Outlook – 70 Internal Control over Financial Reporting – 235 Risk and Opportunities – 77 Information pursuant to Section – 315 (4)
Risk Report – 79 of the German Commercial Code and ► Risk and Capital Performance Explanatory Report – 239
Compensation Report – 188 Corporate Responsibility – 228
Allowance for Credit Losses
Development of allowance for credit losses 2015 Allowance for Loan Losses Allowance for Off-Balance Sheet Positions
in € m. Individually assessed
Collectively assessed Subtotal
Individually assessed
Collectively assessed Subtotal Total
Balance, beginning of year 2,364 2,849 5,212 85 141 226 5,439 Provision for credit losses 334 548 882 58 16 74 956
thereof: (Gains)/Losses from disposal of impaired loans (64) (51) (116) 0 0 0 (116)
Net charge-offs: (482) (612) (1,094) 0 0 0 (1,094)Charge-offs (538) (717) (1,255) 0 0 0 (1,255)Recoveries 56 105 161 0 0 0 161
Other changes 36 (8) 28 1 10 11 39 Balance, end of year 2,252 2,776 5,028 144 168 312 5,340
Changes compared to prior year Provision for credit losses
Absolute (164) (83) (247) 71 (1) 70 (178)Relative (33 %) (13 %) (22 %) (538 %) (8 %) N/M1 (16 %)
Net charge-offs Absolute 515 (100) 415 0 0 0 415 Relative (52) % 19 % (28) % 0 % 0 % 0 % (28) %
Balance, end of year Absolute (112) (72) (184) 59 27 86 (99)Relative (5 %) (3) % (4 %) 69 % 19 % 38 % (2 %)
N/M – Not meaningful
Allowance for credit losses as at December 2015 amounted to € 5.3 billion compared to € 5.4 billion as at the end of 2014. The reduction is mainly driven by charge offs in part relating to disposals.
Provision for credit losses decreased by € 178 million compared to prior year, driven by a reduction in provision for loan losses of € 247 million. The reduction in 2015 in provisions for loan losses in our individually assessed loan portfolio of € 164 million is driven by IAS 39 reclassified assets and other real estate exposures recorded in NCOU, partly offset by higher provisioning in our Shipping and Leveraged Finance Portfolios in CB&S. The reduction in our collectively as-sessed loan portfolio of € 83 million mainly results from higher releases related to disposals along with an ongoing positive credit environment in Germany and a stabilization of Southern European markets. The increase in provisions for off-balance sheet exposures of € 70 million compared to 2014 is driven by GTB mainly reflecting one large item and Postbank.
The reduction in charge offs of € 415 million compared to 2014 is mainly driven by Postbank and results from high prior year levels caused by a one-off effect due to the alignment of processes.
Our allowance for loan losses for IAS 39 reclassified assets, which are reported in NCOU, amounted to € 389 million at the end of 2015, representing 8 % of our total allowance for loan losses, down 25 % from the level at the end of the prior year which amounted to € 518 million (10 % of total allowance for loan losses). This reduction was driven by net charge offs of € 113 million along with net releases of € 44 million and partly offset by increases related to foreign ex-change as most IAS 39 reclassified assets are denominated in non-Euro currencies.
Compared to 2014, provision for loan losses for IAS 39 reclassified assets dropped by € 129 million and net charge-offs increased by € 98 million in 2015. Both changes were partly related to disposals.

Deutsche Bank 1 – Management Report 168Annual Report 2015
2014 Allowance for Loan Losses Allowance for Off-Balance Sheet Positions
in € m. Individually assessed
Collectively assessed Subtotal
Individually assessed
Collectively assessed Subtotal Total
Balance, beginning of year 2,857 2,732 5,589 102 114 216 5,805 Provision for credit losses 499 631 1,129 (13) 18 4 1,134
thereof: (Gains)/Losses from disposal of impaired loans (45) (16) (61) 0 0 0 (61)
Net charge-offs: (997) (512) (1,509) 0 0 0 (1,509) Charge-offs (1,037) (613) (1,650) 0 0 0 (1,650) Recoveries 40 101 141 0 0 0 141
Other changes 5 (2) 3 (4) 10 6 9 Balance, end of year 2,364 2,849 5,212 85 141 226 5,439
Changes compared to prior year Provision for credit losses
Absolute (878) (52) (930) 2 (3) (1) (931) Relative (64) % (8) % (45) % (14) % (14) % (12 %) (45) %
Net charge-offs Absolute (296) (160) (456) 0 0 0 (456) Relative 42 % 45 % 43 % 0 % 0 % 0 % 43 %
Balance, end of year Absolute (494) 117 (376) (17) 28 11 (366) Relative (17) % 4 % (7) % (17 %) 24 % 5 % (6) %
The reduction in 2014 in provisions for loan losses in our individually assessed loan portfolio of € 878 million reflects material reductions across all businesses. The reduction in NCOU was driven by decreased provision for credit loss-es in IAS 39 reclassified and commercial real estate assets, while the performance in our Core Bank benefited from increased releases and a non-recurrence of large single name bookings. Provisions for our collectively assessed portfolio decreased compared to prior year reflecting among other factors the ongoing good environment in the Ger-man credit market.
The main driver of the increase in charge-offs against our individually assessed loan portfolio was an alignment of processes in Postbank. This alignment resulted in an adjustment of the level of loan loss allowance for loans record-ed at Postbank by € 233 million reflecting accelerated write-offs as well as the elimination of previous misclassification of recoveries in the credit quality of Postbank loans, which had been impaired after change of control, as interest income. Additionally, higher charge-offs in GTB relating to a single client credit event in the prior year contributed to the overall increase which was partly offset by reductions in charge-offs for IAS 39 reclassified assets. The increase in charge-offs against our collectively assessed loan portfolio mainly related to the disposal of impaired loan portfolios in Italy.
Our allowance for loan losses for IAS 39 reclassified assets, which are reported in NCOU, amounted to € 518 million at the end of 2014, representing 10 % of our total allowance for loan losses, up 8 % from the level at the end of the prior year which amounted to € 479 million (9 % of total allowance for loan losses). This increase was largely driven by foreign exchange as most IAS 39 reclassified assets are denominated in non-Euro currencies while additional provisions for loan losses of € 54 million were largely offset by net charge-offs of € 43 million. Compared to 2013, provision for loan losses for IAS 39 reclassified assets dropped by € 319 million and net charge-offs decreased by € 305 million in 2014. Both reductions result from the non-recurrence of large items in the present year compared to high levels in the comparison period.
Derivatives – Credit Valuation Adjustment
We establish counterparty Credit Valuation Adjustment (“CVA”) for OTC derivative transactions to cover expected credit losses. The adjustment amount is determined by assessing the potential credit exposure to a given counterparty and taking into account any collateral held, the effect of any relevant netting arrangements, expected loss given default and the credit risk, based on available market information, including CDS spreads.

169 Deutsche Bank Operating and Financial Review – 30 Employees – 230 Annual Report 2015 Outlook – 70 Internal Control over Financial Reporting – 235 Risk and Opportunities – 77 Information pursuant to Section – 315 (4)
Risk Report – 79 of the German Commercial Code and
► Risk and Capital Performance Explanatory Report – 239 Compensation Report – 188 Corporate Responsibility – 228
Treatment of Default Situations under Derivatives
Unlike standard loan assets, we generally have more options to manage the credit risk in our derivatives transactions when movement in the current replacement costs or the behavior of our counterparty indicate that there is the risk that upcoming payment obligations under the transactions might not be honored. In these situations, we are frequently able under the relevant derivatives agreements to obtain additional collateral or to terminate and close-out the derivate transactions at short notice.
The master agreements for OTC derivative transactions executed with our clients usually provide for a broad set of standard or bespoke termination rights, which allow us to respond swiftly to a counterparty’s default or to other circum-stances which indicate a high probability of failure. We have less comfort under the rules and regulations applied by clearing CCPs, which rely primarily on the clearing members default fund contributions and guarantees and less on the termination and close-out of contracts, which will be considered only at a later point in time after all other measures failed. Considering the severe systemic disruptions to the financial system, that could be caused by a disorderly failure of a CCP, the Financial Stability Board (“FSB”) recommended in October 2014 to subject CCPs to resolution regimes that apply the same objectives and provisions that apply to global systematically important banks (G-SIBs).
Our contractual termination rights are supported by internal policies and procedures with defined roles and responsibili-ties which ensure that potential counterparty defaults are identified and addressed in a timely fashion. These proce-dures include necessary settlement and trading restrictions. When our decision to terminate derivative transactions results in a residual net obligation owed by the counterparty, we restructure the obligation into a non-derivative claim and manage it through our regular work-out process. As a consequence, for accounting purposes we typically do not show any nonperforming derivatives.
Wrong-way risk occurs when exposure to a counterparty is adversely correlated with the credit quality of that counter-party. In compliance with Article 291(2) and (4) CRR we, excluding Postbank, had established a monthly process to monitor several layers of wrong-way risk (specific wrong-way risk, general explicit wrong-way risk at coun-try/industry/region levels and general implicit wrong-way risk, whereby exposures arising from transactions subject to wrong-way risk are automatically selected and presented for comment to the responsible credit officer. A wrong-way risk report is then sent to Credit Risk senior management on a monthly basis. In addition, we, excluding Postbank, utilized our established process for calibrating our own alpha factor (as defined in Article 284 (9) CRR) to estimate the overall wrong-way risk in our derivatives and securities financing transaction portfolio. Postbank derivative counterparty risk is immaterial to the Group and collateral held is typically in the form of cash.
Trading Market Risk Exposures
Value-at-Risk Metrics of Trading Units of Deutsche Bank Group (excluding Postbank)
The tables and graph below present the value-at-risk metrics calculated with a 99 % confidence level and a one-day holding period for our trading units. They exclude contributions from Postbank trading book which are calculated on a stand-alone basis.
Value-at-Risk of our Trading Units by Risk Type
Total Diversification effect
Interest rate risk
Credit spread risk
Equity price risk
Foreign exchange risk1
Commodity price risk
in € m. 2015 2014 2015 2014 2015 2014 2015 2014 2015 2014 2015 2014 2015 2014
Average 43.3 51.6 (40.9) (34.9) 20.3 25.1 30.9 31.2 16.6 14.8 15.0 13.2 1.3 2.2 Maximum 65.6 71.4 (59.2) (61.9) 30.2 42.8 40.3 38.9 28.3 24.6 25.0 21.2 4.0 10.2 Minimum 28.7 35.4 (31.0) (24.4) 16.2 15.7 24.0 25.9 9.2 9.9 6.0 6.9 0.5 0.7 Period-end 33.3 49.0 (38.8) (36.0) 18.3 18.1 26.2 29.6 11.7 15.5 15.1 20.5 0.9 1.3 1Includes value-at-risk from gold and other precious metal positions.

Deutsche Bank 1 – Management Report 170Annual Report 2015
Development of value-at-risk by risk types in 2015
The average value-at-risk over 2015 was € 43.3 million, which is a decrease of € 8.3 million compared with the full year 2014. The average interest rate value-at-risk decreased on average, and there were increases in the average Foreign Exchange and Equity value-at-risk. Foreign Exchange value at risk increased due to an increase in U.S. dollar expo-sure on average compared to the full year 2014. Equity value-at-risk increased resulting from an increase in exposure on individual equities. Additionally increases in market volatility within the one year time horizon used in VaR have also contributed to the increased Foreign Exchange and Equity value-at-risk numbers. The overall reduction in VaR is driven by the reduction in the Interest Rate value-at-risk and an improvement in the portfolio diversification.
Regulatory Trading Market Risk Measures (excluding Postbank)
The table below presents the stressed value-at-risk metrics calculated with a 99 % confidence level and a one-day holding period for our trading units. It excludes contributions from Postbank trading book which are calculated on a stand-alone basis.
Average, Maximum and Minimum Stressed Value-at-Risk by Risk Type
Total Diversification effect
Interest rate risk
Credit spread risk
Equity price risk
Foreign exchange risk1
Commodity price risk
in € m. 2015 2014 2015 2014 2015 2014 2015 2014 2015 2014 2015 2014 2015 2014 Average 105.1 109.6 (114.5) (125.4) 60.7 64.4 106.7 124.0 22.8 11.5 26.7 29.7 2.5 5.4 Maximum 135.7 161.1 (186.7) (168.0) 84.2 85.9 154.5 142.8 68.7 42.6 59.8 70.3 7.6 16.7 Minimum 82.4 81.6 (71.7) (102.3) 45.1 48.8 82.6 100.7 0.1 0.0 5.7 13.7 0.7 1.4 Period-end 106.3 120.7 (98.0) (139.3) 45.5 52.3 90.9 140.8 44.1 18.8 22.6 46.2 1.2 1.8 1 Includes value-at-risk from gold and other precious metal positions.
The average stressed value-at-risk was € 105.1 million over 2015, a decrease of € 4.5 million compared with the full year 2014. There was a reduction in the credit spread stressed value-at-risk, partly offset by an increase in equity stressed value-at-risk. Equity stressed value-at-risk increased due to increased single name exposures and a reduction in loss protection on average compared to the full year 2014. The average and period end credit spread stressed val-ue-at-risk decreases were driven by an improvement to the correlations approach used to aggregate certain compo-nents within credit spread value-at-risk.
In € m.
20
0
40
60
80
VaR Credit spread riskVaR Interest rate risk
VaR Foreign exchange including precious metalsVaR Equity risk
VaR TotalVaR Commodity risk
1/15 2/15 3/15 4/15 5/15 6/15 7/15 8/15 9/15 10/15 11/15 12/15
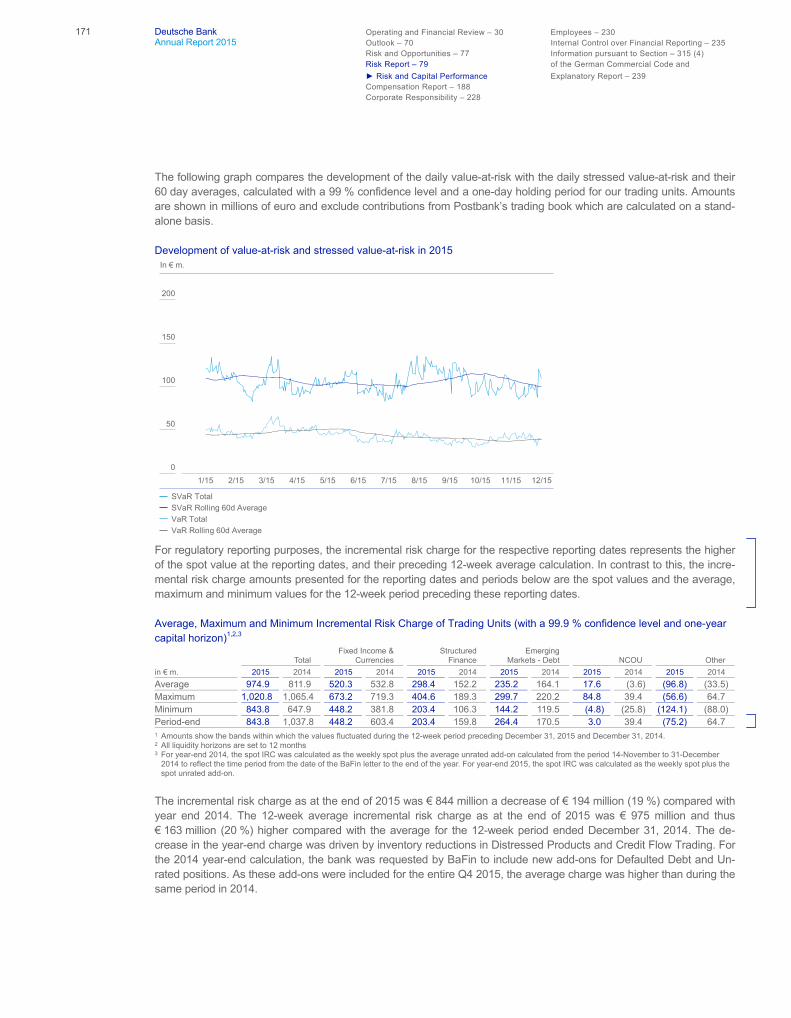
171 Deutsche Bank Operating and Financial Review – 30 Employees – 230 Annual Report 2015 Outlook – 70 Internal Control over Financial Reporting – 235 Risk and Opportunities – 77 Information pursuant to Section – 315 (4)
Risk Report – 79 of the German Commercial Code and ► Risk and Capital Performance Explanatory Report – 239
Compensation Report – 188 Corporate Responsibility – 228
The following graph compares the development of the daily value-at-risk with the daily stressed value-at-risk and their 60 day averages, calculated with a 99 % confidence level and a one-day holding period for our trading units. Amounts are shown in millions of euro and exclude contributions from Postbank’s trading book which are calculated on a stand-alone basis.
Development of value-at-risk and stressed value-at-risk in 2015
For regulatory reporting purposes, the incremental risk charge for the respective reporting dates represents the higher of the spot value at the reporting dates, and their preceding 12-week average calculation. In contrast to this, the incre-mental risk charge amounts presented for the reporting dates and periods below are the spot values and the average, maximum and minimum values for the 12-week period preceding these reporting dates.
Average, Maximum and Minimum Incremental Risk Charge of Trading Units (with a 99.9 % confidence level and one-year capital horizon)1,2,3
Total Fixed Income & Currencies
Structured Finance
Emerging Markets - Debt NCOU Other
in € m. 2015 2014 2015 2014 2015 2014 2015 2014 2015 2014 2015 2014 Average 974.9 811.9 520.3 532.8 298.4 152.2 235.2 164.1 17.6 (3.6) (96.8) (33.5) Maximum 1,020.8 1,065.4 673.2 719.3 404.6 189.3 299.7 220.2 84.8 39.4 (56.6) 64.7 Minimum 843.8 647.9 448.2 381.8 203.4 106.3 144.2 119.5 (4.8) (25.8) (124.1) (88.0) Period-end 843.8 1,037.8 448.2 603.4 203.4 159.8 264.4 170.5 3.0 39.4 (75.2) 64.7 1 Amounts show the bands within which the values fluctuated during the 12-week period preceding December 31, 2015 and December 31, 2014. 2 All liquidity horizons are set to 12 months 3 For year-end 2014, the spot IRC was calculated as the weekly spot plus the average unrated add-on calculated from the period 14-November to 31-December
2014 to reflect the time period from the date of the BaFin letter to the end of the year. For year-end 2015, the spot IRC was calculated as the weekly spot plus the spot unrated add-on.
The incremental risk charge as at the end of 2015 was € 844 million a decrease of € 194 million (19 %) compared with year end 2014. The 12-week average incremental risk charge as at the end of 2015 was € 975 million and thus € 163 million (20 %) higher compared with the average for the 12-week period ended December 31, 2014. The de-crease in the year-end charge was driven by inventory reductions in Distressed Products and Credit Flow Trading. For the 2014 year-end calculation, the bank was requested by BaFin to include new add-ons for Defaulted Debt and Un-rated positions. As these add-ons were included for the entire Q4 2015, the average charge was higher than during the same period in 2014.
50
0
SVaR Rolling 60d AverageSVaR Total
100
VaR Rolling 60d AverageVaR Total
150
In € m.
200
1/15 2/15 3/15 4/15 5/15 6/15 7/15 8/15 9/15 10/15 11/15 12/15

Deutsche Bank 1 – Management Report 172Annual Report 2015
For regulatory reporting purposes, the comprehensive risk measure for the respective reporting dates represents the higher of the internal spot value at the reporting dates, their preceding 12-week average calculation, and the floor, where the floor is equal to 8 % of the equivalent capital charge under the standardised approach securitization frame-work.
Average, Maximum and Minimum Comprehensive Risk Measure of Trading Units (with a 99.9 % confidence level and one-year capital horizon)1,2,3
in € m. 2015 2014
Average 188.4 246.9 Maximum 197.3 257.5 Minimum 180.3 223.0 Period-end 190.2 222.0
1 Regulatory Comprehensive Risk Measure calculated for the 12-week period ending December 31. 2 Period end is based on the internal model spot value. 3 All liquidity horizons are set to 12 months.
The comprehensive risk measure as at the end of 2015 was € 190 million and decreased by € 32 million (14 %) com-pared with year end 2014. The 12-week average of our comprehensive risk measure as at the end of 2015 was € 188 million and thus € 59 million (24 %) lower compared with the average for the 12-week period ended December 31, 2014. The reduction was due to continued de-risking on this portfolio.
Market Risk Standardized Approach
As of December 31, 2015, the securitization positions, for which the specific interest rate risk is calculated using the market risk standardized approach, generated capital requirements of € 810.8 million corresponding to risk weighted-assets of € 10.1 billion. As of December 31, 2014 these positions generated capital requirements of € 1,682 million corresponding to risk weighted-assets of € 21.0 billion. The reduction is due to de-risking, which has been offset by an increase following the end of the transitional period granted by Article 337 (4) CRR as the calculation is now based on the sum of the weighted net long positions and the sum of the weighted net short positions rather than the larger of the two sums. Additionally there has been an increase from foreign exchange.
For nth-to-default credit default swaps the capital requirement increased to € 6 million corresponding to risk weighted-assets of € 78 million compared with € 1 million and € 19 million as of December 31, 2014 caused by the aforemen-tioned regulatory change.
Additionally, the capital requirement for investment funds under the market risk standardized approach was € 70 million corresponding to risk weighted-assets of € 873 million as of December 31, 2015, compared with € 91 million and € 1,139 million as of December 31, 2014.
The capital requirement for longevity risk under the market risk standardized approach was € 36 million for NCOU and PIRM corresponding to risk weighted-assets of € 451 million as of December 31, 2015, compared with € 26 million and € 326 million as of December 31, 2014.
Value-at-Risk at Postbank
The value-at-risk of Postbank’s trading book calculated with a 99 % confidence level and a one-day holding period amounted to zero as of December 31, 2015 and at year-end 2014. Postbank’s current trading strategy does not allow any new trading activities with regard to the trading book. Therefore, Postbank’s trading book did not contain any posi-tions as of December 31, 2015 and at year-end 2014. Nevertheless, Postbank will remain classified as a trading book institution.
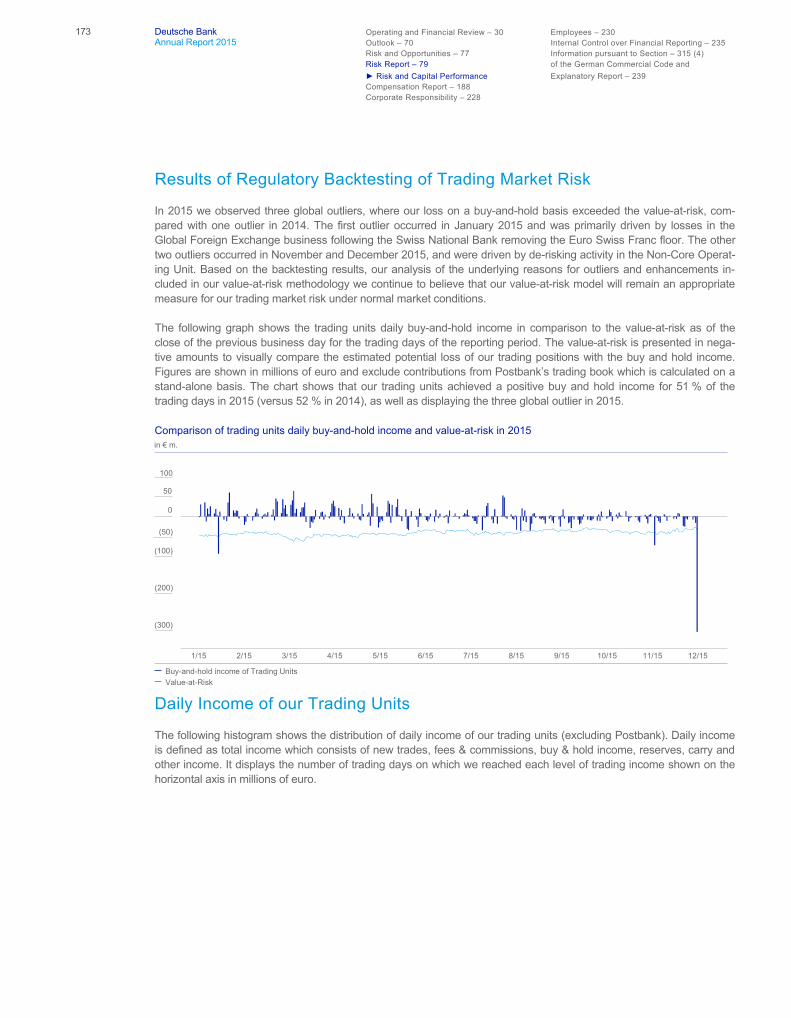
173 Deutsche Bank Operating and Financial Review – 30 Employees – 230 Annual Report 2015 Outlook – 70 Internal Control over Financial Reporting – 235 Risk and Opportunities – 77 Information pursuant to Section – 315 (4)
Risk Report – 79 of the German Commercial Code and ► Risk and Capital Performance Explanatory Report – 239
Compensation Report – 188 Corporate Responsibility – 228
Results of Regulatory Backtesting of Trading Market Risk
In 2015 we observed three global outliers, where our loss on a buy-and-hold basis exceeded the value-at-risk, com-pared with one outlier in 2014. The first outlier occurred in January 2015 and was primarily driven by losses in the Global Foreign Exchange business following the Swiss National Bank removing the Euro Swiss Franc floor. The other two outliers occurred in November and December 2015, and were driven by de-risking activity in the Non-Core Operat-ing Unit. Based on the backtesting results, our analysis of the underlying reasons for outliers and enhancements in-cluded in our value-at-risk methodology we continue to believe that our value-at-risk model will remain an appropriate measure for our trading market risk under normal market conditions.
The following graph shows the trading units daily buy-and-hold income in comparison to the value-at-risk as of the close of the previous business day for the trading days of the reporting period. The value-at-risk is presented in nega-tive amounts to visually compare the estimated potential loss of our trading positions with the buy and hold income. Figures are shown in millions of euro and exclude contributions from Postbank’s trading book which is calculated on a stand-alone basis. The chart shows that our trading units achieved a positive buy and hold income for 51 % of the trading days in 2015 (versus 52 % in 2014), as well as displaying the three global outlier in 2015.
Comparison of trading units daily buy-and-hold income and value-at-risk in 2015
Daily Income of our Trading Units
The following histogram shows the distribution of daily income of our trading units (excluding Postbank). Daily income is defined as total income which consists of new trades, fees & commissions, buy & hold income, reserves, carry and other income. It displays the number of trading days on which we reached each level of trading income shown on the horizontal axis in millions of euro.
(300)
Value-at-RiskBuy-and-hold income of Trading Units
(100)
0
in € m.
100
1/15 2/15 3/15 4/15 5/15 6/15 7/15 8/15 9/15 10/15 11/15 12/15
(200)
50
(50)

Deutsche Bank 1 – Management Report 174Annual Report 2015
Distribution of daily income of our trading units in 2015
Our trading units achieved a positive revenue for 91 % of the trading days in 2015 compared with 95 % in the full year 2014.
Nontrading Market Risk Exposures Carrying Value and Economic Capital Usage for Nontrading Market Risk Portfolios
Carrying Value and Economic Capital Usage for Nontrading Portfolios. Carrying value Economic capital usage
in € m. Dec 31, 2015 Dec 31, 2014 Dec 31, 2015 Dec 31, 2014 Strategic investments 829 4,051 332 1,676 Alternative assets 6,363 3,414 2,764 1,171
Principal investments 1,735 1,900 504 902 Other nonstrategic investment assets 4,627 1,514 2,260 269
Other nontrading market risks1 N/M N/M 9,782 7,051 Interest rate risk N/M N/M 2,057 1,683 Credit spread risk N/M N/M 1,654 319 Equity compensation risk N/M N/M 405 (237) Pension risk N/M N/M 828 1,189 Structural foreign exchange risk N/M N/M 3,183 2,672 Guaranteed funds risk N/M N/M 1,655 1,425
Total nontrading market risk portfolios 7,192 7,465 12,878 9,898 N/M – Not meaningful 1 N/M – Indicates that the risk is mostly related to off-balance sheet and liabilities items.
The total economic capital figures do take into account diversification benefits between interest rate & credit spread risks, equity compensation risk, pension risk and structural foreign exchange risk.
– Strategic investments. Economic capital usage decreased significantly mainly driven by the reclass of our partici-pation in Hua Xia Bank Company Limited to Non Strategic Investments.
– Alternative assets. The nontrading market risk economic capital increased during 2015 mainly driven from the re-classification of Hua Xia Bank to Non Strategic Investments. Further increases were driven by methodology enhancements as the alignment of the Investment Risk EC model to the standard market risk SVAR based EC model.
Days
0
10
20
30
(50)
to (4
5)(4
5) to
(40)
(40)
to (3
5
5 to
10
10 to
15
(35)
to (3
0)(3
0) to
(25)
(25)
to (2
0)(2
0) to
(15)
(15)
to (1
0)(1
0) to
(5)
(5) t
o 0
0 to
5
15 to
20
20 to
25
25 to
30
30 to
35
35 to
40
40 to
45
50 to
55
55 to
60
60 to
65
65 to
70
70 to
75
75 to
80
80 to
85
85 to
90
90 to
95
95 to
100
Ove
r 150
45 to
50
Belo
w(5
0)
100
to 1
0510
5 to
110
110
to 1
1511
5 to
120
120
to 1
2512
5 to
130
130
to 1
3513
5 to
140
140
to 1
4514
5 to
150
in €
m.

175 Deutsche Bank Operating and Financial Review – 30 Employees – 230 Annual Report 2015 Outlook – 70 Internal Control over Financial Reporting – 235 Risk and Opportunities – 77 Information pursuant to Section – 315 (4)
Risk Report – 79 of the German Commercial Code and ► Risk and Capital Performance Explanatory Report – 239
Compensation Report – 188 Corporate Responsibility – 228
– Other nontrading market risks: – Interest rate risk. Besides the allocation of economic capital to outright interest rate risk in the nontrading market
risk portfolio, a main component in this category is the maturity transformation of contractually short term depos-its. The effective duration of contractually short term deposits is based upon observable client behavior, elasticity of deposit rates to market interest rates (“DRE”) and volatility of deposit balances. Economic capital is derived by stressing modelling assumptions in particular the DRE – for the effective duration of overnight deposits. Behav-ioral and economic characteristics are taken into account when calculating the effective duration and optional ex-posures from our mortgages businesses. In total the economic capital usage for December 31, 2015 was € 2,057 million, versus € 1,683 million for December 31, 2014, predominantly driven by PBC including Postbank, BHW and Deutsche Bank Bauspar and by Treasury, reflected under Consolidation & Adjustments.
– Credit spread risk. Economic capital charge for portfolios in the banking book subject to material credit spread risk. Economic capital usage was € 1,654 million as of December 31, 2015, versus € 319 million as of December 31, 2014. The increase in economic capital usage was driven by methodology enhancements with regard to cap-turing spread risk of securities held as liquidity reserve.
– Equity compensation risk. Risk arising from structural short position in our own share price arising from restrict-ed equity units. The economic capital usage was € 405 million as of December 31, 2015 on a diversified basis, compared with € (237) million as of December 31, 2014. The increase was predominantly driven by methodology alignment to the standard traded market risk EC model.
– Pension risk. Risk arising from our defined benefit obligations, including interest rate risk and inflation risk, credit spread risk, equity risk and longevity risk. The economic capital usage was € 828 million and € 1,189 million as of December 31, 2015 and December 31, 2014 respectively. The decrease is mainly caused by additional diversifi-cation benefits with other Nontrading market risk.
– Structural foreign exchange risk. Our foreign exchange exposure arising from unhedged capital and retained earnings in non-euro currencies in certain subsidiaries. Our economic capital usage was € 3,183 million as of December 31, 2015 on a diversified basis versus € 2,672 million as of December 31, 2014. The increase is largely caused by the appreciation of the US dollar against the Euro.
– Guaranteed funds risk. The increase in economic capital usage from € 1.4 billion as of December 31, 2014 to € 1.7 billion as of December 31, 2015 was triggered predominately by changed diversification effects and meth-odology enhancements.
Operational Risk Exposure Operational Risk – Risk Profile
Operational Risk Losses by Event Type (Profit and Loss view) in € m. 2015 20141
Clients, Products and Business Practices 3,667 1,806 Internal Fraud 1,338 523 External Fraud 475 20 Execution, Delivery and Process Management 280 70 Others 22 61 Group 5,782 2,480 1 Changed 2014 loss figures due to subsequent capture of losses and reclassification.
Profit and loss based operational losses increased by € 3.3 billion or 133 % compared to year-end 2014. The increase was predominantly driven by the event types “Clients, Products and Business Practices” and “Internal Fraud”, due to settlements reached and increased litigation reserves for unsettled cases. The increase in the event type “External Fraud” is caused by a provision for equity trading fraud. The event type “Execution, Delivery and Process Management” increased, other event types decreased slightly.

Deutsche Bank 1 – Management Report 176Annual Report 2015
Operational Losses by Event Type occurred in the period 2015 (2010-2014)(1)
1 Percentages in brackets correspond to loss frequency respectively to loss amount for losses occurred in 2010-2014 period. Frequency and amounts can change subsequently.
The above left pie chart “Frequency of Operational Losses” summarizes operational risk events which occurred in 2015compared to the five-year period 2010-2014 in brackets based on the period in which a loss was first recognized for that event. For example, for a loss event that was first recognized in 2002 with an additional profit/loss event recog-nized in 2015, the frequency chart would not include the loss event, but the loss distribution chart would include theprofit/loss recognized in the respective period.
Frequencies are driven by the event type “External Fraud” with a frequency of 44 % of all observed loss events. The event types “Clients, Product and Business Practices” contribute 42 % of the events and “Execution, Delivery andProcess Management” contribute 11 %. Others are stable at 2 %. The event type “Internal Fraud” has a low frequency,resulting in less than 1 % of the loss events in the period 2015. This is unchanged compared to 2010-2014.
The above right pie chart “Distribution of Operational Losses” summarizes operational risk loss postings recognized in the profit/loss in 2015 compared to the five-year period 2010-2014. The event type “Clients, Product and BusinessPractices” dominates the operational loss distribution with a share of 63 % and is determined by outflows related tolitigation, investigations and enforcement actions. “Internal Fraud” has the second highest share (23 %) which is relatedto regulatory events we have experienced in recent years. Finally, the event types “External Fraud” (8 %) and “Execu-tion, Delivery and Process Management” (5 %) can be considered minor, compared to other event types.
Frequency of Operational Losses (first posting date) Distribution of Operational Losses (posting date)
2% (3%)Others
11% (16%)Execution, Deliveryand Process Mgmt
<1% (<1%)Internal Fraud
42% (22%)Clients, Products and
Business Practices
44% (59%)External Fraud
5% (4%)Execution, Deliveryand Process Mgmt
8% (9%)External Fraud
23% (21%)Internal Fraud
0% (2%)Others
63% (63%)Clients, Products and
Business Practices

177 Deutsche Bank Operating and Financial Review – 30 Employees – 230 Annual Report 2015 Outlook – 70 Internal Control over Financial Reporting – 235 Risk and Opportunities – 77 Information pursuant to Section – 315 (4)
Risk Report – 79 of the German Commercial Code and
► Risk and Capital Performance Explanatory Report – 239 Compensation Report – 188 Corporate Responsibility – 228
Liquidity Risk Exposure
Funding Markets and Capital Markets Issuance
Credit markets in 2015 were affected by continued political uncertainties in the eurozone, the ongoing low interest rate environment as well as the implementation in a number of jurisdictions, including Germany, of measures intended to reduce the levels of implicit sovereign support for banks, with a consequential impact on bank senior ratings. Our 5 year CDS traded within a range of 61 to 110 bps, peaking in July. Since then, the spread has slightly declined and as of year-end was trading at the higher end of the range for the year. The spreads on our bonds exhibited similar volatility. For example, our 1.25 % EUR benchmark maturing in September 2021 traded in a range of 29 to 101 bps, closing in the middle of the range at year end.
Our 2015 funding plan of up to € 35 billion, comprising debt issuance with an original maturity in excess of one year, was fully completed and we concluded 2015 having raised € 39.1 billion in term funding. This funding was broadly spread across the following funding sources: unsecured and covered benchmark issuance (€ 8.4 billion), Tier 2 benchmark issuance (€ 2.8 billion), unsecured retail-targeted issuance (€ 11.3 billion) and other unsecured and cov-ered private placements (€ 16.6 billion). Of the € 39.1 billion total, the majority was in Euro (€18.6 billion). We also issued €16.5 billion in U.S. dollar and smaller amounts in JPY and CHF. In addition to direct issuance, we use long-term cross currency swaps to manage our funding needs outside of EUR. Our investor base comprised retail custom-ers (29 %), banks (16 %), asset managers and pension funds (22 %), insurance companies (9 %) and other institution-al investors (25 %). The geographical distribution was split between Germany (22 %), rest of Europe (41 %), US (18 %), Asia/Pacific (13 %) and Other (5 %). Of our total capital markets issuance outstanding as of December 31, 2015, approximately 86 % was issued on an unsecured basis.
The average spread of our issuance over the relevant floating index (i.e., Libor) was 57 bps for the full year with an average tenor of 6.3 years. Our issuance activities were higher in the first half of the year with volumes decreasing in the second half of the year 2015. We issued the following volumes over each quarter: € 16.9 bil- lion, € 5.5 billion, € 10.4 billion and € 6.3 billion, respectively.
In 2016, our base case funding plan is up to € 35 billion which we plan to cover by accessing the above sources, with-out being overly dependent on any one source. We also plan to raise a portion of this funding in U.S. dollar and may enter into cross currency swaps to manage any residual requirements. We have total capital markets maturities, ex-cluding legally exercisable calls of approximately € 22.4 billion in 2016.
Funding Diversification
In 2015, total external funding grew by € 56.7 billion (6 %) during the year of which the majority came in our CB&S business, in particular the increases in secured funding and shorts by € 29.6 billion (37 %), in other customers by € 7.4 billion (10 %) and unsecured wholesale funding by € 5.6 billion (10 %) reflect increasing business activities in comparison to very low year-end levels in 2014, mainly driven by deleveraging activities in that year. We also saw increases in retail, including wealth management clients (€ 10.8 billion, 4 %) and transaction banking (€ 12.5 billion, 7 %). These increases more than offset the reductions in financing vehicles (€ 7.9 billion, 67 %) and in capital markets and equity (€ 1.5 billion, 1 %). The overall proportion of our most stable funding sources (comprising capital markets and equity, retail, and transaction banking) decreased from 76 % to 74 %.The overall volume of unsecured wholesale funding and secured funding fluctuated between reporting dates based on our underlying business activities. These fluctuations are dependent on client-related securities financing activities as well as changes in liquid trading invento-ries during the quarter.

Deutsche Bank 1 – Management Report 178Annual Report 2015
Composition of External Funding Sources
1 Other includes fiduciary, self-funding structures (e.g. X-markets), margin/Prime Brokerage cash balances (shown on a net basis). 2 Includes ABCP-Conduits. Reference: Reconciliation to total balance sheet: Derivatives & settlement balances € 528 billion (€ 660 billion), add-back for netting effect for Margin & Prime Brokerage cash balances (shown on a net basis) € 71 billion (€ 75 billion), other non-funding liabilities € 54 billion (€ 54 billion) for December 31, 2015 and December 31, 2014 respectively; figures may not add up due to rounding.
Maturity of unsecured wholesale funding, ABCP and capital markets issuance1
Dec 31, 2015
in € m.
Not more than 1 month
Over 1 month but not more than 3 months
Over 3 months but not more than 6 months
Over 6 months but not more than 1 year
Sub-total less than 1 year
Over 1 year but not more than 2 years
Over 2 years Total
Deposits from banks 11,101 8,073 3,196 1,399 23,769 143 69 23,981 Deposits from other wholesale customers 2,872 8,911 5,090 4,078 20,950 319 191 21,460 CDs and CP 1,216 3,718 3,984 5,636 14,555 298 1 14,853 ABCP 0 0 0 0 0 0 0 0 Senior unsecured plain vanilla 2,794 6,651 3,166 3,082 15,694 17,136 41,052 73,882 Senior unsecured structured notes 512 2,045 1,296 3,368 7,221 5,404 21,053 33,679 Covered bonds/ABS 0 51 1,371 75 1,496 2,460 18,056 22,012 Subordinated liabilities 734 680 263 310 1,987 1,376 16,199 19,562 Other 0 0 0 0 0 0 0 0 Total2 19,229 30,129 18,367 17,948 85,673 27,136 96,621 209,430
thereof: Secured 0 51 1,371 75 1,496 2,460 18,056 22,012 Unsecured 19,229 30,078 16,996 17,873 84,176 24,677 78,565 187,418
1 Includes additional tier 1 notes reported as additional equity components in the financial statements, numbers for 2014 were restated accordingly.2 Liabilities with call features are shown at earliest legally exercisable call date. No assumption is made as to whether such calls would be exercised.
75
0
December 31, 2014: total € 919 billionDecember 31, 2015: total € 976 billion
150
225
300
22% 23% 32% 33% 20% 20% 8% 8% 6% 6% 11% 9% 0% 1%
In € bn.
Capital Marketsand Equity
Retail TransactionBanking
OtherCustomers1
UnsecuredWholesale
Secured Fundingand Shorts
FinancingVehicles2
214
301
184
7455
81
12
212
312
197
8160
110
4
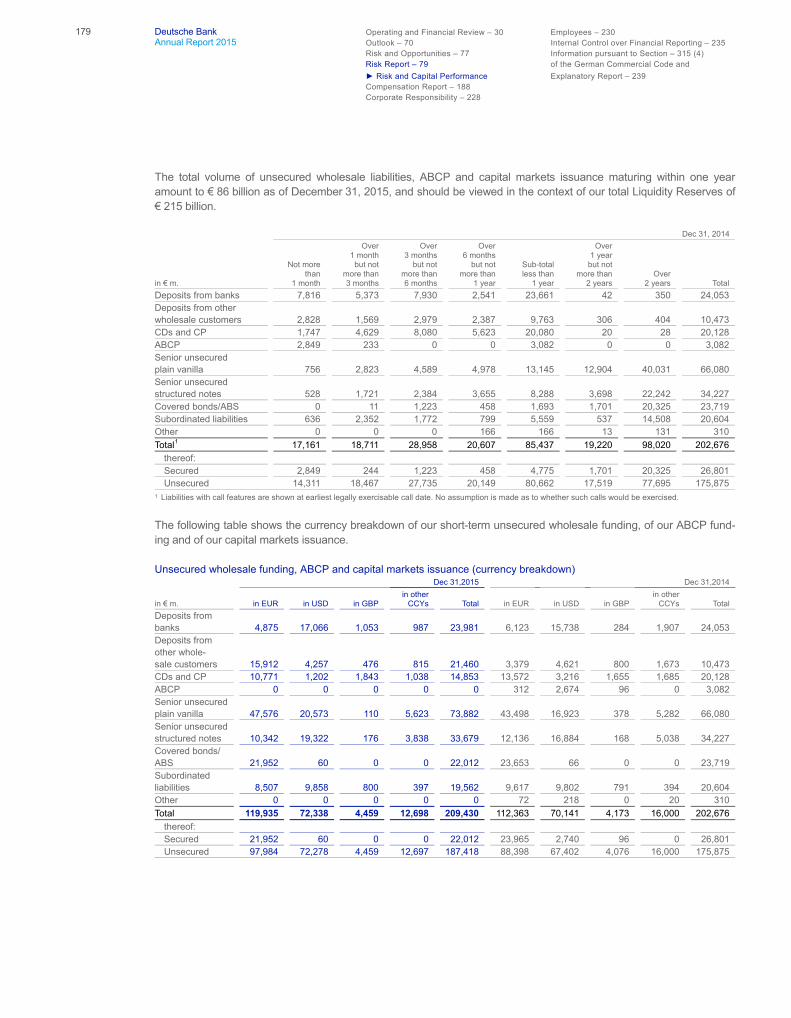
179 Deutsche Bank Operating and Financial Review – 30 Employees – 230 Annual Report 2015 Outlook – 70 Internal Control over Financial Reporting – 235 Risk and Opportunities – 77 Information pursuant to Section – 315 (4)
Risk Report – 79 of the German Commercial Code and ► Risk and Capital Performance Explanatory Report – 239
Compensation Report – 188 Corporate Responsibility – 228
The total volume of unsecured wholesale liabilities, ABCP and capital markets issuance maturing within one year amount to € 86 billion as of December 31, 2015, and should be viewed in the context of our total Liquidity Reserves of € 215 billion.
Dec 31, 2014
in € m.
Not more than 1 month
Over 1 month but not more than 3 months
Over 3 months but not more than 6 months
Over 6 months but not more than 1 year
Sub-total less than 1 year
Over 1 year but not more than 2 years
Over 2 years Total
Deposits from banks 7,816 5,373 7,930 2,541 23,661 42 350 24,053 Deposits from other wholesale customers 2,828 1,569 2,979 2,387 9,763 306 404 10,473 CDs and CP 1,747 4,629 8,080 5,623 20,080 20 28 20,128 ABCP 2,849 233 0 0 3,082 0 0 3,082 Senior unsecured plain vanilla 756 2,823 4,589 4,978 13,145 12,904 40,031 66,080 Senior unsecured structured notes 528 1,721 2,384 3,655 8,288 3,698 22,242 34,227 Covered bonds/ABS 0 11 1,223 458 1,693 1,701 20,325 23,719 Subordinated liabilities 636 2,352 1,772 799 5,559 537 14,508 20,604 Other 0 0 0 166 166 13 131 310 Total1 17,161 18,711 28,958 20,607 85,437 19,220 98,020 202,676
thereof: Secured 2,849 244 1,223 458 4,775 1,701 20,325 26,801 Unsecured 14,311 18,467 27,735 20,149 80,662 17,519 77,695 175,875
1 Liabilities with call features are shown at earliest legally exercisable call date. No assumption is made as to whether such calls would be exercised.
The following table shows the currency breakdown of our short-term unsecured wholesale funding, of our ABCP fund-ing and of our capital markets issuance.
Unsecured wholesale funding, ABCP and capital markets issuance (currency breakdown) Dec 31,2015 Dec 31,2014
in € m. in EUR in USD in GBP in other CCYs Total in EUR in USD in GBP
in other CCYs Total
Deposits from banks 4,875 17,066 1,053 987 23,981 6,123 15,738 284 1,907 24,053 Deposits from other whole- sale customers 15,912 4,257 476 815 21,460 3,379 4,621 800 1,673 10,473 CDs and CP 10,771 1,202 1,843 1,038 14,853 13,572 3,216 1,655 1,685 20,128 ABCP 0 0 0 0 0 312 2,674 96 0 3,082 Senior unsecured plain vanilla 47,576 20,573 110 5,623 73,882 43,498 16,923 378 5,282 66,080 Senior unsecured structured notes 10,342 19,322 176 3,838 33,679 12,136 16,884 168 5,038 34,227 Covered bonds/ ABS 21,952 60 0 0 22,012 23,653 66 0 0 23,719 Subordinated liabilities 8,507 9,858 800 397 19,562 9,617 9,802 791 394 20,604 Other 0 0 0 0 0 72 218 0 20 310 Total 119,935 72,338 4,459 12,698 209,430 112,363 70,141 4,173 16,000 202,676
thereof: Secured 21,952 60 0 0 22,012 23,965 2,740 96 0 26,801 Unsecured 97,984 72,278 4,459 12,697 187,418 88,398 67,402 4,076 16,000 175,875

Deutsche Bank 1 – Management Report 180Annual Report 2015
Liquidity Reserves
Composition of our freely transferable liquidity reserves by parent company (including branches) and subsidiaries Dec 31, 2015 Dec 31, 2014
in € bn. Carrying Value Liquidity Value Carrying Value Liquidity Value Available cash and cash equivalents (held primarily at central banks) 98 98 65 65
Parent (incl. foreign branches) 75 75 54 54 Subsidiaries 23 23 11 11
Highly liquid securities (includes government, government guaranteed and agency securities) 100 94 103 96
Parent (incl. foreign branches) 78 73 81 75 Subsidiaries 22 21 23 20
Other unencumbered central bank eligible securities 17 13 16 11 Parent (incl. foreign branches) 14 11 14 10 Subsidiaries 3 2 2 1
Total liquidity reserves 215 205 184 171 Parent (incl. foreign branches) 167 159 149 139 Subsidiaries 48 46 35 32
As of December 31, 2015, our freely transferable liquidity reserves amounted to € 215 billion compared with € 184 bil- lion as of December 31, 2014. The primary driver of the increase of € 31 billion in 2015 was a growth of € 34 billion inour available-cash and cash equivalents during the year mainly driven by increased external funding sources, together with small decrease in our highly-liquid securities. Our average liquidity reserves during the year were € 202.2 billion compared with € 189.8 billion during 2014. In the table above the carrying value represents the market value of our liquidity reserves while the liquidity value reflects our assumption of the value that could be obtained, primarily throughsecured funding, taking into account the experience observed in secured funding markets at times of stress.
The liquidity value (weighted) of our Liquidity Reserves of € 205 billion exceeds the liquidity value (weighted) of ourHigh Quality Liquid Assets (HQLA) of € 192 billion. The major drivers of this difference are: Liquidity Reserves include central bank eligible but otherwise less liquid securities (for example traded loans, other investment-grade corporate bonds and ABS) which are not recognised in HQLA; HQLA includes major index equities, but excludes cash balancesdeposited with central banks to satisfy a minimum cash requirements as well as cash balances deposited with non EUCentral Banks rated below AA- which are included in the LCR but not as part of the HQLA.
Liquidity Coverage Ratio
Our LCR of 119 % as of December 31, 2015 has been calculated in accordance with the Commission DelegatedRegulation (EU) 2015/61 (calculated in accordance with the EBA’s Implementing Technical Standard on Supervisory Reporting with regard to the LCR).
LCR components Dec 31, 2015
in € bn. Liquidity Value (weighted)
High quality liquid assets 192 Gross inflows 111Gross outflows 272 Net outflows 161 LCR ratio in % 119
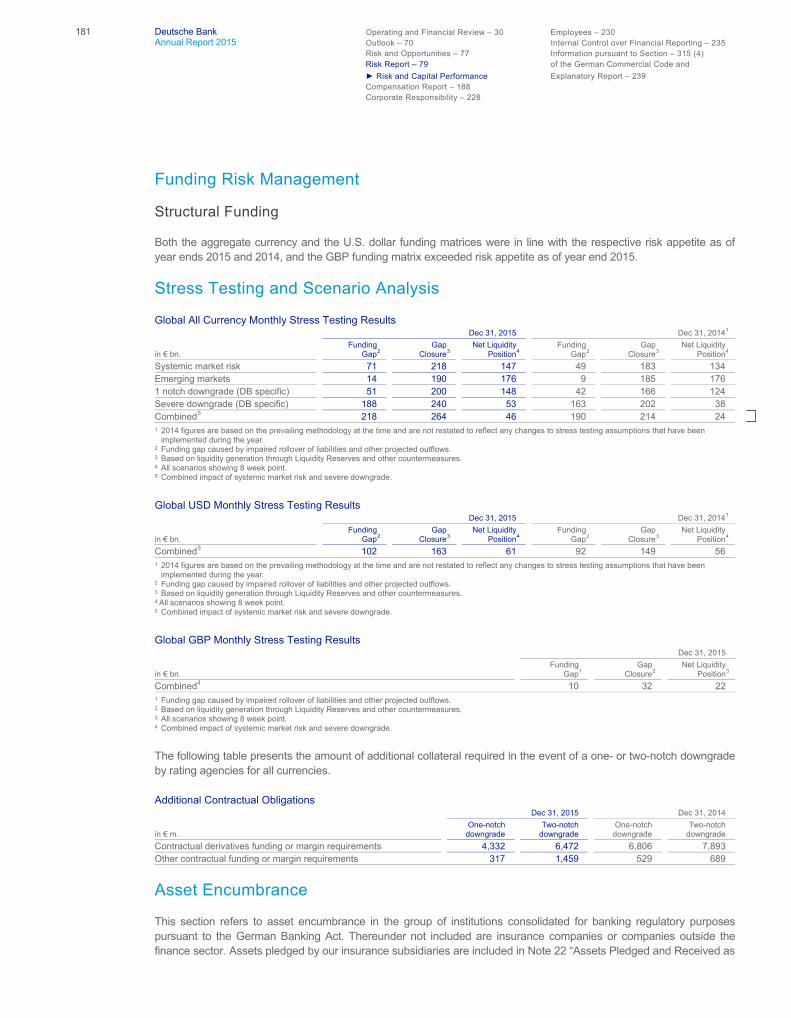
181 Deutsche Bank Operating and Financial Review – 30 Employees – 230 Annual Report 2015 Outlook – 70 Internal Control over Financial Reporting – 235 Risk and Opportunities – 77 Information pursuant to Section – 315 (4)
Risk Report – 79 of the German Commercial Code and
► Risk and Capital Performance Explanatory Report – 239 Compensation Report – 188 Corporate Responsibility – 228
Funding Risk Management
Structural Funding
Both the aggregate currency and the U.S. dollar funding matrices were in line with the respective risk appetite as of year ends 2015 and 2014, and the GBP funding matrix exceeded risk appetite as of year end 2015.
Stress Testing and Scenario Analysis
Global All Currency Monthly Stress Testing Results Dec 31, 2015 Dec 31, 20141
in € bn. Funding Gap2
Gap Closure3
Net Liquidity Position4
Funding Gap2
Gap Closure3
Net Liquidity Position4
Systemic market risk 71 218 147 49 183 134 Emerging markets 14 190 176 9 185 176 1 notch downgrade (DB specific) 51 200 148 42 166 124 Severe downgrade (DB specific) 188 240 53 163 202 38 Combined5 218 264 46 190 214 24 1 2014 figures are based on the prevailing methodology at the time and are not restated to reflect any changes to stress testing assumptions that have been
implemented during the year. 2 Funding gap caused by impaired rollover of liabilities and other projected outflows. 3 Based on liquidity generation through Liquidity Reserves and other countermeasures. 4 All scenarios showing 8 week point. 5 Combined impact of systemic market risk and severe downgrade.
Global USD Monthly Stress Testing Results Dec 31, 2015 Dec 31, 20141
in € bn. Funding Gap2
Gap Closure3
Net Liquidity Position4
Funding Gap2
Gap Closure3
Net Liquidity Position4
Combined5 102 163 61 92 149 56 1 2014 figures are based on the prevailing methodology at the time and are not restated to reflect any changes to stress testing assumptions that have been
implemented during the year. 2 Funding gap caused by impaired rollover of liabilities and other projected outflows. 3 Based on liquidity generation through Liquidity Reserves and other countermeasures. 4 All scenarios showing 8 week point. 5 Combined impact of systemic market risk and severe downgrade.
Global GBP Monthly Stress Testing Results Dec 31, 2015
in € bn. Funding Gap1
Gap Closure2
Net Liquidity Position3
Combined4 10 32 22 1 Funding gap caused by impaired rollover of liabilities and other projected outflows. 2 Based on liquidity generation through Liquidity Reserves and other countermeasures. 3 All scenarios showing 8 week point. 4 Combined impact of systemic market risk and severe downgrade.
The following table presents the amount of additional collateral required in the event of a one- or two-notch downgrade by rating agencies for all currencies.
Additional Contractual Obligations Dec 31, 2015 Dec 31, 2014
in € m. One-notch downgrade
Two-notch downgrade
One-notch downgrade
Two-notch downgrade
Contractual derivatives funding or margin requirements 4,332 6,472 6,806 7,893 Other contractual funding or margin requirements 317 1,459 529 689
Asset Encumbrance
This section refers to asset encumbrance in the group of institutions consolidated for banking regulatory purposes pursuant to the German Banking Act. Thereunder not included are insurance companies or companies outside the finance sector. Assets pledged by our insurance subsidiaries are included in Note 22 “Assets Pledged and Received as

Deutsche Bank 1 – Management Report 182Annual Report 2015
Collateral” of the Consolidated Financial Statements, and restricted assets held to satisfy obligations to insurance companies’ policy holders are included within Note 39 “Information on Subsidiaries” of the Consolidated Financial Statements.
Encumbered assets primarily comprise those on- and off-balance sheet assets that are pledged as collateral against secured funding, collateral swaps, and other collateralized obligations. Additionally, in line with the EBA technical stan-dards on regulatory asset encumbrance reporting, we consider assets placed with settlement systems, including de-fault funds and initial margins as encumbered, as well as other assets pledged which cannot be freely withdrawn such as mandatory minimum reserves at central banks. We also include derivative margin receivable assets as encumbered under these EBA guidelines.
Readily available assets are those on- and off-balance sheet assets that are not otherwise encumbered, and which are in freely transferrable form. Unencumbered financial assets at fair value, other than securities borrowed or purchased under resale agreements and positive market value from derivatives, and available for sale investments are all as-sumed to be readily available.
The readily available value represents the current balance sheet carrying value rather than any form of stressed liquidi-ty value (see the “Liquidity Reserves” for an analysis of unencumbered liquid assets available under a liquidity stress scenario). Other unencumbered on- and off-balance sheet assets are those assets that have not been pledged as collateral against secured funding or other collateralized obligations, or are otherwise not considered to be ready avail-able. Included in this category are securities borrowed or purchased under resale agreements and positive market value from derivatives. Similarly, for loans and other advances to customers, these would only be viewed as readily available to the extent they are already in a pre-packaged transferrable format, and have not already been used to generate funding. This represents the most conservative view given that an element of such loans currently shown in other could be packaged into a format that would be suitable for use to generate funding.
Encumbered and unencumbered assets Dec 31, 2015 Carrying value
Unencumbered assets in € bn. (unless stated otherwise) Assets
Encumbered assets
Readily available Other
Debt securities 215 74 141 0 Equity instruments 76 49 28 0 Other assets:
Cash and due from banks & Interest earning deposits with Banks 107 11 96 0 Securities borrowed or purchased under resale agreements1 56 0 0 56 Financial assets at fair value through profit and loss2
Trading assets 17 0 17 0 Positive market value from derivative financial instruments 518 0 0 518 Securities borrowed or purchased under resale agreements1 73 0 0 73 Other financial assets at fair value through profit or loss 12 0 12 0
Financial assets available for sale2 3 0 3 0 Loans 424 45 11 368 Other assets 132 59 0 74
Total 1,632 238 307 1,087 1 Securities borrowed and securities purchased under resale agreements are all shown as other unencumbered. The use of the underlying collateral is separately
captured in the off-balance sheet table below. 2 Excludes Debt securities and Equity instruments (separately disclosed above).
Dec 31, 2015 Fair value of collateral received Unencumbered assets
in € bn. (unless stated otherwise) Assets
Encumbered assets
Readily available Other
Collateral received: 285 238 46 1 Debt securities 197 152 45 0 Equity instruments 87 86 1 0 Other collateral received 1 0 0 1
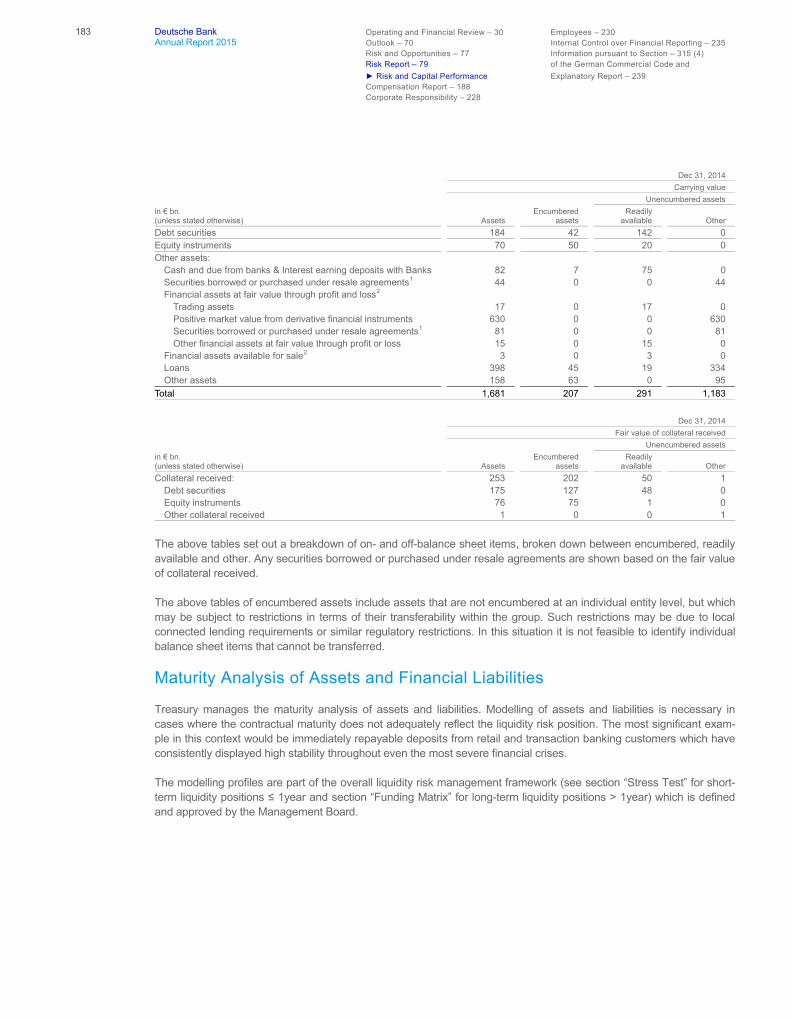
183 Deutsche Bank Operating and Financial Review – 30 Employees – 230 Annual Report 2015 Outlook – 70 Internal Control over Financial Reporting – 235 Risk and Opportunities – 77 Information pursuant to Section – 315 (4)
Risk Report – 79 of the German Commercial Code and ► Risk and Capital Performance Explanatory Report – 239
Compensation Report – 188 Corporate Responsibility – 228
Dec 31, 2014 Carrying value
Unencumbered assets in € bn. (unless stated otherwise) Assets
Encumbered assets
Readily available Other
Debt securities 184 42 142 0 Equity instruments 70 50 20 0 Other assets:
Cash and due from banks & Interest earning deposits with Banks 82 7 75 0 Securities borrowed or purchased under resale agreements1 44 0 0 44 Financial assets at fair value through profit and loss2
Trading assets 17 0 17 0 Positive market value from derivative financial instruments 630 0 0 630 Securities borrowed or purchased under resale agreements1 81 0 0 81 Other financial assets at fair value through profit or loss 15 0 15 0
Financial assets available for sale2 3 0 3 0 Loans 398 45 19 334 Other assets 158 63 0 95
Total 1,681 207 291 1,183
Dec 31, 2014 Fair value of collateral received Unencumbered assets
in € bn. (unless stated otherwise) Assets
Encumbered assets
Readily available Other
Collateral received: 253 202 50 1 Debt securities 175 127 48 0 Equity instruments 76 75 1 0 Other collateral received 1 0 0 1
The above tables set out a breakdown of on- and off-balance sheet items, broken down between encumbered, readily available and other. Any securities borrowed or purchased under resale agreements are shown based on the fair value of collateral received.
The above tables of encumbered assets include assets that are not encumbered at an individual entity level, but which may be subject to restrictions in terms of their transferability within the group. Such restrictions may be due to local connected lending requirements or similar regulatory restrictions. In this situation it is not feasible to identify individual balance sheet items that cannot be transferred.
Maturity Analysis of Assets and Financial Liabilities
Treasury manages the maturity analysis of assets and liabilities. Modelling of assets and liabilities is necessary in cases where the contractual maturity does not adequately reflect the liquidity risk position. The most significant exam-ple in this context would be immediately repayable deposits from retail and transaction banking customers which have consistently displayed high stability throughout even the most severe financial crises.
The modelling profiles are part of the overall liquidity risk management framework (see section “Stress Test” for short-term liquidity positions ≤ 1year and section “Funding Matrix” for long-term liquidity positions > 1year) which is defined and approved by the Management Board.

Deutsche Bank 1 – Management Report 184Annual Report 2015
The following tables present a maturity analysis of our total assets based on carrying value and upon earliest legally exercisable maturity as of December 31, 2015 and 2014, respectively.
Analysis of the earliest contractual maturity of assets Dec 31, 2015
in € m.
On demand (incl. Overnight and one day notice)
Up to one month
Over 1 month to no more than 3 months
Over 3 months but no more than 6 months
Over 6 months but no more than 9 months
Over 9 months but no more than 1 year
Over 1 year but no more than 2 years
Over 2 years but no more than 5 years
Over 5 years Total
Cash and central bank balances 94,290 337 0 0 0 2,313 0 0 0 96,940 Interbank balances (w/o central banks) 7,703 2,115 434 341 1 2,025 83 100 40 12,842 Central bank funds sold 0 0 0 0 0 0 0 0 0 0 Securities purchased under resale agreements 450 8,293 5,530 4,539 1,861 568 888 328 0 22,456
With banks 426 7,050 5,091 3,648 1,601 311 647 0 0 18,773 With customers 24 1,243 440 890 260 258 241 328 0 3,683
Securities borrowed 30,335 3,221 0 0 0 0 0 1 0 33,557 With banks 3,462 159 0 0 0 0 0 0 0 3,622 With customers 26,873 3,062 0 0 0 0 0 1 0 29,935
Financial assets at fair value through profit or loss – trading 735,748 35,190 6,176 3,652 1,318 1,298 5,173 6,599 25,727 820,883
Trading assets 196,035 0 0 0 0 0 0 0 0 196,035 Fixed-income securities and loans 118,671 0 0 0 0 0 0 0 0 118,671 Equities and other variable- income securities 76,044 0 0 0 0 0 0 0 0 76,044 Other trading assets 1,320 0 0 0 0 0 0 0 0 1,320
Positive market values from derivative financial instruments 515,594 0 0 0 0 0 0 0 0 515,594 Financial assets designated at fair value through profit or loss 24,119 35,190 6,176 3,652 1,318 1,298 5,173 6,599 25,727 109,253
Securities purchased under resale agreements 6,139 31,257 5,449 2,344 503 341 1,690 2,384 965 51,073 Securities borrowed 17,898 3,544 47 0 0 0 0 0 0 21,489 Fixed-income securities and loans 79 376 656 1,303 791 448 3,483 4,214 14,532 25,883 Equities and other variable- income securities 0 4 0 0 0 155 0 0 10,230 10,389 Other financial assets designated at fair value through profit or loss 2 9 24 5 24 354 0 1 0 419
Positive market values from derivative financial instruments qualifying for hedge accounting 0 9 71 75 139 58 142 716 1,925 3,136 Financial assets available for sale 18 966 1,941 1,543 893 1,998 8,832 22,880 34,513 73,583
Fixed-income securities and loans 6 481 1,937 1,543 893 952 8,815 22,869 33,873 71,368 Equities and other variable- income securities 12 485 3 0 0 1,046 17 12 640 2,215
Loans 20,375 31,464 27,851 30,337 9,142 11,313 24,272 71,890 201,104 427,749 To banks 543 2,137 3,829 1,858 1,703 870 726 1,592 926 14,183 To customers 19,832 29,327 24,022 28,480 7,439 10,442 23,546 70,299 200,177 413,565
Retail 5,363 6,048 6,102 3,065 2,536 2,874 6,743 18,787 149,127 200,646 Corporates and other customers 14,470 23,279 17,920 25,415 4,903 7,568 16,803 51,512 51,050 212,919
Other financial assets 94,078 932 1,479 564 254 1,003 115 62 66 98,555 Total financial assets 982,997 82,528 43,483 41,051 13,608 20,577 39,505 102,576 263,374 1,589,700Other assets 26,341 0 0 0 0 0 0 0 13,089 39,430 Total assets 1,009,338 82,528 43,483 41,051 13,608 20,577 39,505 102,576 276,463 1,629,130

185 Deutsche Bank Operating and Financial Review – 30 Employees – 230 Annual Report 2015 Outlook – 70 Internal Control over Financial Reporting – 235 Risk and Opportunities – 77 Information pursuant to Section – 315 (4)
Risk Report – 79 of the German Commercial Code and ► Risk and Capital Performance Explanatory Report – 239
Compensation Report – 188 Corporate Responsibility – 228
Analysis of the earliest contractual maturity of assets Dec 31, 2014
in € m.
On demand (incl. Overnight and one day notice)
Up to one month
Over 1 month to no more than 3 months
Over 3 months but no more than6 months
Over 6 months but no more than9 months
Over 9 months but no more than 1 year
Over 1 year but no more than 2 years
Over 2 years but no more than 5 years
Over 5 years Total
Cash and central bank balances1 73,515 198 104 0 0 562 0 0 103 74,482 Interbank balances (w/o central banks)1 4,987 2,497 90 16 15 1,217 101 120 48 9,090 Central bank funds sold 0 0 0 0 0 0 0 0 0 0 Securities purchased under resale agreements 4 3,553 2,416 8,143 1,659 1,719 51 240 12 17,796
With banks 4 2,154 533 647 333 561 0 2 12 4,245 With customers 0 1,399 1,883 7,496 1,326 1,159 51 238 0 13,551
Securities borrowed 21,598 4,202 0 0 0 0 0 0 34 25,834 With banks 550 964 0 0 0 0 0 0 0 1,515 With customers 21,047 3,238 0 0 0 0 0 0 34 24,319
Financial assets at fair value through profit or loss – trading 840,858 43,382 12,360 5,371 2,068 2,090 4,855 7,624 24,316 942,924
Trading assets 195,681 0 0 0 0 0 0 0 0 195,681 Fixed-income securities and loans 124,462 0 0 0 0 0 0 0 0 124,462 Equities and other variable- income securities 69,831 0 0 0 0 0 0 0 0 69,831 Other trading assets 1,387 0 0 0 0 0 0 0 0 1,387
Positive market values from derivative financial instruments 629,958 0 0 0 0 0 0 0 0 629,958 Financial assets designated at fair value through profit or loss 15,219 43,382 12,360 5,371 2,068 2,090 4,855 7,624 24,316 117,285
Securities purchased under resale agreements 1,757 36,255 11,109 4,568 1,883 501 1,530 1,849 1,021 60,473 Securities borrowed 13,462 5,783 1,159 0 0 0 0 0 0 20,404 Fixed-income securities and loans 0 1,344 92 660 184 1,588 3,010 5,775 12,957 25,612 Equities and other variable- income securities 0 0 0 0 0 0 0 0 10,339 10,339 Other financial assets designated at fair value through profit or loss 0 0 0 142 0 1 315 0 0 459
Positive market values from derivative financial instruments qualifying for hedge accounting 0 30 140 108 69 37 177 791 3,050 4,403 Financial assets available for sale 20 1,895 1,610 2,797 643 774 4,702 25,756 26,099 64,297
Fixed-income securities and loans 20 1,895 1,610 2,797 643 774 4,408 25,754 24,137 62,038 Equities and other variable- income securities 0 0 0 0 0 0 295 2 1,962 2,259
Loans 19,917 35,866 32,121 26,780 9,101 11,591 26,638 69,501 174,098 405,612 To banks 880 4,744 4,945 4,986 1,321 944 2,859 1,974 408 23,059 To customers 19,037 31,122 27,176 21,794 7,780 10,647 23,779 67,528 173,690 382,553
Retail 3,947 10,852 4,038 4,836 2,884 3,288 9,491 25,572 131,277 196,186 Corporates and other customers 15,090 20,270 23,138 16,959 4,896 7,359 14,288 41,955 42,412 186,367
Other financial assets 119,485 474 387 349 113 99 18 76 4,050 125,050 Total financial assets 1,080,383 92,098 49,228 43,564 13,668 18,089 36,542 104,108 231,809 1,669,490Other assets 15,514 1,322 707 626 196 260 268 763 19,559 39,214 Total assets 1,095,897 93,421 49,935 44,189 13,864 18,349 36,809 104,871 251,368 1,708,7031 In 2015, comparatives have been restated. See Note 1 “Significant Accounting Policies and Critical Accounting Estimates – Significant Changes in Estimates and
Changes in Presentation” for detailed information.

Deutsche Bank 1 – Management Report 186Annual Report 2015
The following tables present a maturity analysis of our total liabilities based on carrying value and upon earliest legally exercisable maturity as of December 31, 2015 and 2014, respectively.
Analysis of the earliest contractual maturity of liabilities Dec 31, 2015
in € m.
On demand (incl. Over- night and one day notice)
Up to one month
Over 1 month to no more than 3 months
Over 3 months but no more than6 months
Over 6 months but no more than9 months
Over 9 months but no more than 1 year
Over 1 year but no more than 2 years
Over 2 years but no more than 5 years
Over 5 years Total
Deposits 345,569 37,777 117,943 21,500 10,169 8,600 7,356 6,935 11,126 566,974 Due to banks 72,304 5,131 15,770 5,884 1,616 2,106 2,188 5,214 8,852 119,065 Due to customers 273,265 32,646 102,173 15,616 8,552 6,494 5,168 1,721 2,273 447,909
Retail 113,016 13,588 80,124 3,270 2,131 1,805 2,524 642 220 217,321 Corporates and other customers 160,249 19,058 22,049 12,346 6,422 4,689 2,644 1,079 2,053 230,588
Trading liabilities 546,381 0 0 0 0 0 0 0 0 546,381 Trading securities 51,327 0 0 0 0 0 0 0 0 51,327 Other trading liabilities 977 0 0 0 0 0 0 0 0 977 Negative market values from derivative financial instruments 494,076 0 0 0 0 0 0 0 0 494,076
Financial liabilities designed at fair value through profit or loss (without loan commitments and financial guarantees) 18,423 4,725 1,569 1,760 1,240 10,069 1,809 1,652 3,526 44,773
Securities sold under repurchase agreements 17,600 2,712 690 1,172 140 9,322 0 0 0 31,637 Long-term debt 269 47 342 426 879 513 1,669 1,384 3,183 8,710 Other financial liabilities designated at fair value through profit or loss 554 1,966 537 162 221 233 141 268 343 4,425
Investment contract liabilities 0 35 70 70 70 734 108 1,593 5,843 8,522 Negative market values from derivative financial instruments qualifying for hedge accounting 0 43 513 414 203 301 278 1,630 2,983 6,365 Central bank funds purchased 574 0 0 0 0 0 0 0 0 574 Securities sold under repurchase agreements 7,492 1,567 53 117 0 0 0 0 0 9,229
Due to banks 2,757 1,554 53 117 0 0 0 0 0 4,481 Due to customers 4,734 13 0 0 0 0 0 0 0 4,747
Securities loaned 2,846 10 1 0 0 0 0 0 414 3,270 Due to banks 290 6 0 0 0 0 0 0 0 295 Due to customers 2,556 5 1 0 0 0 0 0 414 2,975
Other short term borrowings 17,776 1,311 2,052 2,666 3,006 1,199 0 0 0 28,010 Long-term debt 0 3,327 8,638 6,923 4,251 2,990 39,801 45,435 48,652 160,016
Debt securities - senior 0 3,184 8,444 5,815 3,782 2,631 24,701 40,061 36,599 125,217 Debt securities - subordinated 0 0 0 619 150 100 0 1,314 4,231 6,414 Other long-term debt - senior 0 143 194 247 173 162 14,978 3,575 7,502 26,973 Other long-term debt - subordinated 0 0 0 243 146 97 121 486 319 1,412
Trust Preferred Securities 0 733 0 262 0 0 735 4,373 918 7,020 Other financial liabilities 146,678 931 2,859 198 83 170 340 14 36 151,309 Total financial liabilities 1,085,739 50,458 133,696 33,911 19,023 24,063 50,426 61,633 73,496 1,532,443Other liabilities 28,984 0 0 0 0 0 0 0 0 28,984 Total equity 0 0 0 0 0 0 0 0 67,624 67,624 Total liabilities and equity 1,114,722 50,458 133,696 33,911 19,023 24,063 50,426 61,633 141,120 1,629,051Off-balance sheet commitments given 6,433 9,833 8,772 17,963 10,036 14,221 29,240 107,376 27,999 231,874
Banks 425 406 1,405 2,354 1,301 1,059 1,512 1,213 177 9,852 Retail 231 166 103 687 678 945 2,272 1,605 7,272 13,958 Corporates and other customers 5,778 9,261 7,265 14,923 8,057 12,218 25,456 104,559 20,549 208,063
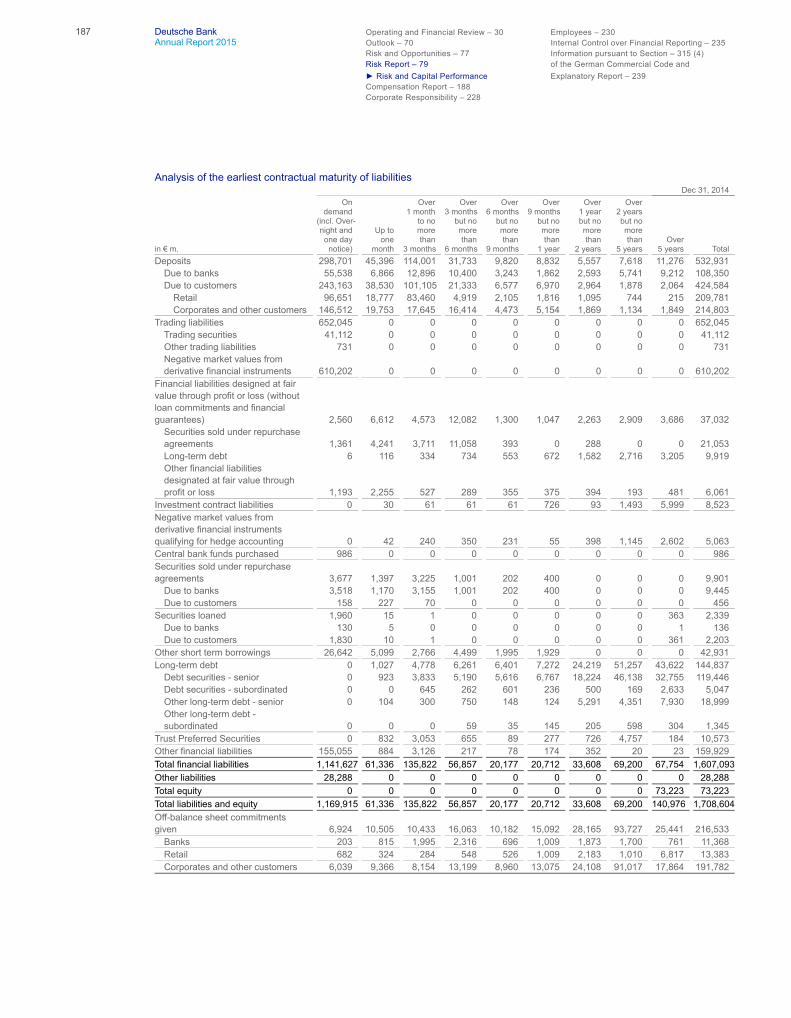
187 Deutsche Bank Operating and Financial Review – 30 Employees – 230 Annual Report 2015 Outlook – 70 Internal Control over Financial Reporting – 235 Risk and Opportunities – 77 Information pursuant to Section – 315 (4)
Risk Report – 79 of the German Commercial Code and ► Risk and Capital Performance Explanatory Report – 239
Compensation Report – 188 Corporate Responsibility – 228
Analysis of the earliest contractual maturity of liabilities Dec 31, 2014
in € m.
On demand(incl. Over- night and one day notice)
Up to one month
Over 1 month to no more than 3 months
Over 3 months but no more than6 months
Over 6 months but no more than9 months
Over 9 months but no more than 1 year
Over 1 year but no more than 2 years
Over 2 years but no more than 5 years
Over 5 years Total
Deposits 298,701 45,396 114,001 31,733 9,820 8,832 5,557 7,618 11,276 532,931 Due to banks 55,538 6,866 12,896 10,400 3,243 1,862 2,593 5,741 9,212 108,350 Due to customers 243,163 38,530 101,105 21,333 6,577 6,970 2,964 1,878 2,064 424,584
Retail 96,651 18,777 83,460 4,919 2,105 1,816 1,095 744 215 209,781 Corporates and other customers 146,512 19,753 17,645 16,414 4,473 5,154 1,869 1,134 1,849 214,803
Trading liabilities 652,045 0 0 0 0 0 0 0 0 652,045 Trading securities 41,112 0 0 0 0 0 0 0 0 41,112 Other trading liabilities 731 0 0 0 0 0 0 0 0 731 Negative market values from derivative financial instruments 610,202 0 0 0 0 0 0 0 0 610,202
Financial liabilities designed at fair value through profit or loss (without loan commitments and financial guarantees) 2,560 6,612 4,573 12,082 1,300 1,047 2,263 2,909 3,686 37,032
Securities sold under repurchase agreements 1,361 4,241 3,711 11,058 393 0 288 0 0 21,053 Long-term debt 6 116 334 734 553 672 1,582 2,716 3,205 9,919 Other financial liabilities designated at fair value through profit or loss 1,193 2,255 527 289 355 375 394 193 481 6,061
Investment contract liabilities 0 30 61 61 61 726 93 1,493 5,999 8,523 Negative market values from derivative financial instruments qualifying for hedge accounting 0 42 240 350 231 55 398 1,145 2,602 5,063 Central bank funds purchased 986 0 0 0 0 0 0 0 0 986 Securities sold under repurchase agreements 3,677 1,397 3,225 1,001 202 400 0 0 0 9,901
Due to banks 3,518 1,170 3,155 1,001 202 400 0 0 0 9,445 Due to customers 158 227 70 0 0 0 0 0 0 456
Securities loaned 1,960 15 1 0 0 0 0 0 363 2,339 Due to banks 130 5 0 0 0 0 0 0 1 136 Due to customers 1,830 10 1 0 0 0 0 0 361 2,203
Other short term borrowings 26,642 5,099 2,766 4,499 1,995 1,929 0 0 0 42,931 Long-term debt 0 1,027 4,778 6,261 6,401 7,272 24,219 51,257 43,622 144,837
Debt securities - senior 0 923 3,833 5,190 5,616 6,767 18,224 46,138 32,755 119,446 Debt securities - subordinated 0 0 645 262 601 236 500 169 2,633 5,047 Other long-term debt - senior 0 104 300 750 148 124 5,291 4,351 7,930 18,999 Other long-term debt - subordinated 0 0 0 59 35 145 205 598 304 1,345
Trust Preferred Securities 0 832 3,053 655 89 277 726 4,757 184 10,573 Other financial liabilities 155,055 884 3,126 217 78 174 352 20 23 159,929 Total financial liabilities 1,141,627 61,336 135,822 56,857 20,177 20,712 33,608 69,200 67,754 1,607,093Other liabilities 28,288 0 0 0 0 0 0 0 0 28,288 Total equity 0 0 0 0 0 0 0 0 73,223 73,223 Total liabilities and equity 1,169,915 61,336 135,822 56,857 20,177 20,712 33,608 69,200 140,976 1,708,604Off-balance sheet commitments given 6,924 10,505 10,433 16,063 10,182 15,092 28,165 93,727 25,441 216,533
Banks 203 815 1,995 2,316 696 1,009 1,873 1,700 761 11,368 Retail 682 324 284 548 526 1,009 2,183 1,010 6,817 13,383 Corporates and other customers 6,039 9,366 8,154 13,199 8,960 13,075 24,108 91,017 17,864 191,782