risk of commercial fisheries to new zealand seabird
TRANSCRIPT

Risk of commercial fisheries toNew Zealand seabird populations:Supplementary information
Supplement to New Zealand Aquatic Environment and BiodiversityReport No. 109
Y. Richard,E.R. Abraham
ISSN 1179-6480 (online)ISBN 978-0-478-40567-5 (online)
March 2013
CCSBT-ERS/1308/21

Requests for further copies should be directed to:
Publications Logistics OfficerMinistry for Primary IndustriesPO Box 2526WELLINGTON 6140
Email: [email protected]: 0800 00 83 33Facsimile: 04-894 0300
This publication is also available on the Ministry for Primary Industries websites at:http://www.mpi.govt.nz/news-resources/publications.aspxhttp://fs.fish.govt.nz go to Document library/Research reports
© Crown Copyright - Ministry for Primary Industries
CCSBT-ERS/1308/21

TABLE OF CONTENTS
1 OVERVIEW i
2 SPECIES DATA S-1S.1 Gibson’s albatross (Diomedea antipodensis gibsoni) S-1S.2 Antipodean albatross (Diomedea antipodensis antipodensis) S-2S.3 Southern royal albatross (Diomedea epomophora) S-3S.4 Northern royal albatross (Diomedea sanfordi) S-4S.5 Campbell black-browed albatross (Thalassarche impavida) S-5S.6 New Zealand white-capped albatross (Thalassarche steadi) S-6S.7 Salvin’s albatross (Thalassarche salvini) S-7S.8 Chatham Island albatross (Thalassarche eremita) S-8S.9 Grey-headed albatross (Thalassarche chrysostoma) S-9S.10 Southern Buller’s albatross (Thalassarche bulleri bulleri) S-10S.11 Northern Buller’s albatross (Thalassarche bulleri platei) S-11S.12 Light-mantled sooty albatross (Phoebetria palpebrata) S-12S.13 Northern giant petrel (Macronectes halli) S-13S.14 Grey petrel (Procellaria cinerea) S-14S.15 Black petrel (Procellaria parkinsoni) S-15S.16 Westland petrel (Procellaria westlandica) S-16S.17 White-chinned petrel (Procellaria aequinoctialis) S-17S.18 Flesh-footed shearwater (Puffinus carneipes) S-18S.19 Wedge-tailed shearwater (Puffinus pacificus) S-19S.20 Buller’s shearwater (Puffinus bulleri) S-20S.21 Sooty shearwater (Puffinus griseus) S-21S.22 Fluttering shearwater (Puffinus gavia) S-22S.23 Hutton’s shearwater (Puffinus huttoni) S-23S.24 Little shearwater (Puffinus assimilis) S-24S.25 Cape petrel (Daption capense) S-25S.26 Fairy prion (Pachyptila turtur) S-26S.27 Antarctic prion (Pachyptila desolata) S-27S.28 Broad-billed prion (Pachyptila vittata) S-28S.29 Pycroft’s petrel (Pterodroma pycrofti) S-29S.30 Cook’s petrel (Pterodroma cookii) S-30S.31 Chatham petrel (Pterodroma axillaris) S-31S.32 Mottled petrel (Pterodroma inexpectata) S-32S.33 White-necked petrel (Pterodroma cervicalis) S-33S.34 Kermadec petrel (Pterodroma neglecta) S-34S.35 Grey-faced petrel (Pterodroma macroptera) S-35S.36 Chatham Island taiko (Pterodroma magentae) S-36S.37 White-headed petrel (Pterodroma lessonii) S-37S.38 Soft-plumaged petrel (Pterodroma mollis) S-38S.39 Common diving petrel (Pelecanoides urinatrix) S-39S.40 South Georgia diving petrel (Pelecanoides georgicus) S-40S.41 New Zealand white-faced storm petrel (Pelagodroma marina) S-41S.42 White-bellied storm petrel (Fregetta grallaria) S-42S.43 Black-bellied storm petrel (Fregetta tropica) S-43S.44 Kermadec white-faced storm petrel (Pelagodroma marina albiclunis) S-44S.45 New Zealand storm petrel (Oceanites maorianus) S-45S.46 Yellow-eyed penguin (Megadyptes antipodes) S-46S.47 Northern little penguin (Eudyptula minor) S-47
Ministry for Primary Industries Risk of commercial fisheries to New Zealand seabird populations (suppl.)
CCSBT-ERS/1308/21

S.48 White-flippered little penguin (Eudyptula minor) S-48S.49 Southern little penguin (Eudyptula minor) S-49S.50 Chatham Island little penguin (Eudyptula minor) S-50S.51 Southern rockhopper penguin (Eudyptes chrysocome) S-51S.52 Fiordland crested penguin (Eudyptes pachyrhynchus) S-52S.53 Snares crested penguin (Eudyptes robustus) S-53S.54 Erect-crested penguin (Eudyptes sclateri) S-54S.55 Australasian gannet (Morus serrator) S-55S.56 Masked booby (Sula dactylatra) S-56S.57 Pied shag (Phalacrocorax varius varius) S-57S.58 Little black shag (Phalacrocorax sulcirostris) S-58S.59 New Zealand king shag (Phalacrocorax carunculatus) S-59S.60 Stewart Island shag (Phalacrocorax chalconotus) S-60S.61 Chatham Island shag (Phalacrocorax onslowi) S-61S.62 Bounty Island shag (Phalacrocorax ranfurlyi) S-62S.63 Auckland Island shag (Phalacrocorax colensoi) S-63S.64 Campbell Island shag (Phalacrocorax campbelli) S-64S.65 Spotted shag (Phalacrocorax punctatus) S-65S.66 Pitt Island shag (Phalacrocorax featherstoni) S-66S.67 Subantarctic skua (Catharacta antarctica lonnbergi) S-67S.68 Black-backed gull (Larus dominicanus) S-68S.69 Caspian tern (Sterna caspia) S-69S.70 Common white tern (Gygis alba) S-70
SUPPLEMENTARY REFERENCES S-71
Risk of commercial fisheries to New Zealand seabird populations (suppl.) Ministry for Primary Industries
CCSBT-ERS/1308/21

1. OVERVIEW
This supplementary information presents a summary of population and distributional data for the 70species included in the risk assessment of the impact of fishing-related mortalities on seabirds breedingin the New Zealand region. For each seabird species included in the risk assessment, the demographicparameters used were the New Zealand population size, the age at first reproduction, and the survivalrate. For species for which no demographic estimates were available, values from proxy species wereused, as indicated with a reference to the data source. Distributional data are presented as maps of theat-sea distribution of each species, with separate maps for the non-breeding and breeding distributions.The distribution of non-breeders was derived from existing maps published by NABIS (National AquaticBiodiversity Information System) and Birdlife International. A single distribution map was generatedwhen the breeding season extended throughout the year. Included in the distributional maps are data ofany incidental captures in commercial trawl, longline and set-net fisheries between the 2006–2007 and2010–2011 fishing years, recorded by fisheries observers.
A detailed description of the methods used to derive the data presented here is provided in Section 2 ofthe risk assessment.
Ministry for Primary Industries Risk of commercial fisheries to New Zealand seabird populations (suppl.) • i
CCSBT-ERS/1308/21

ii • Risk of commercial fisheries to New Zealand seabird populations (suppl.) Ministry for Primary Industries
CCSBT-ERS/1308/21

2. SPECIES DATA
S.1 Gibson’s albatross (Diomedea antipodensis gibsoni)
Population (NZ) 5831 (4826 – 7417) pairs [1997] Walker & Elliott (1999)Age at first reproduction 10 to 12 years L. Brooke (2004)Survival rate 93.8 to 98.5% [1996] Croxall & Gales (1998)
96 to 98% [1997] Walker & Elliott (1999)95.9 ± 0.6% [2004] Agreement on the Conservation of Albatrosses
and Petrels (ACAP) (2010)
Figure S-1: Relative density of Gibson’s albatross (Diomedea antipodensis gibsoni). The distribution basemap was obtained from BirdLife telemetry global distribution maps. The breeding season runs throughoutthe year, hence a single distribution map was created. Also shown are incidental captures recorded byobservers between the 2006–07 and 2010–11 fishing years in trawl, surface-longline (SLL), bottom-longline(BLL), and set-net (SN) fisheries.
Ministry for Primary Industries Risk of commercial fisheries to New Zealand seabird populations (suppl.) • S-1
CCSBT-ERS/1308/21

S.2 Antipodean albatross (Diomedea antipodensis antipodensis)
Population (NZ) 6292 pairs [2009] Agreement on the Conservation of Albatrossesand Petrels (ACAP) (2010)
Age at first reproduction 10 to 13 years [1997] Walker & Elliott (2002)
Survival rate 95.7 ± 0.7% [2004] Walker & Elliott (1999)
Figure S-2: Relative density of Antipodean albatross (Diomedea antipodensis antipodensis). The distributionbase map was obtained from BirdLife telemetry global distribution maps. The breeding season runsthroughout the year, hence a single distribution map was created. Also shown are incidental capturesrecorded by observers between the 2006–07 and 2010–11 fishing years in trawl, surface-longline (SLL),bottom-longline (BLL), and set-net (SN) fisheries.
S-2 • Risk of commercial fisheries to New Zealand seabird populations (suppl.) Ministry for Primary Industries
CCSBT-ERS/1308/21

S.3 Southern royal albatross (Diomedea epomophora)
Population (NZ) 7886 pairs [2008] Agreement on the Conservation of Albatrossesand Petrels (ACAP) (2010)
Age at first reproduction 8.5 to 10.6 years Robertson (1993)
Survival rate 94.9 ± 0.8% [2001] Agreement on the Conservation of Albatrossesand Petrels (ACAP) (2010)
Figure S-3: Relative density of southern royal albatross (Diomedea epomophora). The distribution base mapwas obtained from BirdLife telemetry global distribution maps. The breeding season runs throughout theyear, hence a single distribution map was created. Also shown are incidental captures recorded by observersbetween the 2006–07 and 2010–11 fishing years in trawl, surface-longline (SLL), bottom-longline (BLL), andset-net (SN) fisheries.
Ministry for Primary Industries Risk of commercial fisheries to New Zealand seabird populations (suppl.) • S-3
CCSBT-ERS/1308/21
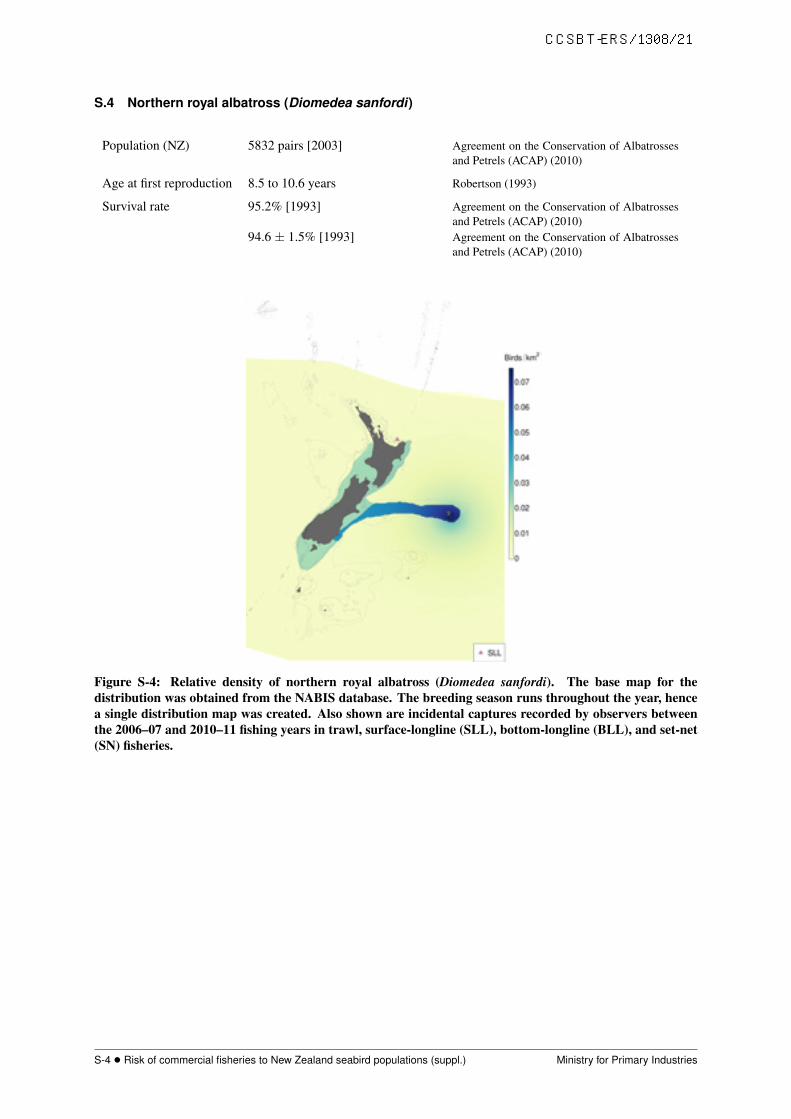
S.4 Northern royal albatross (Diomedea sanfordi)
Population (NZ) 5832 pairs [2003] Agreement on the Conservation of Albatrossesand Petrels (ACAP) (2010)
Age at first reproduction 8.5 to 10.6 years Robertson (1993)
Survival rate 95.2% [1993] Agreement on the Conservation of Albatrossesand Petrels (ACAP) (2010)
94.6 ± 1.5% [1993] Agreement on the Conservation of Albatrossesand Petrels (ACAP) (2010)
Figure S-4: Relative density of northern royal albatross (Diomedea sanfordi). The base map for thedistribution was obtained from the NABIS database. The breeding season runs throughout the year, hencea single distribution map was created. Also shown are incidental captures recorded by observers betweenthe 2006–07 and 2010–11 fishing years in trawl, surface-longline (SLL), bottom-longline (BLL), and set-net(SN) fisheries.
S-4 • Risk of commercial fisheries to New Zealand seabird populations (suppl.) Ministry for Primary Industries
CCSBT-ERS/1308/21

S.5 Campbell black-browed albatross (Thalassarche impavida)
Population (NZ) 21 000 pairs [1998] Agreement on the Conservation of Albatrossesand Petrels (ACAP) (2010)
Age at first reproduction 10 (6 – 13) years [1995] Waugh et al. (1999)
Survival rate 94.5% [1996] Agreement on the Conservation of Albatrossesand Petrels (ACAP) (2010)
(a) Breeding distribution (b) Non-breeding distribution
Figure S-5: Relative density of Campbell black-browed albatross (Thalassarche impavida). The distributionbase map was obtained from BirdLife telemetry global distribution maps. The breeding season runs fromAugust to May. Also shown are incidental captures recorded by observers between the 2006–07 and 2010–11fishing years in trawl, surface-longline (SLL), bottom-longline (BLL), and set-net (SN) fisheries.
Ministry for Primary Industries Risk of commercial fisheries to New Zealand seabird populations (suppl.) • S-5
CCSBT-ERS/1308/21

S.6 New Zealand white-capped albatross (Thalassarche steadi)
Population (NZ) 77 000 pairs [2011] Birdlife International (2012)
Age at first reproduction 12 years [2011] Southern Buller’s albatross as proxy, Francis &Sagar (2012)
Survival rate 96 (90.7 – 99.5)% [2011] Francis (2012)
Figure S-6: Relative density of New Zealand white-capped albatross (Thalassarche steadi). The base mapfor the distribution was obtained from the NABIS database. The breeding season runs throughout the year,hence a single distribution map was created. Also shown are incidental captures recorded by observersbetween the 2006–07 and 2010–11 fishing years in trawl, surface-longline (SLL), bottom-longline (BLL),and set-net (SN) fisheries.
S-6 • Risk of commercial fisheries to New Zealand seabird populations (suppl.) Ministry for Primary Industries
CCSBT-ERS/1308/21

S.7 Salvin’s albatross (Thalassarche salvini)
Population (NZ) 31 947 pairs [1998] Agreement on the Conservation of Albatrossesand Petrels (ACAP) (2010)
Age at first reproduction 12 years [2011] Southern Buller’s albatross as proxy, Francis &Sagar (2012)
Survival rate 96.7% [2011] Sagar et al. (2011)
(a) Breeding distribution (b) Non-breeding distribution
Figure S-7: Relative density of Salvin’s albatross (Thalassarche salvini). The base map for the distributionwas obtained from the NABIS database. The breeding season runs from August to April. Also shown areincidental captures recorded by observers between the 2006–07 and 2010–11 fishing years in trawl, surface-longline (SLL), bottom-longline (BLL), and set-net (SN) fisheries.
Ministry for Primary Industries Risk of commercial fisheries to New Zealand seabird populations (suppl.) • S-7
CCSBT-ERS/1308/21

S.8 Chatham Island albatross (Thalassarche eremita)
Population (NZ) 5247 pairs [2007] Birdlife International (2009)
Age at first reproduction 12 years [2011] Southern Buller’s albatross as proxy, Francis &Sagar (2012)
Survival rate 96.7% [2011] Salvin’s albatross as proxy, Sagar et al. (2011)
(a) Breeding distribution (b) Non-breeding distribution
Figure S-8: Relative density of Chatham Island albatross (Thalassarche eremita). The distribution base mapwas obtained from BirdLife telemetry global distribution maps. The breeding season runs from July toApril. Also shown are incidental captures recorded by observers between the 2006–07 and 2010–11 fishingyears in trawl, surface-longline (SLL), bottom-longline (BLL), and set-net (SN) fisheries.
S-8 • Risk of commercial fisheries to New Zealand seabird populations (suppl.) Ministry for Primary Industries
CCSBT-ERS/1308/21

S.9 Grey-headed albatross (Thalassarche chrysostoma)
Population (NZ) 6600 pairs [1997] Agreement on the Conservation of Albatrossesand Petrels (ACAP) (2010)
Age at first reproduction 7 to 13 years Schreiber & Burger (2001)
Survival rate 95.3 ± 0.9% (N = 225) [1996] Waugh et al. (1999)
(a) Breeding distribution (b) Non-breeding distribution
Figure S-9: Relative density of grey-headed albatross (Thalassarche chrysostoma). The base map for thedistribution was obtained from the NABIS database. The breeding season runs from September to May.Also shown are incidental captures recorded by observers between the 2006–07 and 2010–11 fishing yearsin trawl, surface-longline (SLL), bottom-longline (BLL), and set-net (SN) fisheries.
Ministry for Primary Industries Risk of commercial fisheries to New Zealand seabird populations (suppl.) • S-9
CCSBT-ERS/1308/21

S.10 Southern Buller’s albatross (Thalassarche bulleri bulleri)
Population (NZ) 13 625 pairs [2002] Sagar & Stahl (2005)
Age at first reproduction 12 years [2011] Francis & Sagar (2012)
Survival rate 93 to 98% [2011] Francis & Sagar (2012)
(a) Breeding distribution (b) Non-breeding distribution
Figure S-10: Relative density of southern Buller’s albatross (Thalassarche bulleri bulleri). The distributionbase map was obtained from BirdLife telemetry global distribution maps. The breeding season runs fromMarch to December. Also shown are incidental captures recorded by observers between the 2006–07 and2010–11 fishing years in trawl, surface-longline (SLL), bottom-longline (BLL), and set-net (SN) fisheries.
S-10 • Risk of commercial fisheries to New Zealand seabird populations (suppl.) Ministry for Primary Industries
CCSBT-ERS/1308/21

S.11 Northern Buller’s albatross (Thalassarche bulleri platei)
Population (NZ) 16 346 pairs [2008] Agreement on the Conservation of Albatrossesand Petrels (ACAP) (2010)
Age at first reproduction 12 years [2011] Southern Buller’s albatross as proxy, Francis &Sagar (2012)
Survival rate 93.5 (93 – 98)% [2011] Southern Buller’s albatross as proxy, Francis &Sagar (2012)
(a) Breeding distribution (b) Non-breeding distribution
Figure S-11: Relative density of northern Buller’s albatross (Thalassarche bulleri platei). The base mapfor the distribution was obtained from the NABIS database. The breeding season runs from December toSeptember. Also shown are incidental captures recorded by observers between the 2006–07 and 2010–11fishing years in trawl, surface-longline (SLL), bottom-longline (BLL), and set-net (SN) fisheries.
Ministry for Primary Industries Risk of commercial fisheries to New Zealand seabird populations (suppl.) • S-11
CCSBT-ERS/1308/21

S.12 Light-mantled sooty albatross (Phoebetria palpebrata)
Population (NZ) 6770 to 6900 pairs Taylor (2000a)
Age at first reproduction 12 years L. Brooke (2004)
Survival rate 96 to 98% [1997] Gibson’s albatross as proxy, Walker & Elliott(1999)
(a) Breeding distribution (b) Non-breeding distribution
Figure S-12: Relative density of light-mantled sooty albatross (Phoebetria palpebrata). The base map for thedistribution was obtained from the NABIS database. The breeding season runs from September to May.Also shown are incidental captures recorded by observers between the 2006–07 and 2010–11 fishing yearsin trawl, surface-longline (SLL), bottom-longline (BLL), and set-net (SN) fisheries.
S-12 • Risk of commercial fisheries to New Zealand seabird populations (suppl.) Ministry for Primary Industries
CCSBT-ERS/1308/21

S.13 Northern giant petrel (Macronectes halli)
Population (NZ) 2567 pairs [1993] Agreement on the Conservation of Albatrossesand Petrels (ACAP) (2010)
Age at first reproduction 6 to 10 years Trivelpiece & Trivelpiece (1998)
Survival rate 92.3% L. Brooke (2004)88 to 93% [1981] Agreement on the Conservation of Albatrosses
and Petrels (ACAP) (2010)88% [2003] Agreement on the Conservation of Albatrosses
and Petrels (ACAP) (2010)
(a) Breeding distribution (b) Non-breeding distribution
Figure S-13: Relative density of northern giant petrel (Macronectes halli). The distribution base map wasobtained from BirdLife single-layer range maps. The breeding season runs from August to May. Alsoshown are incidental captures recorded by observers between the 2006–07 and 2010–11 fishing years intrawl, surface-longline (SLL), bottom-longline (BLL), and set-net (SN) fisheries.
Ministry for Primary Industries Risk of commercial fisheries to New Zealand seabird populations (suppl.) • S-13
CCSBT-ERS/1308/21

S.14 Grey petrel (Procellaria cinerea)
Population (NZ) 32 000 to 73 000 pairs [2001] Bell (2002)
Age at first reproduction 7 years Barbraud et al. (2009)
Survival rate 90 to 97% White-chinned petrel as proxy, Dillingham &Fletcher (2008)
(a) Breeding distribution (b) Non-breeding distribution
Figure S-14: Relative density of grey petrel (Procellaria cinerea). The base map for the distribution wasobtained from the NABIS database. The breeding season runs from February to December. Also shown areincidental captures recorded by observers between the 2006–07 and 2010–11 fishing years in trawl, surface-longline (SLL), bottom-longline (BLL), and set-net (SN) fisheries.
S-14 • Risk of commercial fisheries to New Zealand seabird populations (suppl.) Ministry for Primary Industries
CCSBT-ERS/1308/21

S.15 Black petrel (Procellaria parkinsoni)
Population (NZ) 1059 pairs [2010] Bell et al. (2011)
Age at first reproduction 6.6 ± 0.2 years [2010] Bell et al. (2011)
Survival rate 90.32 ± 2% [2010] Bell et al. (2011)
(a) Breeding distribution (b) Non-breeding distribution
Figure S-15: Relative density of black petrel (Procellaria parkinsoni). The base map for the distributionwas obtained from the NABIS database. The breeding season runs from October to June. Also shown areincidental captures recorded by observers between the 2006–07 and 2010–11 fishing years in trawl, surface-longline (SLL), bottom-longline (BLL), and set-net (SN) fisheries.
Ministry for Primary Industries Risk of commercial fisheries to New Zealand seabird populations (suppl.) • S-15
CCSBT-ERS/1308/21

S.16 Westland petrel (Procellaria westlandica)
Population (NZ) 4000 pairs [2008] Agreement on the Conservation of Albatrossesand Petrels (ACAP) (2010)
Age at first reproduction 6.5 years [2002] Waugh et al. (2006)
Survival rate 88.4 to 93.3% L. Brooke (2004)
(a) Breeding distribution (b) Non-breeding distribution
Figure S-16: Relative density of Westland petrel (Procellaria westlandica). The base map for the distributionwas obtained from the NABIS database. The breeding season runs from February to December. Also shownare incidental captures recorded by observers between the 2006–07 and 2010–11 fishing years in trawl,surface-longline (SLL), bottom-longline (BLL), and set-net (SN) fisheries.
S-16 • Risk of commercial fisheries to New Zealand seabird populations (suppl.) Ministry for Primary Industries
CCSBT-ERS/1308/21

S.17 White-chinned petrel (Procellaria aequinoctialis)
Population (NZ) 168 725 pairs Birdlife International (2012)
Age at first reproduction 6.5 years Schreiber & Burger (2001)
Survival rate 90 to 97% Dillingham & Fletcher (2008)
(a) Breeding distribution (b) Non-breeding distribution
Figure S-17: Relative density of white-chinned petrel (Procellaria aequinoctialis). The base map for thedistribution was obtained from the NABIS database. The breeding season runs from October to May. Alsoshown are incidental captures recorded by observers between the 2006–07 and 2010–11 fishing years intrawl, surface-longline (SLL), bottom-longline (BLL), and set-net (SN) fisheries.
Ministry for Primary Industries Risk of commercial fisheries to New Zealand seabird populations (suppl.) • S-17
CCSBT-ERS/1308/21

S.18 Flesh-footed shearwater (Puffinus carneipes)
Population (NZ) 6689 to 10 540 pairs [2010] Baker et al. (2010)
Age at first reproduction 4 to 9 years [1973] Bradley et al. (1999)
Survival rate 92% Short-tailed shearwater as proxy, L. Brooke(2004)
(a) Breeding distribution (b) Non-breeding distribution
Figure S-18: Relative density of flesh-footed shearwater (Puffinus carneipes). The base map for thedistribution was obtained from the NABIS database. The breeding season runs from September to May.Also shown are incidental captures recorded by observers between the 2006–07 and 2010–11 fishing yearsin trawl, surface-longline (SLL), bottom-longline (BLL), and set-net (SN) fisheries.
S-18 • Risk of commercial fisheries to New Zealand seabird populations (suppl.) Ministry for Primary Industries
CCSBT-ERS/1308/21

S.19 Wedge-tailed shearwater (Puffinus pacificus)
Population (NZ) 52 500 to 60 000 pairs Taylor (2000b)
Age at first reproduction 4 years Schreiber & Burger (2001)
Survival rate 93.1 (88.9 – 95.8)% [1999] Hutton’s shearwater as proxy, Cuthbert & Davis(2002)
(a) Breeding distribution (b) Non-breeding distribution
Figure S-19: Relative density of wedge-tailed shearwater (Puffinus pacificus). The distribution base mapwas obtained from BirdLife single-layer range maps. The breeding season runs from June to December.Also shown are incidental captures recorded by observers between the 2006–07 and 2010–11 fishing yearsin trawl, surface-longline (SLL), bottom-longline (BLL), and set-net (SN) fisheries.
Ministry for Primary Industries Risk of commercial fisheries to New Zealand seabird populations (suppl.) • S-19
CCSBT-ERS/1308/21

S.20 Buller’s shearwater (Puffinus bulleri)
Population (NZ) 200 000 pairs L. Brooke (2004)
Age at first reproduction 4 to 9 years [1973] Bradley et al. (1999)
Survival rate 92% Short-tailed shearwater as proxy, L. Brooke(2004)
(a) Breeding distribution (b) Non-breeding distribution
Figure S-20: Relative density of Buller’s shearwater (Puffinus bulleri). The base map for the distributionwas obtained from the NABIS database. The breeding season runs from September to May. Also shown areincidental captures recorded by observers between the 2006–07 and 2010–11 fishing years in trawl, surface-longline (SLL), bottom-longline (BLL), and set-net (SN) fisheries.
S-20 • Risk of commercial fisheries to New Zealand seabird populations (suppl.) Ministry for Primary Industries
CCSBT-ERS/1308/21

S.21 Sooty shearwater (Puffinus griseus)
Population (NZ) 5 000 000 pairs Taylor (2000b)
Age at first reproduction 5 to 7 years L. Brooke (2004)
Survival rate 86 to 97.9% [2005] Clucas et al. (2008)
(a) Breeding distribution (b) Non-breeding distribution
Figure S-21: Relative density of sooty shearwater (Puffinus griseus). The base map for the distribution wasobtained from the NABIS database. The breeding season runs from September to May. Also shown areincidental captures recorded by observers between the 2006–07 and 2010–11 fishing years in trawl, surface-longline (SLL), bottom-longline (BLL), and set-net (SN) fisheries.
Ministry for Primary Industries Risk of commercial fisheries to New Zealand seabird populations (suppl.) • S-21
CCSBT-ERS/1308/21

S.22 Fluttering shearwater (Puffinus gavia)
Population (NZ) 20 000 to 200 000 pairs Taylor (2000b)
Age at first reproduction 4 to 6 years Hutton’s shearwater as proxy, Waugh et al.(1999)
Survival rate 93.1 (88.9 – 95.8)% [1999] Hutton’s shearwater as proxy, Cuthbert & Davis(2002)
(a) Breeding distribution (b) Non-breeding distribution
Figure S-22: Relative density of fluttering shearwater (Puffinus gavia). The breeding season runs fromAugust to February. Also shown are incidental captures recorded by observers between the 2006–07 and2010–11 fishing years in trawl, surface-longline (SLL), bottom-longline (BLL), and set-net (SN) fisheries.
S-22 • Risk of commercial fisheries to New Zealand seabird populations (suppl.) Ministry for Primary Industries
CCSBT-ERS/1308/21

S.23 Hutton’s shearwater (Puffinus huttoni)
Population (NZ) 94 000 pairs Taylor (2000a)
Age at first reproduction 4 to 6 years Waugh et al. (1999)
Survival rate 93.1 (88.9 – 95.8)% [1999] Cuthbert & Davis (2002)
(a) Breeding distribution (b) Non-breeding distribution
Figure S-23: Relative density of Hutton’s shearwater (Puffinus huttoni). The base map for the distributionwas obtained from the NABIS database. The breeding season runs from October to March. Also shown areincidental captures recorded by observers between the 2006–07 and 2010–11 fishing years in trawl, surface-longline (SLL), bottom-longline (BLL), and set-net (SN) fisheries.
Ministry for Primary Industries Risk of commercial fisheries to New Zealand seabird populations (suppl.) • S-23
CCSBT-ERS/1308/21

S.24 Little shearwater (Puffinus assimilis)
Population (NZ) 100 000 to 220 000 pairs Taylor (2000a)
Age at first reproduction 4 to 6 years Hutton’s shearwater as proxy, Waugh et al.(1999)
Survival rate 93.1 (88.9 – 95.8)% [1999] Hutton’s shearwater as proxy, Cuthbert & Davis(2002)
(a) Breeding distribution (b) Non-breeding distribution
Figure S-24: Relative density of little shearwater (Puffinus assimilis). The distribution base map wasobtained from BirdLife single-layer range maps. The breeding season runs from June to December. Alsoshown are incidental captures recorded by observers between the 2006–07 and 2010–11 fishing years intrawl, surface-longline (SLL), bottom-longline (BLL), and set-net (SN) fisheries.
S-24 • Risk of commercial fisheries to New Zealand seabird populations (suppl.) Ministry for Primary Industries
CCSBT-ERS/1308/21

S.25 Cape petrel (Daption capense)
Population (NZ) 8420 pairs L. Brooke (2004)
Age at first reproduction 6 years Schreiber & Burger (2001)3 to 5 years [1968] Beck (1969)
Survival rate 77.1 to 93.9% [1987] Sagar et al. (1996)
(a) Breeding distribution (b) Non-breeding distribution
Figure S-25: Relative density of Cape petrel (Daption capense). The distribution base map was obtainedfrom BirdLife single-layer range maps. The breeding season runs from October to January. Also shown areincidental captures recorded by observers between the 2006–07 and 2010–11 fishing years in trawl, surface-longline (SLL), bottom-longline (BLL), and set-net (SN) fisheries.
Ministry for Primary Industries Risk of commercial fisheries to New Zealand seabird populations (suppl.) • S-25
CCSBT-ERS/1308/21

S.26 Fairy prion (Pachyptila turtur)
Population (NZ) more than 1 000 000 pairs Taylor (2000b)
Age at first reproduction 4 to 5 years Schreiber & Burger (2001)
Survival rate 84% L. Brooke (2004)
(a) Breeding distribution (b) Non-breeding distribution
Figure S-26: Relative density of fairy prion (Pachyptila turtur). The distribution base map was obtainedfrom BirdLife single-layer range maps. The breeding season runs from September to March. Also shownare incidental captures recorded by observers between the 2006–07 and 2010–11 fishing years in trawl,surface-longline (SLL), bottom-longline (BLL), and set-net (SN) fisheries.
S-26 • Risk of commercial fisheries to New Zealand seabird populations (suppl.) Ministry for Primary Industries
CCSBT-ERS/1308/21

S.27 Antarctic prion (Pachyptila desolata)
Population (NZ) 100 000 to 1 000 000 pairs Taylor (2000b)
Age at first reproduction 5 to 6 years L. Brooke (2004)
Survival rate 84% Fairy prion as proxy, L. Brooke (2004)
(a) Breeding distribution (b) Non-breeding distribution
Figure S-27: Relative density of Antarctic prion (Pachyptila desolata). The distribution base map wasobtained from BirdLife single-layer range maps. The breeding season runs from November to March.Also shown are incidental captures recorded by observers between the 2006–07 and 2010–11 fishing yearsin trawl, surface-longline (SLL), bottom-longline (BLL), and set-net (SN) fisheries.
Ministry for Primary Industries Risk of commercial fisheries to New Zealand seabird populations (suppl.) • S-27
CCSBT-ERS/1308/21

S.28 Broad-billed prion (Pachyptila vittata)
Population (NZ) 1 000 000 pairs L. Brooke (2004)
Age at first reproduction 4 to 5 years Fairy prion as proxy, Schreiber & Burger (2001)
Survival rate 84% Fairy prion as proxy, L. Brooke (2004)
(a) Breeding distribution (b) Non-breeding distribution
Figure S-28: Relative density of broad-billed prion (Pachyptila vittata). The distribution base map wasobtained from BirdLife single-layer range maps. The breeding season runs from July to November. Alsoshown are incidental captures recorded by observers between the 2006–07 and 2010–11 fishing years intrawl, surface-longline (SLL), bottom-longline (BLL), and set-net (SN) fisheries.
S-28 • Risk of commercial fisheries to New Zealand seabird populations (suppl.) Ministry for Primary Industries
CCSBT-ERS/1308/21

S.29 Pycroft’s petrel (Pterodroma pycrofti)
Population (NZ) 2000 to 3000 pairs [1998] Taylor (2000a)
Age at first reproduction 6 to 7 years Grey-faced petrel as proxy, Schreiber & Burger(2001)
Survival rate 94% Grey-faced petrel as proxy, Marchant & Hig-gins (1990)
(a) Breeding distribution (b) Non-breeding distribution
Figure S-29: Relative density of Pycroft’s petrel (Pterodroma pycrofti). The distribution base map wasobtained from BirdLife single-layer range maps. The breeding season runs from October to March. Alsoshown are incidental captures recorded by observers between the 2006–07 and 2010–11 fishing years intrawl, surface-longline (SLL), bottom-longline (BLL), and set-net (SN) fisheries.
Ministry for Primary Industries Risk of commercial fisheries to New Zealand seabird populations (suppl.) • S-29
CCSBT-ERS/1308/21

S.30 Cook’s petrel (Pterodroma cookii)
Population (NZ) 50 000 to 60 000 pairs Taylor (2000a)
Age at first reproduction 6 to 7 years Grey-faced petrel as proxy, Schreiber & Burger(2001)
Survival rate 94% Grey-faced petrel as proxy, Marchant & Hig-gins (1990)
(a) Breeding distribution (b) Non-breeding distribution
Figure S-30: Relative density of Cook’s petrel (Pterodroma cookii). The distribution base map was obtainedfrom BirdLife single-layer range maps. The breeding season runs from October to April. Also shown areincidental captures recorded by observers between the 2006–07 and 2010–11 fishing years in trawl, surface-longline (SLL), bottom-longline (BLL), and set-net (SN) fisheries.
S-30 • Risk of commercial fisheries to New Zealand seabird populations (suppl.) Ministry for Primary Industries
CCSBT-ERS/1308/21

S.31 Chatham petrel (Pterodroma axillaris)
Population (NZ) 250 pairs [2009] Birdlife International (2012)
Age at first reproduction 6 to 7 years Grey-faced petrel as proxy, Schreiber & Burger(2001)
Survival rate 94% Grey-faced petrel as proxy, Marchant & Hig-gins (1990)
(a) Breeding distribution (b) Non-breeding distribution
Figure S-31: Relative density of Chatham petrel (Pterodroma axillaris). The distribution base map wasobtained from BirdLife single-layer range maps. The breeding season runs from November to April. Alsoshown are incidental captures recorded by observers between the 2006–07 and 2010–11 fishing years intrawl, surface-longline (SLL), bottom-longline (BLL), and set-net (SN) fisheries.
Ministry for Primary Industries Risk of commercial fisheries to New Zealand seabird populations (suppl.) • S-31
CCSBT-ERS/1308/21

S.32 Mottled petrel (Pterodroma inexpectata)
Population (NZ) 300 000 to 400 000 pairs [1999] Taylor (2000b)
Age at first reproduction 6 to 7 years Grey-faced petrel as proxy, Schreiber & Burger(2001)
Survival rate 94% Grey-faced petrel as proxy, Marchant & Hig-gins (1990)
(a) Breeding distribution (b) Non-breeding distribution
Figure S-32: Relative density of mottled petrel (Pterodroma inexpectata). The distribution base map wasobtained from BirdLife single-layer range maps. The breeding season runs from October to June. Alsoshown are incidental captures recorded by observers between the 2006–07 and 2010–11 fishing years intrawl, surface-longline (SLL), bottom-longline (BLL), and set-net (SN) fisheries.
S-32 • Risk of commercial fisheries to New Zealand seabird populations (suppl.) Ministry for Primary Industries
CCSBT-ERS/1308/21

S.33 White-necked petrel (Pterodroma cervicalis)
Population (NZ) 50 000 pairs [1988] Taylor (2000a)
Age at first reproduction 6 to 7 years Grey-faced petrel as proxy, Schreiber & Burger(2001)
Survival rate 94% Grey-faced petrel as proxy, Marchant & Hig-gins (1990)
(a) Breeding distribution (b) Non-breeding distribution
Figure S-33: Relative density of white-necked petrel (Pterodroma cervicalis). The distribution base mapwas obtained from BirdLife single-layer range maps. The breeding season runs from August to February.Also shown are incidental captures recorded by observers between the 2006–07 and 2010–11 fishing yearsin trawl, surface-longline (SLL), bottom-longline (BLL), and set-net (SN) fisheries.
Ministry for Primary Industries Risk of commercial fisheries to New Zealand seabird populations (suppl.) • S-33
CCSBT-ERS/1308/21

S.34 Kermadec petrel (Pterodroma neglecta)
Population (NZ) 5000 to 7000 pairs Taylor (2000b)
Age at first reproduction 6 to 7 years Grey-faced petrel as proxy, Schreiber & Burger(2001)
Survival rate 94% Grey-faced petrel as proxy, Marchant & Hig-gins (1990)
(a) Breeding distribution (b) Non-breeding distribution
Figure S-34: Relative density of Kermadec petrel (Pterodroma neglecta). The base map for the distributionwas obtained from the NABIS database. The breeding season runs from October to June. Also shown areincidental captures recorded by observers between the 2006–07 and 2010–11 fishing years in trawl, surface-longline (SLL), bottom-longline (BLL), and set-net (SN) fisheries.
S-34 • Risk of commercial fisheries to New Zealand seabird populations (suppl.) Ministry for Primary Industries
CCSBT-ERS/1308/21

S.35 Grey-faced petrel (Pterodroma macroptera)
Population (NZ) 200 000 to 300 000 pairs Taylor (2000b)
Age at first reproduction 6 to 7 years Schreiber & Burger (2001)
Survival rate 94% Marchant & Higgins (1990)
(a) Breeding distribution (b) Non-breeding distribution
Figure S-35: Relative density of grey-faced petrel (Pterodroma macroptera). The base map for thedistribution was obtained from the NABIS database. The breeding season runs from June to January.Also shown are incidental captures recorded by observers between the 2006–07 and 2010–11 fishing yearsin trawl, surface-longline (SLL), bottom-longline (BLL), and set-net (SN) fisheries.
Ministry for Primary Industries Risk of commercial fisheries to New Zealand seabird populations (suppl.) • S-35
CCSBT-ERS/1308/21

S.36 Chatham Island taiko (Pterodroma magentae)
Population (NZ) 17 pairs [2010] Birdlife International (2012)
Age at first reproduction 6 to 7 years Grey-faced petrel as proxy, Schreiber & Burger(2001)
Survival rate 94% Grey-faced petrel as proxy, Marchant & Hig-gins (1990)
(a) Breeding distribution (b) Non-breeding distribution
Figure S-36: Relative density of Chatham Island taiko (Pterodroma magentae). The distribution base mapwas obtained from BirdLife single-layer range maps. The breeding season runs from December to May.Also shown are incidental captures recorded by observers between the 2006–07 and 2010–11 fishing yearsin trawl, surface-longline (SLL), bottom-longline (BLL), and set-net (SN) fisheries.
S-36 • Risk of commercial fisheries to New Zealand seabird populations (suppl.) Ministry for Primary Industries
CCSBT-ERS/1308/21

S.37 White-headed petrel (Pterodroma lessonii)
Population (NZ) 200 000 pairs L. Brooke (2004)
Age at first reproduction 5.5 years Schreiber & Burger (2001)
Survival rate 94% Grey-faced petrel as proxy, Marchant & Hig-gins (1990)
(a) Breeding distribution (b) Non-breeding distribution
Figure S-37: Relative density of white-headed petrel (Pterodroma lessonii). The distribution base map wasobtained from BirdLife single-layer range maps. The breeding season runs from November to April. Alsoshown are incidental captures recorded by observers between the 2006–07 and 2010–11 fishing years intrawl, surface-longline (SLL), bottom-longline (BLL), and set-net (SN) fisheries.
Ministry for Primary Industries Risk of commercial fisheries to New Zealand seabird populations (suppl.) • S-37
CCSBT-ERS/1308/21

S.38 Soft-plumaged petrel (Pterodroma mollis)
Population (NZ) 1000 to 9999 pairs Taylor (2000b)
Age at first reproduction 6 to 7 years Grey-faced petrel as proxy, Schreiber & Burger(2001)
Survival rate 94% Grey-faced petrel as proxy, Marchant & Hig-gins (1990)
(a) Breeding distribution (b) Non-breeding distribution
Figure S-38: Relative density of soft-plumaged petrel (Pterodroma mollis). The distribution base map wasobtained from BirdLife single-layer range maps. The breeding season runs from November to April. Alsoshown are incidental captures recorded by observers between the 2006–07 and 2010–11 fishing years intrawl, surface-longline (SLL), bottom-longline (BLL), and set-net (SN) fisheries.
S-38 • Risk of commercial fisheries to New Zealand seabird populations (suppl.) Ministry for Primary Industries
CCSBT-ERS/1308/21

S.39 Common diving petrel (Pelecanoides urinatrix)
Population (NZ) 300 000 to 2 150 000 pairs Taylor (2000b)
Age at first reproduction 2 to 3 years L. Brooke (2004)
Survival rate 75 to 87% Schreiber & Burger (2001)
(a) Breeding distribution (b) Non-breeding distribution
Figure S-39: Relative density of common diving petrel (Pelecanoides urinatrix). The distribution basemap was obtained from BirdLife single-layer range maps. The breeding season runs from September toFebruary. Also shown are incidental captures recorded by observers between the 2006–07 and 2010–11fishing years in trawl, surface-longline (SLL), bottom-longline (BLL), and set-net (SN) fisheries.
Ministry for Primary Industries Risk of commercial fisheries to New Zealand seabird populations (suppl.) • S-39
CCSBT-ERS/1308/21

S.40 South Georgia diving petrel (Pelecanoides georgicus)
Population (NZ) 64 pairs [1998] Taylor (2000b)
Age at first reproduction 2 to 3 years Common diving petrel as proxy, L. Brooke(2004)
Survival rate 75 to 87% Common diving petrel as proxy, Schreiber &Burger (2001)
(a) Breeding distribution (b) Non-breeding distribution
Figure S-40: Relative density of South Georgia diving petrel (Pelecanoides georgicus). The base map for thedistribution was obtained from the NABIS database. The breeding season runs from November to March.Also shown are incidental captures recorded by observers between the 2006–07 and 2010–11 fishing yearsin trawl, surface-longline (SLL), bottom-longline (BLL), and set-net (SN) fisheries.
S-40 • Risk of commercial fisheries to New Zealand seabird populations (suppl.) Ministry for Primary Industries
CCSBT-ERS/1308/21

S.41 New Zealand white-faced storm petrel (Pelagodroma marina)
Population (NZ) more than 1 000 000 pairs Taylor (2000b)
Age at first reproduction 4 to 5 years Several species as proxy, Croxall (1987)more than 3 years L. Brooke (2004)
Survival rate 90% Several species as proxy, Croxall (1987)
(a) Breeding distribution (b) Non-breeding distribution
Figure S-41: Relative density of New Zealand white-faced storm petrel (Pelagodroma marina). The basemap for the distribution was obtained from the NABIS database. The breeding season runs from October toMarch. Also shown are incidental captures recorded by observers between the 2006–07 and 2010–11 fishingyears in trawl, surface-longline (SLL), bottom-longline (BLL), and set-net (SN) fisheries.
Ministry for Primary Industries Risk of commercial fisheries to New Zealand seabird populations (suppl.) • S-41
CCSBT-ERS/1308/21

S.42 White-bellied storm petrel (Fregetta grallaria)
Population (NZ) 1000 pairs Taylor (2000a)
Age at first reproduction 4 to 5 years Several species as proxy, Croxall (1987)
Survival rate 90% Several species as proxy, Croxall (1987)
Figure S-42: Relative density of white-bellied storm petrel (Fregetta grallaria). The distribution base mapwas obtained from BirdLife single-layer range maps. Also shown are incidental captures recorded byobservers between the 2006–07 and 2010–11 fishing years in trawl, surface-longline (SLL), bottom-longline(BLL), and set-net (SN) fisheries.
S-42 • Risk of commercial fisheries to New Zealand seabird populations (suppl.) Ministry for Primary Industries
CCSBT-ERS/1308/21

S.43 Black-bellied storm petrel (Fregetta tropica)
Population (NZ) 50 000 to 100 000 pairs Taylor (2000b)
Age at first reproduction 4 to 5 years Several species as proxy, Croxall (1987)
Survival rate 90% Several species as proxy, Croxall (1987)
Figure S-43: Relative density of black-bellied storm petrel (Fregetta tropica). The distribution base map wasobtained from BirdLife single-layer range maps. Also shown are incidental captures recorded by observersbetween the 2006–07 and 2010–11 fishing years in trawl, surface-longline (SLL), bottom-longline (BLL),and set-net (SN) fisheries.
Ministry for Primary Industries Risk of commercial fisheries to New Zealand seabird populations (suppl.) • S-43
CCSBT-ERS/1308/21

S.44 Kermadec white-faced storm petrel (Pelagodroma marina albiclunis)
Population (NZ) fewer than 100 pairs Taylor (2000a)
Age at first reproduction 4 to 5 years Several species as proxy, Croxall (1987)more than 3 years L. Brooke (2004)
Survival rate 90% Several species as proxy, Croxall (1987)
(a) Breeding distribution (b) Non-breeding distribution
Figure S-44: Relative density of Kermadec white-faced storm petrel (Pelagodroma marina albiclunis). Thebase map for the distribution was obtained from the NABIS database. The breeding season runs fromOctober to March. Also shown are incidental captures recorded by observers between the 2006–07 and2010–11 fishing years in trawl, surface-longline (SLL), bottom-longline (BLL), and set-net (SN) fisheries.
S-44 • Risk of commercial fisheries to New Zealand seabird populations (suppl.) Ministry for Primary Industries
CCSBT-ERS/1308/21

S.45 New Zealand storm petrel (Oceanites maorianus)
Population (NZ) 20 to 1000 pairs
Age at first reproduction 4 to 5 years Several species as proxy, Croxall (1987)
Survival rate 90% Several species as proxy, Croxall (1987)
Figure S-45: Relative density of New Zealand storm petrel (Oceanites maorianus). Also shown are incidentalcaptures recorded by observers between the 2006–07 and 2010–11 fishing years in trawl, surface-longline(SLL), bottom-longline (BLL), and set-net (SN) fisheries.
Ministry for Primary Industries Risk of commercial fisheries to New Zealand seabird populations (suppl.) • S-45
CCSBT-ERS/1308/21
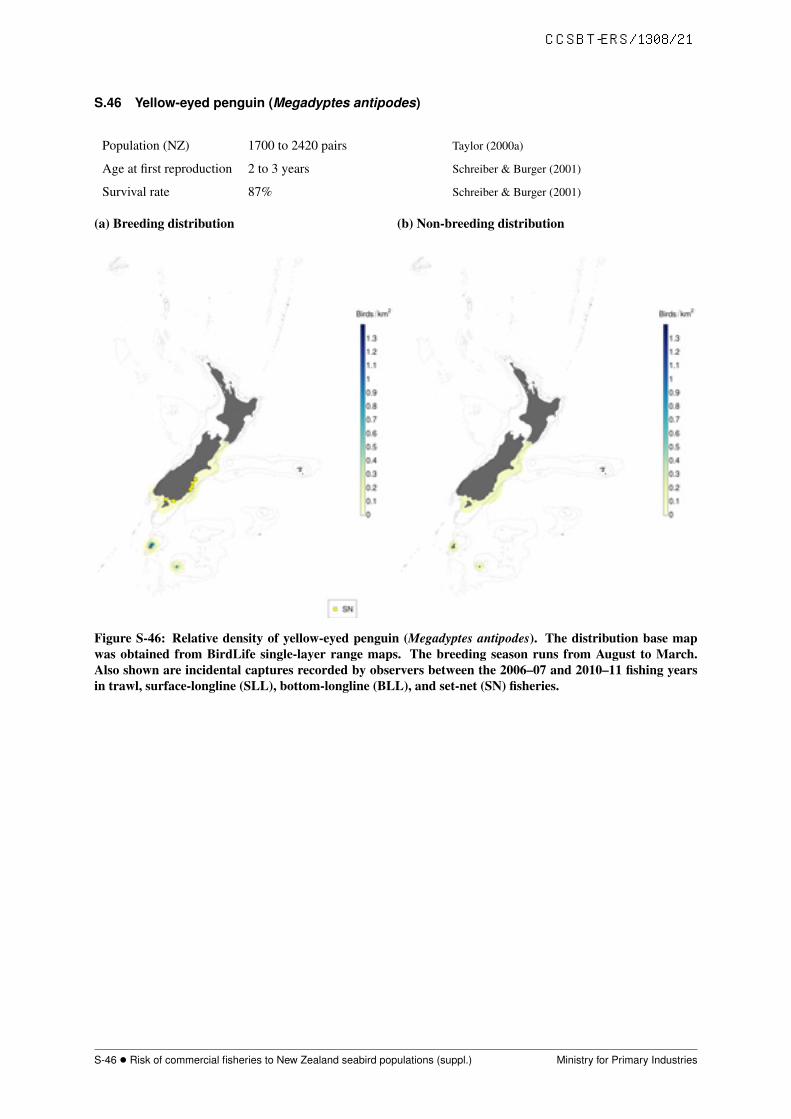
S.46 Yellow-eyed penguin (Megadyptes antipodes)
Population (NZ) 1700 to 2420 pairs Taylor (2000a)
Age at first reproduction 2 to 3 years Schreiber & Burger (2001)
Survival rate 87% Schreiber & Burger (2001)
(a) Breeding distribution (b) Non-breeding distribution
Figure S-46: Relative density of yellow-eyed penguin (Megadyptes antipodes). The distribution base mapwas obtained from BirdLife single-layer range maps. The breeding season runs from August to March.Also shown are incidental captures recorded by observers between the 2006–07 and 2010–11 fishing yearsin trawl, surface-longline (SLL), bottom-longline (BLL), and set-net (SN) fisheries.
S-46 • Risk of commercial fisheries to New Zealand seabird populations (suppl.) Ministry for Primary Industries
CCSBT-ERS/1308/21

S.47 Northern little penguin (Eudyptula minor)
Population (NZ) 5000 to 10 000 pairs [1984] Taylor (2000b)
Age at first reproduction 2 to 3 years Schreiber & Burger (2001)
Survival rate 83% Sidhu et al. (2007)
(a) Breeding distribution (b) Non-breeding distribution
Figure S-47: Relative density of northern little penguin (Eudyptula minor). The base map was obtained bycreating a buffer around coastal locations where the species has been found. The breeding season runs fromAugust to February. Also shown are incidental captures recorded by observers between the 2006–07 and2010–11 fishing years in trawl, surface-longline (SLL), bottom-longline (BLL), and set-net (SN) fisheries.
Ministry for Primary Industries Risk of commercial fisheries to New Zealand seabird populations (suppl.) • S-47
CCSBT-ERS/1308/21

S.48 White-flippered little penguin (Eudyptula minor)
Population (NZ) 2200 pairs [1998] Taylor (2000a)
Age at first reproduction 2 to 3 years Schreiber & Burger (2001)
Survival rate 83% Sidhu et al. (2007)
(a) Breeding distribution (b) Non-breeding distribution
Figure S-48: Relative density of white-flippered little penguin (Eudyptula minor). The base map wasobtained by creating a buffer around coastal locations where the species has been found. The breedingseason runs from August to February. Also shown are incidental captures recorded by observers betweenthe 2006–07 and 2010–11 fishing years in trawl, surface-longline (SLL), bottom-longline (BLL), and set-net(SN) fisheries.
S-48 • Risk of commercial fisheries to New Zealand seabird populations (suppl.) Ministry for Primary Industries
CCSBT-ERS/1308/21

S.49 Southern little penguin (Eudyptula minor)
Population (NZ) 5000 to 10 000 pairs [1984] Taylor (2000b)
Age at first reproduction 2 to 3 years Schreiber & Burger (2001)
Survival rate 83% Sidhu et al. (2007)
(a) Breeding distribution (b) Non-breeding distribution
Figure S-49: Relative density of southern little penguin (Eudyptula minor). The base map was obtained bycreating a buffer around coastal locations where the species has been found. The breeding season runs fromAugust to February. Also shown are incidental captures recorded by observers between the 2006–07 and2010–11 fishing years in trawl, surface-longline (SLL), bottom-longline (BLL), and set-net (SN) fisheries.
Ministry for Primary Industries Risk of commercial fisheries to New Zealand seabird populations (suppl.) • S-49
CCSBT-ERS/1308/21

S.50 Chatham Island little penguin (Eudyptula minor)
Population (NZ) 5000 to 10 000 pairs [1984] Taylor (2000b)
Age at first reproduction 2 to 3 years Schreiber & Burger (2001)
Survival rate 83% Sidhu et al. (2007)
(a) Breeding distribution (b) Non-breeding distribution
Figure S-50: Relative density of Chatham Island little penguin (Eudyptula minor). The base map wasobtained by creating a buffer around coastal locations where the species has been found. The breedingseason runs from August to February. Also shown are incidental captures recorded by observers betweenthe 2006–07 and 2010–11 fishing years in trawl, surface-longline (SLL), bottom-longline (BLL), and set-net(SN) fisheries.
S-50 • Risk of commercial fisheries to New Zealand seabird populations (suppl.) Ministry for Primary Industries
CCSBT-ERS/1308/21
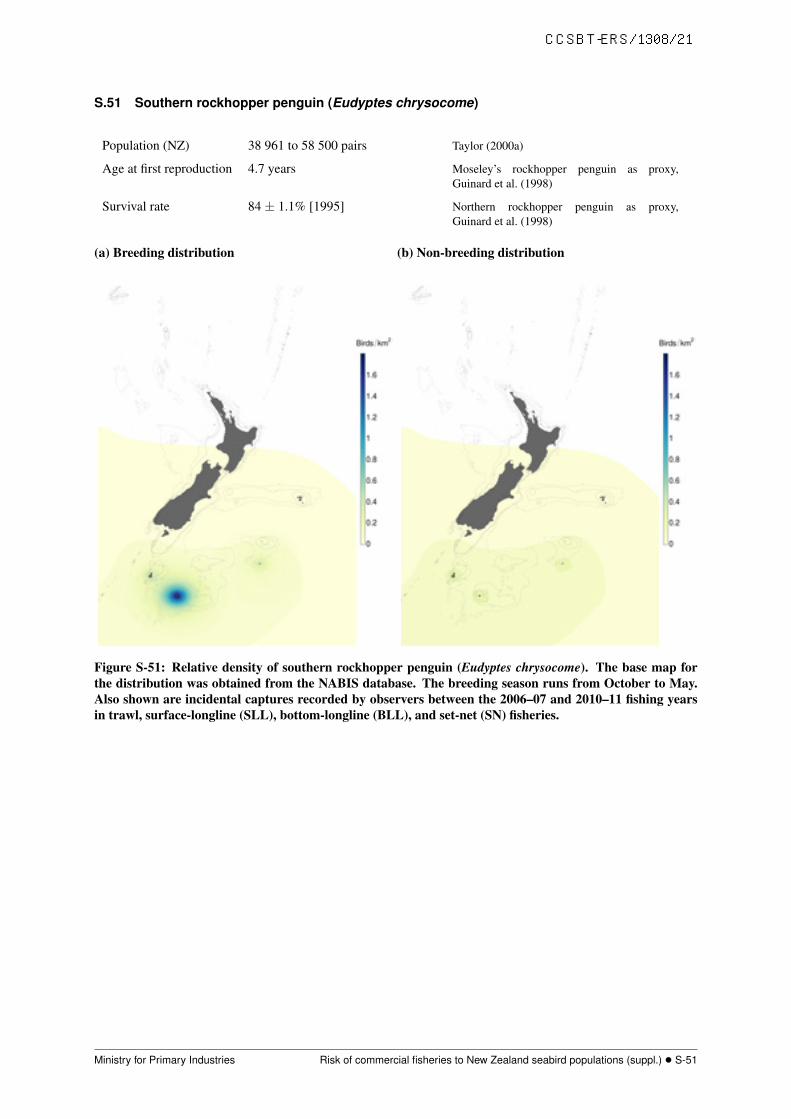
S.51 Southern rockhopper penguin (Eudyptes chrysocome)
Population (NZ) 38 961 to 58 500 pairs Taylor (2000a)
Age at first reproduction 4.7 years Moseley’s rockhopper penguin as proxy,Guinard et al. (1998)
Survival rate 84 ± 1.1% [1995] Northern rockhopper penguin as proxy,Guinard et al. (1998)
(a) Breeding distribution (b) Non-breeding distribution
Figure S-51: Relative density of southern rockhopper penguin (Eudyptes chrysocome). The base map forthe distribution was obtained from the NABIS database. The breeding season runs from October to May.Also shown are incidental captures recorded by observers between the 2006–07 and 2010–11 fishing yearsin trawl, surface-longline (SLL), bottom-longline (BLL), and set-net (SN) fisheries.
Ministry for Primary Industries Risk of commercial fisheries to New Zealand seabird populations (suppl.) • S-51
CCSBT-ERS/1308/21

S.52 Fiordland crested penguin (Eudyptes pachyrhynchus)
Population (NZ) 3000 pairs Roots (2006)
Age at first reproduction 3 to 4 years Schreiber & Burger (2001)5 to 6 years Marchant & Higgins (1990)
Survival rate 84 ± 1.1% [1995] Northern rockhopper penguin as proxy,Guinard et al. (1998)
(a) Breeding distribution (b) Non-breeding distribution
Figure S-52: Relative density of Fiordland crested penguin (Eudyptes pachyrhynchus). The distributionbase map was obtained from BirdLife single-layer range maps. The breeding season runs from June toNovember. Also shown are incidental captures recorded by observers between the 2006–07 and 2010–11fishing years in trawl, surface-longline (SLL), bottom-longline (BLL), and set-net (SN) fisheries.
S-52 • Risk of commercial fisheries to New Zealand seabird populations (suppl.) Ministry for Primary Industries
CCSBT-ERS/1308/21

S.53 Snares crested penguin (Eudyptes robustus)
Population (NZ) 30 000 pairs Roots (2006)
Age at first reproduction 5 to 6 years Roots (2006)
Survival rate 84 ± 1.1% [1995] Northern rockhopper penguin as proxy,Guinard et al. (1998)
(a) Breeding distribution (b) Non-breeding distribution
Figure S-53: Relative density of Snares crested penguin (Eudyptes robustus). The distribution base map wasobtained from BirdLife single-layer range maps. The breeding season runs from September to January.Also shown are incidental captures recorded by observers between the 2006–07 and 2010–11 fishing yearsin trawl, surface-longline (SLL), bottom-longline (BLL), and set-net (SN) fisheries.
Ministry for Primary Industries Risk of commercial fisheries to New Zealand seabird populations (suppl.) • S-53
CCSBT-ERS/1308/21

S.54 Erect-crested penguin (Eudyptes sclateri)
Population (NZ) 81 000 (77 000 – 85 000 ) pairs Taylor (2000a)
Age at first reproduction 5 to 6 years Fiordland crested penguin as proxy, Roots(2006)
Survival rate 84 ± 1.1% [1995] Northern rockhopper penguin as proxy,Guinard et al. (1998)
(a) Breeding distribution (b) Non-breeding distribution
Figure S-54: Relative density of erect-crested penguin (Eudyptes sclateri). The distribution base map wasobtained from BirdLife single-layer range maps. The breeding season runs from September to March. Alsoshown are incidental captures recorded by observers between the 2006–07 and 2010–11 fishing years intrawl, surface-longline (SLL), bottom-longline (BLL), and set-net (SN) fisheries.
S-54 • Risk of commercial fisheries to New Zealand seabird populations (suppl.) Ministry for Primary Industries
CCSBT-ERS/1308/21

S.55 Australasian gannet (Morus serrator)
Population (NZ) 46 004 pairs [1981] Wodzicki et al. (1984)
Age at first reproduction 3 to 7 years Schreiber & Burger (2001)
Survival rate 94% Northern gannet as proxy, Schreiber & Burger(2001)
(a) Breeding distribution (b) Non-breeding distribution
Figure S-55: Relative density of Australasian gannet (Morus serrator). The distribution base map wasobtained from BirdLife single-layer range maps. The breeding season runs from August to February. Alsoshown are incidental captures recorded by observers between the 2006–07 and 2010–11 fishing years intrawl, surface-longline (SLL), bottom-longline (BLL), and set-net (SN) fisheries.
Ministry for Primary Industries Risk of commercial fisheries to New Zealand seabird populations (suppl.) • S-55
CCSBT-ERS/1308/21

S.56 Masked booby (Sula dactylatra)
Population (NZ) 240 pairs Veitch et al. (2004)
Age at first reproduction 2 to 4 years Schreiber & Burger (2001)
Survival rate 85% [1979] Harris (1979)
Figure S-56: Relative density of masked booby (Sula dactylatra). A uniform distribution across the areawas chosen in absence of sufficient information. Also shown are incidental captures recorded by observersbetween the 2006–07 and 2010–11 fishing years in trawl, surface-longline (SLL), bottom-longline (BLL),and set-net (SN) fisheries.
S-56 • Risk of commercial fisheries to New Zealand seabird populations (suppl.) Ministry for Primary Industries
CCSBT-ERS/1308/21

S.57 Pied shag (Phalacrocorax varius varius)
Population (NZ) more than 652 pairs [1990] Marchant & Higgins (1990)
Age at first reproduction more than 2 years Schreiber & Burger (2001)
Survival rate 87.8 (85.9 – 89.7)% European shag as proxy, Harris et al. (1994)
Figure S-57: Relative density of pied shag (Phalacrocorax varius varius). The base map was obtained bycreating a buffer around coastal locations where the species has been found. Also shown are incidentalcaptures recorded by observers between the 2006–07 and 2010–11 fishing years in trawl, surface-longline(SLL), bottom-longline (BLL), and set-net (SN) fisheries.
Ministry for Primary Industries Risk of commercial fisheries to New Zealand seabird populations (suppl.) • S-57
CCSBT-ERS/1308/21

S.58 Little black shag (Phalacrocorax sulcirostris)
Population (NZ) 400 to 800 pairs Taylor (2000b)
Age at first reproduction 2 years Pied shag as proxy
Survival rate 87.8 (85.9 – 89.7)% European shag as proxy, Harris et al. (1994)
(a) Breeding distribution (b) Non-breeding distribution
Figure S-58: Relative density of little black shag (Phalacrocorax sulcirostris). The base map was obtained bycreating a buffer around coastal locations where the species has been found. The breeding season runs fromOctober to December. Also shown are incidental captures recorded by observers between the 2006–07 and2010–11 fishing years in trawl, surface-longline (SLL), bottom-longline (BLL), and set-net (SN) fisheries.
S-58 • Risk of commercial fisheries to New Zealand seabird populations (suppl.) Ministry for Primary Industries
CCSBT-ERS/1308/21

S.59 New Zealand king shag (Phalacrocorax carunculatus)
Population (NZ) 102 to 126 pairs [2002] Birdlife International (2012)
Age at first reproduction more than 3 years Black shag as proxy
Survival rate 87.8 (85.9 – 89.7)% European shag as proxy, Harris et al. (1994)
Figure S-59: Relative density of New Zealand king shag (Phalacrocorax carunculatus). The base map wasobtained by creating a buffer around coastal locations where the species has been found. Also shown areincidental captures recorded by observers between the 2006–07 and 2010–11 fishing years in trawl, surface-longline (SLL), bottom-longline (BLL), and set-net (SN) fisheries.
Ministry for Primary Industries Risk of commercial fisheries to New Zealand seabird populations (suppl.) • S-59
CCSBT-ERS/1308/21

S.60 Stewart Island shag (Phalacrocorax chalconotus)
Population (NZ) 1800 to 2000 pairs [1981] Birdlife International (2012)
Age at first reproduction more than 3 years Black shag as proxy
Survival rate 87.8 (85.9 – 89.7)% European shag as proxy, Harris et al. (1994)
Figure S-60: Relative density of Stewart Island shag (Phalacrocorax chalconotus). The base map wasobtained by creating a buffer around coastal locations where the species has been found. Also shown areincidental captures recorded by observers between the 2006–07 and 2010–11 fishing years in trawl, surface-longline (SLL), bottom-longline (BLL), and set-net (SN) fisheries.
S-60 • Risk of commercial fisheries to New Zealand seabird populations (suppl.) Ministry for Primary Industries
CCSBT-ERS/1308/21

S.61 Chatham Island shag (Phalacrocorax onslowi)
Population (NZ) 357 pairs [2011] Birdlife International (2012)
Age at first reproduction more than 3 years Black shag as proxy
Survival rate 87.8 (85.9 – 89.7)% European shag as proxy, Harris et al. (1994)
Figure S-61: Relative density of Chatham Island shag (Phalacrocorax onslowi). The base map was obtainedby creating a buffer around coastal locations where the species has been found. Also shown are incidentalcaptures recorded by observers between the 2006–07 and 2010–11 fishing years in trawl, surface-longline(SLL), bottom-longline (BLL), and set-net (SN) fisheries.
Ministry for Primary Industries Risk of commercial fisheries to New Zealand seabird populations (suppl.) • S-61
CCSBT-ERS/1308/21

S.62 Bounty Island shag (Phalacrocorax ranfurlyi)
Population (NZ) 120 pairs [2005] Birdlife International (2012)
Age at first reproduction more than 3 years Black shag as proxy
Survival rate 87.8 (85.9 – 89.7)% European shag as proxy, Harris et al. (1994)
Figure S-62: Relative density of Bounty Island shag (Phalacrocorax ranfurlyi). The base map was obtainedby creating a buffer around coastal locations where the species has been found. Also shown are incidentalcaptures recorded by observers between the 2006–07 and 2010–11 fishing years in trawl, surface-longline(SLL), bottom-longline (BLL), and set-net (SN) fisheries.
S-62 • Risk of commercial fisheries to New Zealand seabird populations (suppl.) Ministry for Primary Industries
CCSBT-ERS/1308/21

S.63 Auckland Island shag (Phalacrocorax colensoi)
Population (NZ) more than 1366 pairs [2011] Birdlife International (2012)
Age at first reproduction more than 3 years Black shag as proxy
Survival rate 87.8 (85.9 – 89.7)% European shag as proxy, Harris et al. (1994)
Figure S-63: Relative density of Auckland Island shag (Phalacrocorax colensoi). The base map was obtainedby creating a buffer around coastal locations where the species has been found. Also shown are incidentalcaptures recorded by observers between the 2006–07 and 2010–11 fishing years in trawl, surface-longline(SLL), bottom-longline (BLL), and set-net (SN) fisheries.
Ministry for Primary Industries Risk of commercial fisheries to New Zealand seabird populations (suppl.) • S-63
CCSBT-ERS/1308/21

S.64 Campbell Island shag (Phalacrocorax campbelli)
Population (NZ) 2000 pairs [1975] Birdlife International (2012)
Age at first reproduction more than 3 years Black shag as proxy
Survival rate 87.8 (85.9 – 89.7)% European shag as proxy, Harris et al. (1994)
Figure S-64: Relative density of Campbell Island shag (Phalacrocorax campbelli). The base map wasobtained by creating a buffer around coastal locations where the species has been found. Also shown areincidental captures recorded by observers between the 2006–07 and 2010–11 fishing years in trawl, surface-longline (SLL), bottom-longline (BLL), and set-net (SN) fisheries.
S-64 • Risk of commercial fisheries to New Zealand seabird populations (suppl.) Ministry for Primary Industries
CCSBT-ERS/1308/21

S.65 Spotted shag (Phalacrocorax punctatus)
Population (NZ) 10 000 to 30 000 pairs Taylor (2000b)
Age at first reproduction 2 years Schreiber & Burger (2001)
Survival rate 87.8 (85.9 – 89.7)% European shag as proxy, Harris et al. (1994)
Figure S-65: Relative density of spotted shag (Phalacrocorax punctatus). The base map was obtained bycreating a buffer around coastal locations where the species has been found. Also shown are incidentalcaptures recorded by observers between the 2006–07 and 2010–11 fishing years in trawl, surface-longline(SLL), bottom-longline (BLL), and set-net (SN) fisheries.
Ministry for Primary Industries Risk of commercial fisheries to New Zealand seabird populations (suppl.) • S-65
CCSBT-ERS/1308/21

S.66 Pitt Island shag (Phalacrocorax featherstoni)
Population (NZ) 669 pairs [1997] Taylor (2000a)
Age at first reproduction more than 3 years Black shag as proxy
Survival rate 87.8 (85.9 – 89.7)% European shag as proxy, Harris et al. (1994)
Figure S-66: Relative density of Pitt Island shag (Phalacrocorax featherstoni). The base map was obtainedby creating a buffer around coastal locations where the species has been found. Also shown are incidentalcaptures recorded by observers between the 2006–07 and 2010–11 fishing years in trawl, surface-longline(SLL), bottom-longline (BLL), and set-net (SN) fisheries.
S-66 • Risk of commercial fisheries to New Zealand seabird populations (suppl.) Ministry for Primary Industries
CCSBT-ERS/1308/21

S.67 Subantarctic skua (Catharacta antarctica lonnbergi)
Population (NZ) 450 to 470 pairs Wilson (2006)
Age at first reproduction 8.03 ± 0.21 years (N = 96) [1996] Young (1998)
Survival rate 93.8 (91 – 97)% [1965] Wood (1971)
Figure S-67: Relative density of subantarctic skua (Catharacta antarctica lonnbergi). The base map wasobtained by creating a buffer around coastal locations where the species has been found. Also shown areincidental captures recorded by observers between the 2006–07 and 2010–11 fishing years in trawl, surface-longline (SLL), bottom-longline (BLL), and set-net (SN) fisheries.
Ministry for Primary Industries Risk of commercial fisheries to New Zealand seabird populations (suppl.) • S-67
CCSBT-ERS/1308/21

S.68 Black-backed gull (Larus dominicanus)
Population (NZ) more than 1 000 000 pairs Taylor (2000b)
Age at first reproduction 4 years Schreiber & Burger (2001)
Survival rate 81% Schreiber & Burger (2001)
Figure S-68: Relative density of black-backed gull (Larus dominicanus). The base map was obtained bycreating a buffer around coastal locations where the species has been found. Also shown are incidentalcaptures recorded by observers between the 2006–07 and 2010–11 fishing years in trawl, surface-longline(SLL), bottom-longline (BLL), and set-net (SN) fisheries.
S-68 • Risk of commercial fisheries to New Zealand seabird populations (suppl.) Ministry for Primary Industries
CCSBT-ERS/1308/21

S.69 Caspian tern (Sterna caspia)
Population (NZ) 1000 pairs [1992] Taylor (2000b)
Age at first reproduction 2 to 4 years Schreiber & Burger (2001)
Survival rate 87 to 91% Schreiber & Burger (2001)89% [1980] Gill & Mewaldt (1983)
(a) Breeding distribution (b) Non-breeding distribution
Figure S-69: Relative density of Caspian tern (Sterna caspia). The base map was obtained by creating abuffer around coastal locations where the species has been found. The breeding season runs from Octoberto December. Also shown are incidental captures recorded by observers between the 2006–07 and 2010–11fishing years in trawl, surface-longline (SLL), bottom-longline (BLL), and set-net (SN) fisheries.
Ministry for Primary Industries Risk of commercial fisheries to New Zealand seabird populations (suppl.) • S-69
CCSBT-ERS/1308/21

S.70 Common white tern (Gygis alba)
Population (NZ) 60 to 100 pairs Taylor (2000b)
Age at first reproduction 3 to 5 years Schreiber & Burger (2001)
Survival rate 78 to 83% Bridled tern as proxy, Schreiber & Burger(2001)
Figure S-70: Relative density of common white tern (Gygis alba). The base map for the distribution wasobtained from the NABIS database. Also shown are incidental captures recorded by observers between the2006–07 and 2010–11 fishing years in trawl, surface-longline (SLL), bottom-longline (BLL), and set-net (SN)fisheries.
S-70 • Risk of commercial fisheries to New Zealand seabird populations (suppl.) Ministry for Primary Industries
CCSBT-ERS/1308/21

SUPPLEMENTARY REFERENCES
Agreement on the Conservation of Albatrosses and Petrels (ACAP) (2010). ACAP species assessment.Retrieved 7 May 2010, from http://www.acap.aq.
Baker, B.; Hedley, G.; Cunningham, R. (2010). Data collection of demographic, distributional, andtrophic information on the flesh-footed shearwater to allow estimation of effects of fishing onpopulation viability: 2009–10 field season. Final Research Report for Ministry for PrimaryIndustries Research Project PRO2006/01 (Unpublished report held by the Ministry for PrimaryIndustries, Wellington).
Barbraud, C.; Delord, K.; Marteau, C.; Weimerskirch, H. (2009). Estimates of population size ofwhite-chinned petrels and grey petrels at Kerguelen Islands and sensitivity to fisheries. AnimalConservation 12: 258–265.
Beck, J.R. (1969). Food, moult and age of first breeding in the Cape pigeon, Daption capensis(Linnaeus). British Antarctic Survey Bulletin 21: 33–44.
Bell, E.A. (2002). Grey petrels (Procellaria cinerea) on Antipodes Island, New Zealand: researchfeasibility, April to June 2001. DOC Science internal series 60. 31 p.
Bell, E.A.; Sim, J.L.; Scofield, P.; Francis, R.I.C.C. (2011). Population parameters of theblack petrels (Procellaria parkinsoni) on Great Barrier Island (Aotea Island), 2009/10.Unpublished report prepared for the Department of Conservation, retrieved fromhttp://www.doc.govt.nz/publications/conservation/marine-and-coastal/conservation-services-programme/csp-reports/population-parameters-of-black-petrels-on-great-barrier-aotea-island-2009-10/, January 2012.
Birdlife International (2009). Birdlife International. Species factsheets. http://www.birdlife.org.Retrieved 21 May 2010, from http://www.birdlife.org
Birdlife International (2012). Birdlife International. Species factsheets. http://www.birdlife.org.Retrieved 10 May 2012, from http://www.birdlife.org
Bradley, J.S.; Gunn, B.M.; Skira, I.J.; Meathrel, C.E.; Wooller, R.D. (1999). Age-dependent prospectingand recruitment to a breeding colony of short-tailed shearwaters Puffinus tenuirostris. Ibis 141:277–285.
Clucas, R.J.; Fletcher, D.J.; Moller, H. (2008). Estimates of adult survival rate for three colonies of sootyshearwater (Puffinus griseus) in New Zealand. Emu 108: 237–250.
Croxall, J.P. (1987). The status and conservation of Antarctic seals and seabirds: a review. EnvironmentInternational 13: 55–70.
Croxall, J.P.; Gales, R. (1998). An assessment of the conservation status of albatrosses. In, Robertson,G.; Gales, R. (Eds.), The albatross: biology and conservation, pp. 46–65. Surrey Beatty & Sons,Chipping Norton, Australia.
Cuthbert, R.; Davis, L.S. (2002). Adult survival and productivity of Hutton’s shearwaters. Ibis 144(3):423–432.
Dillingham, P.W.; Fletcher, D. (2008). Estimating the ability of birds to sustain additional human-causedmortalities using a simple decision rule and allometric relationships. Biological Conservation 141:1783–1792.
Francis, R.I.C.C. (2012). Fisheries risks to the population viability of white-capped albatross(Thalassarche steadi). New Zealand Aquatic Environment and Biodiversity Report No. 104. 24 p.
Francis, R.I.C.C.; Sagar, P.M. (2012). Modelling the effect of fishing on southern Buller’s albatrossusing a 60-year dataset. New Zealand Journal of Zoology 39(1): 3–17.
Gill, R.E.; Mewaldt, L.R. (1983). Pacific coast caspian terns: dynamics of an expanding population.The Auk 100(2): 369–381.
Guinard, E.; Weimerskirch, H.; Jouventin, P. (1998). Population changes and demography of the northernrockhopper penguin on Amsterdam and Saint Paul islands. Colonial waterbirds 21(2): 222–228.
Harris, M.P. (1979). Survival and ages of first breeding of Galapagos seabirds. Bird-Banding 50(1):56–61.
Ministry for Primary Industries Risk of commercial fisheries to New Zealand seabird populations (suppl.) • S-71
CCSBT-ERS/1308/21

Harris, M.P.; Buckland, S.T.; Russell, S.M.; Wanless, S. (1994). Year-and age-related variation in thesurvival of adult European shags over a 24-year period. Condor 96(3): 600–605.
L. Brooke, M. de (2004). Albatrosses and petrels across the world. Oxford University Press. 499 p.Marchant, S.; Higgins, P.J. (1990). Handbook of Australian, New Zealand and Antarctic birds. Volume
1, part A. Oxford University Press, Melbourne, Australia. 735 p.Robertson, C.J.R. (1993). Survival and longevity of the northern royal albatross Diomedea epomophora
sanfordi at Taiaroa Head 1937–93. Emu 93(4): 269–276.Roots, C. (2006). Flightless birds. Greenwood Press, Connecticut. 248 p.Sagar, P.; Carroll, J.; Charteris, M.; Thompson, D.; Scofield, P. (2011). Population assessment of Salvin’s
albatrosses at the Snares Western Chain, 25 September – 14 October 2010. Final Research Reportfor research project PRO200601-E (Unpublished report held by Ministry for Primary Industries,Wellington.)
Sagar, P.M.; Stahl, J.C. (2005). Increases in the numbers of breeding pairs in two populations of Buller’salbatross (Thalassarche bulleri bulleri). Emu 105(1): 49–55.
Sagar, P.; Tennyson, A.; Miskelly, C. (1996). Breeding and survival of Snares Cape pigeons Daptioncapense australe at The Snares, New Zealand. Notornis 43: 197–207.
Schreiber, E.A.; Burger, J. (2001). Biology of marine birds. CRC Press, Boca Raton.Sidhu, L.A.; Catchpole, E.A.; Dann, P.; Shaffer, T.L. (2007). Mark-recapture-recovery modeling and
age-related survival in little penguins (Eudyptula minor). The Auk 124(3): 815–827.Taylor, G.A. (2000a). Action plan for seabird conservation in New Zealand. Part A: Threatened seabirds.
Threatened Species Occasional Publication No. 16. 234 p.Taylor, G.A. (2000b). Action plan for seabird conservation in New Zealand. Part B: Non-threatened
seabirds. Threatened Species Occasional Publication No. 17. 435 p.Trivelpiece, S.G.; Trivelpiece, W.Z. (1998). Post-fledging dispersal of southern giant petrels
Macronectes giganteus banded at Admiralty Bay, King George Island, Antarctica. MarineOrnithology 26: 63–68.
Veitch, C.R.; Miskelly, C.M.; Harper, G.A.; Taylor, G.A.; Tennyson, A.J.D. (2004). Birds of theKermadec Islands, south-west Pacific. Notornis 51(2): 61–90.
Walker, K.; Elliott, G. (1999). Population changes and biology of the wandering albatross Diomedeaexulans gibsoni at the Auckland Islands. Emu 99: 239–247.
Walker, K.; Elliott, G. (2002). Monitoring Antipodean and Gibson’s wandering albatross, 1996/97.Department of Conservation Science Internal Series 75. 14 p.
Waugh, S.M.; Doherty, P.F.; Freeman, A.N.D.; Adams, L.; Woods, G.C.; Bartle, J.A.; Hedley, G.K.(2006). Demography of Westland petrels (procellaria westlandica), 1995–2003. Emu 106: 219–226.
Waugh, S.M.; Weimerskirch, H.; Moore, P.J.; Sagar, P.M. (1999). Population dynamics of black-browedand grey-headed albatrosses Diomedea melanophrys and D. chrysostoma at Campbell Island, NewZealand, 1942–96. Ibis 141: 216–225.
Wilson, K.-J. (2006). The state of New Zealand’s birds. Special report seabirds. Ornithological Societyof New Zealand, Nelson.
Wodzicki, K.; Robertson, C.; Thompson, H.; Alderton, C. (1984). The distribution and numbers ofgannets in New Zealand. Notornis 31: 232–261.
Wood, R.C. (1971). Population dynamics of breeding south polar skuas of unknown age. The Auk 88(4):805–814.
Young, E.C. (1998). Dispersal from natal territories and the origin of cooperatively polyandrous breedinggroups in the brown skua. Condor 100: 335–342.
S-72 • Risk of commercial fisheries to New Zealand seabird populations (suppl.) Ministry for Primary Industries
CCSBT-ERS/1308/21