risk mitigation in breast predictive factor testingarup.utah.edu/media/pc15_riskmitbpf/feb 10th 530...
TRANSCRIPT

Risk Mitigation in Breast Predictive Factor Testing
Elizabeth H Hammond MD
Risk Defintion
Risk is the opportunity for error, and risk of an inaccurate test result for the patient. Goal is the right test on the right patient with the right result delivered at the right time.

Pathologist Responsibility
• Scope of risks in the laboratory is broad and complex
• Pathologists are responsible as directors for the quality of all testing in the laboratory
• Pathologists are responsible for risk mitigation even if they do not perform every step of the process
• Pathologist must lead the investigation of risks and mitigate them using appropriate tools and processes

Biomarker Testing Risks
• Preanalytic – Specimen misidentification – Cold ischemic time too long – Type of fixative (non-NBF) – Length of fixation too short/too long – Delay in grossing of fixed specimen – Failure to consider specimen exclusion
and inclusion criteria
Biomarker Testing Risks
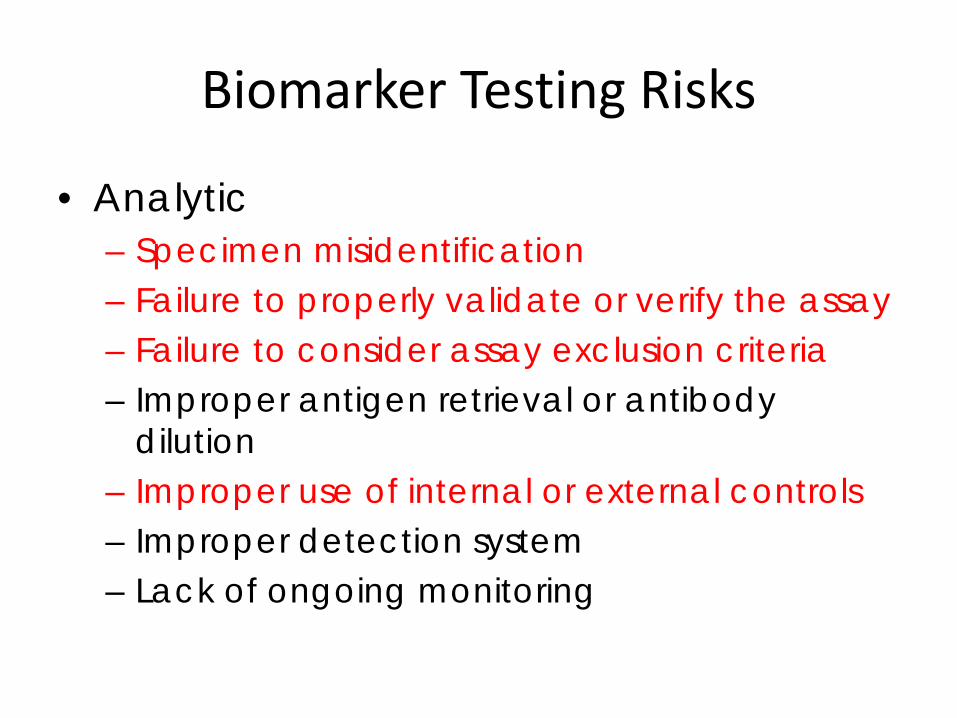
• Analytic – Specimen misidentification – Failure to properly validate or verify the assay – Failure to consider assay exclusion criteria – Improper antigen retrieval or antibody
dilution – Improper use of internal or external controls – Improper detection system – Lack of ongoing monitoring
Biomarker Testing Risks
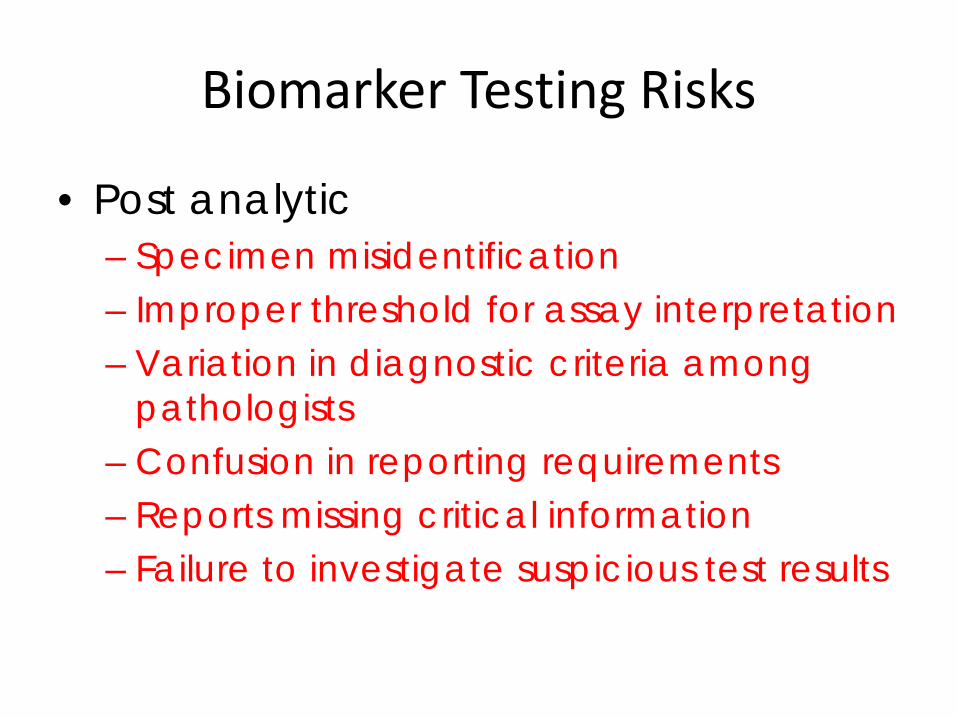
• Post analytic – Specimen misidentification – Improper threshold for assay interpretation – Variation in diagnostic criteria among
pathologists – Confusion in reporting requirements – Reports missing critical information – Failure to investigate suspicious test results

Biomarker Testing Risks
• System Factors – Limited QA resources – Limited staff – Lack of standard SOPs – Lack of training and/or accountability for
staff – Remote locations
• Human Factors
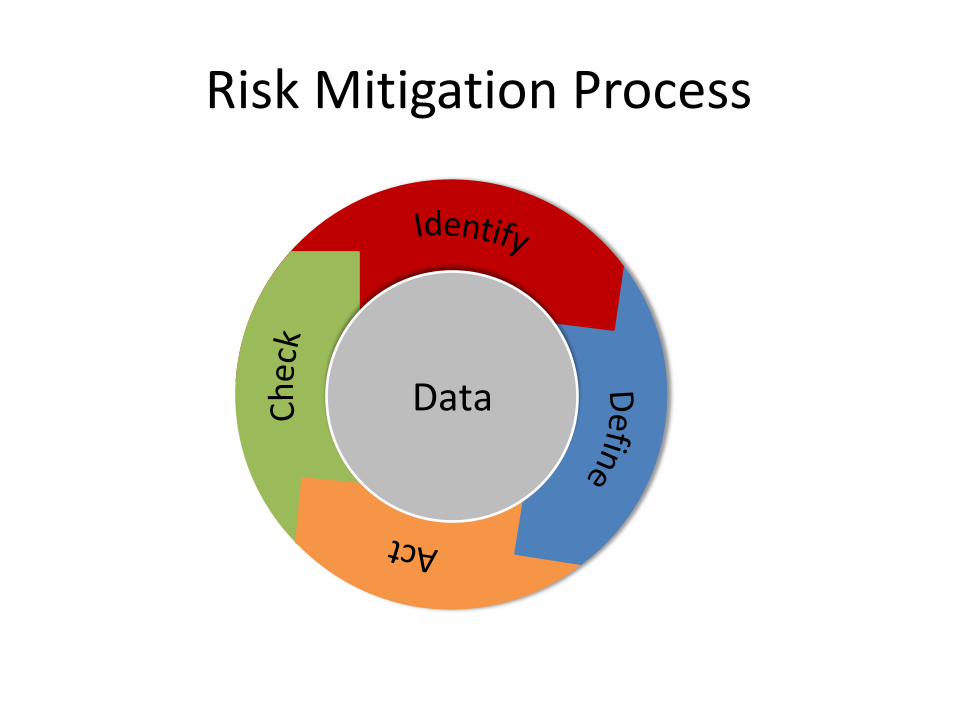
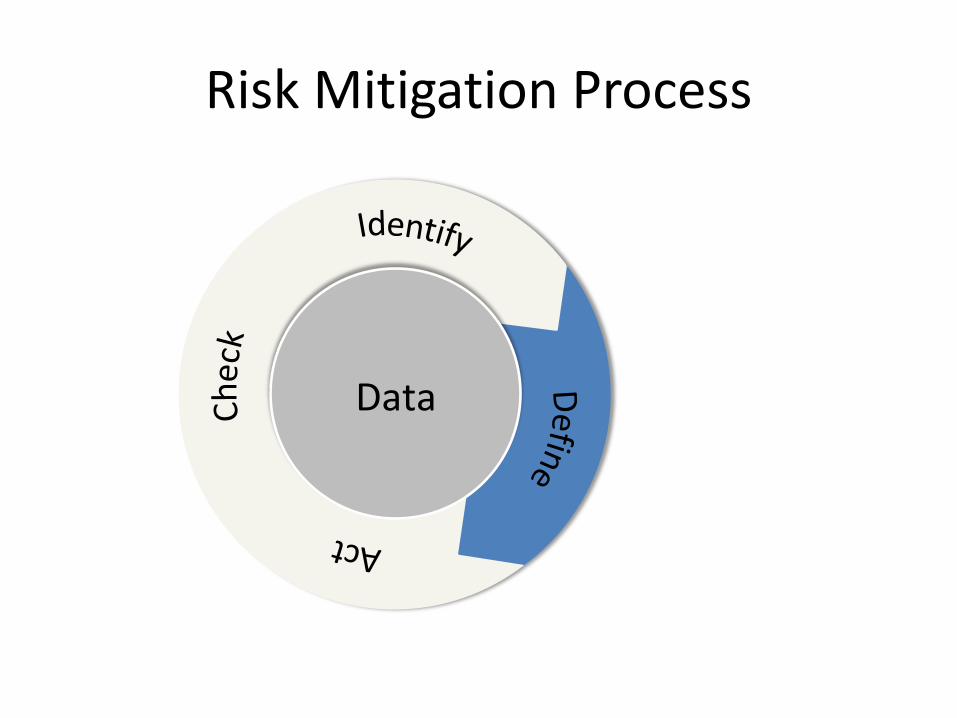
Risk Mitigation Process
Data
Risk Mitigation Data
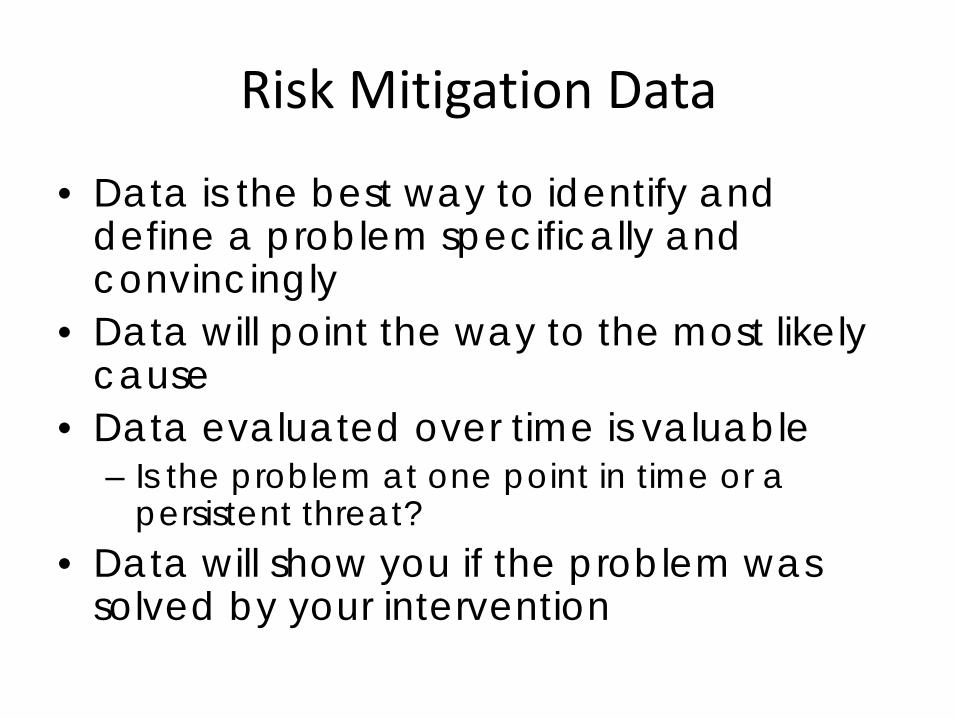
• Data is the best way to identify and define a problem specifically and convincingly
• Data will point the way to the most likely cause
• Data evaluated over time is valuable – Is the problem at one point in time or a
persistent threat? • Data will show you if the problem was
solved by your intervention
Risk Mitigation Data
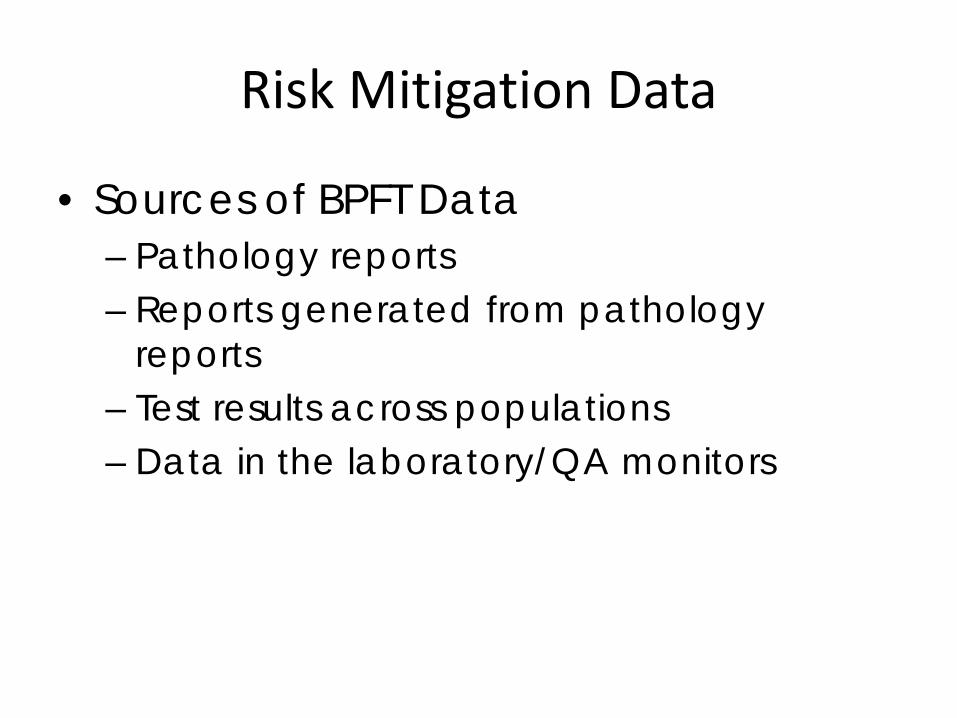
• Sources of BPFT Data – Pathology reports – Reports generated from pathology
reports – Test results across populations – Data in the laboratory/QA monitors
Risk Mitigation Data
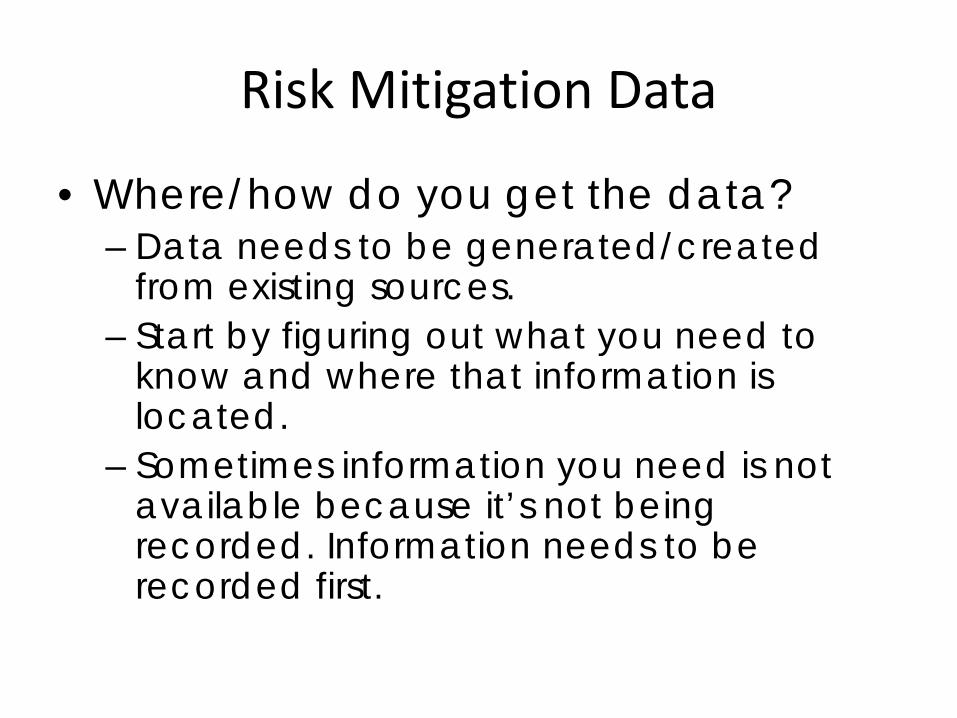
• Where/how do you get the data? – Data needs to be generated/created
from existing sources. – Start by figuring out what you need to
know and where that information is located.
– Sometimes information you need is not available because it’s not being recorded. Information needs to be recorded first.

Example
• Surgeon presents case of metastatic carcinoma in the liver in 58 year-old woman with IDC 2 years before called ER negative
• Repeat ER on liver is ER positive • Patient was never treated with Tam or AI • Repeat on original resection still negative,
but so are intrinsic controls • Why? • How can this be avoided in the future?

Data Example
• How common is the risk mitigation issue? – We conducted retrospective study of all ER
negative cases by day of week and processing site. – All ER testing done in one place by one staff. – Only variation was specimen handling.
• What are potential causes? • What should be done to mitigate the issue?

ER Negative Rate by Hospital of Origin
Hsp A Hsp B Hsp C Hsp D Hsp E(ref lab)
Hsp F Hsp G0%
5%
10%
15%
20%
25%
30%
35%
40%
Hospital (Hsp) code
Mean
ER
neg
28.6
21.4 22.7 23.7
19.616.5
23.2
Mean value=20.9% Age adjusted MH p value=0.05

ER Neg Rate by Day of Surgery
20.4%23.6%
0%
5%
10%
15%
20%
25%
30%
35%
40%
Group A (Sun thru Thu) Group B (Fri & Sat)
Group
Group A: Surgery Sunday thru Thursday, any hospital Group B: Surgery Friday thru Saturday, any hospital
Age adjusted MH test p value= 0.038
Nkoy et al, SABC, 2005 and Archives, 2010

Conclusion
• The study led them to realize that what really happened in each place or on each day could not be defined because there was no data.
• Conducted prospective study to define the potential causes by asking sites to record: – Time of tumor removal – Time of tumor to grossing station – Length of Time in fixative – Fixation duration
• 2 of 5 sites were willing to conduct the study

Risk Mitigation Process
Data
Focus on the most serious risks

Risk Process: Identify
• In our example, a risk was identified via the patient with a metastatic carcinoma in her liver that was ER positive.
• Preferred methods for identifying risks include: – Monitoring your lab’s test results and data using
established benchmarks. – Evaluating your lab’s SOPs against external standards
such as ASCO-CAP Guidelines and inspection checklists.
– Monitoring test results by pathologist.

Risk Process: Identify
Steps Tools & Resources 1. Analyze current data and
trends
• Trend analysis • PT data
2. Evaluate current processes • Flow-charting
• Inspection reports • Checklists (LAP) • Guidelines
3. Locate gaps between
current state and desired state
• Established Benchmarks • Checklists (LAP) • PT data • Guidelines
Risk Process: Identify Using ER/ PgR Benchmarks
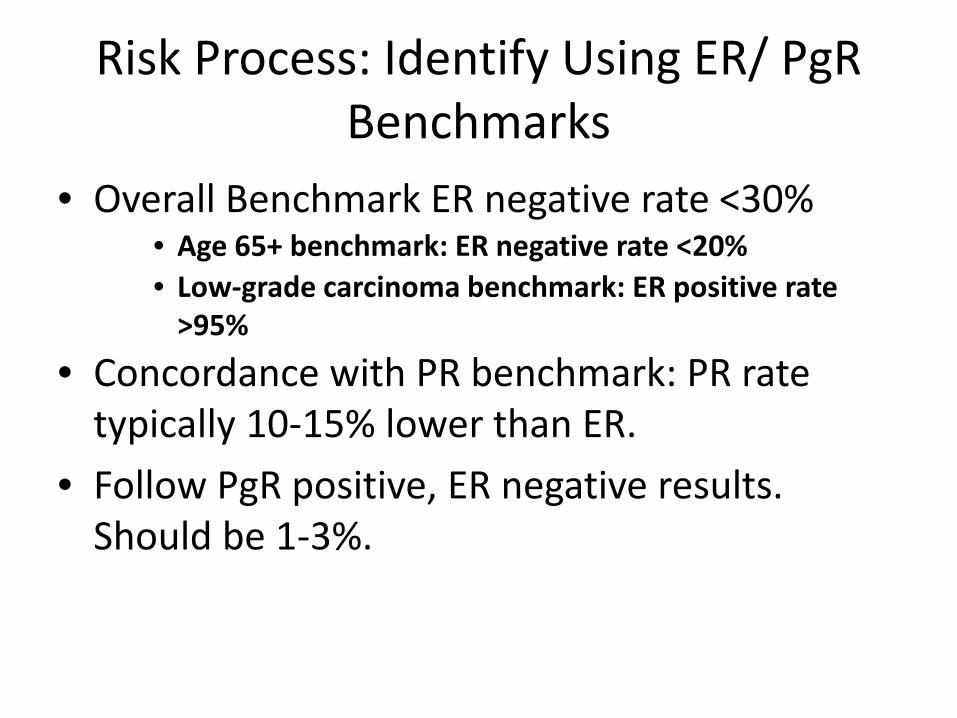
• Overall Benchmark ER negative rate <30% • Age 65+ benchmark: ER negative rate <20% • Low-grade carcinoma benchmark: ER positive rate
>95%
• Concordance with PR benchmark: PR rate typically 10-15% lower than ER.
• Follow PgR positive, ER negative results. Should be 1-3%.
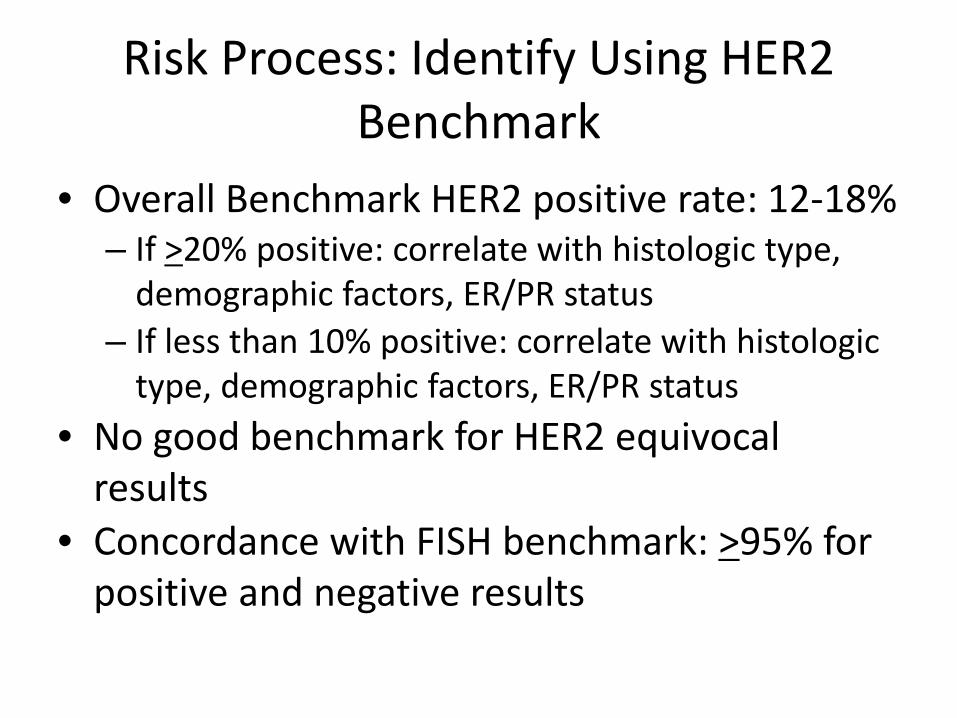
Risk Process: Identify Using HER2 Benchmark
• Overall Benchmark HER2 positive rate: 12-18% – If >20% positive: correlate with histologic type,
demographic factors, ER/PR status – If less than 10% positive: correlate with histologic
type, demographic factors, ER/PR status • No good benchmark for HER2 equivocal
results • Concordance with FISH benchmark: >95% for
positive and negative results
Risk Mitigation Process
Data
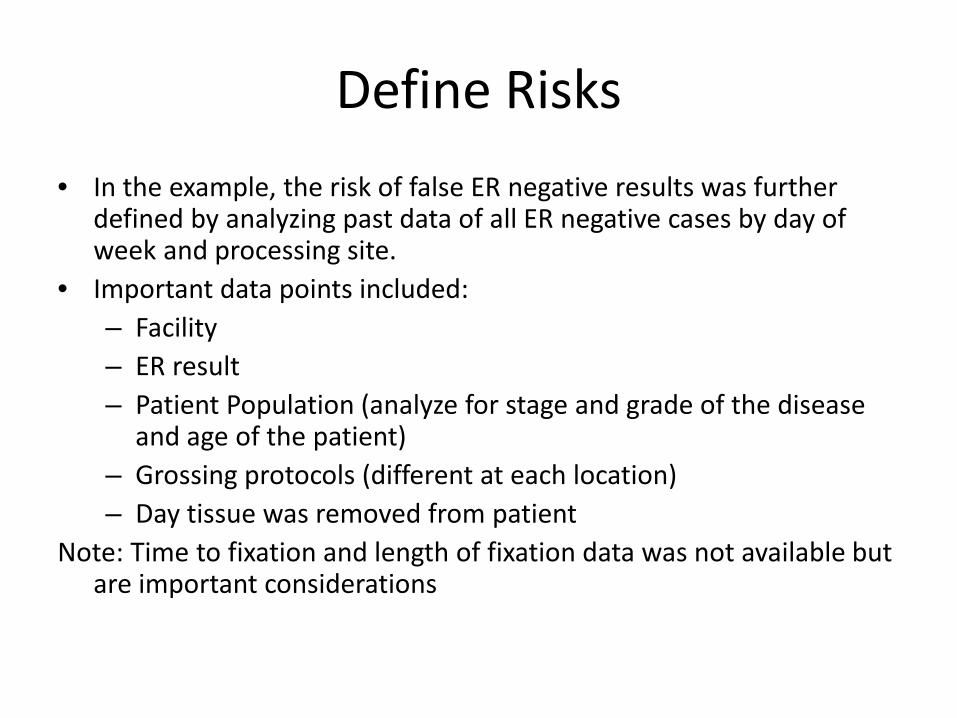
Define Risks • In the example, the risk of false ER negative results was further
defined by analyzing past data of all ER negative cases by day of week and processing site.
• Important data points included: – Facility – ER result – Patient Population (analyze for stage and grade of the disease
and age of the patient) – Grossing protocols (different at each location) – Day tissue was removed from patient
Note: Time to fixation and length of fixation data was not available but are important considerations
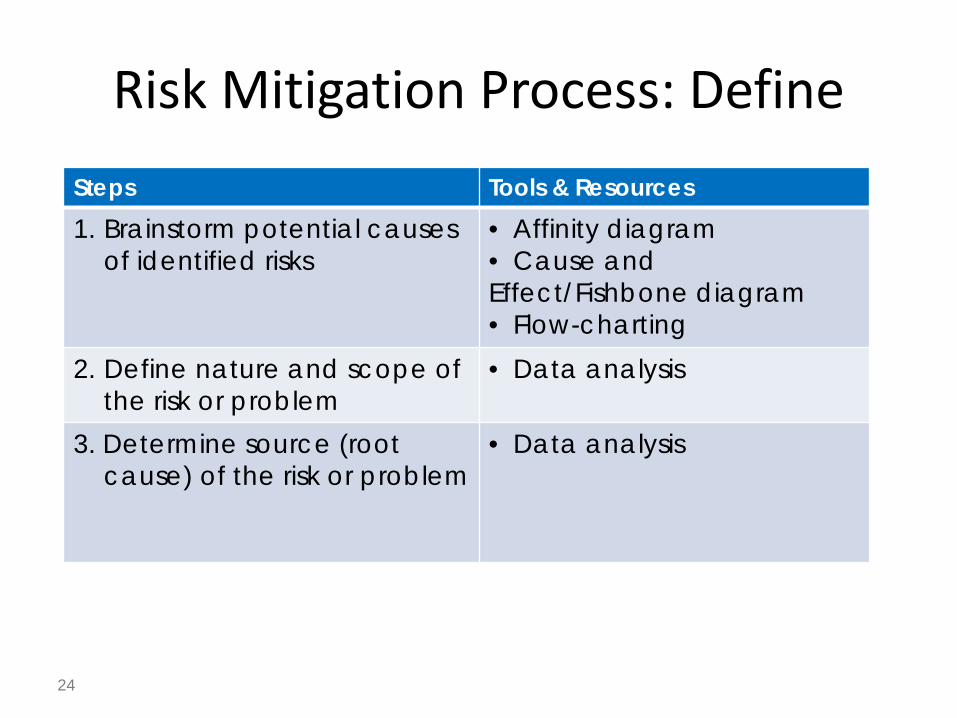
Risk Mitigation Process: Define
24
Steps Tools & Resources 1. Brainstorm potential causes
of identified risks • Affinity diagram • Cause and Effect/Fishbone diagram • Flow-charting
2. Define nature and scope of the risk or problem
• Data analysis
3. Determine source (root cause) of the risk or problem
• Data analysis

Risk Mitigation Process: Define Tool: Process Flow Charting
25
Gross assessment and dissection Tissue Fixation
Pathologist Review Samples processed and slides created
Excision Sample Obtained
No SOP

Inappropriate reagents/fixatives
Variable reagents/fixatives
Lack of controls
Inappropriate controls
No QA of materials Poor Test
Outcome
Materials Equipment Management Environment
Process: Pre-analytic
People Pathologists/ Staff
Process: Analytic
Process: Post-analytic
No communication plans
Poor team structures
Poor understanding of QA
Excessive Workload
No method to adjudicate perceived issues
Culture of blame
Poor training on equipment
Poor equipment maintenance
Poor equipment QA
Inappropriate protocol to follow SOP
Hierarchal style without input
Poor understanding of QA
Poor monitoring of QA
Poor communication style
Poor teamwork structure
Inexperience
Ignorance of evidence
Haste
Poor memory of evidence/criteria/SOP
Poor training
No SOP
Poor training on SOP
Poor communication
Ignorance of evidence
Poor teamwork
Poor QA
No QA
Inaccurate SOP
No SOP
Poor training on SOP
Poor validation of SOP
No controls
No evaluation of controls
No QA process
Poor QA process
Inaccurate SOP
No SOP
No QA
Poor QA
Ignorance of evidence
Poor teamwork
Poor communication
Poor training
Tool: Cause and Effect Diagram (Fishbone)
26

Risk Mitigation Process
Data
Fixing the problem
27 .

Act on Risks
• In the example, the prospective study which asked sites to record fixation time points created an effective intervention. ER negative rate was reduced.
• Acting on risks must address the root cause of the problem and can include: – Process adjustments – Revisions to SOPs – Training and education of surgical staff, grossing room
staff, data clerks and pathologists • Start simple: Try to come up with the most simple
intervention to start, sometimes the best solutions are simple ones.

Act on Risk: Workflow Standardization
• Breast specimen workflow standardization at Intermountain Healthcare led to simplification: – OR staff came to a more standard way of handling
breast cancer samples that made everyone’s life easier and decreased cold ischemic time.
– Grossing room changed process to the specimen being immediately cut in.
– Specimen radiographs not sent to a separate facility.

Risk Mitigation Process
Data
Making sure the problem was fixed
and stays fixed
30

Check (Hold the Gain)
• After 1 year, the results were measured: – At measuring sites, the mean time to fixation (cold
ischemic time) was 18 minutes – PR negative rate was significantly lower and ER
negative rate was also lower at measuring sites – FISH testing showed decrease of 10% in
specimens requiring repeat testing

Check (Hold the Gain)
• Process changes may not be durable and reminders are needed of the importance.
• New errors and risks may be discovered which require initiation of new efforts.
• Staffing, equipment or process changes may alter circumstances and promote new errors.
• Ongoing monitoring is always needed.

Risk Mitigation Process: Check
33
Steps Tools & Resources 1. Use iterative cycles to
collect feedback and make adjustments
• Regular team meetings • Trend analysis
2. Share progress and data with stakeholders
• Presentations to stakeholders
3. Look for broader applications of successful improvements
• Publish your results so others will have access to the information
.

Ongoing Monitoring
• Not a formal process • ASCO/CAP recommends monitoring every 6
months • Periodic monitoring using CAP IHC surveys and
external QC

Ongoing Monitoring ER/PgR Monitor positive and negative rates • Overall Benchmark ER- rate: <30%
– If >30%: correlate with histologic type, demographic factors • Age 65+ benchmark ER- rate: <20%
– If >20%: re-validate assay • Low-grade carcinoma benchmark ER+ rate: >95%
– If <95%: revalidate Monitor concordance with PR. PR rate typically 10-15% lower than ER. Monitor and document successful external Proficiency Testing Monitor pathologist interpretative competence (use CAP surveys or
internal validation sets)
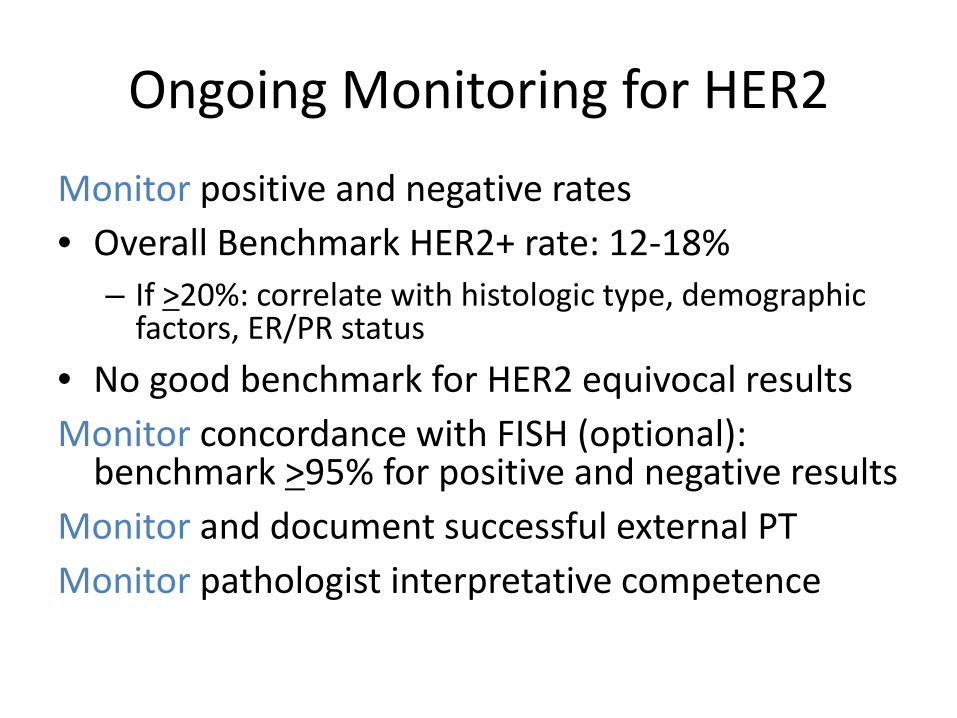
Ongoing Monitoring for HER2
Monitor positive and negative rates • Overall Benchmark HER2+ rate: 12-18%
– If >20%: correlate with histologic type, demographic factors, ER/PR status
• No good benchmark for HER2 equivocal results Monitor concordance with FISH (optional):
benchmark >95% for positive and negative results Monitor and document successful external PT Monitor pathologist interpretative competence

Proficiency Testing
• Easier than validation - different standard – 90% concordance expected
• Can be based on interlaboratory testing • Currently recommended for all prognostic/
predictive markers • Will ultimately be required for all markers
(‘regulated’ PT for high complexity tests)

Interpretive Competency Assessment • ASCO/CAP Guidelines place the burden of
interpretive competency assessment and documentation on the Laboratory Director
• Each pathologist who reads and reports a given prognostic/predictive marker must be objectively assessed for: – Knowledge and use of interpretive criteria – Concordance with consensus or standard interpretation - 95%
(minimum 40 slide set using selection criteria for initial test verification)
– Adherence to reporting requirements – Reproducibility (testing every 6 months)
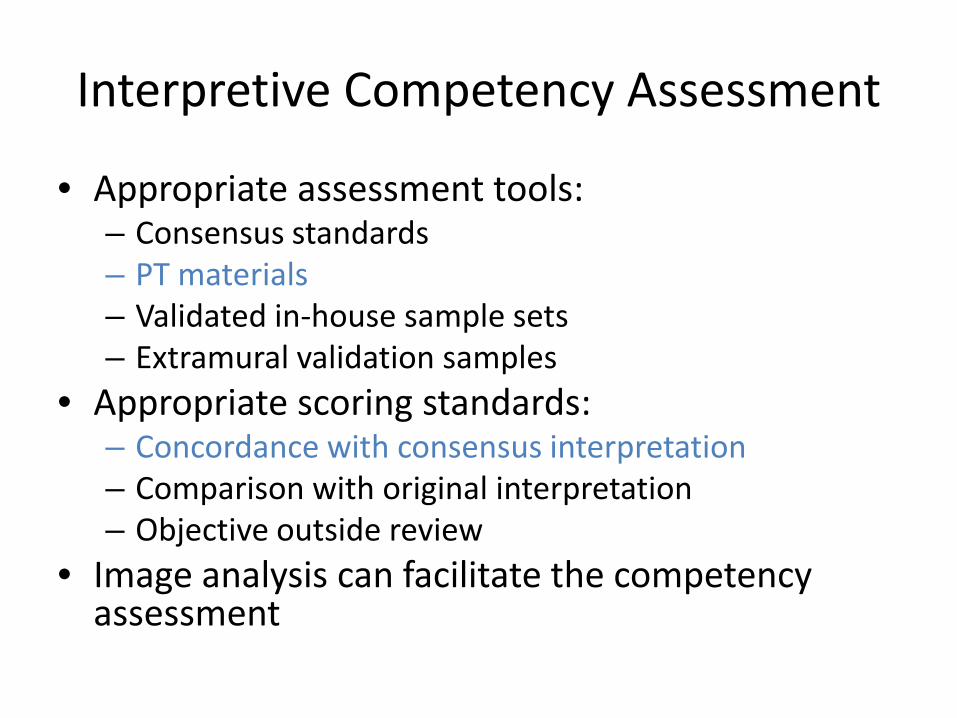
Interpretive Competency Assessment
• Appropriate assessment tools: – Consensus standards – PT materials – Validated in-house sample sets – Extramural validation samples
• Appropriate scoring standards: – Concordance with consensus interpretation – Comparison with original interpretation – Objective outside review
• Image analysis can facilitate the competency assessment

Summary
• No prognostic or predictive marker should be used without – Technical verification or validation – Ongoing monitoring – Laboratory proficiency – Interpretative competence
• Pathology practice should be biased towards use of validated markers, unless the assay is part of a clinical trial or research study for which the patient has granted permission