risk management - workers’ compensation
TRANSCRIPT

CountyStat
Risk Management - Workers’ Compensation
Cross-Departmental Study
Meeting #4
October 23, 2013

CountyStat 2 Workers' Compensation
Update
10/23/2013
CountyStat Principles
Require Data-Driven Performance
Promote Strategic Governance
Increase Government Transparency
Foster a Culture of Accountability

CountyStat 3 Workers' Compensation
Update
10/23/2013
Agenda
Welcome and Introductions
“Reactive” Risk Management
– Program Update
– Total Cost of Workers’ Compensation Program
“Proactive” Risk Management
– Wellness
– Safety Training
Department Performance
– Montgomery County Fire and Rescue Service
– Montgomery County Police Department
– Department of Correction and Rehabilitation
– Department of Liquor Control
– Department of Transportation
– Department of General Services
Wrap-up

CountyStat 4 Workers' Compensation
Update
10/23/2013
Meeting Goal
Identify trends in workers’ compensation cases
Set strategy that addresses high-risk areas as identified by
workers’ compensation data
Examine the County’s current practices to proactively reduce
workplace injuries
Reduce the number of workplace injuries and illnesses across
the County through proactive risk management
Desired Outcome

CountyStat 5 Workers' Compensation
Update
10/23/2013
Agenda
Welcome and Introductions
“Reactive” Risk Management
– Program Update
– Total Cost of Workers’ Compensation Program
“Proactive” Risk Management
– Wellness
– Safety Training
Department Performance
– Montgomery County Fire and Rescue Service
– Montgomery County Police Department
– Department of Correction and Rehabilitation
– Department of Liquor Control
– Department of Transportation
– Department of General Services
Wrap-up

CountyStat 6 Workers' Compensation
Update
10/23/2013
The Workers’ Compensation Process
Injury/Illness
Occurs
Claim Reported to
CorVel
FROI
Department
Supervisor
Notified
Claims
Professional
Assigned
TCM
Screens
Contacts:
Dept. Supervisor
Injured Worker
Provider
Contacts:
Claims Professional
Provider
Injured Worker
Dept. Supervisor
RTW Coordinated
FROI = First Report of Injury TCM = Telephonic Case Management RTW = Return to Work
MCSIP WC – TCM Workflow
Diagram provided by Finance-Risk Management

CountyStat
Changes to Workers’ Comp Program since FY10
Transitioned to a new Third-Party Administrator (TPA) in FY13
– CorVel was chosen to be new TPA
– After the initial transition period, CorVel has brought stability and
experience to the workers’ compensation claims program
– As of June 2013, claim processing statistics have improved significantly:
• Bills are being paid on average of 8 days (45 days allowed by COMAR)
• 95% of compensation determinations are being made within 14 days
• 91% of injured workers are contacted within 24 hours
– CorVel has added staff above the required contract levels and added an
additional claim unit
– New claims manager has instituted an aggressive training program for
CorVel’s claims professionals
– Allows for centralized services for all aspects of the program and
greater control through a single platform with:
• Medical bill repricing
• Pharmacy benefit management
• Medical evaluations
• Nurse case management 7 Workers' Compensation
Update
10/23/2013

CountyStat
Cost of Workers’ Compensation per $100 of Payroll
8 Workers' Compensation
Update
10/23/2013
$0.00
$0.50
$1.00
$1.50
$2.00
$2.50
$3.00
$3.50
FY10 FY11 FY12 FY13 FY14 FY15 FY16
Results Projections
FY10 FY11 FY12 FY13 FY14 FY15 FY16
Results $2.87 $3.12 $3.05 $2.80
Projections $2.80 $2.80 $2.80
From FY10 to FY13, the cost of workers’ compensation per $100 of payroll was
consistently around $3. It is expected to stay near $3 through FY16.

CountyStat
Workers’ Compensation Costs Incurred by Dept. in FY12*
9 Workers' Compensation
Update
10/23/2013
MCFRS 43%
MCPD 19%
DOCR 9%
DLC 2%
DOT 15%
DGS 4%
Other 8%
Police and FRS comprised 62% of all workers’ compensation costs incurred in FY12
*Incurred = Total Paid + Outstanding Reserves
Source: Risk Management Quarterly Reports for Incidents Occurring in FY12
CountyStat
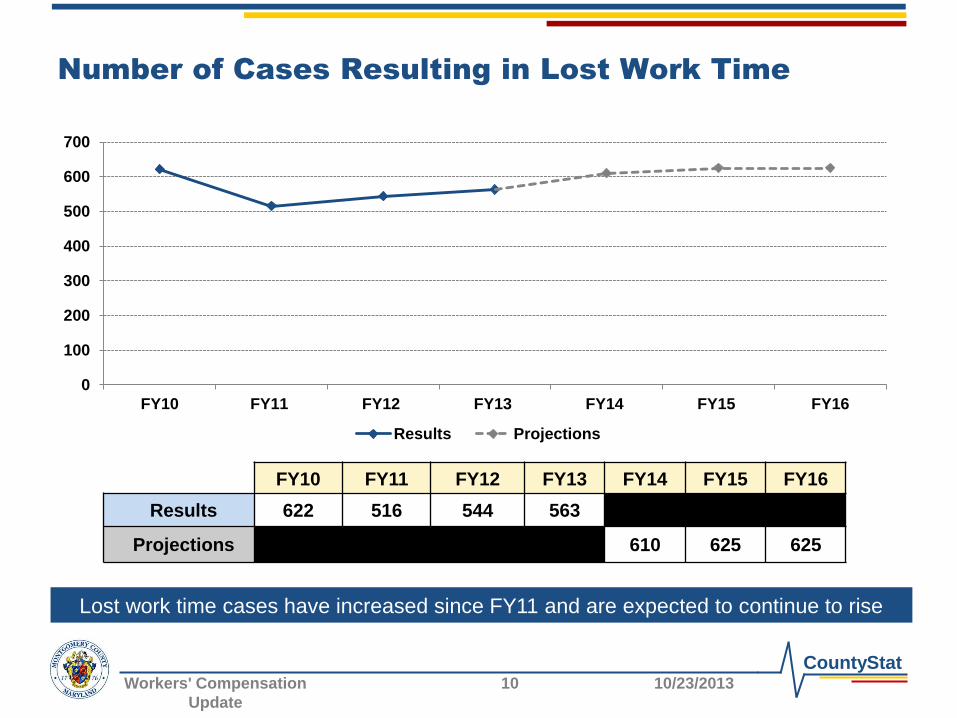
Number of Cases Resulting in Lost Work Time
10 Workers' Compensation
Update
10/23/2013
0
100
200
300
400
500
600
700
FY10 FY11 FY12 FY13 FY14 FY15 FY16
Results Projections
FY10 FY11 FY12 FY13 FY14 FY15 FY16
Results 622 516 544 563
Projections 610 625 625
Lost work time cases have increased since FY11 and are expected to continue to rise

CountyStat
Moving Employees off Disability and into Productive Work Assignments
Risk Management is in the process of hiring a new Workers’ Compensation
Coordinator who will provide oversight and direction of the claims process
between departments and the claims service
– Counsel injured workers and management through the claim and return to work processes
– Ensure the County’s worker’s compensation leave provisions are being correctly applied
Injured workers using County’s PPO network can extend salary continuation
up to 18 months
– FOP injured workers are given 18 months regardless of physician choice as set in CBA
– Provides financial incentive for injured worker to use PPO network
– Network providers are chosen because of their knowledge of the claim process and
specialties in dealing with common injuries seen in the County
– Injured workers can get the best treatment and return to work
Risk Management is working with CorVel to develop additional data reports to
look for patterns in claims that may reveal injury trends
Use of light duty assignments to transition back to normal duties
– Limited to 6 months
11 Workers' Compensation
Update
10/23/2013

CountyStat 12 Workers' Compensation
Update
10/23/2013
Agenda
Welcome and Introductions
“Reactive” Risk Management
– Program Update
– Total Cost of Workers’ Compensation Program
“Proactive” Risk Management
– Wellness
– Safety Training
Department Performance
– Montgomery County Fire and Rescue Service
– Montgomery County Police Department
– Department of Correction and Rehabilitation
– Department of Liquor Control
– Department of Transportation
– Department of General Services
Wrap-up

CountyStat
County’s Wellness Initiative
The County hired a Wellness Program Manager in March 2013 to
promote a “culture of health” in the County
Wellness Program Manager has visited bus depots, ECC, fire
stations, and plans to visit DOCR sites this month
– Visits are targeted at non-occupational illnesses prominent in each department:
• DOCR: dealing with stress in a high-risk environment
• DOT-Transit: focus on heart health, diabetes, and neck and back care programs
• FRS: improving cardiovascular health as 42% of on-duty deaths were caused
by sudden cardiac arrest in CY12 (Source: National Fire Protection Association,
2013)
• POL: focus on healthy eating as 57.5% of police have elevated cholesterol
(Source: U. of Buffalo Study)
• ECC: focus on emotional well-being and stress reduction
• EOB/COB employees: awareness program of health benefits to taking the stairs
vs. elevator
13 Workers' Compensation
Update
10/23/2013
CountyStat will examine the wellness initiative further at its 12/11/13 session
CountyStat
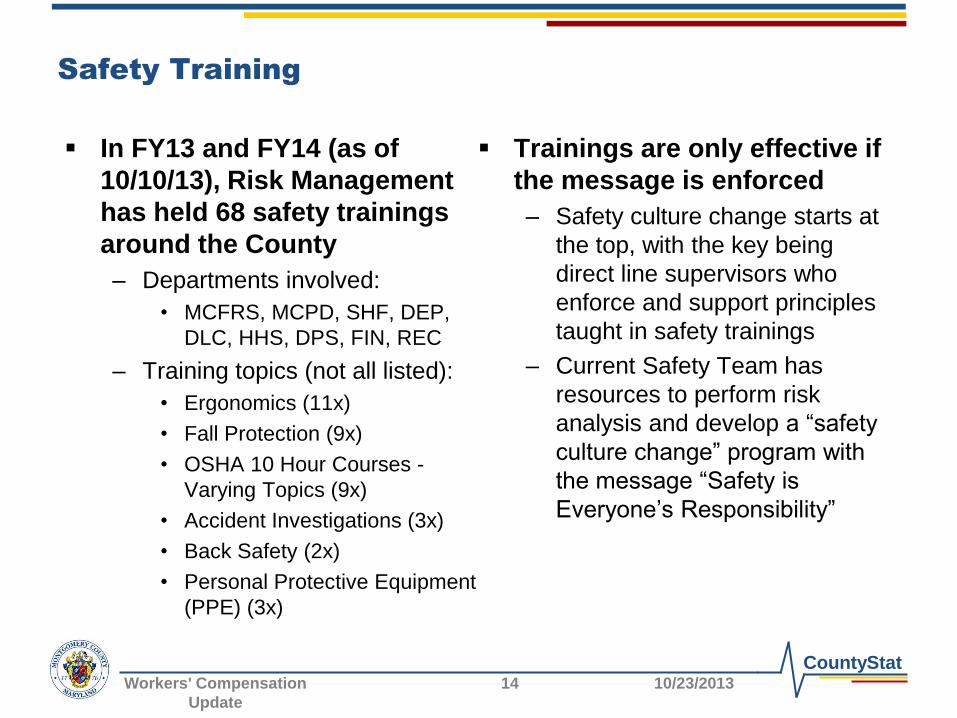
Safety Training
In FY13 and FY14 (as of
10/10/13), Risk Management
has held 68 safety trainings
around the County
– Departments involved:
• MCFRS, MCPD, SHF, DEP,
DLC, HHS, DPS, FIN, REC
– Training topics (not all listed):
• Ergonomics (11x)
• Fall Protection (9x)
• OSHA 10 Hour Courses -
Varying Topics (9x)
• Accident Investigations (3x)
• Back Safety (2x)
• Personal Protective Equipment
(PPE) (3x)
Trainings are only effective if
the message is enforced
– Safety culture change starts at
the top, with the key being
direct line supervisors who
enforce and support principles
taught in safety trainings
– Current Safety Team has
resources to perform risk
analysis and develop a “safety
culture change” program with
the message “Safety is
Everyone’s Responsibility”
14 Workers' Compensation
Update
10/23/2013

CountyStat 15 Workers' Compensation
Update
10/23/2013
Agenda
Welcome and Introductions
“Reactive” Risk Management
“Proactive” Risk Management
Department Performance
– Montgomery County Fire and Rescue Service
– Montgomery County Police Department
– Department of Correction and Rehabilitation
– Department of Liquor Control
– Department of Transportation
– Department of General Services
Wrap-up
Each Dept. Features Data On:
-Cost of WC from FY10-FY13
-Source of Injury
-Nature of Injury
-Body Part Injured
-Age of Injured Worker
-Month Injury Occurred
-Time of Day Injury Occurred

CountyStat
Injury Claims Department Data Trends* (1/2)
16 Workers' Compensation
Update
10/23/2013
Focus on prevention of lower back, shoulder, and knee strains could significantly reduce
workers’ comp claims
*All data are based on the costs incurred on claims made between FY11-FY13
Department % Change in WC
Costs Incurred from
FY10 to FY13
Top 2 Injury
Sources (excluding
“Other”)
Top 2 “Nature of
Injury”
Top 2 Injured Body
Parts
MCFRS 27%
Lifting, Motor Vehicle Strain, Sprain Lower Back,
Shoulder(s)
MCPD 4%
Motor Vehicle, On
Same Level
Strain, Sprain Knee, Shoulder(s)
DOCR 10%
On Stairs, Stationary
Object
Strain, Sprain Lower Back,
Shoulder(s)
DLC 7%
Lifting, Motor Vehicle Strain, Hernia Lower Back, Knee
DOT 41%
Motor Vehicle,
Falling/Flying Object
Strain, Sprain Lower Back,
Shoulder(s)
DOT-Trans 33%
Motor Vehicle,
Twisting
Strain, Sprain Lower Back,
Shoulder(s)
DGS 33%
Motor Vehicle, Lifting Strain, Contusion Shoulder(s), Knee
DGS-Fleet 57%
Motor Vehicle, Lifting Strain, Sprain Shoulder(s), Knee

CountyStat
Injury Claims Department Data Trends (2/2)
Department Trend in Age of Injured
Employee
(Y/N)
Trend in Month of
Injury
(Y/N)
Trend in Time of Day
of Injury
(Y/N)
MCFRS No Yes- August Yes- around 9AM
MCPD Yes- younger No Yes- midday
DOCR No No No
DLC Yes- age 30-39 No Yes- 8AM-1PM
DOT No No Yes- around 9AM
DOT-Trans N/A No Yes- rush hours, mainly
morning
DGS Yes- older No Yes- early morning
DGS-Fleet N/A No No- small trend around
noon
17 Workers' Compensation
Update
10/23/2013
Injuries tend to happen at the early parts of shifts. Reinforcing safe work habits at the
beginning of every shift can help to prevent workplace injuries.

CountyStat 18 Workers' Compensation
Update
10/23/2013
Agenda
Welcome and Introductions
“Reactive” Risk Management
“Proactive” Risk Management
Department Performance
– Montgomery County Fire and Rescue Service
– Montgomery County Police Department
– Department of Correction and Rehabilitation
– Department of Liquor Control
– Department of Transportation
– Department of General Services
Wrap-up
Each Dept. Features Data On:
-Cost of WC from FY10-FY13
-Source of Injury
-Nature of Injury
-Body Part Injured
-Age of Injured Worker
-Month Injury Occurred
-Time of Day Injury Occurred

CountyStat
MCFRS - Total WC Costs Incurred in Fiscal Year
$0.0
$1.0
$2.0
$3.0
$4.0
$5.0
$6.0
FY10 FY11 FY12 FY13
Wo
rkers
’ C
om
p C
ost
(in
millio
ns)
19 Workers' Compensation
Update
10/23/2013
Incurred costs have increased 27% from FY10 to FY13
Source: Risk Management Quarterly Reports. For Claims Occurring during FY

CountyStat
MCFRS - Injuries from FY11-FY13
20 Workers' Compensation
Update
10/23/2013
MCFRS averaged 56 lost time incidents per quarter from FY11Q1 to FY13Q4
0
10
20
30
40
50
60
70
80
20
11
20
12
20
13
Inju
ries p
er
Qu
art
er
Quarters
First Aid Only Lost Time Medical Treatment Record Only
Source: MCFRS Detailed Injury Report

CountyStat
MCFRS - Top Ten Injury Sources from FY11-FY13
21 Workers' Compensation
Update
10/23/2013
Injury Source Total
Injuries
% of All
Injuries
Total Incurred as
of 10/01/13
% of Total
Incurred
Cost
Other 419 24% $4,056,138 19%
Object Being Lifted or Handled 220 13% $4,013,874 19%
Motor Vehicle 103 6% $1,294,976 6%
Fellow Worker; Patient 160 9% $1,178,865 5%
On Same Level 69 4% $847,996 4%
Cumulative, NOC; All Other 29 2% $797,438 4%
On Stairs 37 2% $725,347 3%
Not a Physical Cause of Injury 48 3% $714,283 3%
Stationary Object 70 4% $611,039 3%
From Different Level
(Elevation) 22 1% $544,955 3%
Source: Risk Management Claim Detail Report. Claim status as of 10/01/2013
Focus on proper lifting and handling in MCFRS could lower MCFRS’s workers’ comp rate

CountyStat
MCFRS - Top Ten Nature of Injury from FY11-FY13
22 Workers' Compensation
Update
10/23/2013
Nature of Injury Total
Injuries
% of All
Injuries
Total Incurred as
of 10/01/13
% of Total
Incurred
Cost
Strain 625 36% $9,769,968 45%
Sprain 183 11% $3,698,462 17%
Other 105 6% $1,377,940 6%
Multiple Physical
Injuries 16 1% $1,258,137 6%
Contusion 193 11% $693,237 3%
Hearing Loss or
Impairment 28 2% $590,848 3%
Hernia 11 1% $485,975 2%
Myocardial Infarction 10 1% $436,848 2%
Dislocation 5 0.3% $389,448 2%
Cancer 14 1% $366,871 2%
Sprains and strains made up a plurality of injuries and a majority of costs
Source: Risk Management Claim Detail Report. Claim status as of 10/01/2013

CountyStat
MCFRS - Top Ten Body Parts Injured from FY11-FY13
Body Part Total
Injuries
% of All
Injuries
Total
Incurred as
of 10/01/13
% of Total
Incurred
Cost
Lower Back Area 258 15% $4,240,136 20%
Shoulder(s) 113 7% $3,125,660 14%
Knee 186 11% $3,090,661 14%
Body Systems and Multiple Body 121 7% $1,284,652 6%
Other 27 2% $1,122,109 5%
Ankle 100 6% $859,220 4%
Ear(s) 42 2% $824,962 4%
Heart 42 2% $810,285 4%
Multiple Body Parts 31 2% $632,656 3%
Elbow 45 3% $534,207 2%
23 Workers' Compensation
Update
10/23/2013
New lower back and shoulder injuries from FY11-FY13 accounted for 34% of costs
Source: Risk Management Claim Detail Report. Claim status as of 10/01/2013

CountyStat
MCFRS - Top Ten Injury-Causing “Tasks”
Task Total Injuries % of Injuries
EMS Incident (All) 496 31%
Fire Fighting Incident 236 15%
Physical Fitness (All) 165 10%
Training Activity 155 10%
Other 118 7%
Maintenance of Building or Equipment 80 5%
Moving to/from Location on Foot 70 4%
Multiple Tasks 37 2%
Service Activities (Other) 34 2%
Office Tasks 27 2%
24 Workers' Compensation
Update
10/23/2013
Physical fitness injuries primarily due to academy training and exercise performed at stations
Source: MCFRS Detailed Injury Report

CountyStat
MCFRS - Injuries by Age from FY11-FY13
25 Workers' Compensation
Update
10/23/2013
Sources: Risk Management Claim Detail Report. Claim status as of 10/01/2013
ERP PMR Assignment Module. Demographics as of 06/30/2013
No age group disproportionately represented the number of injury claims
0%
5%
10%
15%
20%
25%
30%
35%
40%
19 or less 20-29 30-39 40-49 50-59 60 or more
Perc
en
t
Age Group
% of MCFRS Claims in Age Group Age Distribution of MCFRS Employees

CountyStat
MCFRS - Injuries by Month (1/2)
26 Workers' Compensation
Update
10/23/2013
All three years saw a spike in injuries during August
Source: MCFRS Detailed Injury Report
0
10
20
30
40
50
60
70
Jul Aug Sep Oct Nov Dec Jan Feb Mar Apr May Jun
Nu
mb
er
of
Inju
ries
Month
FY11
FY12
FY13

CountyStat
MCFRS - Injuries by Month (2/2)
27 Workers' Compensation
Update
10/23/2013
From FY11-FY13, MCFRS saw 75 lost time incidents in August. This was 19 incidents
above the monthly average of 56.
Source: MCFRS Detailed Injury Report
0
20
40
60
80
100
120
140
160
180
200
Jul Aug Sep Oct Nov Dec Jan Feb Mar Apr May Jun
Record Only
Medical Treatment
Lost Time
First Aid Only

CountyStat
MCFRS - Injuries by Time of Day
28 Workers' Compensation
Update
10/23/2013
Source: Risk Management Claim Detail Report. Claim status as of 10/01/2013
0
20
40
60
80
100
120
140
160
180
To
tal N
um
ber
of
Cla
ims f
rom
FY
11
-FY
13
Time of Day
Injury claims for all of FY11-FY13 peaked in the first few hours of the work day

CountyStat 29 Workers' Compensation
Update
10/23/2013
Agenda
Welcome and Introductions
“Reactive” Risk Management
“Proactive” Risk Management
Department Performance
– Montgomery County Fire and Rescue Service
– Montgomery County Police Department
– Department of Correction and Rehabilitation
– Department of Liquor Control
– Department of Transportation
– Department of General Services
Wrap-up
Each Dept. Features Data On:
-Cost of WC from FY10-FY13
-Source of Injury
-Nature of Injury
-Body Part Injured
-Age of Injured Worker
-Month Injury Occurred
-Time of Day Injury Occurred

CountyStat
MCPD – Total WC Costs Incurred in Fiscal Year
$0.0
$0.5
$1.0
$1.5
$2.0
$2.5
$3.0
$3.5
$4.0
FY10 FY11 FY12 FY13
Wo
rkers
’ C
om
p C
ost
(in
millio
ns)
30 Workers' Compensation
Update
10/23/2013
Incurred costs have increased 4% from FY10 to FY13
Source: Risk Management Quarterly Reports. For Claims Occurring during FY

CountyStat
MCPD - Top Ten Injury Sources from FY11-FY13
31 Workers' Compensation
Update
10/23/2013
Injury Source Total
Injuries
% of All
Injuries
Total Incurred as
of 10/01/13
% of Total
Incurred
Cost
Motor Vehicle 186 13% $2,485,073 24%
Other 468 33% $2,047,798 20%
On Same Level 95 7% $819,936 8%
Person in Act of a Crime 102 7% $716,560 7%
Object Being Lifted or Handled 54 4% $569,293 5%
NOC-Strain or Injury By 51 4% $482,258 5%
Twisting 28 2% $418,974 4%
NOC-Fall, Slip, or Trip Injury 21 1% $398,830 4%
Animal or Insect 54 4% $297,322 3%
Not a Physical Cause of Injury 15 1% $220,898 2%
Motor vehicle accidents made up nearly ¼ of all MCPD injuries
Source: Risk Management Claim Detail Report. Claim status as of 10/01/2013

CountyStat
MCPD - Top Ten Nature of Injury from FY11-FY13
32 Workers' Compensation
Update
10/23/2013
Nature of Injury Total Injuries % of All
Injuries
Total Incurred
as of 10/01/13
% of Total
Incurred
Cost
Strain 484 34% $3,987,300 38%
Sprain 134 9% $1,666,329 16%
Contusion 205 15% $1,073,605 10%
Other 77 5% $696,826 7%
Multiple Physical Injuries 39 3% $636,563 6%
Fracture 25 2% $600,489 6%
Laceration 126 9% $390,441 4%
Inflammation 58 4% $343,328 3%
Rupture 3 0.2% $170,667 2%
Concussion 9 1% $163,839 2%
Source: Risk Management Claim Detail Report. Claim status as of 10/01/2013
Strains and sprains comprised 43% of new injuries and 54% of costs for claims made

CountyStat
MCPD - Top Ten Body Parts Injured from FY11-FY13
33 Workers' Compensation
Update
10/23/2013
New knee and shoulder injuries each covered 13% of new claim costs from FY11-FY13
Source: Risk Management Claim Detail Report. Claim status as of 10/01/2013
Body Part Total
Injuries
% of All
Injuries
Total Incurred
as of 10/01/13
% of Total
Incurred
Cost
Knee 171 12% $1,376,103 13%
Shoulder(s) 92 7% $1,311,590 13%
Lower Back Area 134 9% $1,163,002 11%
Multiple Body Parts 70 5% $826,168 8%
Other 24 2% $813,830 8%
Ankle 61 4% $641,162 6%
Hand 114 8% $459,008 4%
Soft Tissue-Neck 46 3% $346,243 3%
Upper Back Area 21 1% $306,828 3%
Multiple Upper
Extremities 25 2% $295,253 3%

CountyStat
MCPD - Injuries by Age from FY11-FY13
34 Workers' Compensation
Update
10/23/2013
Sources: Risk Management Claim Detail Report. Claim status as of 10/01/2013
ERP PMR Assignment Module. Demographics as of 06/30/2013
Injury claims for police skewed slightly towards younger employees
0%
5%
10%
15%
20%
25%
30%
35%
40%
45%
19 or less 20-29 30-39 40-49 50-59 60 or more
Perc
en
t
Age Group
% of MCPD Injuries in Age Group Age Distribution of MCPD Employees

CountyStat
MCPD - Injuries by Month
35 Workers' Compensation
Update
10/23/2013
No discernible pattern appeared between the month of the year and injury claims
Source: Risk Management Claim Detail Report. Claim status as of 10/01/2013
0
10
20
30
40
50
60
Jul Aug Sep Oct Nov Dec Jan Feb Mar Apr May Jun
Nu
mb
er
of
Inju
ries
Month
FY11
FY12
FY13

CountyStat
MCPD - Injuries by Time of Day
36 Workers' Compensation
Update
10/23/2013
Source: Risk Management Claim Detail Report. Claim status as of 10/01/2013
Injury claims for police peaked around midday
0
10
20
30
40
50
60
70
80
90
100
To
tal N
um
ber
of
Cla
ims f
rom
FY
11
-FY
13
Time of Day

CountyStat 37 Workers' Compensation
Update
10/23/2013
Agenda
Welcome and Introductions
“Reactive” Risk Management
“Proactive” Risk Management
Department Performance
– Montgomery County Fire and Rescue Service
– Montgomery County Police Department
– Department of Correction and Rehabilitation
– Department of Liquor Control
– Department of Transportation
– Department of General Services
Wrap-up
Each Dept. Features Data On:
-Cost of WC from FY10-FY13
-Source of Injury
-Nature of Injury
-Body Part Injured
-Age of Injured Worker
-Month Injury Occurred
-Time of Day Injury Occurred

CountyStat
DOCR – Total WC Costs Incurred in Fiscal Year
$0.00
$0.20
$0.40
$0.60
$0.80
$1.00
$1.20
$1.40
FY10 FY11 FY12 FY13
Wo
rke
rs’ C
om
p C
ost
(in
millio
ns)
38 Workers' Compensation
Update
10/23/2013
Incurred costs have increased 10% from FY10 to FY13, but dropped 52% from FY11 peak
Source: Risk Management Quarterly Reports. For Claims Occurring during FY

CountyStat
DOCR - Top Ten Injury Sources from FY11-FY13
39 Workers' Compensation
Update
10/23/2013
Injury Source Total
Injuries
% of All
Injuries
Total Incurred as
of 10/01/13
% of Total
Incurred
Cost
Other 121 34% $1,097,571 29%
On Stairs 12 3% $378,480 10%
Stationary Object 22 6% $267,842 7%
Person in Act of a Crime 18 5% $263,779 7%
On Same Level 24 7% $252,330 7%
Fellow Worker; Patient 12 3% $222,111 6%
Falling or Flying Object 3 1% $126,853 3%
From Liquid or Grease Spills 17 5% $110,147 3%
Collapsing Materials (Slides of
Earth) 1 0.3% $106,992 3%
NOC-Strain or Injury By 12 3% $102,494 3%
Accidents on stairs made up only 3% of claims, but 10% of total incurred costs
Source: Risk Management Claim Detail Report. Claim status as of 10/01/2013

CountyStat
DOCR - Top Ten Nature of Injury from FY11-FY13
40 Workers' Compensation
Update
10/23/2013
Nature of Injury Total Injuries % of All
Injuries
Total
Incurred as
of 10/01/13
% of Total
Incurred
Cost
Strain 116 33% $2,104,137 55%
Sprain 27 8% $669,365 17%
Contusion 93 26% $563,321 15%
Laceration 37 11% $107,096 3%
Multiple Physical Injuries 8 2% $85,325 2%
Other 12 3% $64,628 2%
Inflammation 13 4% $48,617 1%
Myocardial Infarction 1 0.3% $43,910 1%
Angina Pectoris 1 0.3% $39,580 1%
Puncture 10 3% $36,731 1%
Strains and sprains covered 41% of injuries and 72% of incurred costs
Source: Risk Management Claim Detail Report. Claim status as of 10/01/2013

CountyStat
DOCR - Top Ten Body Parts Injured from FY11-FY13
41 Workers' Compensation
Update
10/23/2013
New lower back injury claims comprised of 23% of the new claims cost from FY11-FY13
Source: Risk Management Claim Detail Report. Claim status as of 10/01/2013
Body Part Total Injuries % of All
Injuries
Total
Incurred as
of 10/01/13
% of Total
Incurred
Cost
Lower Back Area 36 10% $893,591 23%
Shoulder(s) 28 8% $682,180 18%
Knee 58 17% $501,507 13%
Ankle 11 3% $326,302 9%
Upper Arm 12 3% $224,768 6%
Other 3 1% $174,559 5%
Hand 29 8% $156,184 4%
Multiple Body Parts 9 3% $121,193 3%
Wrist 11 3% $97,637 3%
Whole Body 1 0.3% $78,304 2%

CountyStat
DOCR - Injuries by Age from FY11-FY13
42 Workers' Compensation
Update
10/23/2013
Sources: Risk Management Claim Detail Report. Claim status as of 10/01/2013
ERP PMR Assignment Module. Demographics as of 06/30/2013
No age group disproportionately represented the number of injury claims
0%
5%
10%
15%
20%
25%
30%
35%
40%
45%
50%
19 or less 20-29 30-39 40-49 50-59 60 or more
Perc
en
t
Age Group
% of DOCR Injuries in Age Group Age Distribution of DOCR Employees

CountyStat
DOCR - Injuries by Month
43 Workers' Compensation
Update
10/23/2013
While a distinct pattern does not exist across all three years, there are noticeable peaks
in every year. FY11 saw the largest peak in July with over 20 reported injuries.
Source: Risk Management Claim Detail Report. Claim status as of 10/01/2013
0
5
10
15
20
25
Jul Aug Sep Oct Nov Dec Jan Feb Mar Apr May Jun
Nu
mb
er
of
Inju
ries
Month
FY11
FY12
FY13

CountyStat
DOCR - Injuries by Time of Day
44 Workers' Compensation
Update
10/23/2013
Source: Risk Management Claim Detail Report. Claim status as of 10/01/2013
Injury claims were spread fairly evenly throughout the day
0
5
10
15
20
25
30
35
To
tal N
um
ber
of
Cla
ims f
rom
FY
11
-FY
13
Time of Day

CountyStat 45 Workers' Compensation
Update
10/23/2013
Agenda
Welcome and Introductions
“Reactive” Risk Management
“Proactive” Risk Management
Department Performance
– Montgomery County Fire and Rescue Service
– Montgomery County Police Department
– Department of Correction and Rehabilitation
– Department of Liquor Control
– Department of Transportation
– Department of General Services
Wrap-up
Each Dept. Features Data On:
-Cost of WC from FY10-FY13
-Source of Injury
-Nature of Injury
-Body Part Injured
-Age of Injured Worker
-Month Injury Occurred
-Time of Day Injury Occurred

CountyStat
DLC – Total WC Costs Incurred in Fiscal Year
$0
$5
$10
$15
$20
$25
$30
$35
$40
$45
FY10 FY11 FY12 FY13
Wo
rkers
’ C
om
p C
ost
x $
10
,00
0
46 Workers' Compensation
Update
10/23/2013
Incurred costs have decreased 7% from FY10 to FY13
Source: Risk Management Quarterly Reports. For Claims Occurring during FY

CountyStat
DLC - Top Ten Injury Sources from FY11-FY13
47 Workers' Compensation
Update
10/23/2013
Injury Source Total
Injuries
% of All
Injuries
Total Incurred as
of 10/01/13
% of Total
Incurred
Cost
Object Being Lifted or Handled 29 16% $285,366 31%
Other 70 39% $179,277 19%
Motor Vehicle 9 5% $74,886 8%
Pushing or Pulling 4 2% $72,618 8%
NOC-Fall, Slip, or Trip Injury 3 2% $48,957 5%
NOC-Struck or Injured By 2 1% $36,954 4%
Falling or Flying Object 5 3% $34,526 4%
Reaching 4 2% $30,795 3%
Motor Vehicle 3 2% $30,611 3%
Repetitive Motion Carpal
Tunnel 1 1% $25,296 3%
More attention on safe lifting techniques could lower DLC’s workers’ comp claims
Source: Risk Management Claim Detail Report. Claim status as of 10/01/2013

CountyStat
DLC - Top Ten Nature of Injury from FY11-FY13
48 Workers' Compensation
Update
10/23/2013
Nature of Injury Total Injuries % of All
Injuries
Total
Incurred as
of 10/01/13
% of Total
Incurred
Cost
Strain 97 54% $616,185 67%
Hernia 2 1% $108,647 12%
Fracture 6 3% $65,730 7%
Sprain 16 9% $65,585 7%
Carpal Tunnel Syndrome 1 1% $25,296 3%
Contusion 30 17% $22,465 2%
Concussion 1 1% $8,500 1%
Laceration 11 6% $4,076 0.4%
Multiple Physical Injuries 1 1% $1,872 0.2%
Other 3 2% $1,750 0.2%
Strains made up a majority of new injuries and incurred costs from FY11-FY13
Source: Risk Management Claim Detail Report. Claim status as of 10/01/2013
CountyStat
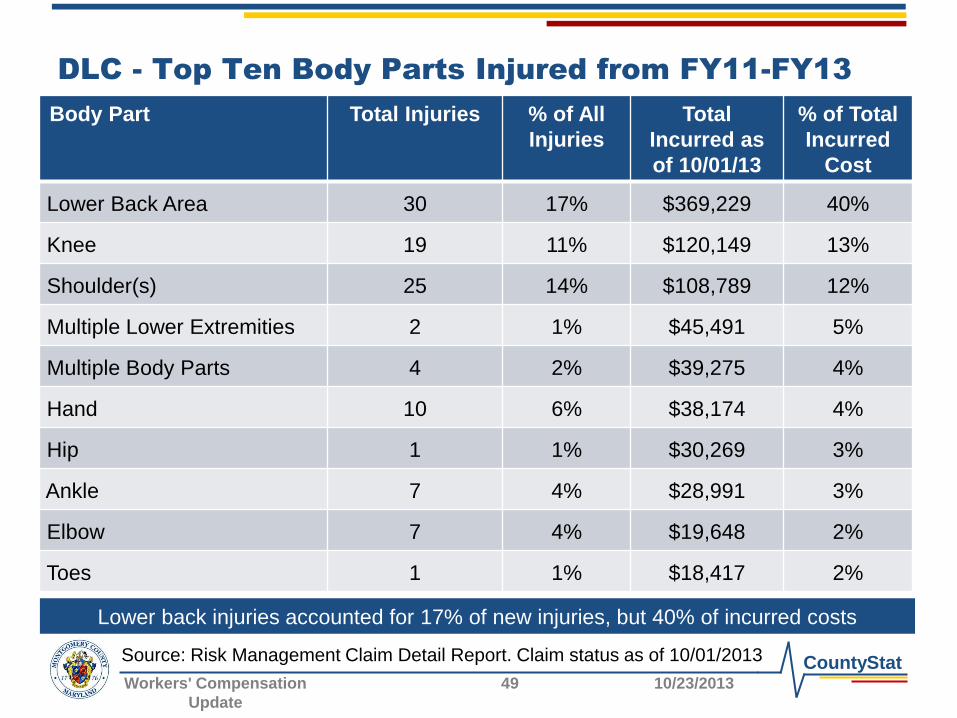
DLC - Top Ten Body Parts Injured from FY11-FY13
49 Workers' Compensation
Update
10/23/2013
Lower back injuries accounted for 17% of new injuries, but 40% of incurred costs
Source: Risk Management Claim Detail Report. Claim status as of 10/01/2013
Body Part Total Injuries % of All
Injuries
Total
Incurred as
of 10/01/13
% of Total
Incurred
Cost
Lower Back Area 30 17% $369,229 40%
Knee 19 11% $120,149 13%
Shoulder(s) 25 14% $108,789 12%
Multiple Lower Extremities 2 1% $45,491 5%
Multiple Body Parts 4 2% $39,275 4%
Hand 10 6% $38,174 4%
Hip 1 1% $30,269 3%
Ankle 7 4% $28,991 3%
Elbow 7 4% $19,648 2%
Toes 1 1% $18,417 2%

CountyStat
DLC - Injuries by Age from FY11-FY13
50 Workers' Compensation
Update
10/23/2013
Sources: Risk Management Claim Detail Report. Claim status as of 10/01/2013
ERP PMR Assignment Module. Demographics as of 06/30/2013
The 30-39 age group accounted for the most injuries of any age group
0%
5%
10%
15%
20%
25%
30%
35%
40%
19 or less 20-29 30-39 40-49 50-59 60 or more
Perc
en
t
Age Group
% of DOCR injuries in age group Age Distribution of DOCR Employees

CountyStat
DLC - Injuries by Month
51 Workers' Compensation
Update
10/23/2013
Source: Risk Management Claim Detail Report. Claim status as of 10/01/2013
While a distinct pattern does not exist across all three years, there are noticeable peaks
in every year. FY13 saw the largest peak in March with 10 reported injuries.
0
2
4
6
8
10
12
Jul Aug Sep Oct Nov Dec Jan Feb Mar Apr May Jun
Nu
mb
er
of
Inju
ries
Month
FY11
FY12
FY13

CountyStat
DLC - Injuries by Time of Day
52 Workers' Compensation
Update
10/23/2013
Source: Risk Management Claim Detail Report. Claim status as of 10/01/2013
61% of new injury claims in FY11-FY13 came between 8AM and 12:59PM
0
5
10
15
20
25
30
To
tal N
um
ber
of
Cla
ims f
rom
FY
11
-FY
13
Time of Day

CountyStat 53 Workers' Compensation
Update
10/23/2013
Agenda
Welcome and Introductions
“Reactive” Risk Management
“Proactive” Risk Management
Department Performance
– Montgomery County Fire and Rescue Service
– Montgomery County Police Department
– Department of Correction and Rehabilitation
– Department of Liquor Control
– Department of Transportation
– Department of General Services
Wrap-up
Each Dept. Features Data On:
-Cost of WC from FY10-FY13
-Source of Injury
-Nature of Injury
-Body Part Injured
-Age of Injured Worker
-Month Injury Occurred
-Time of Day Injury Occurred

CountyStat
DOT – Total WC Costs Incurred in Fiscal Year
$0
$20
$40
$60
$80
$100
$120
$140
$160
$180
FY10 FY11 FY12 FY13
Wo
rkers
’ C
om
p C
ost
x $
10
,00
0
DOT Transit DOT Other DOT All
54 Workers' Compensation
Update
10/23/2013
Incurred Costs have decreased 41% from FY10 to FY13
Transit 66%
DOT Other 34%
Source: Risk Management Quarterly Reports. For Claims Occurring during FY

CountyStat
DOT - Top Ten Injury Sources from FY11-FY13
55 Workers' Compensation
Update
10/23/2013
Injury Source Total
Injuries
% of All
Injuries
Total Incurred as
of 10/01/13
% of Total
Incurred
Cost
Motor Vehicle 162 29% $1,927,153 39%
Other 123 22% $683,796 14%
Object Being Lifted or
Handled 40 7% $415,666 8%
Falling or Flying Object 5 1% $367,637 7%
Twisting 8 1% $307,542 6%
On Ice or Snow 5 1% $182,275 4%
NOC-Fall, Slip, or Trip Injury 9 2% $123,554 2%
NOC-Strain or Injury By 17 3% $119,338 2%
Pushing or Pulling 4 1% $105,102 2%
On Same Level 24 4% $92,544 2%
A plurality of all accidents were caused by motor vehicles
Source: Risk Management Claim Detail Report. Claim status as of 10/01/2013

CountyStat
DOT Transit - Top Ten Injury Sources from FY11-FY13
56 Workers' Compensation
Update
10/23/2013
Injury Source Total
Injuries
% of All
Injuries
Total Incurred as
of 10/01/13
% of Total
Incurred
Cost
Motor Vehicle 136 40% $1,712,948 53%
Other 62 18% $437,447 14%
Twisting 7 2% $261,360 8%
Object Being Lifted or
Handled 17 5% $192,190 6%
NOC-Strain or Injury By 12 4% $94,446 3%
On Ice or Snow 4 1% $83,534 3%
NOC-Struck or Injured By 5 1% $67,598 2%
Pushing or Pulling 1 0.3% $55,596 2%
Stationary Object 7 2% $51,741 2%
Repetitive Motion Carpal
Tunnel 1 0.3% $45,800 1%
A majority of incurred costs are the result of motor vehicle accidents
Source: Risk Management Claim Detail Report. Claim status as of 10/01/2013

CountyStat
DOT - Top Ten Nature of Injury from FY11-FY13
57 Workers' Compensation
Update
10/23/2013
Nature of Injury Total
Injuries
% of All
Injuries
Total
Incurred as
of 10/01/13
% of Total
Incurred
Cost
Strain 224 40% $2,121,481 43%
Sprain 68 12% $1,202,739 24%
Multiple Physical Injuries 12 2% $335,906 7%
Other 27 5% $332,675 7%
Contusion 61 11% $265,626 5%
Fracture 9 2% $177,494 4%
Laceration 55 10% $128,350 3%
Inflammation 18 3% $117,155 2%
No Physical Injury 17 3% $98,822 2%
Carpal Tunnel Syndrome 1 0.2% $45,800 1%
Strains and sprains made up 52% of new injuries and 67% of the total cost
Source: Risk Management Claim Detail Report. Claim status as of 10/01/2013

CountyStat
DOT Transit - Ten Nature of Injury from FY11-FY13
58 Workers' Compensation
Update
10/23/2013
Nature of Injury Total Injuries % of All
Injuries
Total
Incurred as
of 10/01/13
% of Total
Incurred
Cost
Strain 147 44% $1,523,729 47%
Sprain 41 12% $672,867 21%
Multiple Physical Injuries 8 2% $274,044 8%
Contusion 34 10% $146,051 5%
Other 17 5% $138,620 4%
Inflammation 10 3% $99,532 3%
No Physical Injury 13 4% $98,704 3%
Fracture 5 1% $78,613 2%
Carpal Tunnel Syndrome 1 0.3% $45,800 1%
Laceration 25 7% $43,512 1%
64% of all DOT strain and sprain injuries came from Transit
Source: Risk Management Claim Detail Report. Claim status as of 10/01/2013

CountyStat
DOT - Top Ten Body Parts Injured from FY11-FY13
59 Workers' Compensation
Update
10/23/2013
Lower back injuries have been a focus of the new wellness outreach program
Source: Risk Management Claim Detail Report. Claim status as of 10/01/2013
Body Part Total Injuries % of All
Injuries
Total
Incurred as
of 10/01/13
% of Total
Incurred
Cost
Lower Back Area 104 19% $1,144,828 23%
Shoulder(s) 48 9% $726,313 15%
Multiple Body Parts 32 6% $456,445 9%
Knee 48 9% $372,666 7%
Lumbar and/or Sacral
Vertebrae 3 1% $352,538 7%
Soft Tissue-Neck 27 5% $303,015 6%
Other 11 2% $268,802 5%
Ankle 19 3% $144,106 3%
Upper Leg 22 4% $141,943 3%
No Physical Injury 11 2% $135,562 3%

CountyStat
DOT Transit - Ten Body Parts Injured from FY11-FY13
60 Workers' Compensation
Update
10/23/2013
68% of all lower back area injuries in DOT were from Transit
Source: Risk Management Claim Detail Report. Claim status as of 10/01/2013
Body Part Total
Injuries
% of All
Injuries
Total
Incurred as
of 10/01/13
% of Total
Incurred
Cost
Lower Back Area 71 21% $819,382 25%
Shoulder(s) 31 9% $497,098 15%
Multiple Body Parts 21 6% $383,392 12%
Soft Tissue-Neck 20 6% $298,731 9%
Other 9 3% $175,537 5%
No Physical Injury 10 3% $135,444 4%
Ankle 11 3% $117,827 4%
Knee 20 6% $95,101 3%
Wrist 6 2% $83,481 3%
Upper Back Area 8 2% $81,663 3%

CountyStat
DOT - Injuries by Age from FY11-FY13
61 Workers' Compensation
Update
10/23/2013
Sources: Risk Management Claim Detail Report. Claim status as of 10/01/2013
ERP PMR Assignment Module. Demographics as of 06/30/2013
No age group disproportionately represents the number of injury claims
0%
5%
10%
15%
20%
25%
30%
35%
40%
19 or less 20-29 30-39 40-49 50-59 60 or more
Perc
en
t
Age Group
% of DOT injuries in age group Age Distribution of DOT Employees
CountyStat
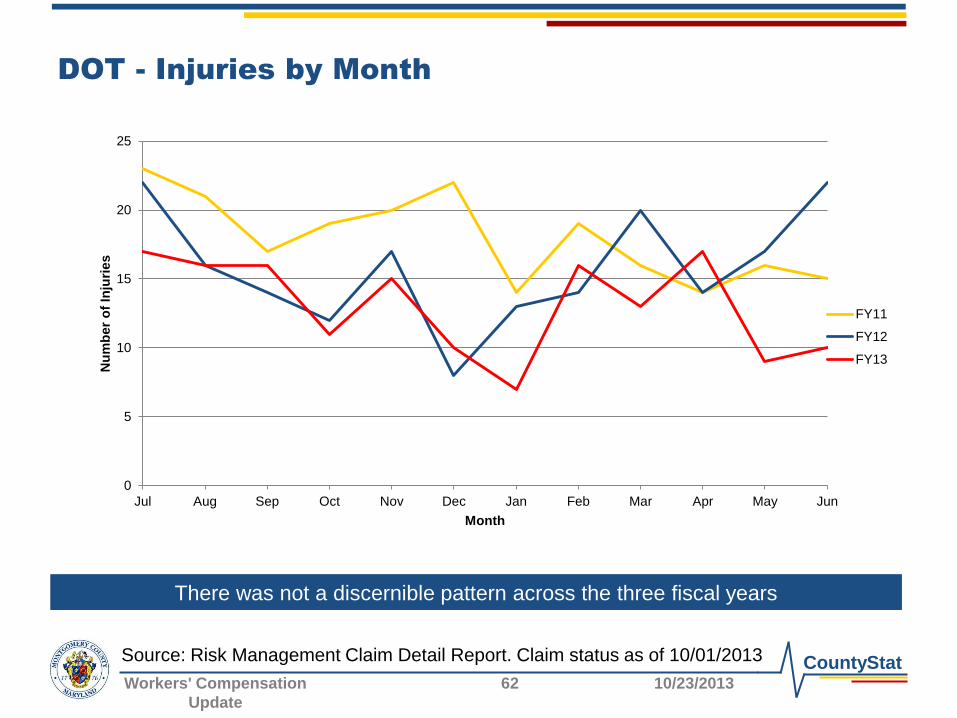
DOT - Injuries by Month
62 Workers' Compensation
Update
10/23/2013
Source: Risk Management Claim Detail Report. Claim status as of 10/01/2013
There was not a discernible pattern across the three fiscal years
0
5
10
15
20
25
Jul Aug Sep Oct Nov Dec Jan Feb Mar Apr May Jun
Nu
mb
er
of
Inju
ries
Month
FY11
FY12
FY13

CountyStat
DOT Transit - Injuries by Month
63 Workers' Compensation
Update
10/23/2013
Source: Risk Management Claim Detail Report. Claim status as of 10/01/2013
While a distinct pattern does not exist across all three years, there are noticeable peaks
in every year. FY12 saw the largest peak in July with 16 reported injuries.
0
2
4
6
8
10
12
14
16
18
Jul Aug Sep Oct Nov Dec Jan Feb Mar Apr May Jun
Nu
mb
er
of
Inju
ries
Month
FY11
FY12
FY13

CountyStat
DOT - Injuries by Time of Day
64 Workers' Compensation
Update
10/23/2013
Source: Risk Management Claim Detail Report. Claim status as of 10/01/2013
0
10
20
30
40
50
60
70
To
tal N
um
ber
of
Cla
ims f
rom
FY
11
-FY
13
Time of Day
45% of all injury claims in FY11, FY12, and FY13 occurred between 7:00AM-11:59AM

CountyStat
DOT Transit - Injuries by Time of Day
65 Workers' Compensation
Update
10/23/2013
Source: Risk Management Claim Detail Report. Claim status as of 10/01/2013
Injuries in Transit over the three year period peaked around the morning and afternoon
commute. 50% of all accidents occurred from 5AM to 12:59PM
0
5
10
15
20
25
30
35
To
tal N
um
ber
of
Cla
ims f
rom
FY
11
-FY
13
Time of Day

CountyStat 66 Workers' Compensation
Update
10/23/2013
Agenda
Welcome and Introductions
“Reactive” Risk Management
“Proactive” Risk Management
Department Performance
– Montgomery County Fire and Rescue Service
– Montgomery County Police Department
– Department of Correction and Rehabilitation
– Department of Liquor Control
– Department of Transportation
– Department of General Services
Wrap-up
Each Dept. Features Data On:
-Cost of WC from FY10-FY13
-Source of Injury
-Nature of Injury
-Body Part Injured
-Age of Injured Worker
-Month Injury Occurred
-Time of Day Injury Occurred

CountyStat
DGS – Total WC Costs Incurred in Fiscal Year
$0
$10
$20
$30
$40
$50
$60
FY10 FY11 FY12 FY13
Wo
rkers
’ C
om
p C
ost
x $
10
,00
0
DGS-Fleet DGS Other DGS All
67 Workers' Compensation
Update
10/23/2013
Incurred costs have decreased 34% from FY10 to FY13
Fleet 81%
DGS Other 19%
Source: Risk Management Quarterly Reports. For Claims Occurring during FY

CountyStat
DGS - Top Ten Injury Sources from FY11-FY13
68 Workers' Compensation
Update
10/23/2013
Injury Source Total
Injuries
% of All
Injuries
Total Incurred
as of 10/01/13
% of Total
Incurred Cost
Motor Vehicle 27 13% $359,866 29%
Object Being Lifted or Handled 32 16% $254,302 20%
Other 48 24% $204,151 16%
On Same Level 3 1% $88,498 7%
Twisting 5 2% $54,017 4%
Pushing or Pulling 3 1% $43,765 4%
NOC-Strain or Injury By 9 4% $39,751 3%
From Different Level (Elevation) 4 2% $36,830 3%
NOC-Cut, Puncture, Scrape—
Injured By 6 3% $36,276 3%
Moving Part of Machine 1 0.5% $34,163 3%
A plurality of injuries were caused by motor vehicles
Source: Risk Management Claim Detail Report. Claim status as of 10/01/2013

CountyStat
DGS Fleet - Top Ten Injury Sources from FY11-FY13
69 Workers' Compensation
Update
10/23/2013
Injury Source Total
Injuries
% of All
Injuries
Total Incurred as
of 10/01/13
% of Total
Incurred
Cost
Motor Vehicle 24 14% $358,292 36%
Object Being Lifted or Handled 25 15% $232,952 23%
Other 41 24% $180,269 18%
Twisting 4 2% $48,887 5%
Pushing or Pulling 3 2% $43,765 4%
NOC-Strain or Injury By 7 4% $39,581 4%
From Different Level (Elevation) 3 2% $36,450 4%
Stationary Object 12 7% $29,379 3%
From Ladder or Scaffolding 2 1% $18,356 2%
Machine or Machinery 12 7% $5,462 1%
Source: Risk Management Claim Detail Report. Claim status as of 10/01/2013
A plurality of injuries were caused by motor vehicles

CountyStat
DGS - Top Ten Nature of Injury from FY11-FY13
70 Workers' Compensation
Update
10/23/2013
Nature of Injury Total
Injuries
% of All
Injuries
Total
Incurred as
of 10/01/13
% of Total
Incurred
Cost
Strain 74 37% $763,462 61%
Contusion 36 18% $149,760 12%
Sprain 14 7% $145,723 12%
Laceration 34 17% $99,699 8%
Inflammation 12 6% $38,574 3%
Other 5 2% $24,958 2%
Fracture 4 2% $10,310 1%
Crushing 5 2% $5,063 0.4%
Foreign Body 6 3% $2,745 0.2%
Burn 3 1% $2,375 0.2%
The majority of incurred costs for new claims in FY11-FY13 are caused by strains
Source: Risk Management Claim Detail Report. Claim status as of 10/01/2013

CountyStat
DGS Fleet - Ten Nature of Injury from FY11-FY13
71 Workers' Compensation
Update
10/23/2013
Nature of Injury Total
Injuries
% of All
Injuries
Total
Incurred as
of 10/01/13
% of Total
Incurred
Cost
Strain 61 36% 651,608 65%
Sprain 11 7% 138,379 14%
Contusion 32 19% 132,621 13%
Inflammation 11 7% 30,874 3%
Other 5 3% 24,958 2%
Laceration 27 16% 13,614 1%
Fracture 2 1% 9,042 0.9%
Foreign Body 5 3% 2,745 0.3%
Burn 3 2% 2,375 0.2%
Concussion 1 1% 1,088 0.1%
Source: Risk Management Claim Detail Report. Claim status as of 10/01/2013
The majority of incurred costs for new claims in FY11-FY13 are caused by strains

CountyStat
DGS - Top Ten Body Parts Injured from FY11-FY13
72 Workers' Compensation
Update
10/23/2013
Hand and finger injuries are more prominent in DGS than other departments
Source: Risk Management Claim Detail Report. Claim status as of 10/01/2013
Body Part Total Injuries % of All
Injuries
Total
Incurred as
of 10/01/13
% of Total
Incurred
Cost
Shoulder(s) 25 12% $560,192 45%
Knee 20 10% $111,904 9%
Hand 13 6% $90,947 7%
Upper Arm 4 2% $87,824 7%
Lower Back Area 21 10% $80,477 6%
Wrist 7 3% $69,068 6%
Finger(s) 31 15% $55,158 4%
Other 1 0.5% $39,324 3%
Facial Bones 10 5% $36,900 3%
Multiple Body Parts 3 1% $24,658 2%

CountyStat
DGS-Fleet Ten Body Parts Injured from FY11-FY13
73 Workers' Compensation
Update
10/23/2013
Source: Risk Management Claim Detail Report. Claim status as of 10/01/2013
Body Part Total
Injuries
% of All
Injuries
Total
Incurred as
of 10/01/13
% of Total
Incurred
Cost
Shoulder(s) 23 14% $558,986 55%
Knee 18 11% $111,904 11%
Lower Back Area 19 11% $80,162 8%
Wrist 5 3% $52,066 5%
Other 1 1% $39,324 4%
Hand 10 6% $38,125 4%
Finger(s) 27 16% $35,160 3%
Multiple Body Parts 2 1% $24,650 2%
Chest 2 1% $21,231 2%
Thumb 6 4% $18,231 2%
Shoulder injuries encompassed 14% of injuries, but a majority of incurred costs

CountyStat
DGS - Injuries by Age from FY11-FY13
74 Workers' Compensation
Update
10/23/2013
Sources: Risk Management Claim Detail Report. Claim status as of 10/01/2013
ERP PMR Assignment Module. Demographics as of 06/30/2013
20-29 year olds make up 10% of the department, but only 1% of injury claims
0%
5%
10%
15%
20%
25%
30%
35%
40%
19 or less 20-29 30-39 40-49 50-59 60 or more
Perc
en
t
Age Group
% of DGS injuries in age group Age Distribution of DGS Employees

CountyStat
DGS - Injuries by Month
75 Workers' Compensation
Update
10/23/2013
Source: Risk Management Claim Detail Report. Claim status as of 10/01/2013
There was not a discernible pattern across the three fiscal years
0
1
2
3
4
5
6
7
8
9
10
Jul Aug Sep Oct Nov Dec Jan Feb Mar Apr May Jun
Nu
mb
er
of
Inju
ries
Month
FY11
FY12
FY13

CountyStat
DGS Fleet - Injuries by Month
76 Workers' Compensation
Update
10/23/2013
Source: Risk Management Claim Detail Report. Claim status as of 10/01/2013
There was not a discernible pattern across the three fiscal years
0
1
2
3
4
5
6
7
8
9
Jul Aug Sep Oct Nov Dec Jan Feb Mar Apr May Jun
Nu
mb
er
of
Inju
ries
Month
FY11
FY12
FY13

CountyStat
DGS - Injuries by Time of Day
77 Workers' Compensation
Update
10/23/2013
Source: Risk Management Claim Detail Report. Claim status as of 10/01/2013
Injuries claims escalated between 5AM and 11:59AM, accounting for 40% of all injuries
0
5
10
15
20
25
To
tal N
um
ber
of
Cla
ims f
rom
FY
11
-FY
13
Time of Day

CountyStat
DGS Fleet - Transit Injuries by Time of Day
78 Workers' Compensation
Update
10/23/2013
Source: Risk Management Claim Detail Report. Claim status as of 10/01/2013
Injury claims peak around noon, but are spread across the day fairly evenly.
10AM-2:59PM comprise 35% of all injury claims
0
2
4
6
8
10
12
14
16
18
To
tal N
um
ber
of
Cla
ims f
rom
FY
11
-FY
13
Time of Day

CountyStat 79 Workers' Compensation
Update
10/23/2013
Wrap-Up
CountyStat would like to thank the
following people for their time
compiling data and information for
this meeting:
Risk Management:
– Pam Schroeder
– Lissa Bales
– Fred Enos
FRS:
– Mike Nelson, Safety Section
– Tony Coleman, FROMS
– Mike Glazier, FROMS
– Dr. Jill Captain, FROMS
OHR:
– Brenda Salas, WPM
– Belinda Fulco

CountyStat 80 Workers' Compensation
Update
10/23/2013
Wrap-Up
Follow-up items