risk management - dbs group · to facilitate the brmc’s risk oversight, the following risk...
TRANSCRIPT
| 77
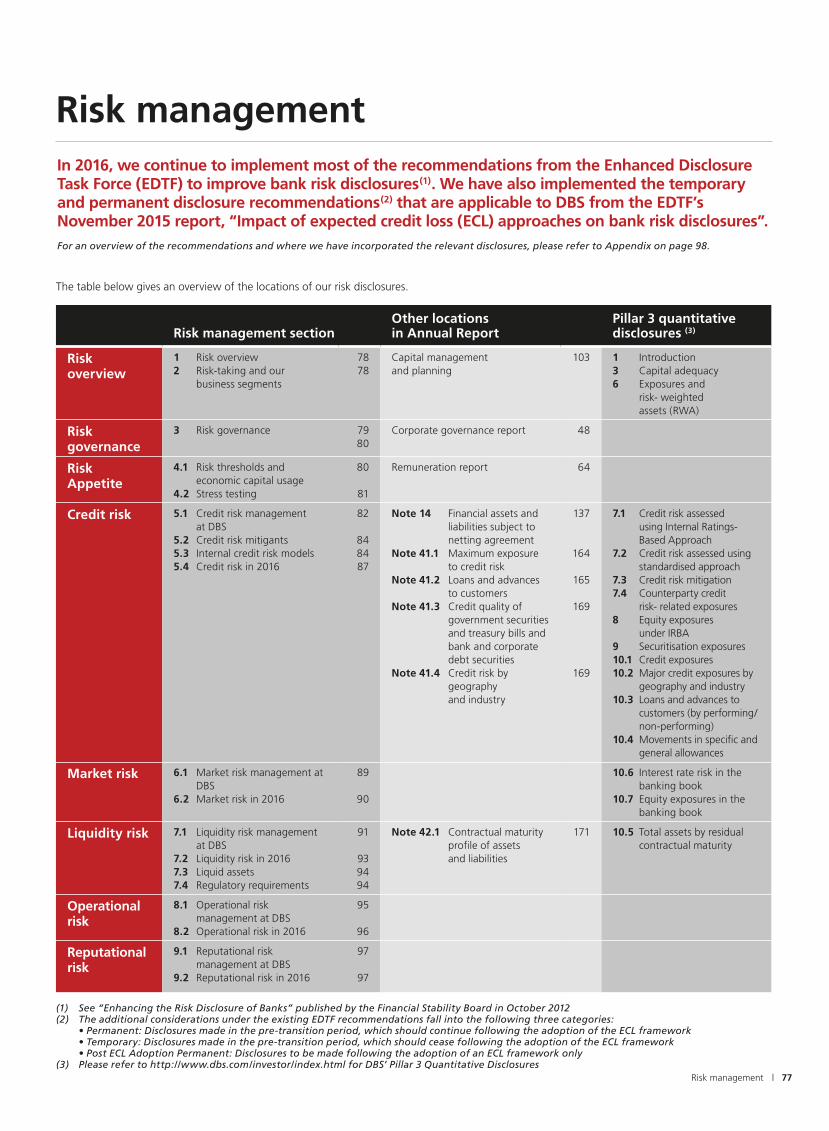
The table below gives an overview of the locations of our risk disclosures.
Risk management
Risk management sectionOther locations in Annual Report
Pillar 3 quantitative disclosures (3)
Risk overview
1 Risk overview2 Risk-taking and our
business segments
7878
Capital management and planning
103 1 Introduction3 Capital adequacy6 Exposures and
risk- weighted assets (RWA)
Risk governance
3 Risk governance 7980
Corporate governance report 48
Risk Appetite
4.1 Risk thresholds and economic capital usage
4.2 Stress testing
80
81
Remuneration report 64
Credit risk 5.1 Credit risk management at DBS
5.2 Credit risk mitigants5.3 Internal credit risk models5.4 Credit risk in 2016
82
848487
Note 14 Financial assets and liabilities subject to netting agreement
Note 41.1 Maximum exposure to credit risk
Note 41.2 Loans and advances to customers
Note 41.3 Credit quality of government securities and treasury bills and bank and corporate debt securities
Note 41.4 Credit risk by geography and industry
137
164
165
169
169
7.1 Credit risk assessed using Internal Ratings-Based Approach
7.2 Credit risk assessed using standardised approach
7.3 Credit risk mitigation7.4 Counterparty credit
risk- related exposures8 Equity exposures
under IRBA9 Securitisation exposures10.1 Credit exposures10.2 Major credit exposures by
geography and industry10.3 Loans and advances to
customers (by performing/ non-performing)
10.4 Movements in specific and general allowances
Market risk 6.1 Market risk management at DBS
6.2 Market risk in 2016
89
90
10.6 Interest rate risk in the banking book
10.7 Equity exposures in the banking book
Liquidity risk 7.1 Liquidity risk management at DBS
7.2 Liquidity risk in 20167.3 Liquid assets7.4 Regulatory requirements
91
939494
Note 42.1 Contractual maturity profile of assets and liabilities
171 10.5 Total assets by residual contractual maturity
Operational risk
8.1 Operational risk management at DBS
8.2 Operational risk in 2016
95
96
Reputational risk
9.1 Reputational risk management at DBS
9.2 Reputational risk in 2016
97
97
(1) See “Enhancing the Risk Disclosure of Banks” published by the Financial Stability Board in October 2012(2) The additional considerations under the existing EDTF recommendations fall into the following three categories: • Permanent: Disclosures made in the pre-transition period, which should continue following the adoption of the ECL framework • Temporary: Disclosures made in the pre-transition period, which should cease following the adoption of the ECL framework • Post ECL Adoption Permanent: Disclosures to be made following the adoption of an ECL framework only(3) Please refer to http://www.dbs.com/investor/index.html for DBS’ Pillar 3 Quantitative Disclosures
Risk management
In 2016, we continue to implement most of the recommendations from the Enhanced Disclosure Task Force (EDTF) to improve bank risk disclosures(1). We have also implemented the temporary and permanent disclosure recommendations(2) that are applicable to DBS from the EDTF’s November 2015 report, “Impact of expected credit loss (ECL) approaches on bank risk disclosures”.For an overview of the recommendations and where we have incorporated the relevant disclosures, please refer to Appendix on page 98.

78 | DBS Annual Report 2016
1 Risk overview Business and strategic riskAn overarching risk arising from adverse business and economic changes materially affecting DBS’ long-term objectives. This risk is managed separately under other governance processes.
Please refer to page 28 for our material matters.
Credit risk (page 82)A risk arising from borrowers or counterparties failing to meet their debt or contractual obligations.
The sections marked by a grey line in the left margin form part of the Group’s audited financial statements
2 Risk-taking and our business segments
Because we focus on Asia’s markets, we are exposed to concentration risks within the region. We manage these risks by engaging in industry diversification and overseeing individual exposures. In addition, DBS uses the specialist knowledge we have of our regional
markets and industry segments to effectively assess our risks.
As a commercial bank, DBS allocates more economic capital to our Institutional Banking and Consumer Banking business segments, as compared to Treasury. A buffer is also maintained for other risks as well, including country risk, operational risk, reputational risk and model risk.
The chart below provides an overview of the risks arising from our business segments. The asset size of each business segment reflects its contribution to the balance sheet, and the risk-weighted assets (RWA) refer to the amount of risk incurred.
Please refer to Note 44 to the financial statements on page 174 for more information about DBS’ business segments.
Market risk (page 89)A risk arising from adverse changes in interest rates, foreign exchange rates, equity prices, credit spreads and commodity prices, as well as related factors.
Liquidity risk (page 91)A risk that arises if DBS is unable to meet our obligations when they are due.
Operational risk (page 95)A risk arising from inadequate internal processes, people or systems, as well as external events. This includes legal risk, and excludes strategic and reputational risk.
Reputational risk (page 97)A risk that arises if our shareholder value (including earnings and capital) is adversely affected by any negative stakeholder perception of DBS’ image. This influences our ability to establish new relationships or services, continue servicing existing relationships, and have continued access to sources of funding. Reputational risk usually occurs when the other risks are poorly managed.
(a) Encompasses assets/RWA from capital and balance sheet management, funding and liquidity activities, DBS Vickers Group and The Islamic Bank of Asia Limited
(b) Before goodwill and intangibles
Consumer Banking/ Wealth Management
Institutional Banking Treasury Others(a) Total
SGD m
Assets(b) 96,405 231,929 102,701 45,418 476,453
Risk-weighted assets 34,609 171,280 51,776 20,953 278,618
% of RWA
Credit risk 84% 94% 40% 71% 81%
Market risk 0% 0% 56% 24% 12%
Operational risk 16% 6% 4% 5% 7%

| 79Risk management
3 Risk governance
The Board oversees DBS’ affairs and provides sound leadership for the CEO and management. Authorised by the Board, various Board committees oversee specific responsibilities based on clearly defined terms of reference.
Under our risk management frameworks, the Board, through the Board Risk Management Committee (BRMC), sets our Risk Appetite, oversees the establishment of enterprise-wide risk management policies and processes, and sets risk limits to guide DBS’ risk-taking.
Note: The lines reflect possible escalation protocols and are not reporting lines per se
Group Board
Board of Directors
Board Executive Committee
Board Audit Committee
Nominating Committee
Compensation and Management Development Committee
Board Risk Management Committee
Group Management
Group CEO
Group Executive Committee
Group Management Committee
Group Asset and Liability Committee
Group Capital Committee
Group Disclosure Committee
Fair Dealing Committee
Group Human Capital Committee
Risk Executive Committee
Product Approval Committee
Group Credit Risk Models Committee
Group Credit Policy Committee
Group Scenario and Stress Testing Committee
Group Credit Risk Committee
Group Market and Liquidity Risk Committee
Group Operational Risk Committee
Group Management
Location Board/Board Committees
Location Management Committees
Location Risk Committees
Business Control Committees

80 | DBS Annual Report 2016
The BRMC oversees the identification, monitoring, management and reporting of credit, market, liquidity, operational and reputational risks. To facilitate the BRMC’s risk oversight, the following risk management committees have been established.
Risk management committees
Risk Executive Committee (Risk ExCo) As the overall executive body regarding risk matters, the Risk ExCo oversees DBS’ risk management as a whole.
Product Approval Committee (PAC) The PAC oversees new product approvals, which are vital for mitigating risk within DBS.
Group Credit Risk Models Committee (GCRMC) Group Credit Policy Committee (GCPC) Group Scenario and Stress Testing Committee (GSSTC) Group Credit Risk Committee (GCRC) Group Market and Liquidity Risk Committee (GMLRC) Group Operational Risk Committee (GORC)
Each committee reports to the Risk ExCo, and the committees as a whole serve as an executive forum to discuss and implement DBS’ risk management.
Key responsibilities:• Assess and approve risk-taking activities• Oversee DBS’ risk management infrastructure, which includes
frameworks, decision criteria, authorities, people, policies, standards, processes, information and systems
• Approve risk policies such as model governance standards, stress testing scenarios, and the evaluation and endorsement of risk models
• Identify specific concentrations of risk• Recommend scenarios and the resulting macroeconomic variable
projections used for enterprise-wide stress tests
The members in these committees comprise representatives from the Risk Management Group (RMG) as well as key business and support units.
Most of the above committees are supported by local risk committees in all major locations, where appropriate. These local risk committees oversee the local risk positions for all businesses and support units, ensuring that they keep within the limits set by the group risk committees. They also approve location-specific risk policies.
The Chief Risk Officer (CRO), who is a member of the Group Executive Committee and reports to the Chairman of the BRMC and the CEO, oversees the risk management function. The CRO is independent of business lines and is actively involved in key decision-making processes. He often engages with regulators to discuss risk matters, enabling a more holistic risk management perspective.
Working closely with the risk and business committees, the CRO is responsible for the following:• Management of DBS’ risks, including systems and processes to identify, approve, measure, monitor, control and report risks• Engagement with senior management about material matters regarding all risk types• Development of risk controls and mitigation processes• Ensuring DBS’ risk management is effective, and the Risk Appetite established by the Board is adhered to
4 Risk Appetite
DBS’ Risk Appetite is set by the Board and governed by the Risk Appetite Policy – a key part of our risk culture. A strong organisational risk culture is imperative for DBS to move forward, and this includes an effective incentive framework (please refer to the Remuneration Report section on page 64).
4.1 Risk thresholds and economic capital usageOur Risk Appetite takes into account a spectrum of risk types, and it is implemented using thresholds, policies, processes and controls.
Threshold structures are essential in making DBS’ Risk Appetite an intrinsic part of our businesses, because they help to keep all our risks within acceptable levels. Portfolio risk limits for the quantifiable risk types reach all parts of DBS from the top down, and these are implemented using formal frameworks. As for the non-quantifiable risk types, these are controlled using qualitative principles.
To ensure that the thresholds pertaining to our Risk Appetite are completely risk-sensitive, we have adopted economic capital (EC) as our primary risk metric. EC is also a core component in our Internal Capital Adequacy Assessment Process (ICAAP).
The following chart provides a broad overview of how our Risk Appetite permeates throughout DBS. Please refer to Sections 5 through 9 for more information about each risk type.

| 81Risk management
Risk Executive Committee
Capital allocation
Credit risk
Manage concentration risk by using triggers and limits
Market risk
Manage market risk by using limits
Manage through policies and standards
Operational risk
Maintain counterbalancing capacity to meet the liquidity risk exposure
Reputational risk
Manage through policies and standards
• Obligor• Industry• Country
(transfer risk)
Obligor economic capital triggers• Corporate• Banks
Expected Shortfall limits• Business group• Business unit• Entity• Desk
Industry economic capital triggers• Financial institutions• Non-financial
institutions
Country (transfer risk) limits• Strategic• Non-strategic
• Trading book (product desk)
• Banking book (business segment)
Liquidity risk
• Currency• Location
4.2 Stress testingStress testing is an integral part of our risk management process, and includes both sensitivity analysis and scenario analysis.
This element alerts senior management of our potential vulnerability to exceptional but plausible adverse events. As such, stress testing enables us to assess capital adequacy, identify potentially risky portfolio segments and inherent systematic risks. This then allows us to develop the right contingency plans, exit strategies and mitigating actions beforehand.
Stress testing is conducted at least once annually, and additional stress tests are carried out in response to microeconomic and macroeconomic conditions. Every stress test is documented.
The capital planning process according to our ICAAP seeks to align our expected business trajectory to our Risk Appetite. This is done by comparing the projected demand for capital to the projected supply of capital in stress scenarios.

82 | DBS Annual Report 2016
5 Credit risk
The most significant measurable risk DBS faces -– credit risk arises from our daily activities in our various businesses. These activities include lending to retail, corporate and institutional customers; trading endeavours such as foreign exchange, derivatives and debt securities; and the settlement of transactions.
Please refer to Note 41.1 to the financial statements on page 164 for details on DBS’ maximum exposure to credit risk.
5.1 Credit risk management at DBS
DBS’ approach to credit risk management comprises the following building blocks:
The usage of credit ratings and lending limits are an integral part of DBS’ credit risk management process, and we use an array of rating models for our corporate and retail portfolios. Most of these models are built internally using DBS’ loss data, and the limits are driven by DBS’ Risk Appetite Statement and the TMRAC.
Wholesale borrowers are assessed individually using both judgmental credit models and statistical credit models. They are further reviewed and evaluated by experienced credit risk managers who consider relevant credit risk factors in the final determination of the borrower’s risk. For some portfolios within the SME segment, DBS also uses a programme-based approach to achieve a balanced management of risks and rewards. Retail exposures are assessed using credit scoring models, credit bureau records, and internally and externally available customer behaviour records. These are supplemented by our Risk Acceptance Criteria.
After the credit exposures are assessed, credit extensions are proposed by the business unit, and these are approved by the credit risk function after taking into account independent credit assessments and the business strategies set by senior management.
Please refer to Section 5.3 on page 84 to read more about our internal credit risk models.
Pre-settlement credit risk for derivatives arising from a counterparty potentially defaulting on its obligations is quantified by a mark-to-market evaluation, as well as any potential exposure in the future. This is used to calculate DBS’ regulatory capital under the Current Exposure Method (CEM), and is included under DBS’ overall credit limits to counterparties for internal risk management.
Issuer default risk that may also arise from derivatives and securities are generally measured based on jump-to- default computations.
DBS actively monitors and manages our exposure to counterparties in over-the-counter (OTC) derivative trades to protect our balance sheet in the event of a counterparty default. Counterparty risk exposures that may be adversely affected by market risk events are identified, reviewed and acted upon by management, and highlighted to the appropriate risk committees. Specific wrong-way risk arises when the exposure to a counterparty positively correlates with the probability of defaulting due to the nature of the transactions. DBS has a policy to guide the handling of specific wrong-way risk transactions, and its risk measurement metric takes into account the higher risks associated with such transactions.
Concentration risk managementOur risk management processes, which are aligned with our Risk Appetite, ensure that an acceptable level of risk diversification is maintained across DBS.
For credit risk, we use EC as our measurement tool, since it combines the individual risk factors of probability of default (PD), loss given default (LGD) and exposure at default (EAD), as well as portfolio concentration factors. Granular EC thresholds are set to ensure that the allocated EC stays within our Risk Appetite.
Thresholds regarding major industry groups and single counterparty exposures are monitored regularly, and notional limits for country exposures are set as well. Governance processes are in place to ensure that our exposures are regularly monitored with these thresholds in mind, and appropriate action is taken when the thresholds are breached.
DBS continually examines how we can enhance the scope of our thresholds to effect better risk management.
Country riskCountry risk refers to the risk of loss due to events in a specific country (or a group of countries). This includes political, exchange rate, economic, sovereign and transfer risks.
DBS manages country risk through the Group Credit Risk Management Policy and CCRP, and the said risk is part of our concentration risk management. The way we manage transfer risk at DBS is set out in our Country Risk Management Standard. This includes an internal transfer risk and sovereign risk rating system, where assessments are made independently of business decisions. Our transfer risk limits are set in accordance with DBS’ Risk Appetite Policy.
Limits for strategic and non-strategic countries are set based on country-specific strategic business considerations as well as the acceptable potential loss according to our Risk Appetite. Senior management and credit management actively evaluate what the right transfer risk exposures for DBS should be, taking into account the risks and rewards, as well as whether they are in line with our strategic intent. Limits for all other countries are set using a model-based approach.
All country limits are subject to approval by the BRMC.
Policies
Risk methodologies
Processes, systems and reports
PoliciesThe dimensions of credit risk and the scope of its application are defined in the Group Credit Risk Management Policy. Senior management sets the overall direction and policy for managing credit risk at the enterprise level.
The Group Core Credit Risk Policies established for Consumer Banking/Wealth Management and Institutional Banking (herein referred to as CCRPs) set forth the principles by which DBS conducts its credit risk management and control activities. These policies, supplemented by a number of operational policies and standards, ensure consistency in identifying, assessing, underwriting, measuring, reporting and controlling credit risk across DBS, and provide guidance in the formulation of business-specific and/or location-specific credit risk policies and standards.
The operational policies and standards are established to provide greater details on the implementation of the credit principles within the Group CCRPs and are adapted to reflect different credit environments and portfolio risk profiles. The CCRPs are considered and approved by GCPC.
Risk methodologiesCredit risk is managed by thoroughly understanding our customers – the businesses they are in, as well as the economies in which they operate.

| 83Risk management
Stress testingDBS engages in various types of credit stress testing, and these are driven either by regulators or our own internal requirements and management.
Our credit stress tests are performed at total portfolio or sub-portfolio level, and are generally meant to assess the impact of changing economic conditions on asset quality, earnings performance, capital adequacy and liquidity. DBS’ stress testing programme is comprehensive, and covers all major functions and areas of business.
DBS typically performs the following types of credit stress testing at a minimum and others as necessary:
affecting credit risk profiles is key to our philosophy of effective credit risk management.
In addition, risk reporting on credit trends, which may include industry analysis, early warning alerts and significant weak credits, is submitted to the various credit committees, allowing key strategies and action plans to be formulated and evaluated. Credit control functions also ensure that any credit risk taken complies with group-wide credit policies and guidelines. These functions ensure that approved limits are activated, credit excesses
and policy exceptions are appropriately endorsed, compliance with credit standards is carried out, and covenants established by management and regulators are monitored.
Independent risk management functions that report to the CRO are jointly responsible for developing and maintaining a robust credit stress testing programme. These units oversee the implementation of credit stress tests as well as the analysis of the results, of which management, various risk committees and regulators are informed.
Classification grade Description
Performing assets
Pass Indicates that the timely repayment of the outstanding credit facilities is not in doubt.
Special mention Indicates that the borrower exhibits potential weaknesses that, if not corrected in a timely manner, may adversely affect future repayments and warrant close attention by DBS.
Classified or NPA
Substandard Indicates that the borrower exhibits definable weaknesses in its business, cash flow or financial position that may jeopardise repayment on existing terms. These credit facilities may be non-defaulting.
Doubtful Indicates that the borrower exhibits severe weaknesses such that the prospect of full recovery of the outstanding credit facilities is questionable and the prospect of a loss is high, but the exact amount remains undeterminable.
Loss Indicates that the amount of recovery is assessed to be insignificant.
Pillar 1 credit stress testing
Pillar 2 credit stress testing
Industry-wide stress testing
Sensitivity and scenario analyses
DBS conducts Pillar 1 credit stress testing regularly as required by regulators. Under Pillar 1 credit stress testing, DBS assesses the impact of a mild stress scenario (at least two consecutive quarters of zero GDP growth) on Internal Ratings-Based (IRB) estimates (i.e. PD, LGD and EAD) and the impact on regulatory capital. The purpose of the Pillar 1 credit stress test is to assess the robustness of internal credit risk models and the cushion above minimum regulatory capital.
DBS conducts Pillar 2 credit stress testing annually as part of the ICAAP. Under Pillar 2 credit stress testing, DBS assesses the impact of stress scenarios with different levels of severity, taking into account asset quality, earnings performance, and internal and regulatory capital. The results of the credit stress tests become input for the capital planning process under the ICAAP. The purpose of the Pillar 2 credit stress testing is to examine the possible events or market changes that could adversely affect DBS.
DBS participates in the annual industry-wide stress test (IWST) conducted by the Monetary Authority of Singapore (MAS) to facilitate our ongoing assessment of financial stability. Under the IWST, DBS is required to assess the impact of adverse scenarios, as defined by the regulator, on asset quality, earnings performance and capital adequacy.
DBS conducts multiple independent sensitivity analyses and credit portfolio reviews based on various scenarios. The intent of these analyses and reviews is to identify vulnerabilities, which is vital for developing and executing mitigating action.
Processes, systems and reportsDBS constantly invests in systems to support risk monitoring and reporting for our Institutional Banking and Consumer Banking/Wealth Management businesses.
The end-to-end credit process is continually being reviewed and improved through various front-to-back initiatives involving the business units, the operations unit, the RMG and other key stakeholders. Day-to-day monitoring of credit exposures, portfolio performance and external environmental factors potentially

84 | DBS Annual Report 2016
Non-performing assetsDBS’ credit facilities are classified as “Performing assets” or “Non-performing assets” (NPA), in accordance with the MAS Notice to Banks No. 612 “Credit Files, Grading and Provisioning” (MAS Notice 612).
These guidelines require credit portfolios to be categorised into one of the following five categories, according to our assessment of a borrower’s ability to repay a credit facility from its normal sources of income.
The link between the MAS categories shown below and DBS’ internal ratings is shown in Section 5.3.2 on page 85.
A default is considered to have occurred with regard to a particular borrower when either or both of the following events have taken place:
• Subjective default: Borrower is considered to be unlikely to pay its credit obligations in full, without DBS taking action such as realising security (if held)
• Technical default: Borrower is more than 90 days past due on any credit obligation to DBS
This is consistent with the guidance provided under the MAS’ Notice to Banks No. 637 “Notice on Risk Based Capital Adequacy Requirements for Banks incorporated in Singapore” (MAS Notice 637).
Credit facilities are classified as restructured assets when we grant non-commercial concessions to a borrower because it is in a worse financial position or is unable to meet the original repayment schedule. A restructured credit facility is classified into the appropriate non-performing grade based on the assessment of the borrower’s financial condition and its ability to repay according to the restructured terms.
Such credit facilities are not returned to the performing status until there are reasonable grounds to conclude that the borrower will be able to service all future principal and interest payments on the credit facility in accordance with the restructured terms. Apart from what has been described, we do not grant concessions to borrowers in the normal course of business. Any restructuring of credit facilities are reviewed on a case-by-case basis and conducted only on commercial terms.
In addition, it is not within DBS’ business model to acquire debts that have been restructured at inception (e.g. distressed debts).
Please refer to Note 2.11 to the financial statements on page 129 for our accounting policies regarding specific and general allowances for credit losses.
In general, specific allowances are recognised for defaulting credit exposures rated substandard and below.
The breakdown of our NPA by loan grading and industry and the related amounts of specific allowances can be found in Note 41.2 to the financial statements on page 165. A breakdown of past due loans can also be found in the same note.
When required, we will take possession of all collateral and dispose of them as soon as practicable. Realised proceeds are used to reduce outstanding indebtedness.
A breakdown of collateral held for NPA is shown in Note 41.2 to the financial statements on page 168.
Repossessed collateral is classified in the balance sheet as other assets. The amounts of such other assets for 2016 and 2015 were not material.
5.2 Credit risk mitigants
Collateral receivedWhere possible, DBS takes collateral as a secondary recourse to the borrower. This includes cash, marketable securities, properties, trade receivables, inventory and equipment, and other physical and/or financial collateral. We may also take fixed and floating charges on the assets of borrowers.
Policies are in place to determine the eligibility of collateral for credit risk mitigation. These include requiring specific collateral to meet minimum operational requirements in order to be considered as effective risk mitigants. DBS’ collateral is generally diversified and valued periodically. Properties constitute the bulk of our collateral, while marketable securities and cash are immaterial.
For derivatives, repurchase agreements (repo) and other repo-style transactions with financial market counterparties, collateral arrangements are typically covered under market-standard documentation, such as Master Repurchase Agreements and International Swaps and Derivatives Association (ISDA) Agreements. The collateral received is mark-to-market on a frequency DBS and the counterparties mutually agreed upon. This is governed by internal guidelines with respect to the eligibility of the collateral. In the event of a default, the credit risk exposure is reduced by master-netting arrangements where DBS is allowed to offset what we owe a counterparty against what is due from that counterparty in a netting-eligible jurisdiction.
Please refer to Note 14 to the financial statements on page 137 for further information on financial assets and liabilities subject to netting agreement but not offset on the balance sheet.
Collateral held against derivatives generally consists of cash in major currencies and highly rated government or quasi-government bonds. Exceptions may arise in certain countries,
where due to domestic capital markets and business conditions, the bank may be required to accept less highly rated or liquid government bonds and currencies. Reverse repo-transactions are generally limited to large institutions with reasonably good credit standing. The bank takes haircuts against the underlying collateral of these transactions that commensurate with collateral quality to ensure credit risks are adequately mitigated.
In times of difficulty, we will review the customer’s specific situation and circumstances to assist them in restructuring their repayment liabilities. However, should the need arise, disposal and recovery processes are in place to dispose of collateral held by DBS. We also maintain a panel of agents and solicitors that helps us to dispose of non-liquid assets and specialised equipment quickly.
Collateral postedDBS is required to post additional collateral in the event of a rating downgrade. As at 31 December 2016, for a three-notch downgrade of its Standard & Poor’s Ratings Services and Moody’s Investors Services ratings, DBS Bank will have to post additional collateral amounting to SGD 44 million (2015: SGD 57 million).
Other risk mitigantsDBS uses guarantees as credit risk mitigants. Internal thresholds for considering the eligibility of guarantors for credit risk mitigation are in place.
5.3 Internal credit risk modelsDBS adopts rating systems for the different asset classes under the Internal Ratings-Based Approach (IRBA).
There is a robust governance process for the development, independent validation and approval of any credit risk model. The models go through a rigorous review process before they are endorsed by the GCRMC and the Risk ExCo. They must also be approved by the BRMC before being used. The key risk measures generated by the internal credit risk rating models to quantify regulatory capital include PD, LGD and EAD. For portfolios under the Foundation IRBA, the supervisory LGD estimates are applied. For retail portfolios under the Advanced IRBA, internal estimates are used. In addition, the ratings from the credit models act as the basis for underwriting credit risk, monitoring portfolio performance and determining business strategies.
The performance of the rating systems is monitored regularly and informed to the GCRMC and the BRMC to ensure their ongoing effectiveness. This serves to highlight material deterioration in the rating systems for management attention.

| 85Risk management
An independent risk unit conducts formal validations for the respective rating systems annually. The validation processes are also independently reviewed by Group Audit.
5.3.1 Retail exposure modelsRetail portfolios are categorised into the following asset classes under the Advanced IRBA: residential mortgages, qualifying revolving retail exposures and other retail exposures.
Within each asset class, exposures are managed on a portfolio basis. Each account is assigned to a risk pool, considering factors such as borrower characteristics and collateral type. Loss estimates are based on historical default and realised losses within a defined period. The definition of default is applied at the level of a particular facility, rather than at the level of the obligor.
Business-specific credit risk elements such as underwriting criteria, scoring models, approving authorities and asset quality and business strategy reviews, as well as systems, processes and techniques to monitor portfolio performance, are in place. Credit risk models for secured and unsecured portfolios are also
used to update the risk level of each loan on a monthly basis, reflecting the broad usage of risk models in portfolio quality reviews.
5.3.2 Wholesale exposure models
Wholesale exposures are assessed under the Foundation IRBA and include sovereign, bank, corporate and specialised lending exposures.
The risk ratings for the wholesale exposures (other than securitisation exposures) have been mapped to corresponding external rating equivalents.
Sovereign exposures are risk-rated using internal risk-rating models and guidelines that are in line with the IRBA portfolios. Factors relevant to country-specific macroeconomic risk, political risk, social risk and liquidity risk are reviewed objectively in the sovereign rating models to assess the sovereign credit risk in a disciplined and systematic way.
Bank exposures are assessed using a bank-rating model covering various credit risk factors such as capital levels and liquidity, asset quality, earnings, management and market sensitivity.
The risk ratings derived are benchmarked against external credit risk ratings to ensure that the internal rating systems are well-aligned and appropriately calibrated.
Large corporate credits are assessed using approved models. They are also reviewed by designated credit approvers. Credit factors considered in the risk assessment process include the counterparty’s financial standing and specific non-quantitative factors such as industry risk, access to funding, market standing and management strength.
The counterparty risk rating assigned to SMEs is primarily based on the counterparty’s financial position and strength. Credit ratings under the IRBA portfolios are, at a minimum, reviewed on an annual basis unless credit conditions require more frequent assessment. The counterparty risk-rating process is reinforced by the facility risk-rating system, which considers other exposure risk mitigants, such as collateral and third-party guarantees.
A description of the internal ratings used and corresponding external ratings and MAS classification for the various portfolios is as follows:
Grade (ACRR) Description of rating grade
Equivalent external rating MAS classification
PD Grade 1 Taking into account the impact of relevant economic, social or geopolitical conditions, the borrower’s capacity to meet its financial commitment is exceptional.
AAA Pass Performing assets
PD Grade 2 Taking into account the impact of the relevant economic, social or geopolitical conditions, the borrower’s capacity to meet its financial commitment is excellent.
AA+, AA, AA Pass
PD Grade 3 More susceptible to adverse economic, social, geopolitical conditions and other circumstances. The borrower’s capacity to meet its financial commitment is strong.
A+, A, A- Pass
PD Grade 4A/4B Adequate protection against adverse economic, social or geopolitical conditions or changing circumstances. More likely to lead to a weakened capacity for the borrower to meet its financial commitment.
BBB+/BBB Pass
PD Grade 5 Relatively worse off than a borrower rated “4B” but exhibits adequate protection parameters.
BBB- Pass
PD Grade 6A/6B Satisfactory capacity for the borrower to meet its financial commitment but this may become inadequate due to adverse business, financial, economic, social or geopolitical conditions and changing circumstances.
BB+/BB Pass
PD Grade 7A/7B Marginal capacity for the borrower to meet its financialcommitment but this may become inadequate or uncertain due to adverse business, financial, economic, social or geopolitical conditions and changing circumstances.
BB- Pass

86 | DBS Annual Report 2016
Grade (ACRR) Description of rating grade
Equivalent external rating MAS classification
PD Grade 8A Sub-marginal capacity for the borrower to meet its financial commitment. Adverse business, financial or economic conditions will likely impair its capacity or willingness to meet its financial commitment.
B+ Pass
PD Grade8B/8C(a)
Low capacity for the borrower to meet its financialcommitment. Adverse business, financial or economic conditions will likely impair its capacity or willingness to meet its financial commitment.
B/B- Specialmention
PD Grade 9 Borrower is vulnerable to non-payment and is dependent upon favourable business, financial and economic conditions to meet its financial commitment. Likely to have little capacity to meet its financial commitment under adverse conditions.
CCC-C Substandard(non-defaulting)
Non-performingassets
PD Grade 10and above
A borrower rated “10” and above is in default (as defined under MAS Notice 637).
D Substandardand below(defaulting)
(a) For companies scored by the HK SME Scoring Model, in addition to the ACRR, there is a further test to evaluate whether the borrower meets the criteria of Special mention. If it does not, the ACRR can remain as 8B/8C but is not classified as Special mention
5.3.3 Specialised lending exposures
Specialised lending IRBA portfolios include income-producing real estate, project finance, object finance, hotel finance and commodities finance. These adopt the supervisory slotting criteria specified under Annex 7v of MAS Notice 637, which are used to determine the risk weights to calculate credit risk-weighted exposures.
5.3.4 Securitisation exposuresDBS is not active in securitisation activities that are motivated by credit risk transfer or other strategic considerations. As a result,we do not securitise our own assets, nor do we acquire assets with the view of securitising them. We arrange securitisation transactions for our clients for fees. These transactions do not involve special-purpose entities we control. For transactions that are not underwritten, no securitisation exposures are assumed as a direct consequence of arranging the transactions. Any decision to invest in any of such arranged transactions is subject to independent risk assessment.
Where DBS provides an underwriting commitment, any securitisation exposure that arises will be held in the trading book to be traded or sold down in accordance with our internal policy and risk limits. In addition, DBS does not provide implicit support for any transactions we structure or have invested in.
We invest in our clients’ securitisation transactions from time to time. These may include securitisation transactions arranged by us or other parties. We may also act as a liquidity facility provider, working capital facility provider or swap counterparty. Such exposures require the approval of the independent risk function, and are subject to regular risk reviews after they take place. We also have processes in place to monitor the credit risk of our securitisation exposures.
5.3.5 Credit exposures falling outside internal credit risk models
DBS applies the standardised approach (SA) for portfolios that are individually immaterial in terms of both size and risk profile, as wellas for identified transitioning portfolios. These portfolios include:
• IRBA-transitioning retail and wholesale exposures
• IRBA-exempt retail exposures• IRBA-exempt wholesale exposures
Any identified transitioning retail and wholesale exposures are expected to go through the Advanced IRBA and Foundation IRBA respectively, subject to certification by MAS. In the meantime, the SA will have been applied. The portfolios under the SA are subject to our overall governance framework and credit risk management practices. DBS will continue to monitor the size and risk profile of these portfolios, and will enhance the relevant risk measurement processes if these risk exposures become material.
DBS uses external ratings for credit exposures under the SA where relevant, and we only accept ratings from Standard & Poor’s, Moody’s and Fitch in such cases. DBS follows the process prescribed in MAS Notice 637 to map the ratings to the relevant risk weights.
| 87
350
300
250
200
150
100
50
Risk management
2015
19%
21%
17%
9%5%8%
10%
11%
Singapore
South and Southeast Asia
Hong KongRest of Greater China
Rest of the World
Geographical Concentration (SGD bn)
Above refers to gross loans and advances to customers based on country of incorporation
48%
16%
14%
9%
13%
305
305
287
287
2016
18%
16%
9%
10%
47%
2015
19%
21%
15%
11%
6%8%
10%
10%
2016
Industry Concentration (SGD bn)
Above refers to gross loans and advances to customers based on MAS Industry Code
Financial institutions, investment and holding companies
Manufacturing
General commerce
Professionals and private individuals (excluding housing loans)
Building and constructionHousing loans
Transportation, storage and communications
Others
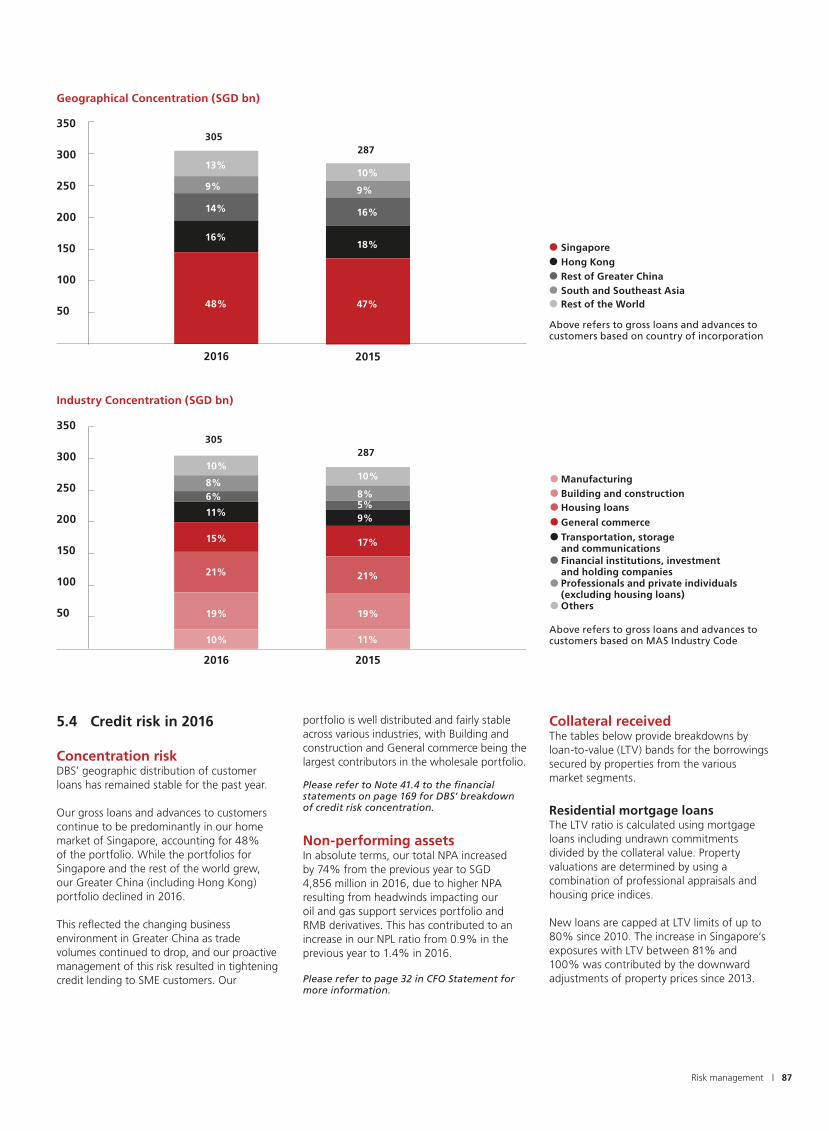
5.4 Credit risk in 2016
Concentration riskDBS’ geographic distribution of customer loans has remained stable for the past year.
Our gross loans and advances to customers continue to be predominantly in our home market of Singapore, accounting for 48% of the portfolio. While the portfolios for Singapore and the rest of the world grew, our Greater China (including Hong Kong) portfolio declined in 2016.
This reflected the changing business environment in Greater China as trade volumes continued to drop, and our proactive management of this risk resulted in tightening credit lending to SME customers. Our
portfolio is well distributed and fairly stable across various industries, with Building and construction and General commerce being the largest contributors in the wholesale portfolio.
Please refer to Note 41.4 to the financial statements on page 169 for DBS’ breakdown of credit risk concentration.
Non-performing assetsIn absolute terms, our total NPA increased by 74% from the previous year to SGD 4,856 million in 2016, due to higher NPA resulting from headwinds impacting our oil and gas support services portfolio and RMB derivatives. This has contributed to an increase in our NPL ratio from 0.9% in the previous year to 1.4% in 2016.
Please refer to page 32 in CFO Statement for more information.
Collateral receivedThe tables below provide breakdowns by loan-to-value (LTV) bands for the borrowings secured by properties from the various market segments.
Residential mortgage loansThe LTV ratio is calculated using mortgage loans including undrawn commitments divided by the collateral value. Property valuations are determined by using a combination of professional appraisals and housing price indices.
New loans are capped at LTV limits of up to 80% since 2010. The increase in Singapore’s exposures with LTV between 81% and 100% was contributed by the downward adjustments of property prices since 2013.
350
300
250
200
150
100
50

88 | DBS Annual Report 2016
Loans and advances to corporates secured by propertyThese loans are extended for the purpose of acquisition and/or development of real estate, as well as for general working capital. 90% of our loans are fully collateralised, as compared to 86% in 2015. Majority of these loans have LTV <80%. Our property loans are mainly concentrated in Singapore and Hong Kong, which together accounted for 84% of total property loans.
The LTV ratio is calculated as loans and advances divided by the value of property, including other tangible collaterals that secure the same facility. The latter include cash, marketable securities, bank guarantees, vessels, and aircrafts. Where collateral assets are shared by multiple loans and advances, the collateral value is pro-rated across the loans and advances secured by the collateral.
50.8%
75.3%
Percentage of residential mortgage loans (breakdown by LTV band and geography)
Singapore
Singapore
Hong Kong
Hong Kong
Rest of Greater China
Rest of Greater China
South and Southeast Asia
South and Southeast Asia
23.0%
25.1%
36.4%
38.8%
31.6%
35.2%
96.5%
96.3%
61.8%
60.7%
45.1%
44.7%
67.9%
64.8%
3.4%
3.6%
15.2%
14.2%
18.3%
16.5%
0.5%
0.0%
0.1%
0.1%
0.0%
0.0%
0.2%
0.0%
0.0%
0.0%
0.0%
0.0%
LTV band
LTV band
As at 31 December 2016
As at 31 December 2015
Up to 50%
Up to 50%
51% to 80%
51% to 80%
81% to 100%
81% to 100%
Partially collateralised
Partially collateralised
Percentage of loans and advances to corporates secured by property (breakdown by LTV band and geography)
51.2%
53.7%
63.8%
52.4%
50.0%
47.5%
32.8%
10.3%
22.8%
37.9%
35.7%
15.0%
19.6%
22.4%
17.5%
33.3%
27.0% 47.5%
6.7%
5.9%
9.9%
7.8%
7.0%
7.6%
6.8%
8.5%
0.0%
0.0%
4.2%
4.6%
11.3%
20.2%
20.6%
27.4%
27.1%
54.2%
1.9%
1.7%
As at 31 December 2016
As at 31 December 2015
Singapore
Singapore
Hong Kong
Hong Kong
Rest of Greater China
Rest of Greater China
South and Southeast Asia
Rest of the World
South and Southeast Asia
Rest of the World
LTV band
LTV band
Up to 50%
Up to 50%
51% to 80%
51% to 80%
81% to 100%
81% to 100%
Partially collateralised
Partially collateralised

| 89Risk management
Loans and advances to banksIn line with market convention, loans and advances to banks are typically unsecured. DBS manages the risk of such exposures by keeping tight control of the exposure tenor, and monitoring the credit quality of the bank counterparties.
Derivatives counterparty credit risk by markets and settlement methodsDBS continues to manage our derivatives counterparty risk exposures with netting and collateral arrangements, thereby protecting our balance sheet in the event of counterparty defaulting.
A breakdown of our derivatives counterparty credit risk by markets (OTC versus exchange-traded) and settlement methods (cleared through a central counterparty versus settled bilaterally) can be found below.
Notional OTC and exchange-traded products
In notional terms, SGD m
As at 31 Dec
2016
OTC derivatives cleared through a central counterparty
751,315
OTC derivatives settled bilaterally
1,301,713
Total OTC derivatives 2,053,028
Exchange-traded derivatives
17,515
Total derivatives (only with external parties)
2,070,543
Please refer to Note 37 to the financial statements on page 156 for a breakdown of the derivatives positions held by DBS.
(iii) strategic stakes in entities and (iv) structural foreign exchange risk arising mainly from our strategic investments, which are denominated in currencies other than the SGD.
6.1 Market risk management at DBS
DBS’ approach to market risk management comprises the following building blocks:
For back-testing, VaR at the 99% level of confidence and over a one-day holding period is used. We adopt the standardised approach to compute market risk regulatory capital under MAS Notice 637 for the trading book positions. As such, VaR back-testing does not impact our regulatory capital for market risk.
VaR models allow us to estimate the aggregate portfolio market risk potential loss due to a range of market risk factors and instruments. However, there are limitations to VaR models; for example, past changes in market risk factors may not provide accurate predictions of future market movements, and the risk arising from adverse market events may be understated.
To monitor DBS’ vulnerability to unexpected but plausible extreme market risk-related events, we conduct multiple market risk stress tests regularly. These cover trading and non-trading portfolios and follow a combination of historical and hypothetical scenarios depicting risk-factor movement.
ES is the key risk metric used to manage our assets and liabilities. As an exception, credit spread risk arising from loans and receivables is managed under the credit risk management framework. We also manage banking book interest rate risk arising from mismatches in the interest rate profiles of assets, liabilities and capital instruments (and associated hedges), which includes basis risk arising from different interest rate benchmarks, interest rate re-pricing risk, yield curve risk and embedded optionality. Behavioural assumptions are applied when managing the interest rate risk of banking book deposits with indeterminate maturities. DBS measures interest rate risk in the banking book on a weekly basis.
Credit derivatives are used in the trading book with single name or index underlying instruments to support DBS’ business strategy to build a regional fixed income franchise. We actively monitor our counterparty credit risk in credit derivative contracts.
More than 90% of the gross notional value of our credit derivative positions as at 31 December 2016 was to 19 established names, which we maintain collateral agreements with.
Processes, systems and reportsRobust internal control processes and systems have been designed and implemented to support our market risk management approach. DBS reviews these control processes and systems regularly, and these reviews allow senior management to assess their effectiveness.
The RMG Market and Liquidity Risk unit – an independent market risk management function reporting to the CRO – monitors, controls and analyses DBS’ market risk daily. The unit comprises risk control, risk analytics, production and reporting teams.
6 Market risk
Our exposure to market risk is categorised into:
Trading portfolios: Arising from positions taken for (i) market-making, (ii) client-facilitation and (iii) benefiting from market opportunities. Non-trading portfolios: Arising from (i) positions taken to manage the interest rate risk of our Institutional Banking and Consumer Banking assets and liabilities, (ii) equity investments comprising of investments held for yield and/or long-term capital gains,
Policies
Risk methodologies
Processes, systems and reports
Policies The Market Risk Management Policy sets our overall approach towards market risk management, while the Market Risk Management Standard establishes the basic requirements for the said management within DBS.
The Market Risk Management Guide complements the Market Risk Management Standard by providing more details regarding specific subject matters. Both the Market Risk Management Standard and Market Risk Management Guide facilitate the identification, measurement, control, monitoring and reporting of market risk in a consistent manner. They also set out the overall approach, standards and controls governing market risk stress testing across DBS.
The criteria for determining the positions to be included in the trading book are stipulated in the Trading Book Policy Statement.
Risk methodologiesValue-at-Risk (VaR) is a method that computes the potential losses of risk positions as a result of market movement over a specified time horizon and according to a given level of confidence.
Our VaR model is based on historical simulation with a one-day holding period. We use Expected Shortfall (ES), which is the average of potential loss beyond a given level of confidence, to monitor and limit market risk exposures. The market risk economic capital that is allocated by the BRMC is linked to ES by a multiplier. ES is supplemented by risk control metrics such as sensitivities to risk factors and loss triggers for management action.
DBS conducts back-testing to verify the predictiveness of the VaR model. Back-testing compares VaR calculated for positions at the close of each business day with the profit and loss (P&L) that actually arises in those positions on the following business day. The back-testing P&L excludes fees and commissions, and revenues from intra-day trading.

90 | DBS Annual Report 2016
6.2 Market risk in 2016DBS’ ES considers the market risks of both the trading and banking books. Our ES (based on a 97.5% level of confidence) is tabulated below. The period-end, average, high and low ES are shown.
1 Jan 2016 to 31 Dec 2016
SGD m As at 31 Dec 2016 Average High Low
Total 89 98 112 84
1 Jan 2016 to 31 Dec 2016
SGD m As at 31 Dec 2016 Average High Low
Diversified 26 21 31 14
Interest Rates 16 18 27 14
Foreign Exchange 10 12 18 7
Equity 1 2 3 1
Credit Spread 18 11 19 6
Commodity # # 1 #
1 Jan 2015 to 31 Dec 2015
SGD m As at 31 Dec 2015 Average High Low
Diversified 16 20 32 15
Interest Rates 17 15 21 9
Foreign Exchange 11 8 19 3
Equity 3 3 5 2
Credit Spread 8 16 23 7
Commodity # 1 2 #
1 Jan 2015 to 31 Dec 2015
SGD m As at 31 Dec 2015 Average High Low
Total 101 117 147 75
DBS’ major market risk driver is interest rate risk in the trading and banking books. The average ES for 2016 was lower than 2015 mainly due to drop-off of volatile rates scenarios for ES calculation and updates to models used to measure interest rate risks in banking book. The following table shows the period-end, average, high and low diversified ES and ES by risk class for Treasury’s trading portfolios. The ES reported below are based on a 97.5% level of confidence.
# Amount under SGD 500,000

| 91Risk management
At DBS, the main risk factors driving Treasury’s trading portfolios in 2016 were interest rates, foreign exchange and credit spreads. Treasury’s trading portfolios’ average diversified ES remained relatively flat compared to 2015.
Treasury’s trading portfolios experienced five back-testing exceptions in 2016. The exceptions occurred in January, February, March, September and December. The four exceptions for the period from January to September were mainly due to (i) pronounced volatilities in SGD interest rates and SGD swap spreads; and (ii) basis risks in onshore/offshore Chinese foreign exchange and interest rate. The exception in December was due to valuation adjustments carried out at the month end.
Backtesting profit and loss VaR at 99% confidence interval
40
30
20
10
0
-10
-20
-30
-40
J F M A M J J A S O N DSGD m
The key market risk drivers of our non-trading portfolios are SGD and USD interest rate positions. The economic value impact of changes in interest rates was simulated under various assumptions for the non-trading portfolio. The economic value changes were negative SGD 156 million and SGD 239 million (2015: negative SGD 250 million and SGD 425 million) based on interest rate changes of 100 basis points and 200 basis points respectively. The negative economic value impact declined in December 2016 mainly due to a refinement of the behavioural assumptions for current account balances.
7 Liquidity risk
DBS’ liquidity risk arises from our obligations to honour withdrawals of deposits, repayments of borrowed funds at maturity, and our commitments to extend loans to our customers. We seek to manage our liquidity in a manner that ensures that our liquidity obligations will continue to be honoured under normal as well as adverse circumstances.
7.1 Liquidity risk management at DBS
Liquidity management and funding strategyDBS strives to develop a diversified funding base with access to funding sources across retail and wholesale channels. Our funding strategy is anchored on strengthening our core deposit franchise as the foundation of the Group’s long-term funding advantage.
Customer deposits grew by SGD 27 billion in 2016, contributing to 93% of total funding sources. Current and savings deposits, which are favourable for the liquidity coverage ratio, were the main drivers of growth with an increase of SGD 18 billion. Within wholesale funding, senior medium term notes were gradually replaced with covered bonds which are more cost effective.
Wholesale Funding Breakdown (SGD bn)
28
38
19%8%
42%
23%
2016
Other debt securities
Negotiable certificates of deposits
Senior medium term notes
Covered bonds
Commercial papers
17%3%
4%
50%
26%
2015
40
35
30
25
20
15
10
5
8%
Funding Sources (SGD bn)
93%
375
7%
89%
358
11%
2016 2015
Customer deposits
Wholesale funding
400
350
300
250
200
150
100
50

92 | DBS Annual Report 2016
DBS aims to ensure continuous access to the investor base for capital and senior wholesale funding to support our commercial banking activities. We look for cost efficiencies over the long term and market extensively, focusing on SGD, USD, EUR, AUD and HKD as our key issuance currencies. Capital instruments are primarily issued from DBS Group Holdings Ltd (DBSH) while covered bonds originate from DBS Bank Ltd. Senior notes are issued from both DBSH and the Bank as required, although DBSH is currently the only active issuer of public senior benchmarks.
The marquee issuance for 2016 was the 3.60% coupon USD Alternative Tier 1 (AT1) by DBSH. This was the lowest coupon paid by any issuer for a USD AT1 under Basel III, and has been recognised in annual awards by industry publications, including The Asset (Best Asian Bank Capital Bond), GlobalCapital (Best Asian Financial Bond), IFR Asia (Best Asian Investment Grade Bond) and FinanceAsia (Best Singapore Deal). In addition, IFR Asia has recognised our issuance and investor engagement activity by selecting DBS as its Issuer of the Year.
The diagrams below show our asset funding structure as at 31 December 2016.
Total equity
Other debt securities
Other liabilities
Deposits and balances from customers
Subordinated term debts
Due to banks
Others
Due from banks
Loan and advances to customers
Government securities and T-bills
Bank and corporate securities
Cash and balances with central banks
Assets
9%
63%
9%6%7%6%
Liabilities and equity
10%8%1%6%
72%
3%
Loan/deposit
ratio 87%
Please refer to Note 30 to the financial statements on page 148 for more details of our wholesale funding sources and Note 42.1 on page 171 for the contractual maturity profile of our assets and liabilities.
With increasing diversification of funding sources, optimising the mismatch in fund deployment against sources with respect to pricing, size, currency and tenor remains challenging. To this end, where practicable and transferable without loss in value, we make appropriate use of the swap markets for different currencies, commensurate with the liquidity of each, in the conversion and deployment of surplus funds across locations.
As these swaps typically mature earlier than loans, we are exposed to potential cash flow mismatches arising from the risk that counterparties may not roll over maturing swaps with us to support the continual funding of loans. We mitigate this risk by setting triggers on the number of swaps transacted with the market and making conservative assumptions on the cash flow behaviour of swaps under our cash flow maturity gap analysis (see Section 7.2 on page 93).
Overseas locations are encouraged but not required to centralise the majority of their borrowing and deployment of funds with our head office, taking into account the relevant regulatory restrictions while maintaining a commensurate level of presence and participation in the local funding markets. Intra-group funding transactions are priced with reference to the prevailing market rates and parameters set within the Group Funds Transfer Pricing policy.
During our annual budget and planning process, each overseas location conducts an in-depth review of its projected loan and deposit growth as well as its net funding and liquidity profile for the next year. The consolidated Group funding and liquidity profiles are reviewed and revised as necessary by senior management. Each overseas location is required to provide justification if head office funding support is required.
The Group Assets and Liabilities Committee and respective Location Assets and Liabilities Committee regularly review our balance sheet composition, the growth in loans and deposits, our utilisation of wholesale funding, the momentum of our business activities, market competition, the economic outlook, market conditions and other factors that may affect liquidity in the continual refinement of DBS’ funding strategy.
Approach to liquidity risk managementDBS’ approach to liquidity risk management comprises the following building blocks:
Policies Risk methodologies Processes, systems and reports
PoliciesThe Group Liquidity Risk Management Policy sets our overall approach towards liquidity risk management and describes the range of strategies DBS employs to manage our liquidity.
These strategies include maintaining an adequate counterbalancing capacity to address potential cash flow shortfalls and having diversified sources of liquidity.

| 93Risk management
DBS’ counterbalancing capacity includes liquid assets, the capacity to borrow from the money markets (including the issuance of commercial papers and covered bonds), and forms of managerial interventions that improve liquidity. In the event of a potential or actual crisis, we have in place a set of liquidity contingency and recovery plans to ensure that we maintain adequate liquidity.
The Group Liquidity Risk Management Policy is supported by Standards that establish the detailed requirements for liquidity risk identification, measurement, reporting and control within DBS. The set of Policies, Standards and supporting Guides communicate these baseline requirements to ensure consistent application throughout DBS.
Risk methodologiesThe primary measure used to manage liquidity within the tolerance defined by the Board is cash flow maturity mismatch analysis.
This form of analysis is performed on a regular basis under normal and adverse scenarios. It assesses the adequacy of our counterbalancing capacity to fund or mitigate any cash flow shortfalls that may occur as forecasted in the cash flow movements across successive time bands. To ensure that liquidity is managed in line with our Risk Appetite, core parameters such as the types of scenarios, the survival period and the minimum level of liquid assets, are pre-specified for monitoring and control on a group-wide basis. Any occurrences of forecasted shortfalls that cannot be covered by our counterbalancing capacity will be escalated to the relevant committees for evaluation and action.
Liquidity stress testing is performed regularly using cash flow maturity mismatch analysis, and covers adverse scenarios involving shocks that are general market and/or name-specific in nature. Stress tests assess our vulnerability when liability run-offs increase, asset rollovers increase and/or liquid asset buffers decrease. In addition, ad hoc stress tests are performed as part of our recovery planning and ICAAP exercises.
Liquidity risk control measures such as liquidity-related ratios and balance sheet analysis are complementary tools for cash flow maturity mismatch analysis, and they are performed regularly to obtain deeper insights and finer control over our liquidity profile across different locations. The liquidity risk control measures also include concentration measures regarding top depositors, wholesale borrowing and swapped funds ratios.
Processes, systems and reportsRobust internal control processes and systems support our overall approach in identifying, measuring, aggregating, controlling and monitoring liquidity risk across DBS.
Following enhancements on the in-house data platform made in the past two years, internal liquidity risk reporting was centralised in 2016, improving Group oversight of our liquidity positions across key locations and currencies.
The RMG Market and Liquidity Risk unit manages the day-to-day liquidity risk monitoring, control reporting and analysis.
7.2 Liquidity risk in 2016DBS actively monitors and manages our liquidity profile through cash flow maturity mismatch analysis.
In forecasting cash flow under the analysis, behavioural profiling is necessary in cases where a product has indeterminate maturity or the contractual maturity does not realistically reflect the expected cash flow.
Two examples are maturity-indeterminate savings and current account deposits, which are generally viewed as sources of stable funding for commercial banks. In fact, they consistently exhibit stability even under historical periods of stress. A conservative view is adopted in the behavioural profiling of assets, liabilities and off-balance sheet commitments that have exhibited cash flow patterns that differ significantly from the contractual maturity profile shown under Note 42.1 of our financial statements on page 171.
The table below shows our behavioural net and cumulative maturity mismatch between assets and liabilities over a one-year period, in a normal scenario without incorporating growth projections. DBS’ liquidity was observed to remain adequate in the maturity mismatch analysis. Loan growth in 2016 was supported largely by deposit growth, and diversified stable funding sources, which include covered bonds.
SGD m(a)Less than
7 days1 week to
1 month1 to 3
months3 to 6
months 6 months to
1 year
As at 31 Dec 2016Net liquidity mismatch
14,298 (1,763) (7,108) 3,576 9,901
Cumulative mismatch 14,298 12,535 5,427 9,003 18,904
As at 31 Dec 2015(b)
Net liquidity mismatch27,457 (102) (9,456) 8,298 2,825
Cumulative mismatch 27,457 27,355 17,899 26,197 29,022
(a) Positive indicates a position of liquidity surplus. Negative indicates a liquidity shortfall that has to be funded(b) As the behavioural assumptions used to determine the maturity mismatch between assets and liabilities are updated from time to time,
the liquidity mismatches may not be directly comparable across past balance sheet dates

94 | DBS Annual Report 2016
Liquid assets Others[d] Total
SGD mEncumbered Unencumbered Total
[1] Average(c)
[2] [1] + [2]
As at 31 Dec 2016Cash and balances with central banks(a)
6,708 9,797 16,505 15,458 10,335 26,840
Due from banks(b) – 8,425 8,425 7,486 21,593 30,018
Government securities and treasury bills
2,810 29,451 32,261 35,052 1,140 33,401
Banks and corporate securities
414 31,793 32,207 29,978 13,210 45,417
Total 9,932 79,466 89,398 87,974 46,278 135,676
7.3 Liquid assetsLiquid assets are assets that are readily available and can be easily monetised to meet obligations and expenses under times of stress.
Such assets are internally defined under the governance of the relevant oversight committees, taking into account asset class, issuer type and credit rating, among other criteria, before they are reflected as available funds through cash flow maturity mismatch analysis. DBS’ Treasury function expects to be able to operationally monetise our pool of liquid assets to meet liquidity shortfalls when the need arises. These liquid assets must be unencumbered and free of any legal, regulatory, contractual or other restrictions.
In practice, liquid assets are maintained in key locations and currencies to ensure that operating entities in such locations possess a degree of self-sufficiency to support business needs and guard against contingencies. The main portion of our liquid assets is centrally maintained in Singapore to support liquidity needs in smaller overseas subsidiaries and branches. Internally, DBS sets a requirement to maintain its pool of liquid assets above a minimum level as a source of contingent funds, taking into account projected stress shortfalls under its cash flow maturity mismatch analysis and other factors.
The table below shows DBS’ encumbered and unencumbered liquid assets by instrument and counterparty against other assets in the same category under the balance sheet. The figures are based on the carrying amount at the balance sheet date.
(a) Unencumbered balances with central banks comprise holdings that are unrestricted and available overnight. The encumbered portion represents the mandatory balances held with central banks, which includes a minimum cash balance (MCB) amount that may be available for use under a liquidity stress situation. The “Others” portion include term placements with central banks
(b) Liquid assets comprise nostro accounts and eligible certificates of deposits(c) Total liquid assets reflected on an average basis over the four quarters in 2016(d) “Others” refer to assets that are not recognised as part of the available pool of liquid assets for liquidity management under stress due to
(but not limited to) inadequate or non-rated credit quality, operational challenges in monetisation (e.g. holdings in physical scrips), and other considerations
In addition to the above table, collateral received in reverse repo-transactions amounting to SGD 5,649 million were recognised for liquidity management under stress. It can be observed from the table that our funding strategy in the normal course of business does not rely on collateralised wholesale funding. Instead, liquid assets are usually maintained only as a source of contingent funding.
7.4 Regulatory requirementsUnder MAS’ Notice to Banks No. 649 “Minimum Liquid Assets (MLA) and Liquidity Coverage Ratio (LCR)” (MAS Notice 649), DBS, as a domestic bank incorporated and headquartered in Singapore, is required to comply with the LCR standards. For the full year of 2016, Group LCR was maintained well above the minimum LCR requirements under MAS Notice 649. Based on our internal assessment and participation in the Quantitative Impact Studies by the Basel Committee on Banking Supervision, DBS is well-positioned to meet the minimum standards of the Basel III Net Stable Funding Ratio (NSFR), which will be implemented by 1 January 2018.
| 95Risk management
8 Operational risk Operational risk includes processing errors, fraudulent acts, inappropriate behaviour of staff, vendor misperformance, system failure and natural disasters. Operational risk is inherent in our businesses and activities.
DBS’ objective is to keep operational risk at appropriate levels, taking into account the markets we operate in, the characteristics of the businesses as well as our economic and regulatory environment.
8.1 Operational risk management at DBS
DBS’ approach to operational risk management comprises the following building blocks:
based on certain established thresholds. Key risk indicators with pre-defined escalation triggers are employed to facilitate risk monitoring in a forward-looking manner.
Additional methodologies are in place to address subject-specific risks, including, but not limited to, the following:
Technology riskInformation Technology (IT) risk is managed through an enterprise technology risk approach. This covers risk governance, communication, monitoring, assessment, mitigation and acceptance, and is supported by a set of IT policies and standards, control processes and risk mitigation programmes.
We have also established policies and standards to manage and address cyber security risk. To enhance the management of this risk, we have appointed a Chief Information Security Officer who is responsible for our cyber security risk management strategy and programme.
Compliance risk Compliance risk refers to the risk of DBS not being able to successfully conduct our business because of any failure to comply with laws, regulatory requirements, industry codes or standards of business and professional conduct applicable to the financial sector.
This includes, in particular, laws and regulations applicable to the licensing and conducting of banking or other financial businesses, financial crime such as anti-money laundering and countering the financing of terrorism, fraud and bribery/corruption. We maintain a compliance programme designed to identify, assess, measure, mitigate and report on such risks through a combination of policy and relevant systems and controls.
DBS also provides relevant training and implements assurance processes. We strongly believe in the need to promote a strong compliance culture as well, and this is developed through the leadership of our Board and senior management.
Fraud risk DBS has established minimum standards for our business and support units to prevent, detect, investigate and remediate fraud and related events. This is based on the Fraud Management Programme, through which standards are implemented at the unit and geographical levels. These standards aim to provide end-to-end management for fraud and related issues within DBS.
Money laundering, financing of terrorism and sanctions risks There are minimum standards for our business and support units to mitigate and manage our actual and/or potential exposure to money laundering, terrorist financing, sanctions, corruption, or other illicit financial activities. Accountabilities have also been established for the protection of DBS’ assets and reputation, as well as the interests of our customers and shareholders.
New product and outsourcing risksEach new product, service or outsourcing initiative is subject to a risk review and sign-off process, where relevant risks are identified and assessed by departments independent of the risk-taking unit proposing the product or service. Variations of existing products or services and outsourcing initiatives are also subject to a similar process.
Other mitigation programmes To manage business disruptions effectively, business continuity management is vital as part of DBS’ risk mitigation programme.
A robust crisis management and business continuity management programme is in place within essential business services for unforeseen events. Planning for business resilience includes the identification of key business processes via Business Impact Analysis as well as the documentation and maintenance of our Business Continuity Plan (BCP).
DBS’ BCP aims to minimise the impact of business interruption stemming from severe loss scenarios, and provide a reasonable level of service until normal business operations are resumed. Within the crisis management structure, we have in place an incident management process. This covers the situation from the point it begins and the crisis is declared to when the relevant committees or teams are activated to manage the crisis.
Exercises are conducted annually, simulating different scenarios to test our BCPs and crisis management protocol. These scenarios include technology issues affecting essential banking services across DBS, natural disasters with wide geographical impact, safety-at-risk incidents (e.g. terrorism) and other events leading to significant business disruption. The effectiveness of these exercises, as well as DBS’ business continuity readiness, our alignment to regulatory guidelines and our disclosure of residual risks, are communicated and verified with the BRMC on an annual basis.
To mitigate losses from specific unexpected and significant event risks, DBS purchases group-wide insurance policies – under the
PoliciesThe Group Operational Risk Management (ORM) Policy sets our overall approach for managing operational risk in a structured, systematic and consistent manner.
There are policies, standards, tools and programmes in place to govern ORM practices across DBS. These include corporate operational risk policies and standards that are owned by the respective corporate oversight and control functions. The key policies address risk areas relating to technology, compliance, fraud, money laundering, financing of terrorism and sanctions, new product and outsourcing.
Risk methodologiesDBS adopts the standardised approach to compute operational risk regulatory capital.
To manage and control operational risk, we use various tools, including risk and control self-assessment, operational risk event management and key risk indicator monitoring. Risk and control self-assessment is used by each business or support unit to identify key operational risk and assess how effective the internal controls are. When control issues are identified, the units develop action plans and track the resolution of the issues.
Operational risk events are classified in accordance with Basel standards. Such events, including any significant incidents that may impact DBS’ reputation, must be reported
Policies
Risk methodologies
Processes, systems and reports

96 | DBS Annual Report 2016
Group Insurance Programme – from third-party insurers. DBS has acquired insurance policies relating to crime and professional indemnity; director and officer liability; property damage and business interruption; general liability; and terrorism.
Processes, systems and reportsRobust internal control processes and systems are integral to identifying, monitoring, managing and reporting operational risk.
DBS has implemented a web-based system that supports multiple operational risk
management processes and tools, including operational risk event reporting, risk and control self-assessment, key risk indicators, the tracking of issues or action plans and operational risk reporting.
All units are responsible for the day-to-day management of operational risk in their products, processes, systems and activities, in accordance with the various frameworks and policies. The RMG Operational Risk unit and other corporate oversight and control functions oversee and monitor the effectiveness of operational risk
management, assess key operational risk issues with the units to determine the impact across DBS, and report and/or escalate key operational risks to relevant senior management and Board-level committees with recommendations on appropriate risk mitigation strategies.
8.2 Operational risk in 2016Total operational risk losses in 2016 was SGD 20 million which represented 0.18% of our total operating income. The losses may be categorised into the following seven Basel risk event categories:
2016 2015
Basel risk event types SGD m % SGD m %
External fraud 12.86 63% 2.97 38%
Clients, products and business practices (CPBP) 4.83 24% 0.28 4%
Execution, delivery and process management (EDPM) 2.31 12% 4.28 56%
Internal fraud 0.28 1% 0.14 2%
Damage to physical assets 0.04 0% 0 0%
Business disruption and system failures 0.01 0% 0.03 0%
Employment practices and workplace safety 0 0% 0 0%
Total(1) 20.33 100% 7.70(2) 100%
Notes: (1) Reportable operational risk events are those with net loss greater than SGD 10,000 and are reported based on the date of detection(2) Adjusted to account for material recoveries under external fraud and provision adjustment under EDPM
External fraud and CPBP accounted for 87% of the Group’s operational risk losses in 2016. The increase in losses for external fraud was attributable largely to an isolated incident. The operational risk losses for CPBP comprised mainly settlement of a lawsuit by a client for a processing error and a regulatory penalty imposed by MAS for breaches of money laundering regulations attributable to events in 2013 and 2014. Operational risk losses under EDPM have declined with fewer processing errors compared to the year before.
| 97Risk management
9 Reputational risk DBS views reputational risk as an outcome of any failure to manage risks in our day-to-day activities/decisions, and from changes in the operating environment. These risks include:
• Financial risk (credit, market and liquidity risks)
• Inherent risk (operational and business/strategic risks)
9.1 Reputational risk management at DBS
DBS’ approach to reputational risk management comprises the following building blocks:
such risks are articulated in the respective risk policies. These are reinforced by sound corporate values that reflect ethical behaviours and practices throughout DBS.
At DBS, we have policies in place to protect the consistency of our brand, and to safeguard our corporate identity and reputation.
Risk methodologiesUnder the various risk policies, we have established a number of mechanisms for ongoing risk monitoring.
These mechanisms take the form of risk limits, key risk indicators and other operating metrics, and includes the periodic risk and control self-assessment process. Apart from observations from internal sources, alerts from external parties/stakeholders also serve as an important source to detect potential reputational risk events. In addition, there are policies relating to media communications, social media and corporate social responsibility to protect DBS’ reputation. There are also escalation and response mechanisms in place for managing reputational risk.
While the respective risk policies address the individual risk types, the Reputational Risk Policy focuses specifically on our stakeholders’ perception of how well DBS manages its reputational risks. Stakeholders include customers, government agencies and regulators, investors, rating agencies,
business alliances, vendors, trade unions, the media, the general public, the Board and senior management, and DBS’ employees.
We recognise that creating a sense of shared value through engagement with key stakeholder groups is imperative for our brand and reputation.
For more information on how we engage our stakeholders, please refer to page 30.
Processes, systems and reportsOur units are responsible for the day-to- day management of reputational risk, and ensure that processes and procedures are in place to identify, assess and respond to this risk. Events affecting DBS’ reputational risk are also included in our reporting of risk profiles to senior management and Board-level committees.
9.2 Reputational risk in 2016DBS’ priority is to prevent the occurrence of a reputational risk event, instead of taking mitigating action when it occurs. There were no significant reputational risk incidents endangering the DBS franchise in 2016. However, there were some media reports on our credit exposure to the oil and gas industry and anti-money laundering lapses in 2013 and 2014. We will continue to uphold and enhance our reputation through sound corporate values and robust policies and processes.
Policies
Risk methodologies
Processes, systems and reports
PoliciesDBS adopts a four-step approach for reputational risk management, which is to prevent, detect, escalate and respond to reputational risk events.
As reputational risk is a consequence from the failure to manage other risk types, the definitions and principles for managing

98 | DBS Annual Report 2016
Appendix
General recommendations
Where have we disclosed this? (in Risk management section unless otherwise stated)
1 Present all related risk information together in any particular report. Refer to the table on page 77
2 Define the bank’s risk terminology and risk measures and present key parameter values used.
Permanent considerations regarding the impact of expected credit loss approaches:
Describe how the bank interprets and applies the key concepts within an ECL approach.
Disclose the credit loss modelling techniques developed to implement the ECL approach.
Sections 1, 5.1, 6.1, 7.1, 8.1
Refer to Note 1 below
Refer to Note 1 below
3 Describe and discuss top and emerging risks, incorporating relevant information in the bank’s external reports on a timely basis.
Temporary considerations regarding the impact of expected credit loss approaches:
Provide disclosures describing how the concepts applied and modelling techniques under the current impairment approaches compare with the new ECL approach to highlight factors that may drive changes in ECL that may not have been relevant in current impairment approaches.
Refer to CRO statement
Refer to Note 1 below
4 Once the applicable rules are finalised, outline plans to meet each new key regulatory ratio, e.g. the net stable funding ratio, liquidity coverage ratio and leverage ratio, and, once the applicable rules are in force, provide such key ratios.
Temporary considerations regarding the impact of expected credit loss approaches:
Banks should consider describing the intended implementation strategy including the current timeline for the implementation.
Disclose how the risk management organisation, processes and key functions have been organised to run the ECL methodology.
Section 7.4Refer to Capital management and planning section
Refer to Note 1 below
Refer to Note 1 below
Risk governance and risk management strategies/business model
5 Summarise prominently the bank’s risk management organisation, processes and key functions.
Section 3
6 Provide a description of the bank’s risk culture, and how procedures and strategies are applied to support that culture.
Section 4Refer to Corporate Governance section
7 Describe the key risks arising from the bank’s business models and activities, the bank’s Risk Appetite in the context of its business models and how the bank manages such risks.
Sections 1, 2 and 4
8 Describe the usage of stress testing within the bank’s risk governance and capital frameworks. Stress testing disclosures should provide a narrative overview of the bank’s internal stress testing process and governance.
Temporary considerations regarding the impact of expected credit loss approaches:
Describe the relationship, if any, between the stress testing programs and the implementation of ECL accounting requirements.
Sections 4.2, 5.1, 6.1, 7.1
Not applicable
| 99Risk management
General recommendations
Where have we disclosed this? (in Risk management section unless otherwise stated)
Capital adequacy and risk-weighted assets
9 Provide minimum Pillar 1 capital requirements, including capital surcharges for G-SIBs and the application of counter-cyclical and capital conservation buffers or the minimum internal ratio established by management.
Refer to Capital management and planning section and Pillar 3 disclosures published on DBS website
10 Summarise information contained in the composition of capital templates adopted by the Basel Committee to provide an overview of the main components of capital, including capital instruments and regulatory adjustments. A reconciliation of the accounting balance sheet to the regulatory balance sheet should be disclosed.
Refer to Pillar 3 disclosures published on DBS website
11 Present a flow statement of movements since the prior reporting date in regulatory capital, including changes in common equity tier 1, tier 1 and tier 2 capital.
Refer to Capital management and planning section
12 Qualitatively and quantitatively discuss capital planning within a more general discussion of management’s strategic planning, including a description of management’s view of the required or targeted level of capital and how this will be established.
Temporary considerations regarding the impact of expected credit loss approaches:
Banks should consider explaining how ECL requirements are anticipated to have an impact on capital planning (particularly in meeting capital adequacy requirements), including any strategic changes expected by management, to the extent that the impact is material. If regulatory requirements are unclear or not yet fully determined, the effects of such uncertainty should be discussed.
Refer to Capital management and planning section
Not applicable(regulatory requirements have not yet been fully determined)
13 Provide granular information to explain how risk-weighted assets (RWAs) relate to business activities and related risks.
Section 2
14 Present a table showing the capital requirements for each method used for calculating RWAs for credit risk, including counterparty credit risk, for each Basel asset class as well as for major portfolios within those classes. For market risk and operational risk, present a table showing the capital requirements for each method used for calculation.
Refer to Pillar 3 disclosures published on the DBS website
15 Tabulate credit risk in the banking book showing the average PD and LGD as well as the EAD, total RWAs and the RWA density for Basel asset classes and major portfolios within classes at a suitable level of granularity, based on internal ratings grades.
Refer to Pillar 3 disclosures published on the DBS website
16 Present a flow statement that reconciles movements in RWAs for the period for each RWA risk type.
To be implemented under revised Pillar 3 disclosures, effective from 1 January 2018
17 Provide a narrative putting Basel Pillar 3 back-testing requirements into context, including how the bank has assessed model performance and validated its models against default and loss.
Section 6.1, 6.2
Liquidity
18 Describe how the bank manages its potential liquidity needs and provide a quantitative analysis of the components of the liquidity reserve held to meet these needs, ideally by providing averages as well as period-end balances.
Sections 7.1, 7.3

100 | DBS Annual Report 2016
General recommendations
Where have we disclosed this? (in Risk management section unless otherwise stated)
Funding
19 Summarise encumbered and unencumbered assets in a tabular format by balance sheet categories, including collateral received that can be rehypothecated or otherwise redeployed. This is to facilitate an understanding of available and unrestricted assets to support potential funding and collateral needs.
Section 7.3
20 Tabulate consolidated total assets, liabilities and off-balance sheet commitments by retaining contractual maturity at the balance sheet date. Present separately (i) senior unsecured borrowing (ii) senior secured borrowing (separately for covered bonds and repos) and (iii) subordinated borrowing. Banks should provide a narrative discussion of management’s approach in determining the behavioural characteristics of financial assets and liabilities.
Section 7.2Financial statements Note 42.1
21 Discuss the bank’s funding strategy, including key sources and any funding concentrations, to enable effective insight into available funding sources, our reliance on wholesale funding, any geographical or currency risks and changes in those sources over time.
Section 7.1
22 Provide information that facilitates the user’s understanding of the links between line items in the balance sheet and the income statement with positions included in the traded market risk disclosures [using the bank’s primary risk management measures such as Value at Risk (VaR)] and non-traded market risk disclosures such as risk factor sensitivities, economic value and earnings scenarios and/or sensitivities.
Sections 6.1
23 Provide further qualitative and quantitative breakdowns of significant trading and non-trading market risk factors that may be relevant to the bank’s portfolios beyond interest rate, foreign exchange, commodity and equity measures.
Sections 6.1, 6.2
24 Provide qualitative and quantitative disclosures that describe significant market risk measurement model limitations, assumptions, validation procedures, usage of proxies, changes in risk measures and models through time, reasons for back-testing exceptions, and how these results are used to enhance the parameters of the model.
Sections 6.1, 6.2
25 Provide a description of the primary risk management techniques employed by the bank to measure and assess the risk of loss beyond reported risk measures and parameters, such as VaR, earnings or economic value scenario results, through methods such as stress tests, expected shortfall, economic capital, scenario analysis, stressed VaR or other alternative approaches. The disclosure should discuss how market liquidity horizons are considered and applied within such measures.
Sections 6.1, 6.2

| 101Risk management
General recommendations
Where have we disclosed this? (in Risk management section unless otherwise stated)
Credit risk
26 Provide information that facilitates the user’s understanding of the bank’s credit risk profile, including any significant credit risk concentrations.
Temporary considerations regarding the impact of expected credit loss approaches:
Banks should consider whether existing segmentation for disclosure purposes is sufficiently granular to appropriately understand credit risk through an ECL approach.
Once practical and when disclosures are reliable, provide users with a quantitative assessment of the potential impact of applying an ECL approach.
Permanent considerations regarding the impact of expected credit loss approaches:
Where it aids understanding of credit risk exposures, provide disclosure of vintage.
Section 5.4Financial statements Note 41.4
Not applicable(quantitative assessment not yet available)
Not applicable
27 Describe the policies for identifying impaired or non-performing loans, including how the bank defines impaired or non-performing, restructured and returned-to-performing (cured) loans, as well as explanations for loan forbearance policies.
Sections 5.1
28 Provide reconciliation for the opening and closing balances of non-performing or impaired loans in the period and the allowance for loan losses. Disclosures should include an explanation of the effects of loan acquisitions on ratio trends, and qualitative and quantitative information about restructured loans.
Sections 5.1, 5.4Financial statements Note 41.2
29 Provide a quantitative and qualitative analysis of the bank’s counterparty credit risk, which arises from its derivatives transactions.
Section 5.1, 5.4
30 Provide qualitative information about credit risk mitigation and collateral held for all sources of credit risk, as well as quantitative information where meaningful.
Section 5.2, 5.4
Other risks
31 Describe “other risk” types based on management’s classifications and discuss how each one is identified, governed, measured and managed. In addition to risks such as operational risk, reputational risk, fraud risk and legal risk, it may be relevant to include topical risks such as business continuity, regulatory compliance, technology, and outsourcing.
Section 1, 8.1, 9
32 Discuss publicly known risk events related to other risks, including operational, regulatory, compliance and legal risks, where material or potentially material loss events have occurred. Such disclosures should concentrate on the effect on the business, the lessons learned and the resulting changes to risk processes already implemented or in progress.
Section 8.2

102 | DBS Annual Report 2016
Note 1: New impairment methodology
In 2018, Financial Reporting Standard (FRS) 109 will take effect. This new accounting standard will govern how Singapore reporting entities classify and measure financial instruments; take impairment (or allowance) charges; and account for hedges.
Current impairment approachAt present, for impairment assessment, DBS complies with the provisions of MAS Notice 612 where banks maintain, in addition to specific allowances, a prudent level of general allowances of at least 1% of uncollateralised exposures. This is an intended departure from the incurred loss provisioning approach prescribed under FRS 39, and possible changes to the current regulatory specifications will determine how FRS 109’s Expected Credit Loss (ECL) model is eventually implemented. In the meantime, the Group has made further progress in its preparations, leveraging existing credit rating systems, models, processes and tools.
FRS 109 impairment methodologyUnder FRS 109, impairment charges will be determined using an ECL model, which classifies financial assets into three categories or stages, each of which is associated with an ECL requirement that is reflective of the assessed credit risk profile:• A financial asset is classified under Stage
1 if it was not credit-impaired upon origination and there has not been a significant increase in its credit risk since. Under this stage, the ECL of a financial asset will be that which is expected to result from defaults occurring over the next 12 months;
• A financial asset is classified under Stage 2 if it was not credit-impaired upon origination but has since suffered a
significant increase in credit risk. The ECL will be that which is expected over the remaining lifetime of the asset;
• A financial asset which has been credit-impaired with objective evidence of default is classified under Stage 3. The assessed ECL for Stage 3 financial asset is not expected to be materially different from the existing specific allowances taken.
Further guidance has also been specified by the Basel Committee in its December 2015 report, “Guidance on credit risk and accounting for expected credit losses”.
Implementation Plan A steering committee, chaired by the CFO, has been established to oversee the FRS 109 implementation, including the development of the ECL model. The steering committee is supported by an implementation working group consisting of subject matter experts from Finance, Risk Management, Business and Technology which will collectively manage key workstreams covering, among others, financial reporting, systems, processes and controls, as well as constituent engagement. Periodic progress updates are being provided to the Audit Committee.
Credit risk modelling techniquesPortfolio-specific adjustments will be made to the Bank’s existing credit rating systems, models, processes and tools, to meet the requirements of FRS 109. In particular, for the wholesale portfolios, credit risk cycles for significant industries and geographies will be used as inputs to convert through-the-cycle loss estimates measures into the point-in-time equivalents and in determining the forward-looking estimates.
In determining ECL, management will evaluate a range of possible outcomes, taking into account past events, current conditions and assessments of future economic
conditions. Additional considerations that are assessed to have been inadequately addressed in model estimates will be addressed through the application of a management overlay.
Transfer criteriaIn accordance with FRS 109, financial assets are considered to be Stage 2 where their credit risk profile is assessed to have increased significantly since initial recognition, such that it is appropriate to recognise lifetime ECL. The analysis underpinning this assessment is multi-factor in nature, and management will consider a range of qualitative and quantitative parameters.
These would include, for the wholesale portfolio is the change in probability of default derived from the internal credit risk rating for each obligor. For the retail portfolio, days past due will be considered, supplemented with additional mechanisms linked to the probability of default.
Impact assessmentDBS intends to quantify the potential impact of FRS 109 once it is practicable to provide reliable estimates and when there is full clarity on the possible changes to the current regulatory specifications. This is expected to be available in the annual report and financial statements for the year ending 31 December 2017. Until then, DBS is also unable to definitively determine any consequential effects that FRS 109 implementation could have on regulatory capital requirements. In this regard, we note that the Basel Committee is also considering how the new ECL requirements would impact existing regulatory capital rules.
At this juncture, our view remains that any such changes are unlikely to result in material additional allowance charges for DBS at the point of adoption.