risk management compensation surveyimg.sbmedia.com/perm/bmc/brandmktg/pcg/nup/rm... · 2016 risk...
TRANSCRIPT
2016 Risk Management Compensation Survey
Conducted by

National Underwriter Property & Casualty 2016 Risk Management Compensation Survey
CONTENTS
Purpose and Method ............................................................................................................ 1
Findings
Respondent Profile Risk Manager Status ............................................................................................... 2 Title ........................................................................................................................ 2 Job Satisfaction ...................................................................................................... 3 Years of Corporate Risk Management Experience ................................................ 4 Leading Risk Management/Insurance Professionals .............................................. 4 Areas of Involvement ............................................................................................. 5 Proportion Whose Job Responsibilities Have Expanded ....................................... 5 Titles Reporting To ................................................................................................ 6 Tenure With Present Employer .............................................................................. 6 Work Location ....................................................................................................... 7 Age and Gender ...................................................................................................... 7 Degrees Received and Designations Held ............................................................. 8
Organization Profile Industry ................................................................................................................... 9 Organization’s 2015 Sales Volume ...................................................................... 10 Number of Staff at All Locations ......................................................................... 10 Number of Full-Time Risk/Insurance Professionals in Department .................... 11 Number of Full-Time Executive Assistants in Department ................................. 11 Proportion Whose Departments Have Added More Staff .................................... 12 Proportion Whose Departments Have Had Layoffs ............................................. 12 Number of Captive Insurers Utilized by Organization ........................................ 13 Locations of Captive Insurance Companies ......................................................... 13
Compensation Annual Base Salary .............................................................................................. 14 Change in Annual Base Salary ............................................................................ 14 Annual Base Salary by Segment ..................................................................... 15-16 Total Compensation ............................................................................................. 17 Total Compensation by Segment .................................................................... 18-19
Benefits Benefits Offered ................................................................................................... 20 Amount of Company-Paid Life Insurance Received ........................................... 20
© 2016 Readex Research

1
National Underwriter Property & Casualty 2016 Risk Management Compensation Survey
PURPOSE AND METHOD
The findings cited in this report are based on a survey sponsored by ALM Media. The purpose of this research project was to gather compensation and employment information among risk management professionals. The survey sample of 5,802 included all emailable National Underwriter Property & Casualty magazine subscribers who indicated their type of business on the subscription form as “Risk Management,” “P&C Insurance Purchasing,” or “Employee Benefits.” Of the addresses sampled, 456 were returned as undeliverable, resulting in a net effective mailout of 5,346. The 30-question survey was designed jointly by ALM Media and Readex. Placement of the survey on a web page, distribution of the electronic survey invitations, and tabulation of the results were handled by Readex. On January 12, 2016, Readex contacted all sample members via an email in the name of National Underwriter Property & Casualty’s editor-in-chief, which included a link to the survey, asking for their participation in the study. It was mentioned that select results would be published in the April issue of National Underwriter Property & Casualty, and that respondents would receive a free copy of the complete aggregated results by email (an incentive to participate). Reminder emails were sent on January 18 and 28 to those with deliverable email addresses who had not yet responded. The survey was closed for tabulation on February 1, 2016, with 586 total responses—an 11% response rate based on the net effective mailout. To best represent the audience of interest, 86 respondents were terminated from the survey after indicating in the first question they do not consider themselves full- or part-time risk managers (15% of all survey respondents). This reduction implies an estimated population of 4,500 National Underwriter Property & Casualty recipients represented by the survey results. The margin of error for percentages based on 500 usable responses is ±4.1 percentage points at the 95% confidence level. The margin of error for percentages based on smaller sample sizes will be larger. As with any research, the results should be interpreted with the potential of non-response bias in mind. It is unknown how those who responded to the survey may be different from those who did not respond. In general, the higher the response rate, the lower the probability of estimation errors due to non-response and thus, the more stable the results. The response was tabulated and this report was prepared by Readex in accordance with accepted research standards and practices. Percentages may not add to 100% due to rounding and non-response.

2
National Underwriter Property & Casualty 2016 Risk Management Compensation Survey
FINDINGS: RESPONDENT PROFILE
A majority of respondents consider themselves full-time risk managers (72%) or part-time risk managers (13%), hereafter referred to as “risk managers.” To best represent the audience of interest, the 15% of respondents who indicated they are not full- or part-time risk managers were thanked for their interest in the study and terminated from the survey.
Risk managers were most likely to select “risk manager” or “director/RM” as best describing their title (30% and 29%, respectively).
Risk Manager Status Do you consider yourself a full- or part-time risk manager? base: all 586 respondents
full-time risk manager 72%
part-time risk manager 13%
neither 15%
Title What best describes your title? base: 500 risk manager respondents
30%
29%
13%
4%
4%
2%
2%
2%
2%
0%
0%
6%
8%
risk manager
director/RM
vice president/RM
president/RM
insurance/risk admin
chief financial officer/RM
chief risk officer
assistant treasurer/RM
enterprise risk manager
assistant secretary/RM
treasurer/RM
other manager
other

3
National Underwriter Property & Casualty 2016 Risk Management Compensation Survey
FINDINGS: RESPONDENT PROFILE
Job satisfaction ratings tend to be high. Four in five risk managers (80%) are satisfied with their job overall (rating of 4 or 5 on a 5-point scale where 5 = very satisfied and 1 = not at all satisfied).
Job Satisfaction Overall, how satisfied are you with your job? base: 500 risk manager respondents
1% 3%
15%
42%38%
1not at allsatisfied
2 3 4 5very
satisfied
mean: 4.1
80%
4
National Underwriter Property & Casualty 2016 Risk Management Compensation Survey
FINDINGS: RESPONDENT PROFILE
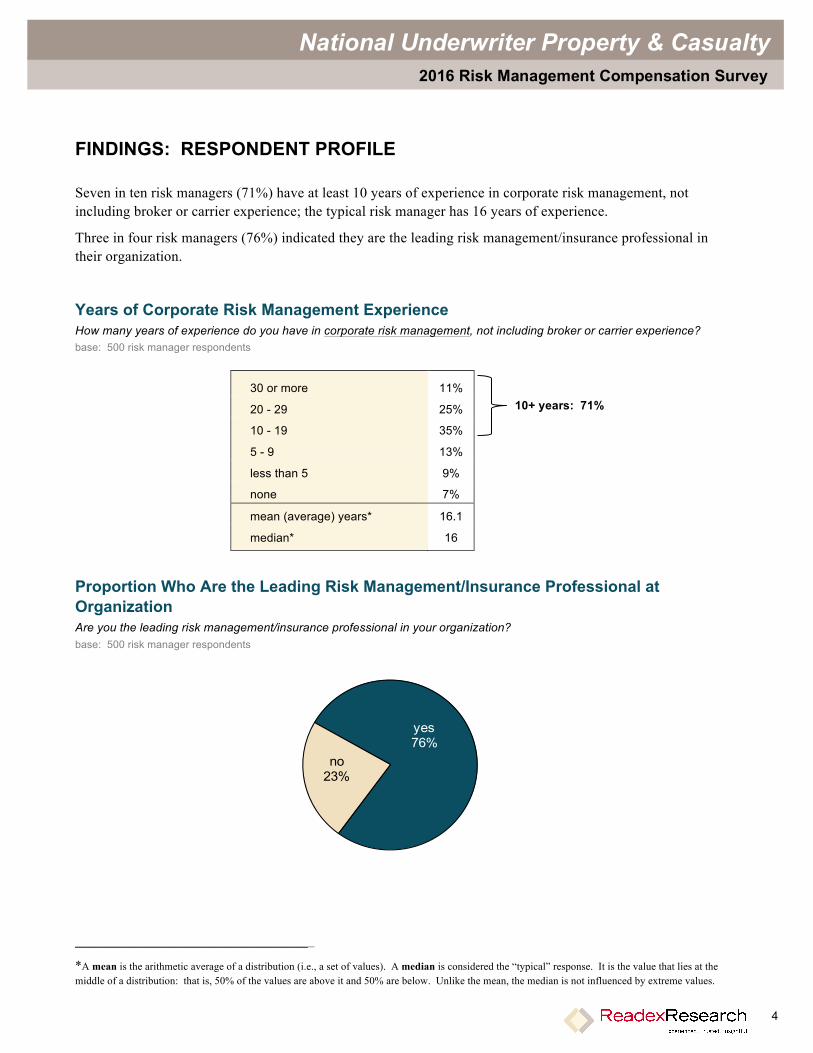
Seven in ten risk managers (71%) have at least 10 years of experience in corporate risk management, not including broker or carrier experience; the typical risk manager has 16 years of experience.
Three in four risk managers (76%) indicated they are the leading risk management/insurance professional in their organization.
Years of Corporate Risk Management Experience How many years of experience do you have in corporate risk management, not including broker or carrier experience? base: 500 risk manager respondents
30 or more 11%
20 - 29 25%
10 - 19 35%
5 - 9 13%
less than 5 9%
none 7%
mean (average) years* 16.1
median* 16
Proportion Who Are the Leading Risk Management/Insurance Professional at Organization Are you the leading risk management/insurance professional in your organization? base: 500 risk manager respondents
yes76%
no23%
___________________________________
*A mean is the arithmetic average of a distribution (i.e., a set of values). A median is considered the “typical” response. It is the value that lies at the middle of a distribution: that is, 50% of the values are above it and 50% are below. Unlike the mean, the median is not influenced by extreme values.
10+ years: 71%

5
National Underwriter Property & Casualty 2016 Risk Management Compensation Survey
FINDINGS: RESPONDENT PROFILE
Risk managers are involved (direct, supervise, advise, or some other type of involvement) in a variety of areas. Of the 19 listed areas, claims handling (81%), property insurance (80%), workers’ compensation (70%), and directors & officers liability (67%) are most common.
About half (47%) indicated their job responsibilities expanded last year, not related to a promotion/job change.
Areas of Involvement In which of the following areas are you involved (direct, supervise, advise, or some other type of involvement)? base: 500 risk manager respondents (multiple answers)
81%80%
70%67%
55%53%
47%46%46%
41%39%
34%29%
27%20%
16%14%
11%6%
claims handlingproperty insurance
workers' compensationdirectors & officers liability
risk management information systemsself-insurance financing/administration
surety bondssafety/fire engineering
cyber securitystrategic/enterprise risk management
regulatory complianceinternational insurance
reputational riskcaptive management
finance/treasurypolitical risk insurancebenefits administration
negotiating placement of benefit planscredit insurance
Proportion Whose Job Responsibilities Have Expanded Have your job responsibilities expanded in the past year, not related to a promotion/job change? base: 500 risk manager respondents
yes47%
no50%
no answer
3%

6
National Underwriter Property & Casualty 2016 Risk Management Compensation Survey
FINDINGS: RESPONDENT PROFILE
Risk managers report to person(s) of a variety of titles, none predominant. No more than 15% selected any one title as best describing the person(s) to whom they report.
Approximately three in five risk managers (62%) have been with their present employers for at least 10 years; the typical risk manager has been with his or her present employer for 14 years.
Titles Reporting To What titles best describe the person(s) to whom you report? base: 500 risk manager respondents (multiple answers)
15%13%12%
9%9%9%8%7%6%5%5%4%4%
2%1%1%
4%
directorCEOCFO
legal counseltreasurer
VPsenior VPpresident
chief officerexecutive VP
VP financemanagerchairmancontroller
assistant treasurerboard member
other
Tenure With Present Employer How many years have you been with your present employer? base: 500 risk manager respondents
30 or more 8%
20 - 29 19%
10 - 19 35%
5 - 9 19%
less than 5 15%
mean (average) years 14.7
median 14
10+ years: 62%

7
National Underwriter Property & Casualty 2016 Risk Management Compensation Survey
FINDINGS: RESPONDENT PROFILE
Risk managers are dispersed across the United States. The typical risk manager is a 55-year-old male.
Work Location In what state do you work? base: 500 risk manager respondents
Age and Gender What is your age? What is your gender? base: 500 risk manager respondents
10%18%
23%19%
15%6%
4%3%
2%
56%41%
AGE65 or older
60 - 6455 - 5950 - 5445 - 4940 - 4435 - 3930 - 34
under 30
GENDERmale
female
mean age: 53.6median: 55
Northeast: 18%
South: 37%
Midwest: 25%
West: 17%

8
National Underwriter Property & Casualty 2016 Risk Management Compensation Survey
FINDINGS: RESPONDENT PROFILE
The typical risk manager has a bachelor’s degree and at least one professional designation.
Degrees Received and Designations Held Which of these degrees have you received? What professional designations do you currently hold? base: 500 risk manager respondents (multiple answers)
1%6%
33%87%
31%12%
11%8%
7%7%
5%3%
2%2%2%
1%1%
24%70%
DEGREES RECEIVEDPh.D
LLB/JDMBA/MA/MSBA/BBA/BS
DESIGNATIONS HELDARM
RNCPCU
CPHRMCIC
CRMAIC
CPACPHQCRISCSP
CSRMCISRother
AT LEAST ONE

9
National Underwriter Property & Casualty 2016 Risk Management Compensation Survey
FINDINGS: ORGANIZATION PROFILE
Approximately one in five risk managers (22%) indicated their organization operates in the healthcare industry; no other industry accounts for more than 10%.
Industry What best describes the industry in which your organization operates? base: 500 risk manager respondents
22%10%10%
8%7%
4%4%
3%3%3%3%3%
2%2%2%
13%
healthcareinsurance
governmentmanufacturing
educationfinancial services
transportationretail
real estateutility
constructionoil/petrochemical
hotel/hospitalityfood industry
technology/ITother*
*includes chemical, communications, consumer products, entertainment, metals/mining, natural resources, publishing/media, and restaurant (each selected by <2% of respondents), and other (selected by 9%)
10
National Underwriter Property & Casualty 2016 Risk Management Compensation Survey
FINDINGS: ORGANIZATION PROFILE
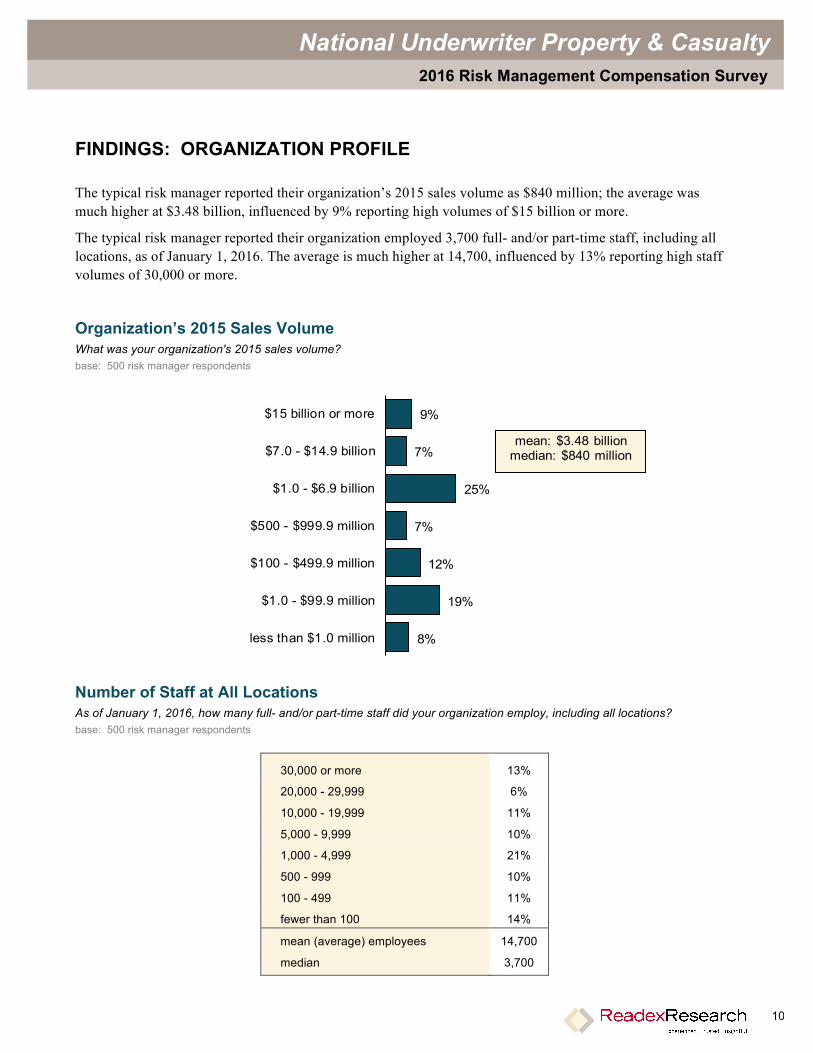
The typical risk manager reported their organization’s 2015 sales volume as $840 million; the average was much higher at $3.48 billion, influenced by 9% reporting high volumes of $15 billion or more.
The typical risk manager reported their organization employed 3,700 full- and/or part-time staff, including all locations, as of January 1, 2016. The average is much higher at 14,700, influenced by 13% reporting high staff volumes of 30,000 or more.
Organization’s 2015 Sales Volume What was your organization's 2015 sales volume? base: 500 risk manager respondents
9%
7%
25%
7%
12%
19%
8%
$15 billion or more
$7.0 - $14.9 billion
$1.0 - $6.9 billion
$500 - $999.9 million
$100 - $499.9 million
$1.0 - $99.9 million
less than $1.0 million
mean: $3.48 billionmedian: $840 million
Number of Staff at All Locations As of January 1, 2016, how many full- and/or part-time staff did your organization employ, including all locations? base: 500 risk manager respondents
30,000 or more 13%
20,000 - 29,999 6%
10,000 - 19,999 11%
5,000 - 9,999 10%
1,000 - 4,999 21%
500 - 999 10%
100 - 499 11%
fewer than 100 14%
mean (average) employees 14,700
median 3,700

11
National Underwriter Property & Casualty 2016 Risk Management Compensation Survey
FINDINGS: ORGANIZATION PROFILE
The typical risk manager indicated there are currently three full-time risk professionals and/or insurance professionals in their department, and no full-time executive assistants.
Number of Full-Time Risk Professionals/Insurance Professionals in Department Including yourself, how many full-time risk professionals and/or insurance professionals are currently in your department? base: 500 risk manager respondents
4%
8%
17%
23%
17%
30%
25 or more
10 - 24
5 - 9
3 - 4
2
1
mean: 5.0 median: 3
Number of Full-Time Executive Assistants in Department How many full-time executive assistants are currently in your department? base: 500 risk manager respondents
6%
6%
28%
59%
3 or more
2
1
none
mean: 0.6median: 0
12
National Underwriter Property & Casualty 2016 Risk Management Compensation Survey
FINDINGS: ORGANIZATION PROFILE
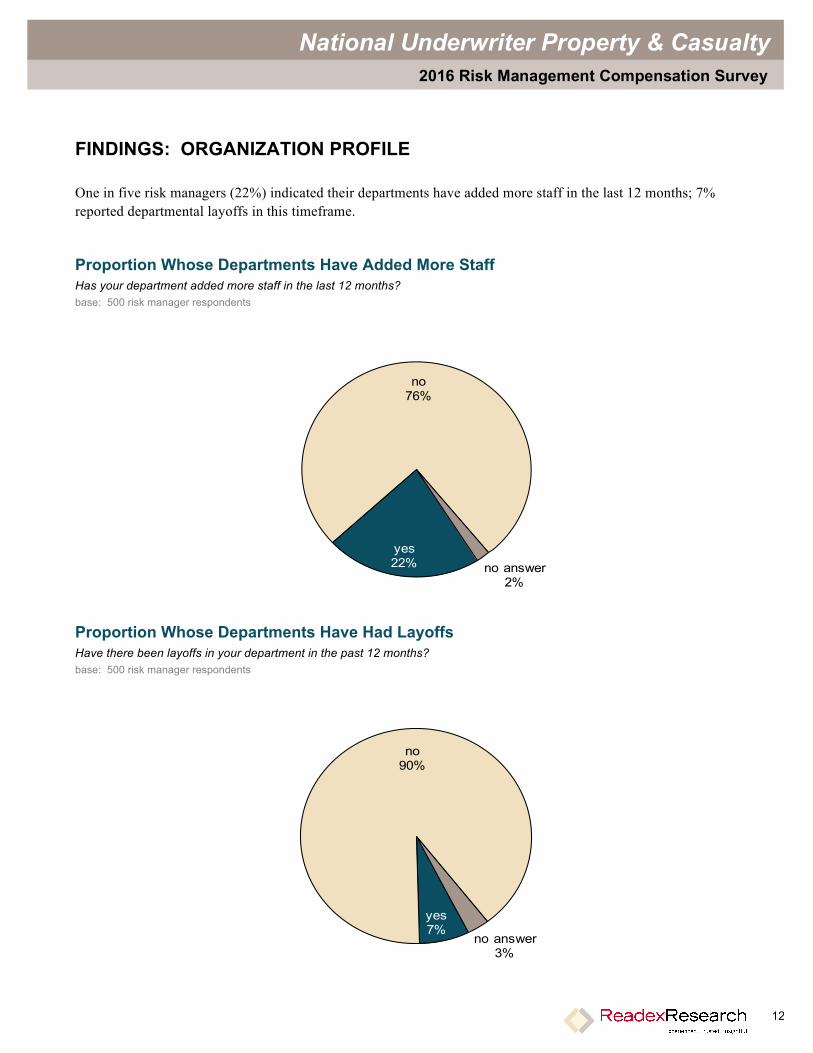
One in five risk managers (22%) indicated their departments have added more staff in the last 12 months; 7% reported departmental layoffs in this timeframe.
Proportion Whose Departments Have Added More Staff Has your department added more staff in the last 12 months? base: 500 risk manager respondents
yes22%
no76%
no answer2%
Proportion Whose Departments Have Had Layoffs Have there been layoffs in your department in the past 12 months? base: 500 risk manager respondents
yes7%
no90%
no answer3%

13
National Underwriter Property & Casualty 2016 Risk Management Compensation Survey
FINDINGS: ORGANIZATION PROFILE
Two in five risk managers (39%) reported their organizations utilize at least one captive insurer. These captive insurance companies are most commonly domiciled in Bermuda, Cayman, and Vermont.
Number of Captive Insurers Utilized by Organization How many captive insurers does your organization utilize? base: 500 risk manager respondents
4%
0%
2%
9%
24%
57%
5 or more
4
3
2
1
none
mean: 0.7median: 0
Locations of Captive Insurance Companies Where are these captive insurance companies domiciled? base: 197 risk manager respondents whose organizations utilize captive insurers (multiple answers)
27%
23%
22%
8%
6%
5%
5%
5%
4%
3%
2%
1%
17%
Bermuda
Cayman
Vermont
New York
Connecticut
England
South Carolina
Hawaii
Arizona
Guernsey
Ireland
Barbados
other

14
National Underwriter Property & Casualty 2016 Risk Management Compensation Survey
FINDINGS: COMPENSATION
The typical full-time risk manager reported an annual base salary as of January 1, 2016, of $115,000.
Two in three risk managers (67%) indicated their base salaries increased compared with one year prior; the average change in salary was 3.3%. One in four (25%) reported no change, and very few (1%) reported a decrease.
Annual Base Salary [Full-Time Risk Managers] As of January 1, 2016, what was your annual base salary? Exclude overtime, draws, commissions, bonuses, incentive pay, profit sharing, retirement benefits paid, other cash compensation, and the monetary value of any other benefits. base: 422 full-time risk manager respondents (fill-in answers)
1%
7%
8%
9%
14%
22%
19%
10%
3%
2%
$300,000 or more
$200,000 - $299,999
$175,000 - $199,999
$150,000 - $174,999
$125,000 - $149,999
$100,000 - $124,999
$75,000 - $99,999
$50,000 - $74,999
less than $50,000
nothing
median: $115,000
Change in Annual Base Salary Compared with one year prior, how did your annual base salary change as of January 1, 2016? base: 500 risk manager respondents
67%
25%
1%
4%
INCREASED
NO CHANGE
DECREASED
cannot compare; not in sameposition as one year prior
mean: 3.3%median: 3%

15
National Underwriter Property & Casualty 2016 Risk Management Compensation Survey
Following is an analysis of full-time annual base salary as of January 1, 2016, by a variety of variables to better understand how risk manager characteristics relate to compensation. Three percentile values are reported for each measure: 25% of full-time risk managers earn less than the 25th percentile, 50% earn less than the 50th percentile (or median), and 75% earn less than the 75th.
Annual Base Salary by Segment [Full-Time Risk Managers] As of January 1, 2016, what was your annual base salary? Exclude overtime, draws, commissions, bonuses, incentive pay, profit sharing, retirement benefits paid, other cash compensation, and the monetary value of any other benefits. base: full-time risk manager respondents in each segment (fill-in answers)
n 25th
percentile
50th percentile (median)
75th percentile
Title
risk manager 137 $77,000 $96,000 $120,000
president/RM 11 $120,000 $175,000 $225,000
vice president/RM 55 $126,000 $170,000 $200,000
director/RM 122 $105,800 $130,000 $160,000
chief risk officer 8 $118,500 $138,000 $148,800
insurance/risk admin 12 $49,500 $71,000 $88,100
Years of Corporate Risk Mgmt Experience
30+ 43 $100,000 $135,000 $180,000
20 - 29 116 $107,500 $130,000 $179,800
10 - 19 145 $90,000 $114,000 $145,500
5 - 9 45 $79,900 $93,300 $117,000
3 - 4 18 $77,800 $90,000 $108,500
<3 12 $50,000 $62,500 $72,900
none 18 $34,500 $75,100 $104,300
Education
Ph.D, LLB/JD, MBA/MA/MS 154 $99,800 $129,800 $166,000
BA/BBA/BS 349 $90,000 $117,000 $158,000
none of these 49 $58,500 $90,000 $120,000
Job Satisfaction (5-point scale)
satisfied (rating of 4 or 5) 321 $88,000 $118,000 $155,000
neutral (rating of 3) 60 $79,600 $101,600 $130,400
not satisfied (rating of 1 or 2) 15 $85,000 $105,000 $155,000
Region
Northeast 68 $110,000 $135,000 $180,000
Midwest 101 $73,000 $107,000 $142,900
South 148 $82,300 $105,500 $143,600
West 69 $91,500 $115,000 $147,700

16
National Underwriter Property & Casualty 2016 Risk Management Compensation Survey
…continued
Annual Base Salary by Segment [Full-Time Risk Managers] As of January 1, 2016, what was your annual base salary? Exclude overtime, draws, commissions, bonuses, incentive pay, profit sharing, retirement benefits paid, other cash compensation, and the monetary value of any other benefits. base: full-time risk manager respondents in each segment (fill-in answers)
n 25th
percentile
50th percentile (median)
75th percentile
Industry
healthcare, drug/pharmaceutical 78 $88,000 $110,500 $136,300
government, public works 43 $73,000 $99,100 $121,300
manufacturing 34 $110,800 $147,000 $185,000
insurance 36 $60,000 $94,800 $134,700
education 28 $73,700 $104,500 $131,200
transportation 17 $78,100 $95,000 $152,500
financial services 13 $92,500 $100,000 $176,600
utility 14 $99,800 $116,800 $143,800
oil/petrochemical, chemical 13 $82,600 $120,000 $167,500
real estate 15 $113,200 $150,000 $175,000
construction 10 $68,300 $117,500 $195,000
food industry, restaurant 7 $88,000 $101,900 $142,000
retail, consumer products 21 $98,000 $120,000 $165,500
technology, IT 7 $144,000 $166,000 $198,500
entertainment 1 * * *
hotel/hospitality 10 $82,500 $117,500 $164,800
metals/mining, natural resources 7 $97,900 $135,000 $156,000
Organization's Sales Volume
$12 billion+ 55 $115,000 $144,200 $185,000
$4.0 - $11.9 billion 52 $110,800 $150,000 $190,000
$1.0 - $3.9 billion 87 $97,900 $130,500 $166,000
$500.0 - $999.9 million 33 $90,000 $117,400 $146,000
$100.0 - $499.9 million 49 $81,000 $106,000 $121,500
$1.0 - $99.9 million 57 $66,300 $88,000 $120,000
<$1.0 million 28 $50,300 $85,000 $100,000
*results not shown if fewer than 5 valid values
17
National Underwriter Property & Casualty 2016 Risk Management Compensation Survey
FINDINGS: COMPENSATION
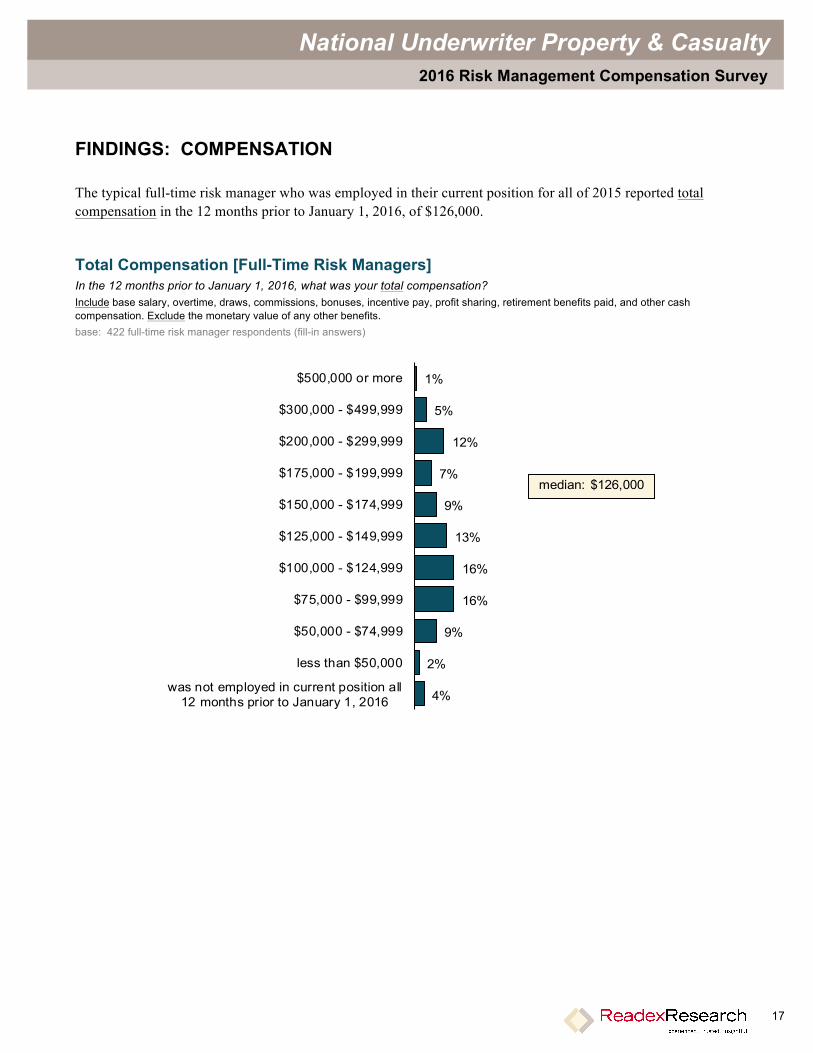
The typical full-time risk manager who was employed in their current position for all of 2015 reported total compensation in the 12 months prior to January 1, 2016, of $126,000.
Total Compensation [Full-Time Risk Managers] In the 12 months prior to January 1, 2016, what was your total compensation? Include base salary, overtime, draws, commissions, bonuses, incentive pay, profit sharing, retirement benefits paid, and other cash compensation. Exclude the monetary value of any other benefits. base: 422 full-time risk manager respondents (fill-in answers)
1%
5%
12%
7%
9%
13%
16%
16%
9%
2%
4%
$500,000 or more
$300,000 - $499,999
$200,000 - $299,999
$175,000 - $199,999
$150,000 - $174,999
$125,000 - $149,999
$100,000 - $124,999
$75,000 - $99,999
$50,000 - $74,999
less than $50,000
was not employed in current position all12 months prior to January 1, 2016
median: $126,000

18
National Underwriter Property & Casualty 2016 Risk Management Compensation Survey
Following is an analysis of total compensation as of January 1, 2016, by a variety of variables. Results are based on full-time risk managers who were employed in their current position all 12 months prior to this date.
Total Compensation by Segment [Full-Time Risk Managers in Position All of 2015] In the 12 months prior to January 1, 2016, what was your total compensation? Include base salary, overtime, draws, commissions, bonuses, incentive pay, profit sharing, retirement benefits paid, and other cash compensation. Exclude the monetary value of any other benefits. base: full-time risk manager respondents in each segment who were employed in their
current position all 12 months prior to January 1, 2016 (fill-in answers)
n 25th
percentile
50th percentile (median)
75th percentile
Title
risk manager 131 $80,000 $101,000 $145,000
president/RM 11 $140,000 $200,000 $275,000
vice president/RM 55 $140,000 $200,000 $260,000
director/RM 119 $115,000 $140,000 $185,000
chief risk officer 8 $136,400 $145,500 $213,500
insurance/risk admin 10 $60,800 $72,100 $100,600
Years of Corporate Risk Mgmt Experience
30+ 42 $111,000 $169,300 $227,500
20 - 29 112 $120,000 $152,500 $210,300
10 - 19 141 $95,000 $125,000 $167,000
5 - 9 41 $83,400 $103,000 $125,100
3 - 4 17 $77,500 $92,000 $124,000
<3 12 $50,000 $67,500 $92,900
none 16 $56,000 $76,100 $129,000
Education
Ph.D, LLB/JD, MBA/MA/MS 147 $105,000 $145,000 $194,000
BA/BBA/BS 334 $97,000 $130,000 $185,500
none of these 48 $73,000 $92,500 $140,000
Job Satisfaction (5-point scale)
satisfied (rating of 4 or 5) 311 $95,000 $129,000 $184,000
neutral (rating of 3) 57 $83,200 $109,000 $150,000
not satisfied (rating of 1 or 2) 12 $86,200 $143,000 $176,300
Region
Northeast 66 $119,000 $172,500 $225,000
Midwest 98 $83,500 $119,500 $168,100
South 141 $86,400 $119,000 $170,300
West 65 $97,600 $130,000 $151,300

19
National Underwriter Property & Casualty 2016 Risk Management Compensation Survey
…continued
Total Compensation by Segment [Full-Time Risk Managers in Position All of 2015] In the 12 months prior to January 1, 2016, what was your total compensation? Include base salary, overtime, draws, commissions, bonuses, incentive pay, profit sharing, retirement benefits paid, and other cash compensation. Exclude the monetary value of any other benefits. base: full-time risk manager respondents in each segment who were employed in their
current position all 12 months prior to January 1, 2016 (fill-in answers)
n 25th
percentile
50th percentile (median)
75th percentile
Industry
healthcare, drug/pharmaceutical 74 $91,500 $119,300 $157,800
government, public works 43 $73,000 $104,400 $126,000
manufacturing 34 $122,800 $172,500 $246,300
insurance 33 $71,800 $113,000 $163,000
education 27 $74,300 $118,000 $136,300
transportation 16 $83,800 $128,000 $187,500
financial services 12 $102,300 $132,500 $217,500
utility 14 $105,300 $125,000 $157,500
oil/petrochemical, chemical 12 $97,900 $167,800 $278,000
real estate 15 $130,000 $191,000 $255,100
construction 10 $73,900 $147,500 $356,300
food industry, restaurant 7 $99,000 $129,300 $162,000
retail, consumer products 20 $111,300 $142,500 $187,500
technology, IT 7 $159,000 $180,000 $275,000
entertainment 1 * * *
hotel/hospitality 10 $82,800 $155,000 $219,000
metals/mining, natural resources 6 $101,500 $160,000 $195,000
Organization's Sales Volume
$12 billion+ 52 $130,000 $187,500 $257,500
$4.0 - $11.9 billion 51 $122,000 $180,000 $218,000
$1.0 - $3.9 billion 85 $103,800 $140,000 $181,100
$500.0 - $999.9 million 32 $93,300 $133,400 $156,000
$100.0 - $499.9 million 47 $83,000 $116,000 $146,000
$1.0 - $99.9 million 55 $72,000 $94,000 $138,000
<$1.0 million 24 $70,400 $85,000 $100,000
*results not shown if fewer than 5 valid values

20
National Underwriter Property & Casualty 2016 Risk Management Compensation Survey
FINDINGS: BENEFITS
Whether they make use of them or not, risk managers have a variety of benefits available to them, offered by their employers. Among the 91% whose employers offer life insurance, the typical amount of company-paid life insurance received is $104,000.
Benefits Offered What benefits does your employer offer (whether you make use of them or not)? base: 500 risk manager respondents (multiple answers)
medical insurance 95% tuition reimbursement 54%
dental insurance 91% health/wellness membership/benefits 54%
life insurance 91% flexible working hours 44%
vision insurance 84% pension 35%
other retirement benefits (401(k), etc.) 80% long-term care insurance 35%
long-term disability insurance 77% employer stock** 25%
flexible spending account 77% gas allowance 16%
short-term disability insurance 75% supplemental vacation 13%
professional development* 68% company car 13%
professional dues paid or reimbursed 63% daycare allowance or onsite daycare 10%
company laptop or home computer 58% other 2%
company cell phone 58% AT LEAST ONE 98%
*e.g., conference allowance/reimbursement **awards, options, employee purchase, or other types
Amount of Company-Paid Life Insurance Received How much company-paid life insurance do you receive? Do not include life insurance you pay for. base: 456 risk manager respondents whose employers offer life insurance (fill-in answers)
6%
9%
11%
10%
17%
20%
12%
5%
$500,000 or more
$300,000 - $499,999
$200,000 - $299,999
$150,000 - $199,999
$100,000 - $149,999
$50,000 - $99,999
less than $50,000
none
median: $104,000