risk-lab - storage.googleapis.com a stand-alone application, risk-lab is independent to the...
TRANSCRIPT

Risk-LabConnectivity
Risk-Lab can run Monte-Carlo simulations of any
model designed in MS Excel®.
It does not require the use of add-ins or macros
Productivity
Risk-Lab employs a streamlined object-oriented user
interface, with presentation-quality graphics and tables.
All results can be easily exported.
It operates with any version of MS Excel®.
It is possible to simulate cells containing formulas.
Being a portable application, it is possible to take the
software with you in a USB flash drive or cloud drive
and use it on any PC connected to the web.
Dependability
Being a stand-alone application, Risk-Lab is independent
to the spreadsheet. Model design and analysis may be
entirely conducted inside its specialized environment.
Designed for decision-making
Risk-Lab can help you detect which variables have more
impact on results, model past behavior of data series, fit
statistical distributions for assumptions, calculate inter-
variable correlations, percentiles and more.
Risk-Lab implements state-of-the-art Elliptic and
Archimedean copulas to generate random scenarios.
Site licenses allow an institution to provide Risk-Lab
access to a whole community in one simple step. No
individual PC installations are needed.
System overviewRisk-Lab

Welcome to a better user experienceProgram interface
Projects and models are configured
and analyzed from Risk-Lab’s
specialized interface outside the
spreadsheet.
Risk-Lab transparently communicates
with MS Excel® spreadsheets to
automatically introduce simulated
scenarios and retrieve results at high
speed.
Say goodbye to spreadsheet chaos.
The structure and results of your
models will be always available and
neatly presented inside Risk-Lab.
Risk-Lab
Remote spreadsheet operationModel simulation
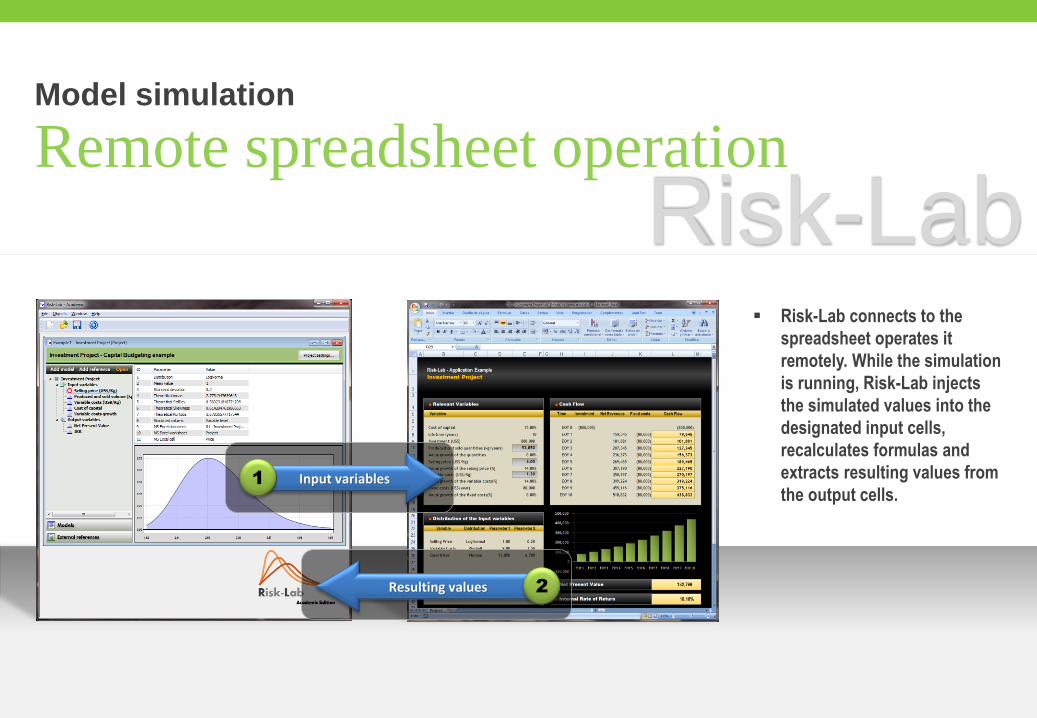
Risk-Lab Risk-Lab connects to the
spreadsheet operates it
remotely. While the simulation
is running, Risk-Lab injects
the simulated values into the
designated input cells,
recalculates formulas and
extracts resulting values from
the output cells.Input variables1
Resulting values 2
Statistical distributionsAssumptions
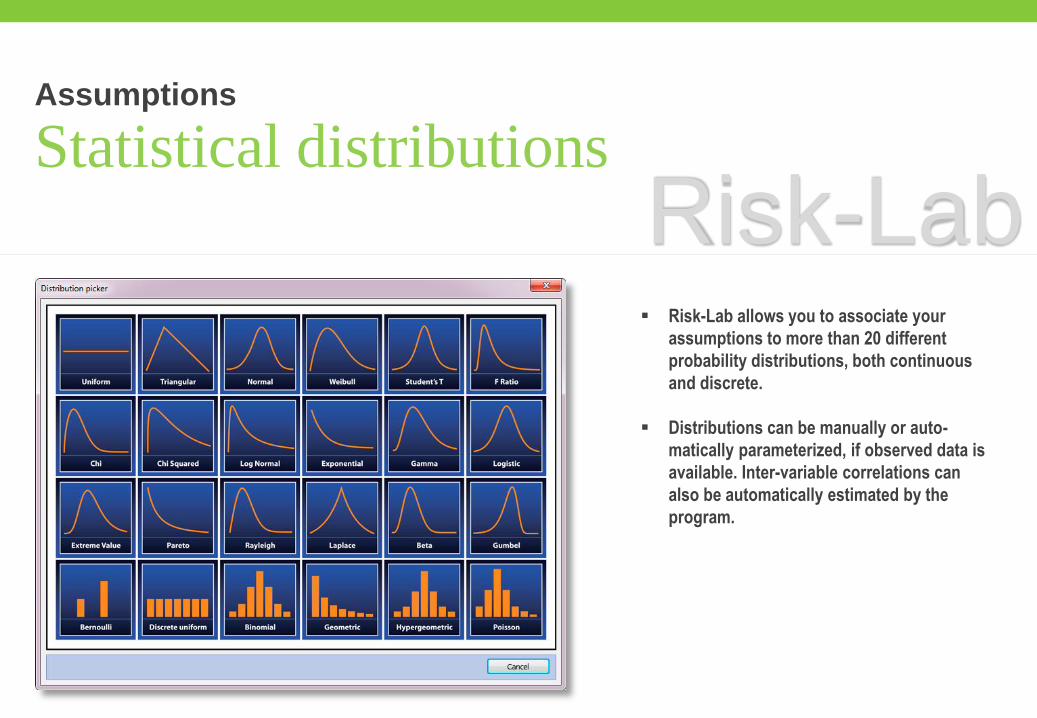
Risk-Lab allows you to associate your
assumptions to more than 20 different
probability distributions, both continuous
and discrete.
Distributions can be manually or auto-
matically parameterized, if observed data is
available. Inter-variable correlations can
also be automatically estimated by the
program.
Risk-Lab
Mutivariate copulasScenario generation
Risk-Lab
-3 -2.5 -2 -1.5 -1 -0.5 0 0.5 1 1.5 2 2.5 3
-3
-2.2
-1.4
-0.6
0.2
1
1.8
2.6
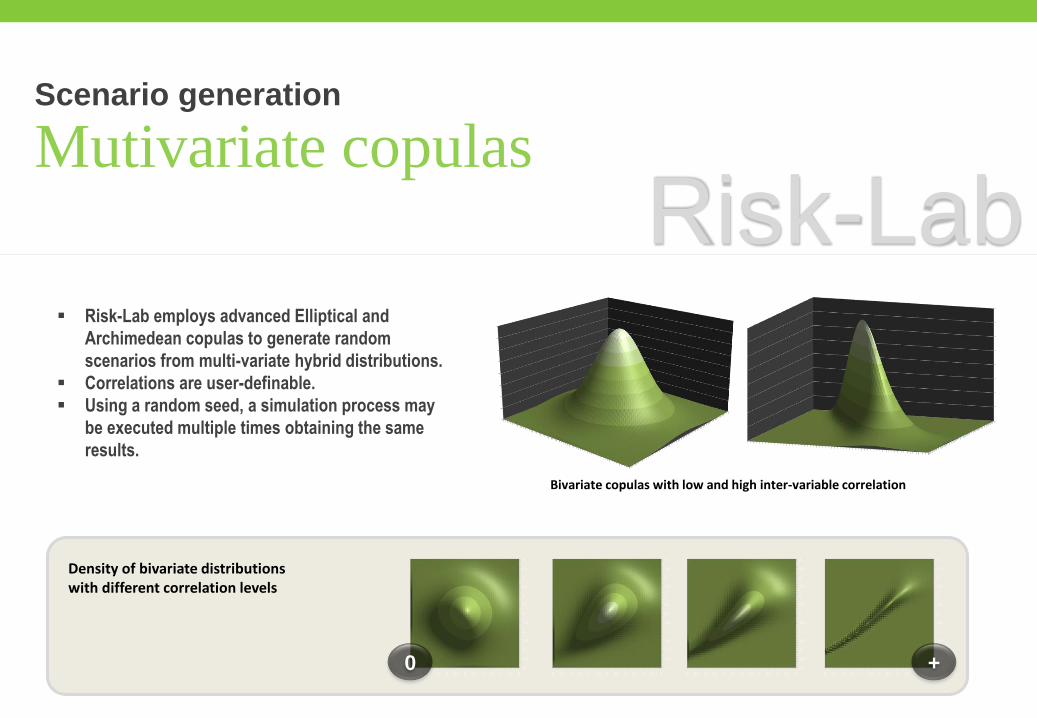
Bivariate copulas with low and high inter-variable correlation
-3
-2.5
-2
-1.5
-1
-0.5
0
0.5
1
1.5
2
2.5
3
-3 -2.5 -2 -1.5 -1 -0.5 0 0.5 1 1.5 2 2.5 3
-3
-2.5
-2
-1.5
-1
-0.5
0
0.5
1
1.5
2
2.5
3
-3 -2.5 -2 -1.5 -1 -0.5 0 0.5 1 1.5 2 2.5 3
-3
-2.5
-2
-1.5
-1
-0.5
0
0.5
1
1.5
2
2.5
3
-3 -2.5 -2 -1.5 -1 -0.5 0 0.5 1 1.5 2 2.5 3
-3
-2.5
-2
-1.5
-1
-0.5
0
0.5
1
1.5
2
2.5
3
-3 -2.5 -2 -1.5 -1 -0.5 0 0.5 1 1.5 2 2.5 3
0 +
Density of bivariate distributionswith different correlation levels
Risk-Lab employs advanced Elliptical and
Archimedean copulas to generate random
scenarios from multi-variate hybrid distributions.
Correlations are user-definable.
Using a random seed, a simulation process may
be executed multiple times obtaining the same
results.
-3 -2.5
-2 -1.5
-1 -0.5
0 0.5
1 1.5
2 2.5
3
-3
-2.5
-2
-1.5
-1
-0.5 0
0.5 1
1.5
2
2.5
3
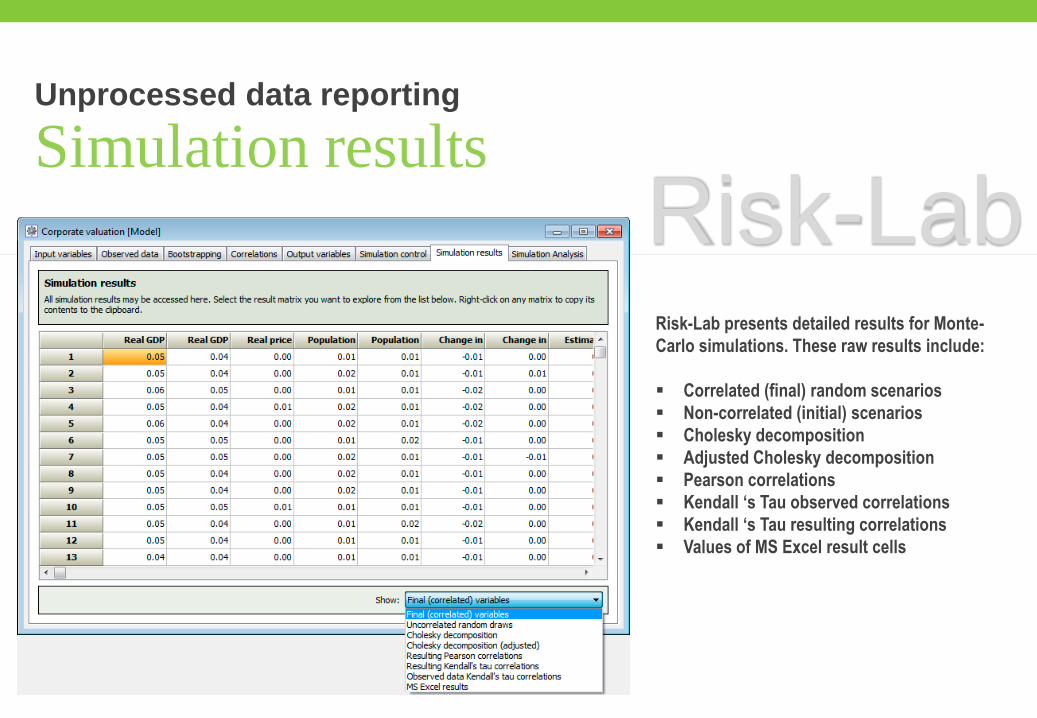
Simulation resultsUnprocessed data reporting
Risk-LabRisk-Lab presents detailed results for Monte-
Carlo simulations. These raw results include:
Correlated (final) random scenarios
Non-correlated (initial) scenarios
Cholesky decomposition
Adjusted Cholesky decomposition
Pearson correlations
Kendall ‘s Tau observed correlations
Kendall ‘s Tau resulting correlations
Values of MS Excel result cells
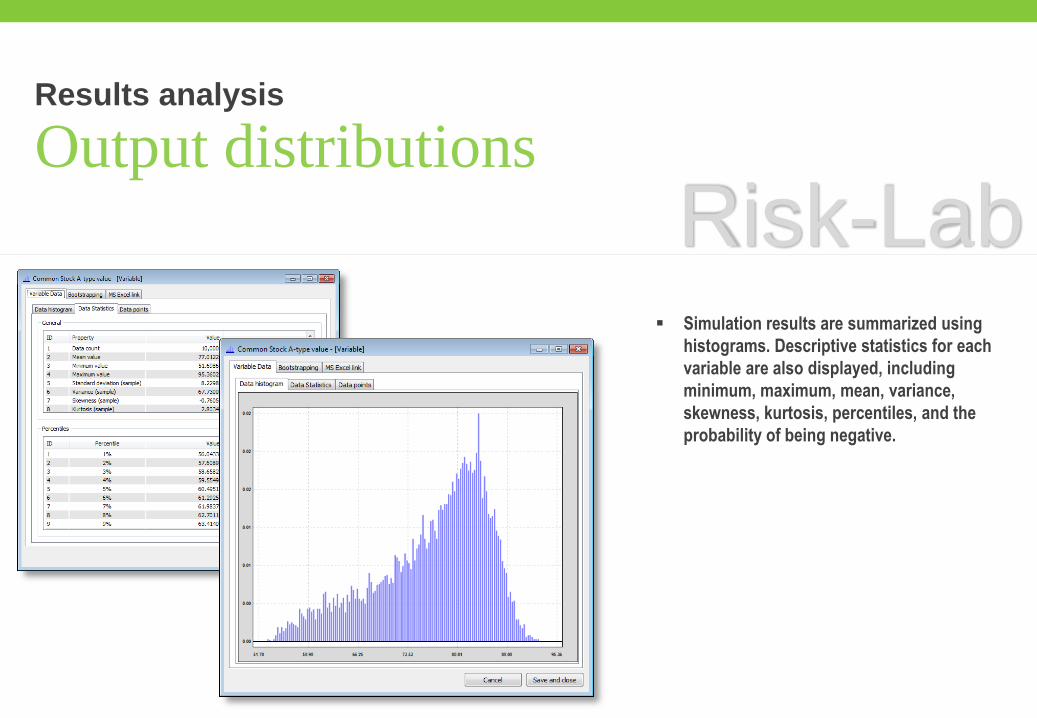
Output distributionsResults analysis
Simulation results are summarized using
histograms. Descriptive statistics for each
variable are also displayed, including
minimum, maximum, mean, variance,
skewness, kurtosis, percentiles, and the
probability of being negative.
Risk-Lab
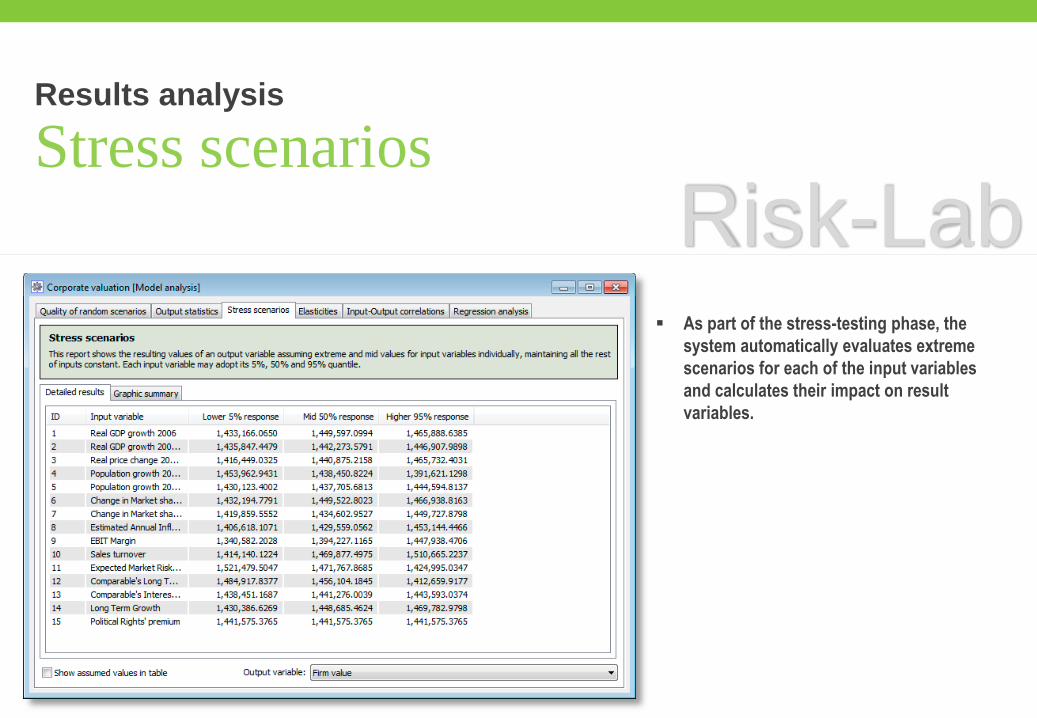
Stress scenariosResults analysis
As part of the stress-testing phase, the
system automatically evaluates extreme
scenarios for each of the input variables
and calculates their impact on result
variables.
Risk-Lab
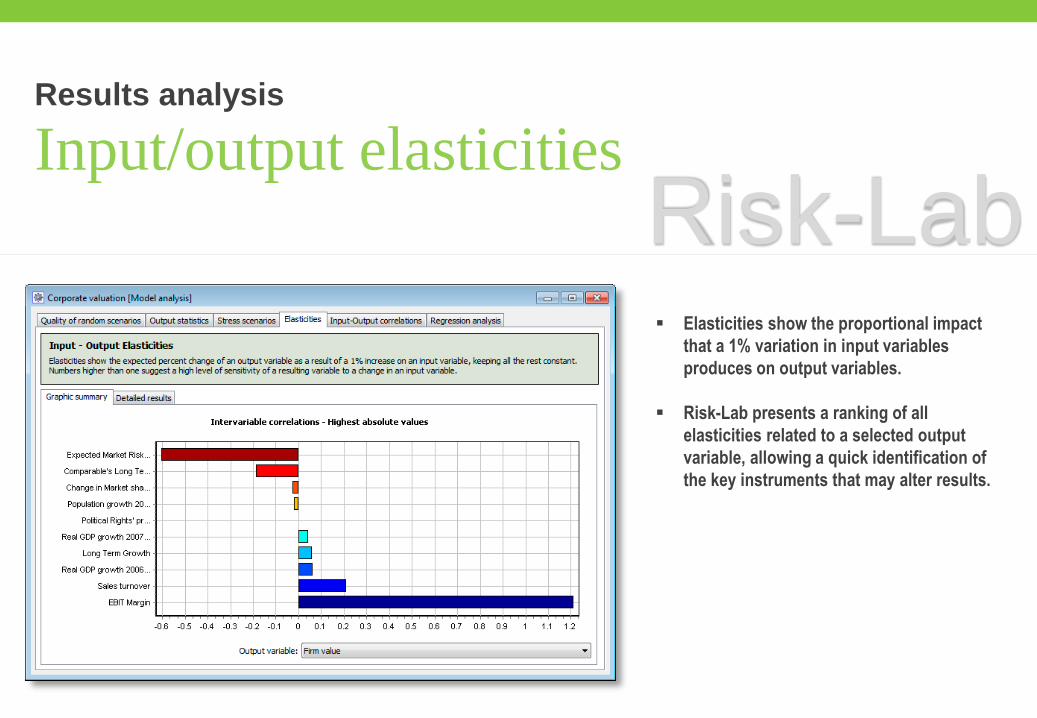
Input/output elasticitiesResults analysis
Risk-Lab Elasticities show the proportional impact
that a 1% variation in input variables
produces on output variables.
Risk-Lab presents a ranking of all
elasticities related to a selected output
variable, allowing a quick identification of
the key instruments that may alter results.

Multivariate regressionResults analysis
Risk-Lab Mutivariate regression analysis makes it
possible to indentify the marginal impact
of each input variable on outputs once the
effect of all the rest of variables is
simultaneously considered.
Risk-Lab also presents indicators that
help to assess the statistical relevance of
individual impacts.
Employing easy-to-read flags, the program
classifies variables according to their
statistical significance.
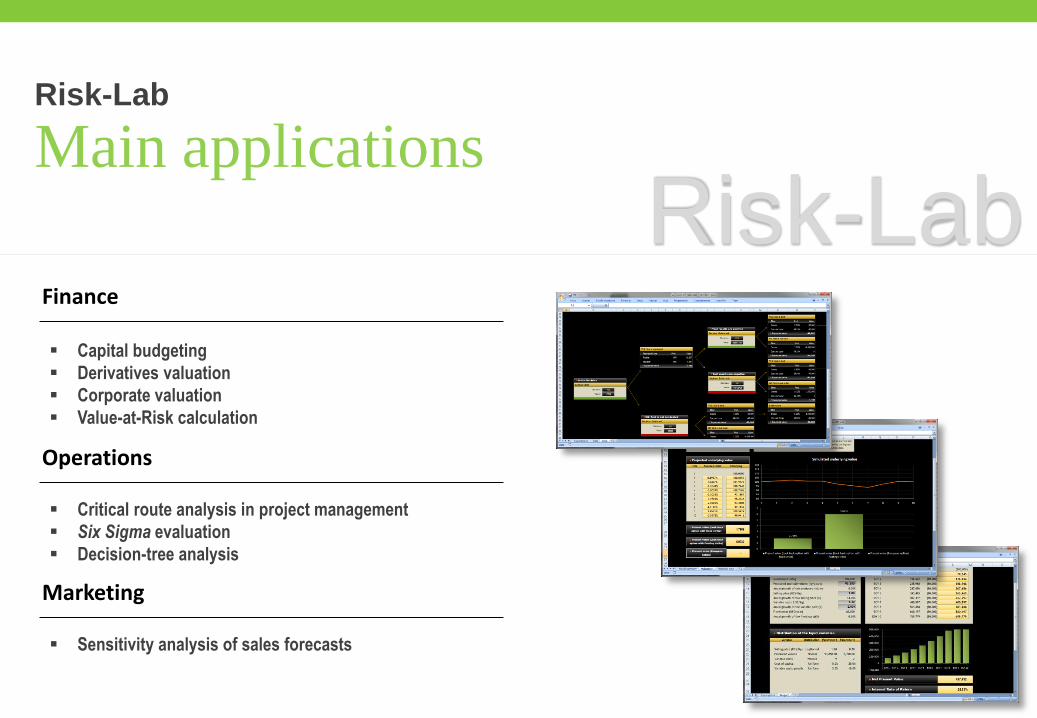
Main applicationsRisk-Lab
Risk-Lab
Capital budgeting
Derivatives valuation
Corporate valuation
Value-at-Risk calculation
Finance
Critical route analysis in project management
Six Sigma evaluation
Decision-tree analysis
Operations
Sensitivity analysis of sales forecasts
Marketing
Contact informationRisk-Lab
By eMail
By phone
Risk-Lab is a registered trademarkof RISKO – www.risk-o.com
+1-800-573-7475
+1-800-573-RISK