risk dashboard - eba.europa.eu
TRANSCRIPT

RISK DASHBOARD
DATA AS OF Q2 2021

2
Contents1 Summary 3
2 Overview of the main risks and vulnerabilities in the EU banking sector 4
3 Heatmap 5
4 Risk Indicators (RIs)
4.1 Solvency Tier 1 capital ratio 6
Total capital ratio 7
CET1 ratio 8
CET1 ratio (fully loaded) 9
Leverage ratio 10
Leverage ratio (fully phased-in definition of Tier 1) 11
4.2 Credit Risk and Asset Quality Ratio of non-performing loans and advances (NPL ratio) 12
Coverage ratio for non-performing loans and advances 13
Forbearance ratio for loans and advances 14
Ratio of non-performing exposures (NPE ratio) 15
4.3 Profitability Return on equity 16
Return on assets 17
Cost to income ratio 18
Net interest income to total net operating income 19
Net fee and commission income to total net operating income 20
Net trading income to total net operating income 21
Net interest margin 22
Cost of Risk 23
4.4 Funding and Liquidity Loan-to-deposit ratio (for households and non-financial corporations)
24
Asset encumbrance ratio 25
Liquidity coverage ratio (%) 26
5 Annex 1: Statistical Annex Asset composition and volumes 28
Loans: composition and asset quality 29
Loans: NPL and coverage ratios 30
Distribution of NFC loans and advances by NACE code 31
NPL ratios of NFC loans and advances by NACE code 32
Exposures to Real Estate activities and Construction 33
IFRS9 specific data 34
Sovereign exposures 35
Liability composition and volumes 36
Composition of own funds and risk-weighted assets 37
Profitability analysis: main drivers within RoE 38
EBA-compliant Moratoria 39
Public guarantee schemes 40
6 Annex 2: Methodological note on the RIs heatmap 41
7 Annex 3: The RI and Annex database 43

3
List of Institutions for Supervisory Reporting
The Liquidity Coverage Ratio (LCR) remained high. The LCR declined from 173.6% in Q1 to 172.4% in Q2 2021. Thecontraction of the loan to deposit ratio continued. Its dispersion shows that the lower end of the LCR’s 5th percentile remainswell above 100%. It was down from 110.9% in Q1 to 108.9% in Q2 due to a strong increase in deposits from households. Therelatively strong increase in the asset encumbrance ratio during the previous quarter flattened again, slightly rising from28.8% as of Q1 to 29.1% in Q2 2021.
*)This risk dashboard is based on a sample of Risk Indicators (RI) from 161 European banks (unconsolidated number of banks, including 30 subsidiaries). The sample of banks is reviewed annually by competent authorities and adjusted accordingly. This
can determine breaks in the time series. In particular, from Q1 2020 onwards, EU aggregates no longer include figures for UK banks but for subsidiaries of UK banks in EU countries. Ratios provided in the text are weighted average if not otherwise stated.
The data is based on the EBA’s implementing technical standards (ITS) on supervisory reporting (EU Regulation No 680/2014 and it subsequent amendments). In the chart on Risk Indicators by size class, considering the distribution of the average total
assets, the small banks are those below the first quartile, the large banks are those above the third quartile.
Summary*
Banks maintained strong capital levels in the second quarter. The average CET1 ratio reached 15.5% on a fully loaded basisby end Q2. This reflects a small increase in CET1 capital as well as an increase in risk weighted assets (RWA). The leverage ratioincreased (from 5.6% in Q1 2021 to 5.7% in Q2 2021) on a fully loaded basis. This reflects higher capital as well as a slightdecrease of total assets relative to Q1 2021. The decline in assets was driven by debt securities and derivatives, partiallycounterbalanced by an increase in cash balances (including deposits with central banks). The RWA composition showed arising share of credit RWA (from 82.8% in Q1 to 83.2% in Q2) whereas both the share of market risk (from 3.6% to 3.3%) andoperational risk (from 10% to 9.8%) declined.
Asset quality continued to improve albeit with an increase in forborne loans. The aggregate non-performing loan (NPL) ratiocontinued to decline, reaching 2.3% at end Q2. For household exposures the NPL ratio declined from 2.9% in Q1 to 2.7% in Q22021, and for loans to non-financial corporates (NFCs) from 4.7% to 4.4%. Even sub-segments commonly considered to be ofhigher risk saw lower NPL ratios like for SME loans (down from 6.1% to 5.9% QoQ) and for CRE financing (down from 6.4% to5.9% QoQ). Due to uneven impacts of the pandemic on corporates, sector level data shows increasing divergence of assetquality. NPL ratios are even further up for accommodation and food services from 9% to 9.6% QoQ and for arts,entertainment and recreation from 7.9% to 8.2%. Forborne loans kept on rising, and were up by 3.7% in Q2, with theforbearance ratio increasing by 10 bps to 2.1% in Q2. The stage 2 ratio declined from 9.0% to 8.8% QoQ.
Visible signs of deterioration for loans under moratoria and exposures under public guarantee schemes (PGS). Loanvolumes under existing EBA eligible moratoria declined further in Q2. They were down by nearly EUR 80bn to now EUR123.4bn. The rise of PGS loans stopped, reaching around EUR 377bn in Q2 (around EUR 378bn in Q1 2021). The NPL ratioincreased from 3.9% to 4.5% for loans under current moratoria, from 4.5% to 4.7% for loans under expired moratoria andfrom 1.4% to 2.0% for PGS exposures. In Q2 2021 the share of stage 2 loans increased by 1p.p. to 28.2% for loans currentlyunder moratoria while it reached 24.4% (up from 23.6% in the previous quarter) for loans with expired moratoria. For PGSexposures it increased from 13.6% to 18.5%.
Profitability remained stable this quarter. Return on equity (RoE) decreased to 7.4% in Q2 2021 from 7.7% in the previousquarter, with the lower end of the 5th percentile moving further into negative territory. Net interest income as a share ofequity remained stable QoQ at 17.1%, and the net interest margin was unchanged, too (124bps). Net fee & commissionincome continued its rising trend reaching 9.8%, while net trading income dropped from 3.7% to 2.4%. The cost to incomeratio increased from 63.6% in Q1 2021 to 64.0% in Q2 2021. This was not least driven by staff expenses, whose share of equityincreased from 10.2% to 10.5% QoQ, continuing a trend seen in previous quarters. However, other administrative expenses asshare of equity reverted their rising trend and declined from 8.3% as of Q1 2021 to 8.0% in Q2 2021.

4
Last risk dash-board
Current
- 1 - 1
- 1 - 1
1 1
- 1 0
0 0
- 1 0 1
High Medium Low
Increasing Stable Decreasing
Operational resilience
Cyber and information and communication technology (ICT) related risks remain elevated even though no major successful cyber-attack has been reported. Amid higher levels of online banking and remote working following the pandemic as well as increasedreliance on third party providers related risks, banks' ICT systems remain vulnerable to significant disruptions in their operations.Conduct related risks remain high, too, stemming from and affecting different areas, including issues related to COVID-19 supportmeasures and the upcoming LIBOR and EONIA replacements. Anti-money laundering (AML) settlements show that the legal,economic, and reputational consequences can last for several years and affect the whole banking sector. Inadequately addressedESG factors and considerations can impact institutions’ counterparties or invested assets and can increase conduct risk.
The level of risk and short-term outlook summarise, in a judgmental fashion, the probability of the materialisation of the risk factors and the likely impact on banks. The assessment takes into consideration the evolution of market and prudential indicators, Competent Authorities' and banks’ own assessments as well as analysts’ views. The short term outlook refers to a six months period.
Liquidity and funding
Primary markets have been active. Banks of different sizes and locations have come to the markets with different instrumentsacross the capital ladder. Client deposits overall increased, but with diverging trends for household and NFC clients: whereasdeposits from households continued their rising trend, NFC deposits declined. Yield increases seen earlier this year receded, andspreads are on very low levels. They have further contracted for subordinated instruments. Banks should manage their highliquidity positions while providing adequate lending levels to the economy.
Short-term outlook: Given current tight spreads, banks' abundant liquidity buffers, and the availability of extraordinary centralbank facilities, expectations are that banks will not face any major funding pressure. The phase out of central bank fundingsupport measures may become challenging for some institutions more dependent on them in the medium to long-term.
Profitability
Banks benefitted from the economic recovery, which not least resulted in lower impairments. The good performance of financialmarkets positively affected fee and commission, and trading income. Only net interest income did not show any major benefitfrom positive economic developments. There are indications of rising operating expenses amid a resumption of pre-pandemicworking arrangements incl. return to the office, resumption of some business travel and similar measures. Banks' initiatives toreduce headcount remained under pressure.
Short-term outlook: Banks' profitability remains strongly dependent on the economic recovery. Any setbacks might quickly affectcost of risk. Any major corrections on financial markets could negatively affect banks' profitability through lower net tradingincome or through a reduction in fee income from asset management activities. Competition, including from non-banks, remainsstrong, which might limit future upside in e.g. fee and commission income and could drive a further decline in the net interestmargin. Internal and external pressure might delay the streamlining of operating expenses that many institutions still need.Recently merged institutions need to proof that the expected synergies and scale economies outweigh restructuring costs.
Asset quality
Banks point to still positive loan growth across the board. This is clearly reflected in the ECB’s bank lending survey. However, withpublic guarantee schemes for loans coming to an end, lending growth has slowed. For larger non-financial corporates (NFC) thismay reflect increasing reliance on capital market funding. There are no indications of a major rise in insolvencies on broadaverage. The overall reduction in the NPL ratio was supported by NPL transactions. Asset quality deterioration is focused on thesectors most affected for instance by social distancing and travel restriction measures. The increase in forborne loans is primarilydriven by banks’ measures to proactively address deterioration in borrowers’ credit quality.
Short-term outlook: Improving macroeconomic conditions should support loan growth going forward as well as help supportasset quality. The impact of the phase out of COVID-related support measures on asset quality remains uncertain. It remainsparamount that banks keep on addressing any deterioration in asset quality proactively. Poor prospects for non-primecommercial real estate (CRE) might negatively affect the asset quality of CRE lending. Signs of overvaluation in residential realestate are also a source of concern. Concentration risks arising from central counterparties (CCPs) domiciled in the UK requirecontinued monitoring, particular in light of the possible expiry of the European Commission’s equivalence decision in June 2022.
Market risk
Market risks remain contained, although bouts of volatility in financial markets appeared from time to time. The potential changein inflation outlook and macroeconomic conditions affect conditions on financial markets given their impact on central bankpolicy choices. The risk of abrupt market corrections is a potential concern not least amid signs of overvaluation of assets amidvery accommodative monetary policy and support measures. Market participants remain vigilant and continue to track pandemic-related news.
Short-term outlook: Despite the current rather positive mood on financial markets, negative news related to the macroeconomicoutlook or the evolution of the pandemic might trigger an abrupt reversal of elevated asset prices. This risk might be exacerbatedif inflationary pressures prove more persistent than expected by central banks and the latter need to withdraw their stimulusearlier than anticipated by market participants. Increasing inflation might eventually translate into rising yields and volatility.Emerging market related exposures might be particularly vulnerable. Even though a rising share of financial market participantsseems to be prepared for the upcoming LIBOR and EONIA cessations, there might be significant exposures relying on them alsoafter their termination.
Overview of the main risks and vulnerabilities in the EU banking sector
Risk measure
Developments
Description
Risk level
Short-term
outlook

5
153 151 151 152 151 151 150 149 150 148 148 147 131 131 130 130 131 125
Threshold
Current vs previous quarters
for the worst bucket
201703 201706 201709 201712 201803 201806 201809 201812 201903 201906 201909 201912 202003 202006 202009 202012 202103 202106
> 15% 56.5% 56.7% 64.4% 71.1% 63.1% 60.8% 64.7% 68.2% 63.6% 67.2% 68.2% 74.6% 53.8% 62.5% 72.9% 77.2% 76.4% 75.7%
[12% - 15%] 37.6% 34.7% 33.4% 28.0% 36.0% 37.9% 33.9% 30.5% 35.5% 32.4% 31.1% 25.4% 45.6% 37.3% 26.9% 22.5% 23.4% 24.2%
< 12% 5.9% 8.6% 2.2% 0.9% 1.0% 1.3% 1.4% 1.3% 0.9% 0.5% 0.7% 0.0% 0.6% 0.2% 0.2% 0.2% 0.2% 0.2%
> 14% 49.8% 47.7% 53.2% 58.5% 49.3% 53.9% 50.6% 48.2% 51.1% 53.5% 48.4% 55.5% 45.0% 58.3% 61.6% 62.9% 63.1% 63.0%
[11% - 14%] 47.3% 45.3% 46.1% 41.3% 50.5% 41.1% 49.0% 51.1% 48.4% 46.0% 51.2% 44.5% 55.0% 41.5% 38.3% 37.0% 36.7% 36.5%
< 11% 2.9% 7.0% 0.6% 0.2% 0.2% 5.0% 0.4% 0.8% 0.5% 0.5% 0.5% 0.0% 0.0% 0.2% 0.2% 0.2% 0.2% 0.5%
> 8% 3.9% 4.1% 4.1% 5.0% 4.5% 4.2% 4.4% 4.9% 4.1% 4.3% 4.4% 5.5% 6.0% 4.6% 5.6% 5.9% 5.6% 6.6%
[5% - 8%] 45.0% 49.1% 53.2% 56.4% 52.0% 49.2% 51.0% 58.0% 50.6% 49.1% 51.1% 58.4% 46.0% 37.4% 54.2% 60.1% 54.4% 60.0%
< 5% 51.1% 46.7% 42.6% 38.6% 43.5% 46.6% 44.6% 37.1% 45.3% 46.5% 44.5% 36.1% 48.0% 58.0% 40.2% 34.0% 40.0% 33.3%
< 3% 46.1% 48.7% 54.6% 62.1% 62.4% 62.6% 63.5% 67.3% 67.4% 72.9% 73.0% 76.5% 69.7% 78.5% 78.7% 79.2% 78.9% 73.0%
[3% - 8%] 41.3% 39.2% 33.6% 27.1% 30.1% 30.7% 32.1% 28.7% 28.7% 23.2% 23.2% 20.2% 26.2% 17.6% 19.2% 18.7% 19.0% 25.1%
> 8% 12.5% 12.1% 11.8% 10.8% 7.5% 6.7% 4.5% 4.0% 3.9% 3.9% 3.9% 3.4% 4.1% 4.0% 2.1% 2.2% 2.0% 1.9%
> 55% 7.8% 9.6% 11.6% 8.6% 22.4% 17.8% 17.8% 14.0% 13.0% 12.9% 17.9% 17.9% 14.7% 14.8% 9.1% 8.6% 7.3% 15.3%
[40% - 55%] 45.7% 45.4% 44.1% 46.4% 31.5% 32.9% 32.0% 45.4% 39.1% 48.1% 35.5% 36.3% 55.7% 53.3% 59.4% 61.5% 60.9% 46.6%
< 40% 46.5% 45.0% 44.3% 45.1% 46.2% 49.3% 50.2% 40.6% 47.8% 38.9% 46.5% 45.8% 29.5% 31.8% 31.5% 29.9% 31.8% 38.1%
< 1.5% 48.3% 49.8% 49.8% 53.9% 52.8% 61.1% 64.5% 63.9% 64.2% 65.6% 65.7% 65.5% 64.5% 51.9% 50.8% 51.1% 42.0% 42.0%
[1.5% - 4%] 32.6% 31.4% 31.5% 29.8% 31.5% 23.9% 25.5% 28.2% 28.7% 28.1% 28.3% 28.5% 28.2% 40.8% 43.9% 40.7% 49.8% 49.1%
>4% 19.1% 18.8% 18.6% 16.4% 15.7% 15.0% 10.0% 7.9% 7.1% 6.2% 6.0% 6.1% 7.4% 7.3% 5.3% 8.2% 8.3% 8.8%
> 10% 17.7% 20.6% 22.9% 17.2% 15.5% 19.5% 13.6% 10.3% 13.3% 16.2% 14.0% 5.7% 2.3% 1.8% 5.1% 2.0% 14.8% 13.7%
[6% - 10%] 45.1% 44.2% 44.9% 36.5% 52.8% 51.1% 53.9% 55.5% 48.7% 56.8% 53.4% 41.9% 10.4% 17.6% 18.8% 19.2% 51.8% 58.6%
< 6% 37.1% 35.2% 32.2% 46.3% 31.7% 29.4% 32.5% 34.2% 38.0% 27.0% 32.5% 52.4% 87.3% 80.6% 76.0% 78.8% 33.4% 27.8%
< 50% 16.1% 17.1% 16.6% 13.3% 12.5% 12.5% 12.9% 13.0% 11.7% 12.0% 12.0% 12.0% 14.1% 13.4% 15.9% 16.5% 17.7% 16.0%
[50% - 60%] 16.2% 21.8% 22.5% 21.8% 18.7% 23.1% 20.4% 19.7% 19.4% 16.6% 24.5% 20.3% 8.2% 16.6% 13.0% 11.4% 12.8% 17.8%
> 60% 67.7% 61.1% 60.9% 64.9% 68.8% 64.4% 66.7% 67.3% 69.0% 71.5% 63.5% 67.7% 77.7% 70.0% 71.1% 72.2% 69.5% 66.2%
< 100% 27.3% 31.0% 30.8% 31.7% 31.2% 30.9% 30.5% 31.4% 32.2% 32.3% 32.6% 33.0% 13.9% 23.7% 28.9% 34.3% 40.3% 41.7%
[100% - 150%] 52.5% 51.2% 49.9% 51.5% 51.9% 52.1% 52.6% 52.0% 51.7% 51.7% 51.5% 51.2% 66.2% 57.5% 52.4% 47.4% 43.8% 43.5%
> 150% 20.3% 17.8% 19.4% 16.8% 17.0% 17.0% 17.0% 16.6% 16.0% 16.0% 15.9% 15.8% 19.9% 18.8% 18.7% 18.2% 15.9% 14.8%
RIs heatmap
Fund
ing
&
Liqu
idity
Solv
ency
Ratio of non-performing loans and advances (NPL ratio)
RI
Tier 1 capital ratio
CET1 ratio
Leverage ratio
Traffic light
Return on equity
Forbearance ratio for loans and advances
Cred
it Ri
sk &
Ass
et Q
ualit
y
Cost to income ratio
Loan-to-deposit ratio for households and
non-financial corporations
Prof
itabi
lity
Note: Traffic lights provide the trend of the KRI given the historical time series. Data bar colour scale: green for the "best bucket", yellow for the intermediate and red for the "worst bucket".
Coverage ratio of non-performing
loans and advances

6
Dec - 14 13.5% 11.7% 13.6% 16.2%
Jun - 15 13.9% 12.0% 13.7% 16.8%
Dec - 15 14.7% 13.0% 14.9% 18.8%Jun - 16 14.8% 13.0% 15.0% 18.5%Dec - 16 15.5% 13.0% 15.9% 19.9%Jun - 17 15.7% 13.6% 16.2% 19.6%Dec - 17 16.3% 14.3% 16.7% 21.1%
Jun - 18 16.0% 14.1% 16.7% 21.7%Dec - 18 16.3% 14.4% 16.7% 20.3%Jun - 19 16.2% 14.6% 16.5% 19.8%
Dec - 19 16.8% 15.2% 17.2% 20.4%Mar - 20 15.8% 14.3% 16.3% 19.9%Jun - 20 16.3% 14.8% 17.0% 20.1%Sep - 20 16.7% 15.3% 17.3% 20.5%Dec - 20 17.2% 15.8% 18.0% 21.3%Mar - 21 17.1% 15.7% 18.0% 21.1%Jun - 21 17.1% 15.6% 17.6% 21.3%
Weighted Averages by country. * Norwegian banks have not implemented yet the reporting framework based on CRR2/CRD5. Therefore, Norwegian figures are included in the EBA Risk dashboard only until March 2021.
Weighted average. Banks are classified in the size class according to their average total assets between Dec. 2014 and Jun. 2021. Non-FINREP banks are assigned to the bucket of small banks.
Period Weighted average 25th 50th 75th
5th and 95th pct, interquartile range and median. From Q1 2020 onwards, EU aggregates no longer include figures for UK banks and they include data for subsidiaries of UK banks in EU countries.
Total numerator and denominator.Dec 2014 =100.
Country dispersion (as of Jun. 2021) RI by size class
Solvency
1 - Tier 1 capital ratio
Dispersion Numerator and denominator: trends
90
95
100
105
110
115
120
125
130
135
Dec
- 14
Mar
- 15
Jun
- 15
Sep
- 15
Dec
- 15
Mar
- 16
Jun
- 16
Sep
- 16
Dec
- 16
Mar
- 17
Jun
- 17
Sep
- 17
Dec
- 17
Mar
- 18
Jun
- 18
Sep
- 18
Dec
- 18
Mar
- 19
Jun
- 19
Sep
- 19
Dec
- 19
Mar
- 20
Jun
- 20
Sep
- 20
Dec
- 20
Mar
- 21
Jun
- 21
Numerator: Tier 1 capitalDenominator: Total risk exposure amount
0%
5%
10%
15%
20%
25%
30%
35%
EE LV HR BG CZ IS LT SE RO DK LU IE BE FI MT NL SK CY PL DE IT FR HU AT PT SI ES GR N
O*
EU27 / EEA
12%
14%
16%
18%
20%
22%
24%
Dec
- 14
Mar
- 15
Jun
- 15
Sep
- 15
Dec
- 15
Mar
- 16
Jun
- 16
Sep
- 16
Dec
- 16
Mar
- 17
Jun
- 17
Sep
- 17
Dec
- 17
Mar
- 18
Jun
- 18
Sep
- 18
Dec
- 18
Mar
- 19
Jun
- 19
Sep
- 19
Dec
- 19
Mar
- 20
Jun
- 20
Sep
- 20
Dec
- 20
Mar
- 21
Jun
- 21
Small Medium All banks Large
0%
8%
16%
24%
32%
40%
48%
56%
Dec
- 14
Mar
- 15
Jun
- 15
Sep
- 15
Dec
- 15
Mar
- 16
Jun
- 16
Sep
- 16
Dec
- 16
Mar
- 17
Jun
- 17
Sep
- 17
Dec
- 17
Mar
- 18
Jun
- 18
Sep
- 18
Dec
- 18
Mar
- 19
Jun
- 19
Sep
- 19
Dec
- 19
Mar
- 20
Jun
- 20
Sep
- 20
Dec
- 20
Mar
- 21
Jun
- 21

7
Dec - 14 16.2% 13.9% 16.4% 19.4%
Jun - 15 16.7% 14.2% 16.6% 20.3%
Dec - 15 17.7% 14.8% 17.3% 22.9%Jun - 16 17.7% 15.1% 17.3% 22.7%Dec - 16 18.5% 15.2% 18.5% 23.5%Jun - 17 18.6% 16.0% 18.3% 23.9%Dec - 17 19.1% 16.3% 18.7% 23.9%
Jun - 18 18.8% 16.3% 19.0% 23.2%Dec - 18 19.0% 16.2% 19.1% 22.4%Jun - 19 18.9% 16.4% 19.0% 21.7%
Dec - 19 19.5% 17.1% 19.5% 23.0%Mar - 20 18.3% 16.6% 18.4% 21.7%Jun - 20 18.8% 17.1% 19.2% 22.2%Sep - 20 19.3% 17.6% 19.5% 22.5%Dec - 20 19.7% 18.1% 20.4% 23.9%Mar - 21 19.6% 17.9% 20.3% 23.3%Jun - 21 19.6% 17.9% 20.1% 23.1%
Weighted Averages by country. * Norwegian banks have not implemented yet the reporting framework based on CRR2/CRD5. Therefore, Norwegian figures are included in the EBA Risk dashboard only until March 2021.
Weighted average. Banks are classified in the size class according to their average total assets between Dec. 2014 and Jun. 2021. Non-FINREP banks are assigned to the bucket of small banks.
Period Weighted average 25th 50th 75th
5th and 95th pct, interquartile range and median.Total numerator and denominator.
Dec 2014 =100.
Country dispersion (as of Jun. 2021) RI by size class
Solvency
2 - Total capital ratio
Dispersion Numerator and denominator: trends
90
95
100
105
110
115
120
125
130
Dec
- 14
Mar
- 15
Jun
- 15
Sep
- 15
Dec
- 15
Mar
- 16
Jun
- 16
Sep
- 16
Dec
- 16
Mar
- 17
Jun
- 17
Sep
- 17
Dec
- 17
Mar
- 18
Jun
- 18
Sep
- 18
Dec
- 18
Mar
- 19
Jun
- 19
Sep
- 19
Dec
- 19
Mar
- 20
Jun
- 20
Sep
- 20
Dec
- 20
Mar
- 21
Jun
- 21
Numerator: Total capitalDenominator: Total risk exposure amount
0%
5%
10%
15%
20%
25%
30%
35%
EE LV IS HR BG CZ LU DK SE IE LT RO MT NL FI BE SK CY DE IT FR PL AT HU PT SI ES GR N
O*
EU27 / EEA
14%
16%
18%
20%
22%
24%
26%
Dec
- 14
Mar
- 15
Jun
- 15
Sep
- 15
Dec
- 15
Mar
- 16
Jun
- 16
Sep
- 16
Dec
- 16
Mar
- 17
Jun
- 17
Sep
- 17
Dec
- 17
Mar
- 18
Jun
- 18
Sep
- 18
Dec
- 18
Mar
- 19
Jun
- 19
Sep
- 19
Dec
- 19
Mar
- 20
Jun
- 20
Sep
- 20
Dec
- 20
Mar
- 21
Jun
- 21
Small Medium All banks Large
0%
8%
16%
24%
32%
40%
48%
56%
Dec
- 14
Mar
- 15
Jun
- 15
Sep
- 15
Dec
- 15
Mar
- 16
Jun
- 16
Sep
- 16
Dec
- 16
Mar
- 17
Jun
- 17
Sep
- 17
Dec
- 17
Mar
- 18
Jun
- 18
Sep
- 18
Dec
- 18
Mar
- 19
Jun
- 19
Sep
- 19
Dec
- 19
Mar
- 20
Jun
- 20
Sep
- 20
Dec
- 20
Mar
- 21
Jun
- 21

8
Dec - 14 12.5% 11.2% 12.8% 15.5%
Jun - 15 12.8% 11.6% 13.0% 15.9%
Dec - 15 13.5% 12.3% 14.0% 17.1%Jun - 16 13.6% 12.3% 14.2% 17.6%Dec - 16 14.2% 12.5% 14.7% 18.8%Jun - 17 14.3% 13.0% 15.0% 19.1%Dec - 17 14.9% 13.5% 15.8% 20.1%
Jun - 18 14.5% 13.5% 15.7% 21.0%Dec - 18 14.7% 13.6% 15.7% 20.3%Jun - 19 14.6% 13.9% 15.5% 19.4%
Dec - 19 15.2% 14.2% 16.0% 19.6%Mar - 20 14.6% 13.4% 15.8% 19.2%Jun - 20 15.0% 13.8% 16.2% 19.5%Sep - 20 15.4% 14.2% 16.7% 19.4%Dec - 20 15.9% 14.7% 17.3% 20.2%Mar - 21 15.8% 14.4% 16.9% 20.3%Jun - 21 15.8% 14.5% 17.2% 20.1%
Weighted Averages by country. * Norwegian banks have not implemented yet the reporting framework based on CRR2/CRD5. Therefore, Norwegian figures are included in the EBA Risk dashboard only until March 2021.
Weighted average. Banks are classified in the size class according to their average total assets between Dec. 2014 and Jun. 2021. Non-FINREP banks are assigned to the bucket of small banks.
Period Weighted average 25th 50th 75th
5th and 95th pct, interquartile range and median.Total numerator and denominator.
Dec 2014 =100.
Country dispersion (as of Jun. 2021) RI by size class
Solvency
3 - CET1 ratio
Dispersion Numerator and denominator: trends
90
95
100
105
110
115
120
125
130
135
Dec
- 14
Mar
- 15
Jun
- 15
Sep
- 15
Dec
- 15
Mar
- 16
Jun
- 16
Sep
- 16
Dec
- 16
Mar
- 17
Jun
- 17
Sep
- 17
Dec
- 17
Mar
- 18
Jun
- 18
Sep
- 18
Dec
- 18
Mar
- 19
Jun
- 19
Sep
- 19
Dec
- 19
Mar
- 20
Jun
- 20
Sep
- 20
Dec
- 20
Mar
- 21
Jun
- 21
Numerator: CET1 capitalDenominator: Total risk exposure amount
0%
5%
10%
15%
20%
25%
30%
35%
EE LV HR BG CZ LT IS RO LU SE MT IE BE DK FI PL NL SK CY HU FR SI DE IT PT AT ES GR N
O*
EU27 / EEA
11%
13%
15%
17%
19%
21%
23%
Dec
- 14
Mar
- 15
Jun
- 15
Sep
- 15
Dec
- 15
Mar
- 16
Jun
- 16
Sep
- 16
Dec
- 16
Mar
- 17
Jun
- 17
Sep
- 17
Dec
- 17
Mar
- 18
Jun
- 18
Sep
- 18
Dec
- 18
Mar
- 19
Jun
- 19
Sep
- 19
Dec
- 19
Mar
- 20
Jun
- 20
Sep
- 20
Dec
- 20
Mar
- 21
Jun
- 21
Small Medium All banks Large
0%
8%
16%
24%
32%
40%
48%
Dec
- 14
Mar
- 15
Jun
- 15
Sep
- 15
Dec
- 15
Mar
- 16
Jun
- 16
Sep
- 16
Dec
- 16
Mar
- 17
Jun
- 17
Sep
- 17
Dec
- 17
Mar
- 18
Jun
- 18
Sep
- 18
Dec
- 18
Mar
- 19
Jun
- 19
Sep
- 19
Dec
- 19
Mar
- 20
Jun
- 20
Sep
- 20
Dec
- 20
Mar
- 21
Jun
- 21

9
Dec - 14 11.5% 10.5% 12.0% 15.1%
Jun - 15 12.1% 10.6% 12.3% 15.0%
Dec - 15 12.9% 11.7% 13.5% 16.7%Jun - 16 13.1% 11.9% 13.7% 17.6%Dec - 16 13.7% 12.0% 14.6% 18.7%Jun - 17 14.0% 12.5% 14.7% 19.1%Dec - 17 14.6% 13.3% 15.5% 20.1%
Jun - 18 14.3% 12.8% 15.5% 21.0%Dec - 18 14.5% 12.8% 15.4% 20.1%Jun - 19 14.4% 13.2% 15.2% 19.0%
Dec - 19 15.0% 13.5% 15.9% 19.5%Mar - 20 14.4% 13.0% 15.6% 18.7%Jun - 20 14.7% 13.2% 16.1% 19.1%Sep - 20 15.1% 13.5% 16.4% 19.3%Dec - 20 15.5% 14.1% 16.8% 20.2%Mar - 21 15.5% 14.2% 16.6% 20.3%Jun - 21 15.5% 14.3% 16.4% 20.0%
Weighted Averages by country. * Norwegian banks have not implemented yet the reporting framework based on CRR2/CRD5. Therefore, Norwegian figures are included in the EBA Risk dashboard only until March 2021.
Weighted average. Banks are classified in the size class according to their average total assets between Dec. 2014 and Jun. 2021. Non-FINREP banks are assigned to the bucket of small banks.
Period Weighted average 25th 50th 75th
5th and 95th pct, interquartile range and median.Total numerator and denominator.
Dec 2014 =100.
Country dispersion (as of Jun. 2021) RI by size class
Solvency
4 - CET1 ratio (fully loaded)
Dispersion Numerator and denominator: trends
85
95
105
115
125
135
145
Dec
- 14
Mar
- 15
Jun
- 15
Sep
- 15
Dec
- 15
Mar
- 16
Jun
- 16
Sep
- 16
Dec
- 16
Mar
- 17
Jun
- 17
Sep
- 17
Dec
- 17
Mar
- 18
Jun
- 18
Sep
- 18
Dec
- 18
Mar
- 19
Jun
- 19
Sep
- 19
Dec
- 19
Mar
- 20
Jun
- 20
Sep
- 20
Dec
- 20
Mar
- 21
Jun
- 21
Numerator: CET1 capital (fully loaded)Denominator: Total risk exposure amount (fully loaded)
0%
5%
10%
15%
20%
25%
30%
35%
EE LV HR BG CZ LT IS RO LU SE MT FI DK BE IE NL PL SK HU FR SI CY DE IT AT PT ES GR N
O*
EU27 / EEA
10%
12%
14%
16%
18%
20%
22%
24%
Dec
- 14
Mar
- 15
Jun
- 15
Sep
- 15
Dec
- 15
Mar
- 16
Jun
- 16
Sep
- 16
Dec
- 16
Mar
- 17
Jun
- 17
Sep
- 17
Dec
- 17
Mar
- 18
Jun
- 18
Sep
- 18
Dec
- 18
Mar
- 19
Jun
- 19
Sep
- 19
Dec
- 19
Mar
- 20
Jun
- 20
Sep
- 20
Dec
- 20
Mar
- 21
Jun
- 21
Small Medium All banks Large
0%
5%
10%
15%
20%
25%
30%
35%
40%
45%
50%
Dec
- 14
Mar
- 15
Jun
- 15
Sep
- 15
Dec
- 15
Mar
- 16
Jun
- 16
Sep
- 16
Dec
- 16
Mar
- 17
Jun
- 17
Sep
- 17
Dec
- 17
Mar
- 18
Jun
- 18
Sep
- 18
Dec
- 18
Mar
- 19
Jun
- 19
Sep
- 19
Dec
- 19
Mar
- 20
Jun
- 20
Sep
- 20
Dec
- 20
Mar
- 21
Jun
- 21

10
Dec - 16 5.5% 4.6% 5.7% 7.5%Jun - 17 5.3% 4.4% 5.7% 7.6%Dec - 17 5.6% 4.8% 5.9% 8.1%Jun - 18 5.3% 4.7% 6.0% 7.8%Dec - 18 5.5% 4.9% 6.0% 8.4%Jun - 19 5.4% 4.7% 6.0% 8.4%Dec - 19 5.6% 4.9% 6.2% 8.6%Mar - 20 5.3% 4.7% 6.3% 8.5%Jun - 20 5.3% 4.8% 6.0% 8.2%Sep - 20 5.6% 5.0% 6.3% 8.4%Dec - 20 6.0% 5.2% 6.4% 8.7%Mar - 21 5.7% 5.0% 6.0% 8.3%Jun - 21 5.9% 5.3% 6.3% 8.8%
Weighted Averages by country. * Norwegian banks have not implemented yet the reporting framework based on CRR2/CRD5. Therefore, Norwegian figures are included in the EBA Risk dashboard only until March 2021.
Weighted average. Banks are classified in the size class according to their average total assets between Dec. 2014 and Jun. 2021.
Period Weighted average 25th 50th 75th
5th and 95th pct, interquartile range and median.Total numerator and denominator.
Sep 2016 =100.
Country dispersion (as of Jun. 2021) RI by size class
Solvency
5 - Leverage ratio
Dispersion Numerator and denominator: trends
92
97
102
107
112
117
122
Sep
- 16
Dec
- 16
Mar
- 17
Jun
- 17
Sep
- 17
Dec
- 17
Mar
- 18
Jun
- 18
Sep
- 18
Dec
- 18
Mar
- 19
Jun
- 19
Sep
- 19
Dec
- 19
Mar
- 20
Jun
- 20
Sep
- 20
Dec
- 20
Mar
- 21
Jun
- 21
Numerator: Tier 1 capital - transitional definition
Denominator: Total Leverage Ratio exposure - using a transitional definition of Tier 1capital
0%
2%
4%
6%
8%
10%
12%
14%
16%
IS HR BG EE RO PL LV SI IE HU GR SK CY PT LT LU MT AT BE NL IT CZ FI ES DE FR SE DK
NO
*
EU27 / EEA
4.0%
4.5%
5.0%
5.5%
6.0%
6.5%
7.0%
7.5%
8.0%
8.5%
Sep
- 16
Dec
- 16
Mar
- 17
Jun
- 17
Sep
- 17
Dec
- 17
Mar
- 18
Jun
- 18
Sep
- 18
Dec
- 18
Mar
- 19
Jun
- 19
Sep
- 19
Dec
- 19
Mar
- 20
Jun
- 20
Sep
- 20
Dec
- 20
Mar
- 21
Jun
- 21
Small Medium All banks Large
0%
2%
4%
6%
8%
10%
12%
14%
16%
Sep
- 16
Dec
- 16
Mar
- 17
Jun
- 17
Sep
- 17
Dec
- 17
Mar
- 18
Jun
- 18
Sep
- 18
Dec
- 18
Mar
- 19
Jun
- 19
Sep
- 19
Dec
- 19
Mar
- 20
Jun
- 20
Sep
- 20
Dec
- 20
Mar
- 21
Jun
- 21

11
Dec - 16 5.1% 4.3% 5.4% 7.3%Jun - 17 5.1% 4.3% 5.4% 7.4%Dec - 17 5.4% 4.6% 5.7% 7.9%Jun - 18 5.1% 4.5% 5.5% 7.6%Dec - 18 5.3% 4.7% 5.5% 7.8%Jun - 19 5.2% 4.6% 5.8% 8.1%Dec - 19 5.5% 4.8% 5.9% 8.4%Mar - 20 5.2% 4.7% 6.1% 8.1%Jun - 20 5.2% 4.6% 5.9% 7.8%Sep - 20 5.5% 4.8% 6.0% 8.1%Dec - 20 5.8% 5.1% 6.2% 8.1%Mar - 21 5.6% 4.9% 6.0% 7.8%Jun - 21 5.7% 5.1% 6.1% 8.5%
Weighted Averages by country. * Norwegian banks have not implemented yet the reporting framework based on CRR2/CRD5. Therefore, Norwegian figures are included in the EBA Risk dashboard only until March 2021.
Weighted average. Banks are classified in the size class according to their average total assets between Dec. 2014 and Jun. 2021.
Period Weighted average 25th 50th 75th
5th and 95th pct, interquartile range and median.Total numerator and denominator.
Sep 2016 =100.
Country dispersion (as of Jun. 2021) RI by size class
Solvency
6 - Leverage ratio (fully phased-in definition of Tier 1)
Dispersion Numerator and denominator: trends
90
95
100
105
110
115
120
125
130
Sep
- 16
Dec
- 16
Mar
- 17
Jun
- 17
Sep
- 17
Dec
- 17
Mar
- 18
Jun
- 18
Sep
- 18
Dec
- 18
Mar
- 19
Jun
- 19
Sep
- 19
Dec
- 19
Mar
- 20
Jun
- 20
Sep
- 20
Dec
- 20
Mar
- 21
Jun
- 21
Numerator: Tier 1 capital - fully phased-in definition
Denominator: Total Leverage Ratio exposure - using afully phased-in definition of Tier 1 capital
0%
2%
4%
6%
8%
10%
12%
14%
16%
IS HR EE BG RO PL LV SI IE HU SK PT CY LT LU MT AT GR NL BE CZ IT FI ES DE FR SE DK
NO
*
EU27 / EEA
4%
5%
5%
6%
6%
7%
7%
8%
8%
9%
Sep
- 16
Dec
- 16
Mar
- 17
Jun
- 17
Sep
- 17
Dec
- 17
Mar
- 18
Jun
- 18
Sep
- 18
Dec
- 18
Mar
- 19
Jun
- 19
Sep
- 19
Dec
- 19
Mar
- 20
Jun
- 20
Sep
- 20
Dec
- 20
Mar
- 21
Jun
- 21
Small Medium All banks Large
0%
2%
4%
6%
8%
10%
12%
14%
Sep
- 16
Dec
- 16
Mar
- 17
Jun
- 17
Sep
- 17
Dec
- 17
Mar
- 18
Jun
- 18
Sep
- 18
Dec
- 18
Mar
- 19
Jun
- 19
Sep
- 19
Dec
- 19
Mar
- 20
Jun
- 20
Sep
- 20
Dec
- 20
Mar
- 21
Jun
- 21

12
Dec - 14 6.5% 2.1% 5.5% 14.9%
Jun - 15 6.0% 2.2% 5.8% 14.4%
Dec - 15 5.7% 2.2% 5.0% 14.8%Jun - 16 5.4% 1.9% 4.6% 13.6%Dec - 16 5.1% 1.6% 4.1% 13.1%Jun - 17 4.4% 1.4% 3.4% 9.0%Dec - 17 4.1% 1.3% 3.0% 7.8%
Jun - 18 3.6% 1.2% 2.7% 6.9%Dec - 18 3.2% 1.2% 2.7% 5.7%Jun - 19 3.0% 1.2% 2.6% 5.0%
Dec - 19 2.7% 1.2% 2.5% 4.2%Mar - 20 3.0% 1.3% 2.5% 4.5%Jun - 20 2.9% 1.3% 2.4% 4.3%Sep - 20 2.8% 1.2% 2.4% 3.9%Dec - 20 2.6% 1.3% 2.3% 3.6%Mar - 21 2.5% 1.1% 2.1% 3.5%Jun - 21 2.3% 1.0% 2.1% 3.3%
Weighted Averages by country. * Norwegian banks have not implemented yet the reporting framework based on CRR2/CRD5. Therefore, Norwegian figures are included in the EBA Risk dashboard only until March 2021.
Weighted average. Banks are classified in the size class according to their average total assets between Dec. 2014 and Jun. 2021.
Period Weighted average 25th 50th 75th
5th and 95th pct, interquartile range and median.Total numerator and denominator.
Dec 2014 =100.
Country dispersion (as of Jun. 2021) RI by size class
Credit Risk and Asset Quality
7 - Ratio of non-performing loans and advances (NPL ratio)
Dispersion Numerator and denominator: trends
40
50
60
70
80
90
100
110
120
130
140
Dec
- 14
Mar
- 15
Jun
- 15
Sep
- 15
Dec
- 15
Mar
- 16
Jun
- 16
Sep
- 16
Dec
- 16
Mar
- 17
Jun
- 17
Sep
- 17
Dec
- 17
Mar
- 18
Jun
- 18
Sep
- 18
Dec
- 18
Mar
- 19
Jun
- 19
Sep
- 19
Dec
- 19
Mar
- 20
Jun
- 20
Sep
- 20
Dec
- 20
Mar
- 21
Jun
- 21
Numerator: Non-performing loansDenominator: Total loans
0%
2%
4%
6%
8%
10%
12%
14%
16%
GR CY BG PL PT HR RO IT HU IE MT ES SI IS FR DK AT SK NL LV BE LU CZ FI DE EE LT SE
NO
*
EU27 / EEA
0%
5%
10%
15%
20%
25%
Dec
- 14
Mar
- 15
Jun
- 15
Sep
- 15
Dec
- 15
Mar
- 16
Jun
- 16
Sep
- 16
Dec
- 16
Mar
- 17
Jun
- 17
Sep
- 17
Dec
- 17
Mar
- 18
Jun
- 18
Sep
- 18
Dec
- 18
Mar
- 19
Jun
- 19
Sep
- 19
Dec
- 19
Mar
- 20
Jun
- 20
Sep
- 20
Dec
- 20
Mar
- 21
Jun
- 21
Small Medium All banks Large
0%
5%
10%
15%
20%
25%
30%
35%
40%
Dec
- 14
Mar
- 15
Jun
- 15
Sep
- 15
Dec
- 15
Mar
- 16
Jun
- 16
Sep
- 16
Dec
- 16
Mar
- 17
Jun
- 17
Sep
- 17
Dec
- 17
Mar
- 18
Jun
- 18
Sep
- 18
Dec
- 18
Mar
- 19
Jun
- 19
Sep
- 19
Dec
- 19
Mar
- 20
Jun
- 20
Sep
- 20
Dec
- 20
Mar
- 21
Jun
- 21

13
Dec - 14 43.4% 31.3% 40.9% 48.2%
Jun - 15 43.6% 32.1% 40.9% 47.5%
Dec - 15 43.7% 31.3% 40.3% 47.5%Jun - 16 43.9% 31.8% 40.6% 47.9%Dec - 16 44.8% 31.0% 40.4% 48.5%Jun - 17 45.0% 28.5% 39.8% 48.8%Dec - 17 44.6% 26.9% 40.4% 48.7%
Jun - 18 46.0% 26.0% 39.0% 50.0%Dec - 18 45.0% 28.2% 39.8% 48.3%Jun - 19 44.9% 29.2% 39.8% 51.0%
Dec - 19 44.7% 29.2% 39.5% 50.7%Mar - 20 46.0% 30.2% 41.7% 51.0%Jun - 20 45.5% 30.3% 41.2% 51.0%Sep - 20 45.5% 30.3% 40.9% 50.6%Dec - 20 44.9% 29.4% 42.1% 50.2%Mar - 21 44.7% 28.8% 40.7% 51.2%Jun - 21 44.3% 27.4% 40.4% 51.6%
Weighted Averages by country. * Norwegian banks have not implemented yet the reporting framework based on CRR2/CRD5. Therefore, Norwegian figures are included in the EBA Risk dashboard only until March 2021.
Weighted average. Banks are classified in the size class according to their average total assets between Dec. 2014 and Jun. 2021.
Period Weighted average 25th 50th 75th
5th and 95th pct, interquartile range and median.Total numerator and denominator.
Dec 2014 =100.
Country dispersion (as of Jun. 2021) RI by size class
Credit Risk and Asset Quality
8 - Coverage ratio of non-performing loans and advances
Dispersion Numerator and denominator: trends
45
55
65
75
85
95
105
Dec
- 14
Mar
- 15
Jun
- 15
Sep
- 15
Dec
- 15
Mar
- 16
Jun
- 16
Sep
- 16
Dec
- 16
Mar
- 17
Jun
- 17
Sep
- 17
Dec
- 17
Mar
- 18
Jun
- 18
Sep
- 18
Dec
- 18
Mar
- 19
Jun
- 19
Sep
- 19
Dec
- 19
Mar
- 20
Jun
- 20
Sep
- 20
Dec
- 20
Mar
- 21
Jun
- 21
Numerator: Specific allowances for loansDenominator: Non-performing loans
0%
10%
20%
30%
40%
50%
60%
70%
80%
RO HU SK HR PL PT SI CZ IT BG AT FR GR CY SE ES BE LU DE LV FI MT IE EE DK LT NL IS
NO
*
EU27 / EEA
36%
38%
40%
42%
44%
46%
48%
50%
52%
54%
Dec
- 14
Mar
- 15
Jun
- 15
Sep
- 15
Dec
- 15
Mar
- 16
Jun
- 16
Sep
- 16
Dec
- 16
Mar
- 17
Jun
- 17
Sep
- 17
Dec
- 17
Mar
- 18
Jun
- 18
Sep
- 18
Dec
- 18
Mar
- 19
Jun
- 19
Sep
- 19
Dec
- 19
Mar
- 20
Jun
- 20
Sep
- 20
Dec
- 20
Mar
- 21
Jun
- 21
Small Medium All banks Large
0%
10%
20%
30%
40%
50%
60%
70%
Dec
- 14
Mar
- 15
Jun
- 15
Sep
- 15
Dec
- 15
Mar
- 16
Jun
- 16
Sep
- 16
Dec
- 16
Mar
- 17
Jun
- 17
Sep
- 17
Dec
- 17
Mar
- 18
Jun
- 18
Sep
- 18
Dec
- 18
Mar
- 19
Jun
- 19
Sep
- 19
Dec
- 19
Mar
- 20
Jun
- 20
Sep
- 20
Dec
- 20
Mar
- 21
Jun
- 21

14
Dec - 14 3.9% 1.2% 3.2% 8.7%
Jun - 15 3.7% 1.2% 3.4% 8.7%
Dec - 15 3.5% 1.2% 2.9% 8.9%Jun - 16 3.4% 1.1% 2.9% 8.9%Dec - 16 3.1% 1.3% 2.7% 8.5%Jun - 17 2.8% 1.0% 2.4% 7.3%Dec - 17 2.6% 0.9% 2.3% 5.9%
Jun - 18 2.3% 0.7% 2.1% 4.8%Dec - 18 2.1% 0.7% 1.8% 4.3%Jun - 19 1.9% 0.7% 1.7% 3.9%
Dec - 19 1.8% 0.7% 1.6% 3.4%Mar - 20 1.9% 0.7% 1.9% 3.8%Jun - 20 2.0% 0.9% 2.1% 3.6%Sep - 20 2.0% 0.9% 2.1% 3.8%Dec - 20 2.0% 0.9% 2.0% 3.9%Mar - 21 2.0% 0.8% 2.1% 3.9%Jun - 21 2.1% 0.9% 2.1% 4.2%
Weighted Averages by country. * Norwegian banks have not implemented yet the reporting framework based on CRR2/CRD5. Therefore, Norwegian figures are included in the EBA Risk dashboard only until March 2021.
Weighted average. Banks are classified in the size class according to their average total assets between Dec. 2014 and Jun. 2021.
Period Weighted average 25th 50th 75th
5th and 95th pct, interquartile range and median.Total numerator and denominator.
Dec 2014 =100.
Country dispersion (as of Jun. 2021) RI by size class
Credit Risk and Asset Quality
9 - Forbearance ratio for loans and advances
Dispersion Numerator and denominator: trends
40
60
80
100
120
140
Dec
- 14
Mar
- 15
Jun
- 15
Sep
- 15
Dec
- 15
Mar
- 16
Jun
- 16
Sep
- 16
Dec
- 16
Mar
- 17
Jun
- 17
Sep
- 17
Dec
- 17
Mar
- 18
Jun
- 18
Sep
- 18
Dec
- 18
Mar
- 19
Jun
- 19
Sep
- 19
Dec
- 19
Mar
- 20
Jun
- 20
Sep
- 20
Dec
- 20
Mar
- 21
Jun
- 21
Numerator: Forborne loans Denominator: Total loans
0%
2%
4%
6%
8%
10%
12%
14%
GR IS CY BG HU PT IE MT LV ES IT EE NL
RO PL HR AT SI BE DE FI SK LT LU CZ DK FR SEN
O*
EU27 / EEA
0%
2%
4%
6%
8%
10%
12%
Dec
- 14
Mar
- 15
Jun
- 15
Sep
- 15
Dec
- 15
Mar
- 16
Jun
- 16
Sep
- 16
Dec
- 16
Mar
- 17
Jun
- 17
Sep
- 17
Dec
- 17
Mar
- 18
Jun
- 18
Sep
- 18
Dec
- 18
Mar
- 19
Jun
- 19
Sep
- 19
Dec
- 19
Mar
- 20
Jun
- 20
Sep
- 20
Dec
- 20
Mar
- 21
Jun
- 21
Small Medium All banks Large
0%
5%
10%
15%
20%
25%
Dec
- 14
Mar
- 15
Jun
- 15
Sep
- 15
Dec
- 15
Mar
- 16
Jun
- 16
Sep
- 16
Dec
- 16
Mar
- 17
Jun
- 17
Sep
- 17
Dec
- 17
Mar
- 18
Jun
- 18
Sep
- 18
Dec
- 18
Mar
- 19
Jun
- 19
Sep
- 19
Dec
- 19
Mar
- 20
Jun
- 20
Sep
- 20
Dec
- 20
Mar
- 21
Jun
- 21

15
Dec - 14 5.5% 2.0% 4.7% 11.5%
Jun - 15 5.1% 1.9% 4.5% 11.9%
Dec - 15 4.9% 1.8% 4.0% 12.0%Jun - 16 4.7% 1.6% 3.6% 9.9%Dec - 16 4.4% 1.4% 3.2% 8.9%Jun - 17 3.9% 1.3% 2.9% 7.4%Dec - 17 3.6% 1.2% 2.6% 6.4%
Jun - 18 3.2% 1.1% 2.4% 5.1%Dec - 18 2.8% 1.0% 2.3% 4.2%Jun - 19 2.6% 1.1% 2.3% 3.9%
Dec - 19 2.4% 1.1% 2.2% 3.4%Mar - 20 2.6% 1.2% 2.1% 3.5%Jun - 20 2.5% 1.2% 2.1% 3.4%Sep - 20 2.4% 1.1% 2.1% 3.1%Dec - 20 2.3% 1.1% 1.9% 3.0%Mar - 21 2.2% 0.9% 1.8% 2.8%Jun - 21 2.0% 0.9% 1.8% 2.8%
Weighted Averages by country. * Norwegian banks have not implemented yet the reporting framework based on CRR2/CRD5. Therefore, Norwegian figures are included in the EBA Risk dashboard only until March 2021.
Weighted average. Banks are classified in the size class according to their average total assets between Dec. 2014 and Jun. 2021.
Period Weighted average 25th 50th 75th
5th and 95th pct, interquartile range and median.Total numerator and denominator.
Dec 2014 =100.
Country dispersion (as of Jun. 2021) RI by size class
Credit Risk and Asset Quality
10 - Ratio of non-performing exposures (NPE ratio)
Dispersion Numerator and denominator: trends
40
50
60
70
80
90
100
110
120
130
140
Dec
- 14
Mar
- 15
Jun
- 15
Sep
- 15
Dec
- 15
Mar
- 16
Jun
- 16
Sep
- 16
Dec
- 16
Mar
- 17
Jun
- 17
Sep
- 17
Dec
- 17
Mar
- 18
Jun
- 18
Sep
- 18
Dec
- 18
Mar
- 19
Jun
- 19
Sep
- 19
Dec
- 19
Mar
- 20
Jun
- 20
Sep
- 20
Dec
- 20
Mar
- 21
Jun
- 21
Numerator: Non-performing debt instrumentsDenominator: Total debt instruments
0%
2%
4%
6%
8%
10%
12%
14%
GR CY BG PL HR PT IT IE ES HU RO MT IS SI FR DK AT SK NL BE LV LU FI CZ EE DE LT SE
NO
*
EU27 / EEA
0%
2%
4%
5%
7%
9%
11%
13%
14%
16%
18%
Dec
- 14
Mar
- 15
Jun
- 15
Sep
- 15
Dec
- 15
Mar
- 16
Jun
- 16
Sep
- 16
Dec
- 16
Mar
- 17
Jun
- 17
Sep
- 17
Dec
- 17
Mar
- 18
Jun
- 18
Sep
- 18
Dec
- 18
Mar
- 19
Jun
- 19
Sep
- 19
Dec
- 19
Mar
- 20
Jun
- 20
Sep
- 20
Dec
- 20
Mar
- 21
Jun
- 21
Small Medium All banks Large
0%
5%
10%
15%
20%
25%
30%
35%
Dec
- 14
Mar
- 15
Jun
- 15
Sep
- 15
Dec
- 15
Mar
- 16
Jun
- 16
Sep
- 16
Dec
- 16
Mar
- 17
Jun
- 17
Sep
- 17
Dec
- 17
Mar
- 18
Jun
- 18
Sep
- 18
Dec
- 18
Mar
- 19
Jun
- 19
Sep
- 19
Dec
- 19
Mar
- 20
Jun
- 20
Sep
- 20
Dec
- 20
Mar
- 21
Jun
- 21

16
Dec - 14 3.5% -2.8% 3.8% 8.0%Jun - 15 6.8% 3.5% 7.1% 10.5%Dec - 15 4.5% 2.5% 5.7% 9.1%Jun - 16 5.7% 2.3% 6.2% 9.7%Dec - 16 3.3% 1.4% 5.5% 9.6%Jun - 17 7.1% 3.9% 7.5% 10.4%Dec - 17 6.0% 3.1% 6.6% 10.5%Jun - 18 7.2% 3.9% 6.8% 10.1%Dec - 18 6.5% 3.5% 6.7% 9.5%Jun - 19 7.0% 4.4% 6.3% 9.9%Dec - 19 5.7% 3.5% 5.8% 9.0%Mar - 20 1.3% -3.2% 1.6% 5.0%Jun - 20 0.5% 0.0% 2.7% 5.4%Sep - 20 2.5% 1.0% 3.8% 6.1%Dec - 20 1.9% 0.9% 3.7% 6.2%Mar - 21 7.7% 3.1% 6.2% 9.6%Jun - 21 7.4% 3.7% 7.1% 9.8%
Weighted Averages by country. * Norwegian banks have not implemented yet the reporting framework based on CRR2/CRD5. Therefore, Norwegian figures are included in the EBA Risk dashboard only until March 2021.
Weighted average. Banks are classified in the size class according to their average total assets between Dec. 2014 and Jun. 2021.
Period Weighted average 25th 50th 75th
5th and 95th pct, interquartile range and median.Total numerator and denominator.
Dec 2014 =100.
Country dispersion (as of Jun. 2021) RI by size class
Profitability
11 - Return on equity
Dispersion Numerator and denominator: trends
0
50
100
150
200
250
300
Dec
- 14
Mar
- 15
Jun
- 15
Sep
- 15
Dec
- 15
Mar
- 16
Jun
- 16
Sep
- 16
Dec
- 16
Mar
- 17
Jun
- 17
Sep
- 17
Dec
- 17
Mar
- 18
Jun
- 18
Sep
- 18
Dec
- 18
Mar
- 19
Jun
- 19
Sep
- 19
Dec
- 19
Mar
- 20
Jun
- 20
Sep
- 20
Dec
- 20
Mar
- 21
Jun
- 21
Numerator: Profit or loss for the yearDenominator: Total equity
-35%
-25%
-15%
-5%
5%
15%
HU RO ES SE IS SI LV LT BG CZ SK FI AT NL
HR IT DK EE PL FR BE IE LU DE PT MT CY GR N
O*
EU27 / EEA
-2%
0%
2%
4%
6%
8%
10%
12%
14%
16%
Dec
- 14
Mar
- 15
Jun
- 15
Sep
- 15
Dec
- 15
Mar
- 16
Jun
- 16
Sep
- 16
Dec
- 16
Mar
- 17
Jun
- 17
Sep
- 17
Dec
- 17
Mar
- 18
Jun
- 18
Sep
- 18
Dec
- 18
Mar
- 19
Jun
- 19
Sep
- 19
Dec
- 19
Mar
- 20
Jun
- 20
Sep
- 20
Dec
- 20
Mar
- 21
Jun
- 21
Small Medium All banks Large
-40%
-30%
-20%
-10%
0%
10%
20%
30%
Dec
- 14
Mar
- 15
Jun
- 15
Sep
- 15
Dec
- 15
Mar
- 16
Jun
- 16
Sep
- 16
Dec
- 16
Mar
- 17
Jun
- 17
Sep
- 17
Dec
- 17
Mar
- 18
Jun
- 18
Sep
- 18
Dec
- 18
Mar
- 19
Jun
- 19
Sep
- 19
Dec
- 19
Mar
- 20
Jun
- 20
Sep
- 20
Dec
- 20
Mar
- 21
Jun
- 21

17
Dec - 14 0.20% -0.11% 0.24% 0.52%Jun - 15 0.41% 0.21% 0.45% 0.72%Dec - 15 0.28% 0.14% 0.35% 0.58%Jun - 16 0.36% 0.16% 0.36% 0.65%Dec - 16 0.21% 0.08% 0.36% 0.65%Jun - 17 0.46% 0.23% 0.46% 0.80%Dec - 17 0.40% 0.20% 0.43% 0.87%Jun - 18 0.48% 0.23% 0.46% 0.86%Dec - 18 0.44% 0.21% 0.44% 0.76%Jun - 19 0.47% 0.26% 0.48% 0.78%Dec - 19 0.39% 0.21% 0.41% 0.64%Mar - 20 0.08% -0.22% 0.14% 0.40%Jun - 20 0.03% 0.00% 0.17% 0.36%Sep - 20 0.16% 0.05% 0.27% 0.44%Dec - 20 0.13% 0.05% 0.26% 0.47%Mar - 21 0.48% 0.21% 0.42% 0.75%Jun - 21 0.47% 0.22% 0.47% 0.76%
Weighted Averages by country. * Norwegian banks have not implemented yet the reporting framework based on CRR2/CRD5. Therefore, Norwegian figures are included in the EBA Risk dashboard only until March 2021.
Weighted average. Banks are classified in the size class according to their average total assets between Dec. 2014 and Jun. 2021.
Period Weighted average 25th 50th 75th
5th and 95th pct, interquartile range and median.Total numerator and denominator.
Dec 2014 =100.
Country dispersion (as of Jun. 2021) RI by size class
Profitability
12 - Return on assets
Dispersion Numerator and denominator: trends
0
50
100
150
200
250
300
Dec
- 14
Mar
- 15
Jun
- 15
Sep
- 15
Dec
- 15
Mar
- 16
Jun
- 16
Sep
- 16
Dec
- 16
Mar
- 17
Jun
- 17
Sep
- 17
Dec
- 17
Mar
- 18
Jun
- 18
Sep
- 18
Dec
- 18
Mar
- 19
Jun
- 19
Sep
- 19
Dec
- 19
Mar
- 20
Jun
- 20
Sep
- 20
Dec
- 20
Mar
- 21
Jun
- 21
Numerator: Profit or loss for the yearDenominator: Total assets
-3.0%
-2.0%
-1.0%
0.0%
1.0%
2.0%
IS RO HU BG SI LV HR EE LT PL CZ SK ES IE AT SE FI IT LU NL BE FR DK PT MT DE CY GR N
O*
EU27 / EEA
-0.2%
0.3%
0.8%
1.3%
1.8%
Dec
- 14
Mar
- 15
Jun
- 15
Sep
- 15
Dec
- 15
Mar
- 16
Jun
- 16
Sep
- 16
Dec
- 16
Mar
- 17
Jun
- 17
Sep
- 17
Dec
- 17
Mar
- 18
Jun
- 18
Sep
- 18
Dec
- 18
Mar
- 19
Jun
- 19
Sep
- 19
Dec
- 19
Mar
- 20
Jun
- 20
Sep
- 20
Dec
- 20
Mar
- 21
Jun
- 21
Small Medium All banks Large
-2.4%
-1.8%
-1.2%
-0.6%
0.0%
0.6%
1.2%
1.8%
2.4%
Dec
- 14
Mar
- 15
Jun
- 15
Sep
- 15
Dec
- 15
Mar
- 16
Jun
- 16
Sep
- 16
Dec
- 16
Mar
- 17
Jun
- 17
Sep
- 17
Dec
- 17
Mar
- 18
Jun
- 18
Sep
- 18
Dec
- 18
Mar
- 19
Jun
- 19
Sep
- 19
Dec
- 19
Mar
- 20
Jun
- 20
Sep
- 20
Dec
- 20
Mar
- 21
Jun
- 21

18
Dec - 14 62.9% 45.9% 58.5% 69.7%
Jun - 15 59.3% 46.3% 55.9% 65.3%
Dec - 15 62.8% 48.2% 59.2% 67.7%Jun - 16 62.7% 49.9% 59.8% 70.7%Dec - 16 65.3% 50.0% 61.2% 73.2%Jun - 17 61.6% 50.2% 58.0% 69.0%Dec - 17 63.4% 50.1% 59.5% 70.2%
Jun - 18 63.7% 51.2% 61.8% 73.0%Dec - 18 64.5% 50.1% 62.5% 70.7%Jun - 19 64.1% 51.8% 63.4% 72.5%
Dec - 19 64.0% 53.1% 63.0% 72.2%Mar - 20 71.7% 56.1% 67.4% 83.9%Jun - 20 66.6% 53.9% 65.2% 78.6%Sep - 20 64.7% 51.6% 64.3% 74.1%Dec - 20 65.2% 51.0% 64.5% 73.0%Mar - 21 63.6% 53.6% 63.4% 78.3%Jun - 21 64.0% 50.1% 62.2% 74.5%
Weighted Averages by country. * Norwegian banks have not implemented yet the reporting framework based on CRR2/CRD5. Therefore, Norwegian figures are included in the EBA Risk dashboard only until March 2021.
Weighted average. Banks are classified in the size class according to their average total assets between Dec. 2014 and Jun. 2021.
Period Weighted average 25th 50th 75th
5th and 95th pct, interquartile range and median.Total numerator and denominator.
Dec 2014 =100.
Country dispersion (as of Jun. 2021) RI by size class
Profitability
13 - Cost to income ratio
Dispersion Numerator and denominator: trends
94
96
98
100
102
104
106
108
110
112
Dec
- 14
Mar
- 15
Jun
- 15
Sep
- 15
Dec
- 15
Mar
- 16
Jun
- 16
Sep
- 16
Dec
- 16
Mar
- 17
Jun
- 17
Sep
- 17
Dec
- 17
Mar
- 18
Jun
- 18
Sep
- 18
Dec
- 18
Mar
- 19
Jun
- 19
Sep
- 19
Dec
- 19
Mar
- 20
Jun
- 20
Sep
- 20
Dec
- 20
Mar
- 21
Jun
- 21
Numerator: CostsDenominator: Total net operating income
0%
10%
20%
30%
40%
50%
60%
70%
80%
90%
100%
MT
GR CY DE IE FR LU BE IT SI NL
AT HU DK EE LV CZ ES FI SK HR PL RO PT SE IS BG LTN
O*
EU27 / EEA
50%
55%
60%
65%
70%
Dec
- 14
Mar
- 15
Jun
- 15
Sep
- 15
Dec
- 15
Mar
- 16
Jun
- 16
Sep
- 16
Dec
- 16
Mar
- 17
Jun
- 17
Sep
- 17
Dec
- 17
Mar
- 18
Jun
- 18
Sep
- 18
Dec
- 18
Mar
- 19
Jun
- 19
Sep
- 19
Dec
- 19
Mar
- 20
Jun
- 20
Sep
- 20
Dec
- 20
Mar
- 21
Jun
- 21
Small Medium All banks Large
0%
20%
40%
60%
80%
100%
120%
140%
160%
Dec
- 14
Mar
- 15
Jun
- 15
Sep
- 15
Dec
- 15
Mar
- 16
Jun
- 16
Sep
- 16
Dec
- 16
Mar
- 17
Jun
- 17
Sep
- 17
Dec
- 17
Mar
- 18
Jun
- 18
Sep
- 18
Dec
- 18
Mar
- 19
Jun
- 19
Sep
- 19
Dec
- 19
Mar
- 20
Jun
- 20
Sep
- 20
Dec
- 20
Mar
- 21
Jun
- 21

19
Dec - 14 58.8% 49.6% 62.2% 75.4%
Jun - 15 54.9% 45.9% 58.9% 72.7%
Dec - 15 57.3% 48.9% 61.1% 78.1%Jun - 16 57.0% 50.4% 64.1% 77.1%Dec - 16 57.8% 49.7% 63.8% 75.5%Jun - 17 55.4% 50.1% 61.8% 72.9%Dec - 17 57.3% 48.5% 63.4% 73.5%
Jun - 18 56.8% 51.1% 66.0% 76.7%Dec - 18 58.9% 53.4% 65.8% 76.6%Jun - 19 57.9% 52.8% 64.7% 74.7%
Dec - 19 58.4% 53.0% 63.9% 75.6%Mar - 20 62.9% 52.3% 67.8% 81.9%Jun - 20 60.3% 54.0% 65.9% 79.0%Sep - 20 59.8% 54.7% 65.4% 77.6%Dec - 20 59.1% 52.6% 62.8% 75.7%Mar - 21 53.6% 43.8% 60.1% 71.0%Jun - 21 55.0% 48.5% 60.3% 71.6%
Weighted Averages by country. * Norwegian banks have not implemented yet the reporting framework based on CRR2/CRD5. Therefore, Norwegian figures are included in the EBA Risk dashboard only until March 2021.
Weighted average. Banks are classified in the size class according to their average total assets between Dec. 2014 and Jun. 2021.
Period Weighted average 25th 50th 75th
5th and 95th pct, interquartile range and median.Total numerator and denominator.
Dec 2014 =100.
Country dispersion (as of Jun. 2021) RI by size class
Profitability
14 - Net interest income to total net operating income
Dispersion Numerator and denominator: trends
90
95
100
105
110
115
Dec
- 14
Mar
- 15
Jun
- 15
Sep
- 15
Dec
- 15
Mar
- 16
Jun
- 16
Sep
- 16
Dec
- 16
Mar
- 17
Jun
- 17
Sep
- 17
Dec
- 17
Mar
- 18
Jun
- 18
Sep
- 18
Dec
- 18
Mar
- 19
Jun
- 19
Sep
- 19
Dec
- 19
Mar
- 20
Jun
- 20
Sep
- 20
Dec
- 20
Mar
- 21
Jun
- 21
Numerator: Net interest incomeDenominator: Total net operating income
0%
20%
40%
60%
80%
100%
120%
GR MT NL CZ BE EE ES CY SK SE PL IS RO AT HR IE HU BG LV PT DK SI LT FI LU DE FR IT
NO
*
EU27 / EEA
42%
46%
50%
54%
58%
62%
66%
70%
74%
78%
Dec
- 14
Mar
- 15
Jun
- 15
Sep
- 15
Dec
- 15
Mar
- 16
Jun
- 16
Sep
- 16
Dec
- 16
Mar
- 17
Jun
- 17
Sep
- 17
Dec
- 17
Mar
- 18
Jun
- 18
Sep
- 18
Dec
- 18
Mar
- 19
Jun
- 19
Sep
- 19
Dec
- 19
Mar
- 20
Jun
- 20
Sep
- 20
Dec
- 20
Mar
- 21
Jun
- 21
Small Medium All banks Large
0%
20%
40%
60%
80%
100%
120%
140%
160%
180%
Dec
- 14
Mar
- 15
Jun
- 15
Sep
- 15
Dec
- 15
Mar
- 16
Jun
- 16
Sep
- 16
Dec
- 16
Mar
- 17
Jun
- 17
Sep
- 17
Dec
- 17
Mar
- 18
Jun
- 18
Sep
- 18
Dec
- 18
Mar
- 19
Jun
- 19
Sep
- 19
Dec
- 19
Mar
- 20
Jun
- 20
Sep
- 20
Dec
- 20
Mar
- 21
Jun
- 21

20
Dec - 14 27.2% 13.7% 22.9% 30.3%
Jun - 15 26.2% 13.5% 21.7% 30.4%
Dec - 15 26.8% 12.2% 22.1% 29.9%Jun - 16 26.6% 11.8% 22.5% 32.3%Dec - 16 27.2% 12.6% 23.1% 32.5%Jun - 17 27.4% 13.0% 22.1% 33.1%Dec - 17 28.1% 13.7% 23.6% 32.7%
Jun - 18 28.6% 14.1% 25.7% 34.2%Dec - 18 28.7% 15.5% 25.5% 34.1%Jun - 19 28.1% 16.0% 24.6% 32.8%
Dec - 19 28.5% 15.7% 25.3% 33.6%Mar - 20 32.9% 17.3% 28.3% 40.1%Jun - 20 30.4% 16.3% 27.1% 37.2%Sep - 20 30.2% 15.8% 26.9% 36.5%Dec - 20 30.5% 15.3% 26.1% 35.9%Mar - 21 30.5% 15.9% 26.6% 37.9%Jun - 21 31.6% 16.6% 26.5% 37.4%
Weighted Averages by country. * Norwegian banks have not implemented yet the reporting framework based on CRR2/CRD5. Therefore, Norwegian figures are included in the EBA Risk dashboard only until March 2021.
Weighted average. Banks are classified in the size class according to their average total assets between Dec. 2014 and Jun. 2021.
Period Weighted average 25th 50th 75th
5th and 95th pct, interquartile range and median.Total numerator and denominator.
Dec 2014 =100.
Country dispersion (as of Jun. 2021) RI by size class
Profitability
15 - Net fee and commission income to total net operating income
Dispersion Numerator and denominator: trends
90
95
100
105
110
115
120
125
Dec
- 14
Mar
- 15
Jun
- 15
Sep
- 15
Dec
- 15
Mar
- 16
Jun
- 16
Sep
- 16
Dec
- 16
Mar
- 17
Jun
- 17
Sep
- 17
Dec
- 17
Mar
- 18
Jun
- 18
Sep
- 18
Dec
- 18
Mar
- 19
Jun
- 19
Sep
- 19
Dec
- 19
Mar
- 20
Jun
- 20
Sep
- 20
Dec
- 20
Mar
- 21
Jun
- 21
Numerator: Net fee and commission incomeDenominator: Total net operating income
0%
5%
10%
15%
20%
25%
30%
35%
40%
45%
IT DE FR LU LT SI AT HU FI LV SK PT BG HR PL CY GR SE BE ES IE DK MT EE CZ IS RO NL
NO
*
EU27 / EEA
18%
20%
22%
24%
26%
28%
30%
32%
34%
36%
Dec
- 14
Mar
- 15
Jun
- 15
Sep
- 15
Dec
- 15
Mar
- 16
Jun
- 16
Sep
- 16
Dec
- 16
Mar
- 17
Jun
- 17
Sep
- 17
Dec
- 17
Mar
- 18
Jun
- 18
Sep
- 18
Dec
- 18
Mar
- 19
Jun
- 19
Sep
- 19
Dec
- 19
Mar
- 20
Jun
- 20
Sep
- 20
Dec
- 20
Mar
- 21
Jun
- 21
Small Medium All banks Large
-20%
-10%
0%
10%
20%
30%
40%
50%
60%
70%
80%
Dec
- 14
Mar
- 15
Jun
- 15
Sep
- 15
Dec
- 15
Mar
- 16
Jun
- 16
Sep
- 16
Dec
- 16
Mar
- 17
Jun
- 17
Sep
- 17
Dec
- 17
Mar
- 18
Jun
- 18
Sep
- 18
Dec
- 18
Mar
- 19
Jun
- 19
Sep
- 19
Dec
- 19
Mar
- 20
Jun
- 20
Sep
- 20
Dec
- 20
Mar
- 21
Jun
- 21
21
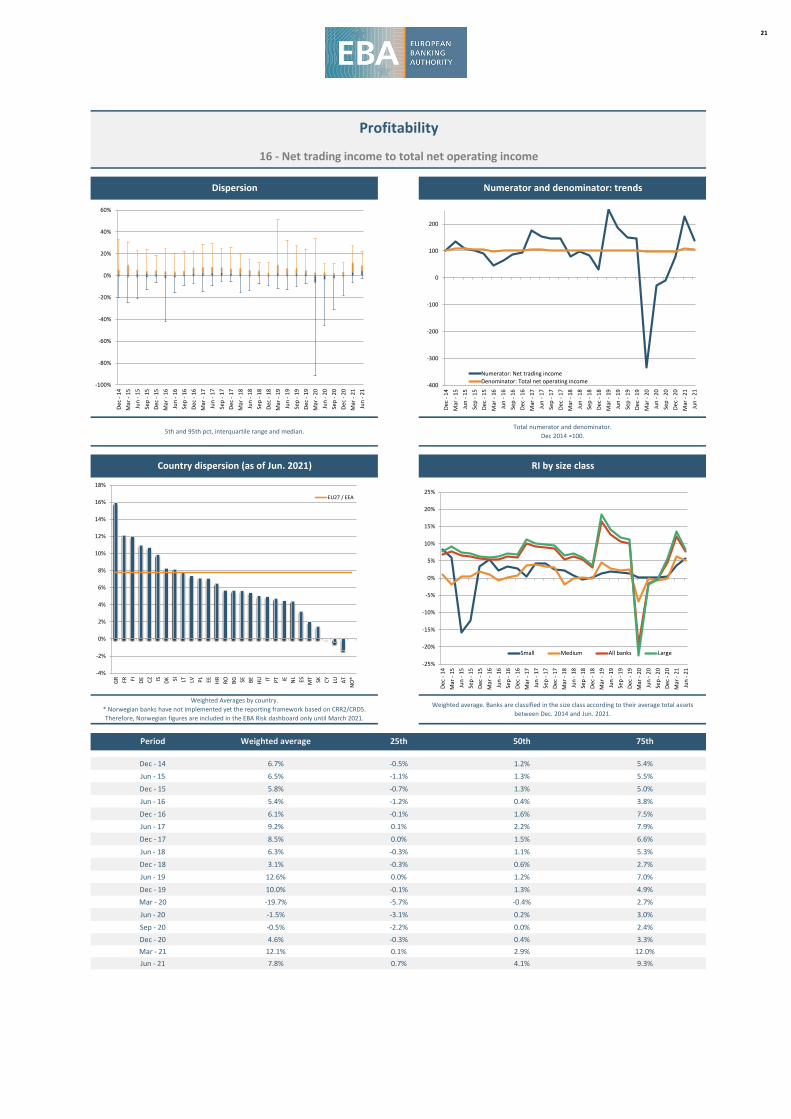
Dec - 14 6.7% -0.5% 1.2% 5.4%
Jun - 15 6.5% -1.1% 1.3% 5.5%
Dec - 15 5.8% -0.7% 1.3% 5.0%Jun - 16 5.4% -1.2% 0.4% 3.8%Dec - 16 6.1% -0.1% 1.6% 7.5%Jun - 17 9.2% 0.1% 2.2% 7.9%Dec - 17 8.5% 0.0% 1.5% 6.6%
Jun - 18 6.3% -0.3% 1.1% 5.3%Dec - 18 3.1% -0.3% 0.6% 2.7%Jun - 19 12.6% 0.0% 1.2% 7.0%
Dec - 19 10.0% -0.1% 1.3% 4.9%Mar - 20 -19.7% -5.7% -0.4% 2.7%Jun - 20 -1.5% -3.1% 0.2% 3.0%Sep - 20 -0.5% -2.2% 0.0% 2.4%Dec - 20 4.6% -0.3% 0.4% 3.3%Mar - 21 12.1% 0.1% 2.9% 12.0%Jun - 21 7.8% 0.7% 4.1% 9.3%
Weighted Averages by country. * Norwegian banks have not implemented yet the reporting framework based on CRR2/CRD5. Therefore, Norwegian figures are included in the EBA Risk dashboard only until March 2021.
Weighted average. Banks are classified in the size class according to their average total assets between Dec. 2014 and Jun. 2021.
Period Weighted average 25th 50th 75th
5th and 95th pct, interquartile range and median.Total numerator and denominator.
Dec 2014 =100.
Country dispersion (as of Jun. 2021) RI by size class
Profitability
16 - Net trading income to total net operating income
Dispersion Numerator and denominator: trends
-400
-300
-200
-100
0
100
200
Dec
- 14
Mar
- 15
Jun
- 15
Sep
- 15
Dec
- 15
Mar
- 16
Jun
- 16
Sep
- 16
Dec
- 16
Mar
- 17
Jun
- 17
Sep
- 17
Dec
- 17
Mar
- 18
Jun
- 18
Sep
- 18
Dec
- 18
Mar
- 19
Jun
- 19
Sep
- 19
Dec
- 19
Mar
- 20
Jun
- 20
Sep
- 20
Dec
- 20
Mar
- 21
Jun
- 21
Numerator: Net trading incomeDenominator: Total net operating income
-4%
-2%
0%
2%
4%
6%
8%
10%
12%
14%
16%
18%
GR FR FI DE CZ IS DK SI LT LV PL EE HR RO BG SE BE HU IT PT IE NL ES MT SK CY LU AT
NO
*
EU27 / EEA
-25%
-20%
-15%
-10%
-5%
0%
5%
10%
15%
20%
25%
Dec
- 14
Mar
- 15
Jun
- 15
Sep
- 15
Dec
- 15
Mar
- 16
Jun
- 16
Sep
- 16
Dec
- 16
Mar
- 17
Jun
- 17
Sep
- 17
Dec
- 17
Mar
- 18
Jun
- 18
Sep
- 18
Dec
- 18
Mar
- 19
Jun
- 19
Sep
- 19
Dec
- 19
Mar
- 20
Jun
- 20
Sep
- 20
Dec
- 20
Mar
- 21
Jun
- 21
Small Medium All banks Large
-100%
-80%
-60%
-40%
-20%
0%
20%
40%
60%
Dec
- 14
Mar
- 15
Jun
- 15
Sep
- 15
Dec
- 15
Mar
- 16
Jun
- 16
Sep
- 16
Dec
- 16
Mar
- 17
Jun
- 17
Sep
- 17
Dec
- 17
Mar
- 18
Jun
- 18
Sep
- 18
Dec
- 18
Mar
- 19
Jun
- 19
Sep
- 19
Dec
- 19
Mar
- 20
Jun
- 20
Sep
- 20
Dec
- 20
Mar
- 21
Jun
- 21

22
Dec - 14 1.55% 1.07% 1.48% 1.79%
Jun - 15 1.57% 1.06% 1.53% 1.84%
Dec - 15 1.58% 1.12% 1.53% 1.87%Jun - 16 1.47% 1.02% 1.40% 1.85%Dec - 16 1.48% 1.05% 1.38% 1.83%Jun - 17 1.46% 0.97% 1.37% 1.90%Dec - 17 1.47% 1.03% 1.41% 1.94%
Jun - 18 1.43% 1.01% 1.42% 2.02%Dec - 18 1.47% 1.04% 1.46% 2.11%Jun - 19 1.43% 1.05% 1.44% 2.04%
Dec - 19 1.45% 1.04% 1.43% 2.02%Mar - 20 1.39% 0.99% 1.39% 1.97%Jun - 20 1.35% 0.98% 1.34% 1.91%Sep - 20 1.33% 0.99% 1.34% 1.87%Dec - 20 1.33% 1.00% 1.31% 1.85%Mar - 21 1.24% 0.86% 1.20% 1.71%Jun - 21 1.24% 0.86% 1.18% 1.77%
Weighted Averages by country. * Norwegian banks have not implemented yet the reporting framework based on CRR2/CRD5. Therefore, Norwegian figures are included in the EBA Risk dashboard only until March 2021.
Weighted average. Banks are classified in the size class according to their average total assets between Dec. 2014 and Jun. 2021.
Period Weighted average 25th 50th 75th
5th and 95th pct, interquartile range and median.Total numerator and denominator.
Dec 2014 =100.
Country dispersion (as of Jun. 2021) RI by size class
Profitability
17 - Net interest margin
Dispersion Numerator and denominator: trends
90
95
100
105
110
115
120
125
130
Dec
- 14
Mar
- 15
Jun
- 15
Sep
- 15
Dec
- 15
Mar
- 16
Jun
- 16
Sep
- 16
Dec
- 16
Mar
- 17
Jun
- 17
Sep
- 17
Dec
- 17
Mar
- 18
Jun
- 18
Sep
- 18
Dec
- 18
Mar
- 19
Jun
- 19
Sep
- 19
Dec
- 19
Mar
- 20
Jun
- 20
Sep
- 20
Dec
- 20
Mar
- 21
Jun
- 21
Numerator: Net interest incomeDenominator: Interest earning assets
0.0%
0.5%
1.0%
1.5%
2.0%
2.5%
3.0%
3.5%
HU RO IS PL GR BG HR ES SI SK LV EE CZ CY AT IE PT NL
MT BE IT LU LT SE FI FR DE DK
NO
*
EU27 / EEA
1.0%
1.2%
1.4%
1.6%
1.8%
2.0%
2.2%
2.4%
2.6%
Dec
- 14
Mar
- 15
Jun
- 15
Sep
- 15
Dec
- 15
Mar
- 16
Jun
- 16
Sep
- 16
Dec
- 16
Mar
- 17
Jun
- 17
Sep
- 17
Dec
- 17
Mar
- 18
Jun
- 18
Sep
- 18
Dec
- 18
Mar
- 19
Jun
- 19
Sep
- 19
Dec
- 19
Mar
- 20
Jun
- 20
Sep
- 20
Dec
- 20
Mar
- 21
Jun
- 21
Small Medium All banks Large
0.0%
0.5%
1.0%
1.5%
2.0%
2.5%
3.0%
3.5%
Dec
- 14
Mar
- 15
Jun
- 15
Sep
- 15
Dec
- 15
Mar
- 16
Jun
- 16
Sep
- 16
Dec
- 16
Mar
- 17
Jun
- 17
Sep
- 17
Dec
- 17
Mar
- 18
Jun
- 18
Sep
- 18
Dec
- 18
Mar
- 19
Jun
- 19
Sep
- 19
Dec
- 19
Mar
- 20
Jun
- 20
Sep
- 20
Dec
- 20
Mar
- 21
Jun
- 21
23
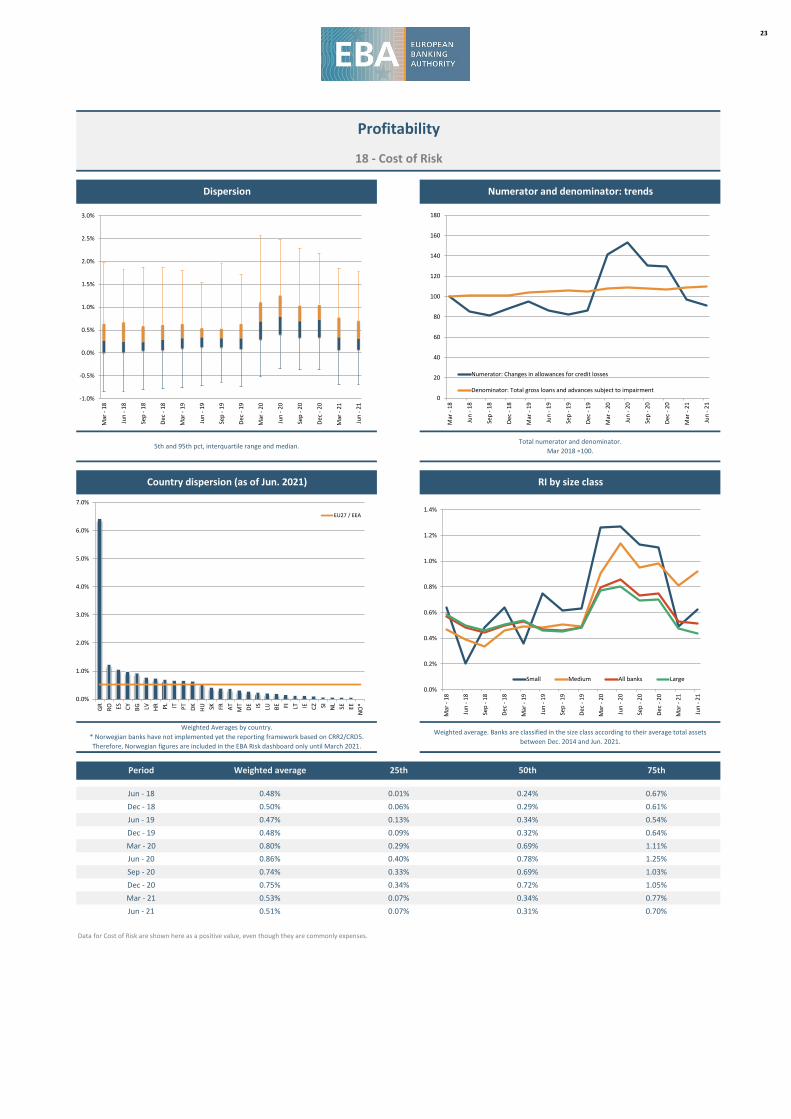
Jun - 18 0.48% 0.01% 0.24% 0.67%Dec - 18 0.50% 0.06% 0.29% 0.61%Jun - 19 0.47% 0.13% 0.34% 0.54%Dec - 19 0.48% 0.09% 0.32% 0.64%Mar - 20 0.80% 0.29% 0.69% 1.11%Jun - 20 0.86% 0.40% 0.78% 1.25%Sep - 20 0.74% 0.33% 0.69% 1.03%Dec - 20 0.75% 0.34% 0.72% 1.05%Mar - 21 0.53% 0.07% 0.34% 0.77%Jun - 21 0.51% 0.07% 0.31% 0.70%
Data for Cost of Risk are shown here as a positive value, even though they are commonly expenses.
Weighted Averages by country. * Norwegian banks have not implemented yet the reporting framework based on CRR2/CRD5. Therefore, Norwegian figures are included in the EBA Risk dashboard only until March 2021.
Weighted average. Banks are classified in the size class according to their average total assets between Dec. 2014 and Jun. 2021.
Period Weighted average 25th 50th 75th
5th and 95th pct, interquartile range and median.Total numerator and denominator.
Mar 2018 =100.
Country dispersion (as of Jun. 2021) RI by size class
Profitability
18 - Cost of Risk
Dispersion Numerator and denominator: trends
0
20
40
60
80
100
120
140
160
180
Mar
- 18
Jun
- 18
Sep
- 18
Dec
- 18
Mar
- 19
Jun
- 19
Sep
- 19
Dec
- 19
Mar
- 20
Jun
- 20
Sep
- 20
Dec
- 20
Mar
- 21
Jun
- 21
Numerator: Changes in allowances for credit losses
Denominator: Total gross loans and advances subject to impairment
0.0%
1.0%
2.0%
3.0%
4.0%
5.0%
6.0%
7.0%
GR RO ES CY BG LV HR PL IT PT DK HU SK FR AT MT DE IS LU BE FI LT IE CZ SI NL SE EE
NO
*
EU27 / EEA
0.0%
0.2%
0.4%
0.6%
0.8%
1.0%
1.2%
1.4%
Mar
- 18
Jun
- 18
Sep
- 18
Dec
- 18
Mar
- 19
Jun
- 19
Sep
- 19
Dec
- 19
Mar
- 20
Jun
- 20
Sep
- 20
Dec
- 20
Mar
- 21
Jun
- 21
Small Medium All banks Large
-1.0%
-0.5%
0.0%
0.5%
1.0%
1.5%
2.0%
2.5%
3.0%
Mar
- 18
Jun
- 18
Sep
- 18
Dec
- 18
Mar
- 19
Jun
- 19
Sep
- 19
Dec
- 19
Mar
- 20
Jun
- 20
Sep
- 20
Dec
- 20
Mar
- 21
Jun
- 21

24
Dec - 14 124.7% 98.5% 121.2% 191.8%
Jun - 15 125.3% 100.1% 120.6% 183.0%
Dec - 15 121.6% 94.0% 118.3% 179.4%Jun - 16 121.1% 96.4% 117.9% 176.0%Dec - 16 119.3% 93.5% 116.1% 192.5%Jun - 17 118.2% 91.2% 114.9% 163.9%Dec - 17 117.4% 90.3% 114.1% 174.7%
Jun - 18 118.3% 90.3% 112.2% 180.7%Dec - 18 117.1% 90.9% 111.2% 186.1%Jun - 19 116.4% 90.9% 108.8% 168.4%
Dec - 19 114.8% 89.4% 105.7% 171.7%Mar - 20 121.4% 88.4% 104.6% 176.7%Jun - 20 116.0% 85.2% 102.2% 170.3%Sep - 20 113.6% 84.7% 100.2% 165.5%Dec - 20 112.2% 81.2% 97.6% 167.6%Mar - 21 110.9% 79.6% 97.4% 159.1%Jun - 21 108.9% 78.8% 97.2% 149.7%
Weighted Averages by country. * Norwegian banks have not implemented yet the reporting framework based on CRR2/CRD5. Therefore, Norwegian figures are included in the EBA Risk dashboard only until March 2021.
Weighted average. Banks are classified in the size class according to their average total assets between Dec. 2014 and Jun. 2021.
Period Weighted average 25th 50th 75th
5th and 95th pct, interquartile range and median.Total numerator and denominator.
Dec 2014 =100.
Country dispersion (as of Jun. 2021) RI by size class
Funding and Liquidity
19 - Loan-to-deposit ratio for households and non-financial corporations
Dispersion Numerator and denominator: trends
95
105
115
125
135
145
Dec
- 14
Mar
- 15
Jun
- 15
Sep
- 15
Dec
- 15
Mar
- 16
Jun
- 16
Sep
- 16
Dec
- 16
Mar
- 17
Jun
- 17
Sep
- 17
Dec
- 17
Mar
- 18
Jun
- 18
Sep
- 18
Dec
- 18
Mar
- 19
Jun
- 19
Sep
- 19
Dec
- 19
Mar
- 20
Jun
- 20
Sep
- 20
Dec
- 20
Mar
- 21
Jun
- 21
Numerator: Loans to NFCs and householdsDenominator: Deposits to NFCs and households
40%
60%
80%
100%
120%
140%
160%
Dec
- 14
Mar
- 15
Jun
- 15
Sep
- 15
Dec
- 15
Mar
- 16
Jun
- 16
Sep
- 16
Dec
- 16
Mar
- 17
Jun
- 17
Sep
- 17
Dec
- 17
Mar
- 18
Jun
- 18
Sep
- 18
Dec
- 18
Mar
- 19
Jun
- 19
Sep
- 19
Dec
- 19
Mar
- 20
Jun
- 20
Sep
- 20
Dec
- 20
Mar
- 21
Jun
- 21
Small Medium All banks Large
0%
200%
400%
600%
800%
1000%
1200%
1400%
1600%
1800%
Dec
- 14
Mar
- 15
Jun
- 15
Sep
- 15
Dec
- 15
Mar
- 16
Jun
- 16
Sep
- 16
Dec
- 16
Mar
- 17
Jun
- 17
Sep
- 17
Dec
- 17
Mar
- 18
Jun
- 18
Sep
- 18
Dec
- 18
Mar
- 19
Jun
- 19
Sep
- 19
Dec
- 19
Mar
- 20
Jun
- 20
Sep
- 20
Dec
- 20
Mar
- 21
Jun
- 21
0%
50%
100%
150%
200%
250%
300%
350%
DK IS SE FI LU DE NL SK FR ES EE BE AT IT PL HU IE PT CZ LV GR BG HR LT SI RO CY MT
NO
*
EU27 / EEA

25
Dec - 14 25.4% 13.5% 24.5% 39.1%Jun - 15 25.8% 14.5% 25.4% 36.2%Dec - 15 25.6% 15.2% 25.4% 36.6%Jun - 16 25.6% 14.2% 25.1% 36.3%Dec - 16 26.6% 13.5% 24.6% 37.4%Jun - 17 28.0% 13.7% 24.3% 36.8%Dec - 17 27.9% 13.4% 23.7% 35.1%Jun - 18 28.0% 13.8% 23.9% 34.0%Dec - 18 28.0% 12.7% 23.7% 34.0%Jun - 19 27.5% 11.6% 22.1% 32.4%Dec - 19 27.3% 11.5% 21.2% 32.4%Mar - 20 26.7% 11.3% 22.1% 30.9%Jun - 20 27.4% 12.8% 25.2% 30.6%Sep - 20 27.9% 12.7% 25.0% 32.8%Dec - 20 27.9% 12.0% 25.0% 32.2%Mar - 21 28.8% 13.4% 24.6% 34.0%Jun - 21 29.1% 12.7% 25.8% 34.5%
Weighted Averages by country. * Norwegian banks have not implemented yet the reporting framework based on CRR2/CRD5. Therefore, Norwegian figures are included in the EBA Risk dashboard only until March 2021.
Weighted average. Banks are classified in the size class according to their average total assets between Dec. 2014 and Jun. 2021.
Period Weighted average 25th 50th 75th
5th and 95th pct, interquartile range and median.Total numerator and denominator.
Dec 2014 =100.
Country dispersion (as of Jun. 2021) RI by size class
Funding and Liquidity
20 - Asset encumbrance ratio
Dispersion Numerator and denominator: trends
90
100
110
120
130
Dec
- 14
Mar
- 15
Jun
- 15
Sep
- 15
Dec
- 15
Mar
- 16
Jun
- 16
Sep
- 16
Dec
- 16
Mar
- 17
Jun
- 17
Sep
- 17
Dec
- 17
Mar
- 18
Jun
- 18
Sep
- 18
Dec
- 18
Mar
- 19
Jun
- 19
Sep
- 19
Dec
- 19
Mar
- 20
Jun
- 20
Sep
- 20
Dec
- 20
Mar
- 21
Jun
- 21
Numerator: Encumbered assets and collateralDenominator: Total assets and collateral
0%
10%
20%
30%
40%
50%
DK DE IT FR FI GR ES SK NL SE IE AT BE IS PT CY HU CZ HR MT LV LU EE SI PL LT BG RO N
O*
EU27 / EEA
17%
19%
21%
23%
25%
27%
29%
31%
33%
35%
37%
39%
41%
43%
Dec
- 14
Mar
- 15
Jun
- 15
Sep
- 15
Dec
- 15
Mar
- 16
Jun
- 16
Sep
- 16
Dec
- 16
Mar
- 17
Jun
- 17
Sep
- 17
Dec
- 17
Mar
- 18
Jun
- 18
Sep
- 18
Dec
- 18
Mar
- 19
Jun
- 19
Sep
- 19
Dec
- 19
Mar
- 20
Jun
- 20
Sep
- 20
Dec
- 20
Mar
- 21
Jun
- 21
Small Medium All banks Large
0%
10%
20%
30%
40%
50%
60%
70%
Dec
- 14
Mar
- 15
Jun
- 15
Sep
- 15
Dec
- 15
Mar
- 16
Jun
- 16
Sep
- 16
Dec
- 16
Mar
- 17
Jun
- 17
Sep
- 17
Dec
- 17
Mar
- 18
Jun
- 18
Sep
- 18
Dec
- 18
Mar
- 19
Jun
- 19
Sep
- 19
Dec
- 19
Mar
- 20
Jun
- 20
Sep
- 20
Dec
- 20
Mar
- 21
Jun
- 21

26
Dec - 16 141.3% 128.4% 153.7% 236.9%Jun - 17 145.5% 135.8% 159.0% 230.8%Dec - 17 148.3% 139.7% 166.8% 233.7%Jun - 18 148.2% 139.8% 161.9% 222.8%Dec - 18 151.4% 140.4% 171.6% 247.5%Jun - 19 149.0% 140.2% 171.4% 240.0%Dec - 19 149.8% 143.8% 169.3% 225.3%Mar - 20 148.7% 140.8% 172.1% 243.4%Jun - 20 165.7% 159.3% 190.2% 257.8%Sep - 20 171.0% 161.0% 185.4% 256.0%Dec - 20 172.9% 163.1% 195.4% 253.5%Mar - 21 173.6% 162.0% 202.7% 266.2%Jun - 21 172.4% 167.1% 208.2% 266.3%
Weighted Averages by country. * Norwegian banks have not implemented yet the reporting framework based on CRR2/CRD5. Therefore, Norwegian figures are included in the EBA Risk dashboard only until March 2021.
Weighted average. Banks are classified in the size class according to their average total assets between Dec. 2014 and Jun. 2021.
Period Weighted average 25th 50th 75th
5th and 95th pct, interquartile range and median.Total numerator and denominator.
Sep 2016 =100.
Country dispersion (as of Jun. 2021) RI by size class
Funding and Liquidity
21 - Liquidity coverage ratio
Dispersion Numerator and denominator: trends
90
100
110
120
130
140
150
160
170
Sep
- 16
Dec
- 16
Mar
- 17
Jun
- 17
Sep
- 17
Dec
- 17
Mar
- 18
Jun
- 18
Sep
- 18
Dec
- 18
Mar
- 19
Jun
- 19
Sep
- 19
Dec
- 19
Mar
- 20
Jun
- 20
Sep
- 20
Dec
- 20
Mar
- 21
Jun
- 21
Numerator: Liquidity BufferDenominator: Net Liquidity Outflow
0%
100%
200%
300%
400%
500%
600%
MT LT RO CY LV SI PT BG PL HU GR ES IT SK HR AT BE EE FI IE NL CZ DE DK FR LU SE IS*
NO
*
EU27 / EEA
100%
120%
140%
160%
180%
200%
220%
240%
260%
280%
300%
Sep
- 16
Dec
- 16
Mar
- 17
Jun
- 17
Sep
- 17
Dec
- 17
Mar
- 18
Jun
- 18
Sep
- 18
Dec
- 18
Mar
- 19
Jun
- 19
Sep
- 19
Dec
- 19
Mar
- 20
Jun
- 20
Sep
- 20
Dec
- 20
Mar
- 21
Jun
- 21
Small Medium All banks Large
0%
100%
200%
300%
400%
500%
600%
700%
800%
900%
1000%
Sep
- 16
Dec
- 16
Mar
- 17
Jun
- 17
Sep
- 17
Dec
- 17
Mar
- 18
Jun
- 18
Sep
- 18
Dec
- 18
Mar
- 19
Jun
- 19
Sep
- 19
Dec
- 19
Mar
- 20
Jun
- 20
Sep
- 20
Dec
- 20
Mar
- 21
Jun
- 21

STATISTICAL ANNEXSTATISTICAL ANNEX

28
% of total assets
Sep-20 Dec-20 Mar-21 Jun-21 Sep-20 Dec-20 Mar-21 Jun-21 Sep-20 Dec-20 Mar-21 Jun-21 Sep-20 Dec-20 Mar-21 Jun-21 Sep-20 Dec-20 Mar-21 Jun-21 Sep-20 Dec-20 Mar-21 Jun-21
AT 15.6% 17.7% 19.8% 20.0% 0.3% 0.5% 0.5% 0.5% 13.9% 13.4% 13.0% 13.3% 65.1% 63.4% 62.3% 61.9% 1.9% 1.7% 1.4% 1.3% 3.3% 3.2% 3.0% 3.0%
BE 14.3% 15.5% 19.6% 20.6% 0.2% 0.2% 0.2% 0.2% 14.5% 14.1% 13.4% 13.2% 60.3% 59.8% 57.7% 59.1% 4.8% 4.5% 3.6% 3.3% 5.8% 5.8% 5.5% 3.6%
BG 18.3% 20.5% 17.7% 15.9% 0.1% 0.1% 0.1% 0.1% 15.7% 15.2% 16.0% 16.1% 61.1% 59.8% 61.8% 63.4% 0.2% 0.2% 0.3% 0.2% 4.5% 4.3% 4.1% 4.2%
CY 24.3% 26.4% 29.1% 36.7% 0.1% 0.1% 0.1% 0.1% 20.7% 18.5% 18.2% 16.2% 45.6% 45.3% 43.4% 39.4% 0.1% 0.1% 0.0% 0.0% 9.2% 9.6% 9.1% 7.6%
CZ 2.9% 2.2% 2.4% 2.2% 0.1% 0.1% 0.1% 0.0% 13.6% 14.5% 14.4% 15.4% 78.6% 79.1% 79.7% 79.3% 2.8% 2.1% 1.6% 1.5% 1.9% 2.0% 1.8% 1.7%
DE 15.2% 13.8% 17.2% 18.4% 0.7% 0.8% 0.8% 0.9% 13.7% 13.8% 12.9% 12.6% 54.9% 55.4% 55.3% 55.1% 13.0% 13.6% 11.2% 10.4% 2.6% 2.7% 2.6% 2.6%
DK 5.1% 7.1% 7.0% 7.2% 0.6% 0.6% 0.7% 0.7% 14.0% 13.5% 14.2% 14.1% 70.5% 69.0% 69.5% 69.9% 7.4% 7.5% 6.3% 5.5% 2.4% 2.4% 2.4% 2.4%
EE 25.3% 28.1% 25.9% 22.7% 0.0% 0.0% 0.0% 0.0% 7.8% 7.0% 7.6% 7.8% 65.6% 63.5% 65.4% 68.4% 0.2% 0.1% 0.2% 0.2% 1.1% 1.2% 0.9% 0.9%
ES 10.1% 10.2% 11.9% 12.5% 0.8% 0.9% 1.0% 1.1% 13.8% 12.1% 13.1% 13.1% 63.7% 58.4% 61.8% 63.5% 4.7% 4.0% 3.5% 3.3% 6.9% 14.4% 8.8% 6.4%
FI 11.3% 9.3% 13.0% 12.8% 0.8% 0.7% 1.6% 2.1% 12.5% 11.6% 11.5% 11.1% 65.8% 68.4% 65.6% 66.2% 7.3% 7.5% 5.9% 5.3% 2.3% 2.4% 2.5% 2.4%
FR 12.6% 12.8% 14.2% 14.8% 2.3% 2.7% 3.5% 3.7% 10.8% 10.0% 10.6% 10.2% 58.9% 59.2% 58.3% 58.2% 8.8% 8.7% 7.5% 7.0% 6.5% 6.7% 6.0% 6.0%
GR 10.5% 12.6% 14.2% 15.9% 0.2% 0.3% 0.3% 0.2% 14.4% 14.5% 15.5% 15.9% 55.6% 53.2% 51.5% 49.1% 3.6% 3.5% 3.0% 2.8% 15.6% 15.9% 15.5% 16.0%
HR 15.6% 18.2% 19.6% 19.9% 0.3% 0.2% 0.2% 0.1% 11.4% 11.2% 10.8% 11.0% 70.0% 67.7% 66.6% 66.4% 0.3% 0.2% 0.3% 0.2% 2.4% 2.5% 2.5% 2.3%
HU 9.2% 9.8% 9.6% 9.3% 0.3% 0.3% 0.3% 0.3% 22.0% 21.5% 24.6% 24.6% 63.0% 63.2% 60.5% 60.8% 1.3% 1.1% 0.9% 0.9% 4.1% 4.1% 4.1% 4.0%
IE 18.3% 18.8% 22.3% 26.9% 0.2% 0.2% 0.2% 0.1% 14.3% 14.0% 13.3% 12.4% 58.6% 58.0% 54.9% 51.9% 3.6% 4.5% 4.5% 3.8% 4.9% 4.6% 4.8% 4.9%
IS 10.4% 7.5% 8.1% 9.3% 1.7% 1.9% 2.4% 2.6% 10.7% 10.6% 9.3% 9.3% 73.7% 77.3% 77.2% 76.1% 0.4% 0.4% 0.2% 0.2% 3.1% 2.4% 2.9% 2.5%
IT 7.6% 13.7% 14.8% 15.9% 1.1% 1.2% 1.1% 1.2% 20.5% 19.1% 20.4% 20.6% 61.6% 56.1% 55.4% 54.3% 3.5% 3.5% 3.0% 2.7% 5.7% 6.5% 5.3% 5.2%
LT 38.0% 36.8% 43.9% 41.0% 0.1% 0.0% 0.0% 0.0% 5.6% 5.4% 5.3% 8.5% 55.4% 56.8% 49.8% 49.6% 0.1% 0.1% 0.1% 0.1% 0.9% 0.8% 0.8% 0.8%
LU 16.6% 21.1% 21.2% 22.5% 0.3% 0.4% 0.4% 0.5% 12.8% 15.9% 14.9% 14.7% 66.4% 58.7% 59.6% 58.7% 1.2% 1.1% 1.0% 0.8% 2.7% 2.8% 2.8% 2.8%
LV 26.0% 30.1% 26.4% 29.1% 0.2% 0.1% 0.1% 0.1% 19.5% 17.9% 17.2% 17.1% 52.8% 50.8% 55.0% 52.6% 0.3% 0.2% 0.3% 0.1% 1.1% 0.8% 1.0% 0.9%
MT 21.9% 23.9% 23.3% 23.2% 0.2% 0.3% 0.2% 0.2% 26.7% 25.0% 24.6% 25.9% 48.2% 47.7% 48.8% 47.8% 0.1% 0.0% 0.1% 0.1% 3.0% 3.1% 2.9% 2.8%
NL 14.7% 13.3% 15.6% 15.3% 0.5% 0.6% 0.6% 0.8% 8.2% 8.3% 7.6% 7.6% 70.1% 71.2% 69.4% 69.8% 3.3% 3.5% 2.8% 2.5% 3.3% 3.3% 3.9% 4.0%
NO* 10.3% 9.3% 13.1% n.a. 0.3% 0.3% 0.3% n.a. 10.8% 11.4% 11.2% n.a. 70.5% 70.8% 68.9% n.a. 6.6% 6.6% 4.6% n.a. 1.5% 1.5% 1.8% n.a.
PL 1.9% 2.3% 3.1% 2.1% 0.2% 0.2% 0.3% 0.3% 30.4% 31.0% 31.0% 31.8% 62.5% 61.3% 60.7% 60.8% 1.9% 1.8% 1.6% 1.5% 3.2% 3.4% 3.4% 3.4%
PT 8.1% 9.5% 11.2% 12.5% 1.3% 1.3% 1.2% 1.2% 24.0% 23.2% 22.6% 22.8% 59.0% 59.0% 57.6% 56.6% 1.0% 0.9% 0.9% 0.8% 6.5% 6.2% 6.4% 6.2%
RO 14.8% 16.6% 13.9% 14.4% 0.2% 0.2% 0.1% 0.1% 28.5% 29.3% 31.8% 32.0% 54.0% 51.5% 51.9% 51.3% 0.1% 0.1% 0.1% 0.1% 2.4% 2.3% 2.2% 2.1%
SE 13.1% 11.0% 16.4% 16.2% 0.9% 1.1% 1.2% 1.2% 8.7% 8.1% 8.4% 9.0% 73.2% 75.5% 70.1% 70.3% 2.8% 2.8% 2.3% 1.9% 1.3% 1.5% 1.5% 1.4%
SI 18.8% 20.4% 21.2% 22.9% 0.5% 0.5% 0.5% 0.5% 23.0% 23.7% 23.3% 22.9% 55.1% 52.9% 52.4% 51.4% 0.1% 0.1% 0.1% 0.1% 2.5% 2.4% 2.4% 2.2%
SK 6.3% 7.9% 16.0% 17.3% 0.1% 0.0% 0.0% 0.0% 14.6% 13.8% 12.1% 12.3% 76.5% 75.9% 69.7% 68.5% 0.6% 0.6% 0.4% 0.4% 1.9% 1.8% 1.7% 1.6%
EU/EEA 12.2% 12.5% 14.7% 15.4% 1.2% 1.4% 1.7% 1.9% 13.2% 12.5% 12.8% 12.7% 61.5% 60.5% 59.9% 59.9% 7.0% 6.9% 5.8% 5.4% 5.0% 6.2% 5.1% 4.8%
T02_1 T02_1 T02_1 T02_1 T02_2 T02_2 T02_2 T02_2 T03_1 T03_1 T03_1 T03_1 T03_1 T03_2 T03_2 T03_2 T03_2 T03_3 T03_3 T03_3 T03_3202009 202012 202103 202106 202009 202012 202103 202106 202009 202012 202103 202106 202009 202012 202103 202106 202009 202012 202103 202106
Volumes bn EUR % of total financial assets
Sep-20 Dec-20 Mar-21 Jun-21 Sep-20 Dec-20 Mar-21 Jun-21 Sep-20 Dec-20 Mar-21 Jun-21 Sep-20 Dec-20 Mar-21 Jun-21 Sep-20 Dec-20 Mar-21 Jun-21
692.2 705.0 743.8 750.7 669.5 682.3 721.7 728.4 0.9703349 90.4% 90.8% 91.5% 91.7% 5.6% 5.4% 5.1% 5.1% 4.0% 3.8% 3.4% 3.2%
1,194.6 1,193.7 1,243.5 1,246.3 1,125.5 1,124.0 1,174.9 1,201.4 0.963991 89.2% 90.2% 91.4% 91.8% 3.8% 3.7% 3.5% 3.3% 7.0% 6.1% 5.1% 4.8%
35.2 36.6 37.5 37.7 33.6 35.1 35.9 36.1 0.957749 87.9% 88.3% 88.8% 88.7% 11.1% 10.7% 10.1% 10.2% 1.0% 1.0% 1.1% 1.1%
36.3 36.4 38.0 41.6 33.0 32.9 34.5 38.4 0.9240121 95.6% 96.1% 96.2% 96.5% 3.4% 2.8% 2.8% 2.6% 1.1% 1.1% 1.0% 0.9%
171.8 170.0 184.5 191.8 168.5 166.6 181.1 188.6 0.983147 94.5% 95.7% 95.9% 95.5% 2.1% 1.9% 1.8% 1.9% 3.4% 2.4% 2.3% 2.6%
3,915.7 3,742.7 3,864.6 3,875.0 3,814.5 3,642.9 3,765.5 3,775.0 0.9741897 70.5% 70.2% 72.9% 73.8% 6.4% 6.7% 6.0% 5.8% 23.1% 23.1% 21.1% 20.4%
794.3 813.6 810.9 793.7 775.3 794.4 791.3 774.4 0.975681 31.5% 33.3% 33.6% 34.0% 2.0% 2.0% 2.1% 2.1% 66.5% 64.7% 64.3% 63.9%
39.5 41.5 36.7 35.6 39.0 41.0 36.4 35.2 0.9907214 91.9% 92.8% 92.1% 92.1% 0.0% 0.0% 0.0% 0.0% 8.1% 7.2% 7.9% 7.9%
3,477.5 3,476.1 3,539.5 3,498.1 3,238.6 2,976.2 3,229.7 3,272.8 0.9356125 82.9% 82.8% 84.0% 84.6% 6.6% 6.9% 6.4% 6.1% 10.5% 10.3% 9.6% 9.3%
724.1 698.2 728.2 724.6 707.6 681.3 709.7 706.9 0.9755329 65.0% 67.3% 67.5% 68.2% 7.0% 7.1% 6.9% 6.7% 28.1% 25.6% 25.7% 25.1%
8,465.1 8,308.2 8,617.8 8,631.3 7,911.0 7,755.5 8,098.9 8,110.7 0.9396861 71.7% 72.9% 72.3% 73.4% 3.8% 3.8% 3.6% 3.5% 24.4% 23.3% 24.2% 23.1%
274.8 283.0 286.3 293.5 231.8 238.1 242.0 246.6 0.8401505 88.0% 87.8% 87.9% 88.2% 7.1% 7.2% 7.7% 7.4% 5.0% 4.9% 4.5% 4.4%
46.7 47.8 48.5 50.0 45.6 46.6 47.3 48.9 0.9767606 88.9% 89.3% 89.7% 89.7% 10.2% 10.0% 9.5% 9.6% 0.8% 0.8% 0.8% 0.7%
83.7 87.6 114.3 120.7 80.2 84.0 109.7 115.8 0.9595531 88.6% 86.6% 86.5% 87.2% 9.1% 8.8% 9.2% 8.3% 2.4% 4.7% 4.2% 4.5%
279.8 285.6 307.4 321.5 266.0 272.4 292.8 305.7 0.9509273 84.1% 83.7% 84.1% 85.6% 11.4% 11.0% 10.4% 9.6% 4.5% 5.4% 5.5% 4.9%
25.7 26.1 28.1 29.6 24.9 25.5 27.3 28.9 0.9748289 86.5% 86.5% 87.2% 87.1% 3.8% 3.5% 2.6% 2.8% 9.7% 10.1% 10.2% 10.1%
2,582.7 2,623.6 2,752.3 2,805.6 2,434.4 2,452.0 2,606.8 2,659.1 0.9477816 83.4% 84.9% 85.6% 85.2% 8.5% 7.4% 7.1% 7.4% 8.0% 7.7% 7.3% 7.4%
25.1 27.2 27.9 29.2 24.8 27.0 27.7 29.0 0.9924808 97.0% 97.0% 96.9% 93.6% 0.1% 0.1% 0.2% 0.2% 2.9% 2.9% 2.9% 6.2%
218.7 177.3 183.5 186.8 212.8 172.3 178.4 181.6 0.9720738 73.0% 91.8% 92.3% 92.9% 5.2% 6.4% 6.0% 5.3% 21.8% 1.8% 1.7% 1.8%
15.8 16.5 17.3 17.3 15.6 16.4 17.2 17.1 0.9908546 88.6% 90.1% 90.0% 90.5% 3.1% 2.1% 1.9% 1.6% 8.3% 7.9% 8.1% 7.9%
22.5 22.8 23.8 23.8 21.8 22.1 23.1 23.1 0.9718549 88.8% 89.7% 89.9% 89.0% 10.3% 9.5% 9.3% 10.1% 0.9% 0.8% 0.8% 0.8%
2,290.7 2,193.3 2,338.1 2,303.1 2,215.0 2,122.0 2,246.6 2,211.9 0.9603729 87.3% 87.4% 87.8% 87.9% 5.1% 5.2% 4.6% 4.6% 7.6% 7.4% 7.6% 7.5%
297.2 303.0 324.0 n.a. 292.7 298.4 318.1 n.a. #VALUE! 77.9% 76.9% 79.1% n.a. 5.3% 5.7% 5.8% n.a. 16.7% 17.4% 15.0% n.a.
182.4 183.6 186.5 191.3 176.7 177.4 180.3 184.8 0.9658124 73.4% 73.8% 75.2% 76.6% 23.0% 23.0% 22.0% 20.6% 3.5% 3.3% 2.8% 2.7%
354.2 355.0 284.5 294.3 331.0 333.0 266.2 276.0 0.9379714 83.7% 85.0% 83.5% 84.1% 11.7% 11.2% 12.7% 12.4% 4.6% 3.8% 3.8% 3.5%
49.1 52.0 52.7 53.8 48.0 50.8 51.5 52.7 0.978655 77.3% 75.9% 72.9% 72.6% 20.7% 22.0% 24.9% 25.2% 2.1% 2.1% 2.2% 2.1%
941.9 939.9 1,014.0 1,030.0 929.5 925.4 998.5 1,015.4 0.9857835 85.3% 87.0% 86.5% 87.0% 1.0% 1.1% 1.0% 1.1% 13.7% 11.9% 12.5% 12.0%
27.7 32.4 33.2 34.7 27.0 31.6 32.4 33.9 0.9776392
82.7% 81.1% 82.6% 83.7% 16.7% 18.1% 16.7% 16.0% 0.6% 0.8% 0.7% 0.3%
54.1 55.6 60.3 62.2 53.1 54.6 59.3 61.2 0.9840549 95.4% 96.0% 96.7% 96.8% 3.7% 3.4% 2.7% 2.5% 0.9% 0.7% 0.6% 0.7%
25,992.2 25,638.3 26,706.4 26,365.1 24,687.9 24,052.6 25,346.4 25,093.0 0.9517493
76.2% 76.8% 77.5% 78.2% 5.5% 5.4% 5.1% 5.0% 18.3% 17.7% 17.3% 16.8%
95.2%
* Norwegian banks have not implemented yet the reporting framework based on CRR2/CRD5. Therefore, Norwegian figures are included in the EBA Risk dashboard only until March 2021.
SI SI
PT
RO
SE
SK
NO*
PL
DE
DK
IS
SK
SE
LU
LV
MT
NL
HR
HU
IE IE
IS
IT
LT
IT
LT
CY
CZ
Individual country data includes subsidiaries, which are excluded from EU aggregate. For example, at country level the subsidiary in country X of a bank domiciled in country Y is included both in data for countries X and Y (for the latter as part of the consolidated entity). In the EU aggregate, only the consolidated entity domiciled in country Y is considered. The sample of banks is unbalanced and reviewed annually. Being an unbalanced sample, the number of reporting banks per country can display minor variations between quarters, which might accordingly affect quarterly changes in absolute and relative figures. As of Q1 2020 onwards UK banks are removed from the EU/EEA aggregate and subsidiaries of UK banks in EU member states are used instead.
EU/EEAEU/EEA
Total Assets Total Financial Assets
BE
AT
BE
AT
GR
Statistical Annex
Asset composition and volumes
Asset composition
Cash balances Equity instruments Debt securities Loans and advances Derivatives Other Assets
RO
PT
CY
DK
DE
CZ
LU
LV
MT
NL
NO*
PL
HR
HU
Assets Financial Assets
GR
FR
FI
ES
EE
BG
Share of financial assets valued at (amortised) cost
Share of financial assets at fair value through OCI
Share of financial assets at fair value through profit&loss
EE
ES
FI
FR
BG

29
Sep-20 Dec-20 Mar-21 Jun-21 Sep-20 Dec-20 Mar-21 Jun-21 Sep-20 Dec-20 Mar-21 Jun-21 Sep-20 Dec-20 Mar-21 Jun-21 Sep-20 Dec-20 Mar-21 Jun-21 Sep-20 Dec-20 Mar-21 Jun-21
AT 554.4 566.9 606.2 608.8 168.7 172.1 173.6 177.8 116.0 118.5 118.1 121.1 198.8 198.0 204.3 202.7 72.2 72.3 73.5 73.1 58.4 59.3 59.6 58.1
BE 892.4 902.2 963.9 993.2 296.9 302.4 305.7 311.3 248.2 254.2 265.4 269.9 247.1 247.4 249.8 263.7 118.2 119.6 123.4 125.3 56.2 57.4 60.5 60.7
BG 28.7 30.0 30.6 30.6 9.0 9.0 9.2 9.6 4.2 4.3 4.3 4.5 11.2 11.3 11.3 11.3 6.1 5.6 5.6 5.4 5.9 5.7 5.7 5.4
CY 27.0 27.3 28.8 32.8 9.4 9.1 9.1 9.0 7.1 6.9 6.9 6.9 8.0 7.8 7.9 7.8 6.4 6.2 6.2 6.3 5.9 5.8 5.8 5.7
CZ 140.2 138.7 151.4 155.2 48.9 51.3 52.2 54.8 37.5 39.7 40.5 42.6 29.8 29.9 30.2 30.7 11.3 11.7 11.8 12.0 12.1 13.0 13.1 13.1
DE 2,706.4 2,557.7 2,765.5 2,807.6 518.4 525.5 527.5 535.2 350.7 357.8 361.2 365.7 797.7 779.3 803.1 788.4 192.4 192.8 202.9 204.6 240.0 240.0 241.9 248.8
DK 604.6 622.7 623.7 616.0 71.3 73.5 74.8 74.6 53.9 56.0 57.1 56.8 82.3 81.7 82.1 81.1 34.1 34.6 39.3 38.6 26.4 27.3 27.2 25.4
EE 35.9 38.0 33.4 32.3 13.9 14.0 13.2 13.4 11.5 11.6 11.0 11.2 11.3 11.2 10.0 10.1 7.6 8.0 6.9 7.1 6.9 6.8 5.9 5.9
ES 2,570.8 2,381.6 2,604.6 2,653.2 1,139.4 1,056.8 1,145.1 1,167.4 804.7 736.6 817.9 821.3 760.6 688.3 740.4 738.5 318.3 299.4 320.5 318.5 124.8 105.5 111.9 110.3
FI 516.5 515.9 536.7 540.2 197.2 203.4 198.1 201.3 162.9 169.2 164.5 166.8 152.3 160.8 159.8 154.6 57.7 59.9 56.3 57.3 33.8 34.0 35.4 34.7
FR 5,455.9 5,439.8 5,641.2 5,739.8 1,870.0 1,893.7 1,908.6 1,942.0 601.6 609.1 644.9 657.2 1,672.0 1,669.9 1,691.4 1,695.4 754.3 759.8 769.8 785.3 179.4 200.9 220.8 226.7
GR 208.8 210.2 213.5 204.7 75.3 69.6 68.9 55.1 55.3 50.5 49.8 38.9 90.0 89.9 91.2 81.3 43.4 46.3 46.9 38.4 31.1 30.6 31.1 24.2
HR 40.1 41.3 42.0 43.1 13.7 13.6 13.6 13.9 5.1 5.4 5.4 5.6 9.8 10.1 10.1 10.1 5.4 5.2 5.2 5.2 4.3 4.4 4.4 4.4
HU 61.5 65.0 81.7 86.0 24.5 22.3 27.0 28.4 12.0 10.9 13.3 13.6 21.6 21.8 27.9 29.4 8.7 9.1 13.2 14.1 7.9 7.8 9.5 9.5
IE 218.8 222.8 241.1 256.0 85.2 85.4 85.3 84.0 74.8 75.2 75.3 74.0 65.3 65.0 65.9 65.9 27.9 28.4 28.8 28.9 17.2 17.1 17.7 18.1
IS 21.9 22.4 24.2 25.5 8.4 9.4 10.4 11.2 7.2 8.1 9.1 9.9 10.0 10.1 10.5 10.6 5.0 4.9 5.5 4.9 4.5 4.5 4.9 5.1
IT 1,823.4 1,855.5 1,959.9 1,990.8 518.6 509.3 539.6 549.7 361.8 355.8 375.0 385.6 742.4 715.1 733.3 724.4 334.6 323.3 336.0 340.9 171.9 159.3 161.7 158.0
LT 23.2 25.3 25.9 26.2 7.8 7.9 8.0 8.3 6.5 6.7 6.8 7.0 5.9 5.6 5.7 5.8 3.8 3.2 3.1 3.1 3.7 3.6 3.6 3.6
LU 182.6 142.4 149.3 152.2 20.4 21.0 21.6 22.2 13.8 14.8 15.1 15.5 47.8 49.2 50.3 50.4 21.7 22.7 23.2 23.8 5.1 6.1 7.6 7.3
LV 12.4 13.3 14.1 14.1 3.8 3.8 4.1 4.2 3.0 3.1 3.1 3.2 4.4 4.3 5.1 4.7 2.8 2.4 3.0 3.0 2.6 2.6 2.7 2.5
MT 15.9 16.5 17.4 17.1 5.7 6.0 6.3 6.6 4.7 5.0 5.3 5.7 3.5 3.5 3.5 3.5 1.9 2.0 2.1 2.1 0.4 0.4 0.7 0.8
NL 1,940.4 1,852.2 1,988.1 1,958.9 738.8 740.2 744.8 748.4 681.1 682.8 687.3 691.4 550.5 540.0 559.1 547.2 146.1 173.1 173.9 174.4 162.6 162.3 159.6 161.6
NO* 241.7 244.5 267.4 n.a. 95.7 102.4 107.9 n.a. 84.6 90.9 95.8 n.a. 79.7 82.2 84.7 n.a. 29.1 30.2 31.3 n.a. 23.5 25.0 26.8 n.a.
PL 120.2 119.5 121.7 123.5 70.9 69.6 69.9 72.5 47.4 46.4 45.8 47.0 40.8 40.9 41.5 42.5 19.4 19.4 21.4 21.7 14.0 13.3 14.4 14.2
PT 245.2 249.5 201.4 209.0 119.1 120.0 96.1 97.3 101.0 101.6 81.4 82.6 78.3 77.6 59.0 60.7 53.3 53.4 38.3 40.4 22.4 22.2 14.9 15.2
RO 33.2 34.8 33.9 34.5 15.2 15.3 15.3 15.7 9.8 10.0 10.0 10.2 8.9 9.1 9.5 9.7 4.5 4.6 4.7 4.7 3.4 3.3 3.1 3.2
SE 788.9 798.5 861.6 874.4 338.9 359.5 357.8 367.3 304.1 323.3 323.5 332.5 265.0 272.7 271.2 276.0 137.3 142.4 144.4 146.4 99.3 104.9 104.6 107.4
SI 20.5 23.6 24.3 25.6 8.4 9.4 9.5 9.7 3.3 3.8 3.9 4.0 6.2 6.8 7.0 7.2 3.4 3.9 3.9 4.2 2.7 2.8 2.8 2.8
SK 45.2 46.9 52.0 53.6 27.1 27.4 27.6 28.2 21.5 21.5 21.8 22.1 13.7 13.8 13.8 13.8 5.6 5.7 5.7 5.7 5.1 5.0 5.0 5.0
EU/EEA 18,515.6 18,171.7 19,308.1 19,226.9 6,180.6 6,158.3 6,317.2 6,279.3 3,936.0 3,914.8 4,074.6 4,012.7 5,679.3 5,567.1 5,709.9 5,580.6 2,282.6 2,300.6 2,363.6 2,344.3 1,244.6 1,243.4 1,274.5 1,247.7
T21_1 T21_1 T21_1 T21_1 T21_2 T21_2 T21_2 T21_2 T21_3 T21_3 T21_3 T21_3 T21_4 T21_4 T21_4 T21_4 T21_5 T21_5 T21_5 T21_5 T21_6 T21_6 T21_6 T21_6202009 202012 202103 202106 202009 202012 202103 202106 202009 202012 202103 202106 202009 202012 202103 202106 202009 202012 202103 202106 202009 202012 202103 202106
Sep-20 Dec-20 Mar-21 Jun-21 Sep-20 Dec-20 Mar-21 Jun-21 Sep-20 Dec-20 Mar-21 Jun-21 Sep-20 Dec-20 Mar-21 Jun-21 Sep-20 Dec-20 Mar-21 Jun-21 Sep-20 Dec-20 Mar-21 Jun-21
AT 11.1 11.9 12.0 11.9 4.6 4.7 4.7 4.7 1.9 1.9 1.9 1.9 6.0 6.7 6.6 6.6 3.0 3.3 3.2 3.0 2.0 2.1 2.0 2.1
BE 16.9 17.8 17.4 16.8 5.8 5.9 6.0 5.7 4.3 4.4 4.5 4.3 9.3 10.1 9.6 9.3 4.5 4.9 4.6 4.5 2.1 2.7 2.4 2.5
BG 2.1 2.1 2.1 2.0 0.7 0.7 0.8 0.7 0.3 0.3 0.2 0.2 1.3 1.3 1.3 1.2 1.0 0.9 0.9 0.8 0.8 0.8 0.8 0.8
CY 3.9 3.1 3.1 3.0 2.2 1.8 1.8 1.8 1.7 1.4 1.4 1.4 1.5 1.2 1.2 1.1 1.4 1.1 1.1 1.0 1.1 0.9 0.8 0.7
CZ 1.8 2.0 2.1 2.1 0.8 0.9 0.9 0.9 0.3 0.4 0.4 0.4 1.0 1.1 1.2 1.2 0.4 0.5 0.6 0.6 0.3 0.4 0.4 0.4
DE 33.2 32.5 32.3 31.2 9.0 9.2 9.0 8.7 3.7 3.7 3.6 3.4 21.0 20.4 20.1 19.6 4.8 5.7 5.5 5.7 4.2 4.8 4.9 5.2
DK 11.3 11.6 11.4 12.6 2.0 2.0 1.9 2.0 1.1 1.1 1.0 1.2 4.1 4.5 4.1 4.2 2.0 2.0 2.2 2.1 0.9 1.0 1.0 1.1
EE 0.5 0.4 0.4 0.4 0.2 0.2 0.2 0.1 0.2 0.2 0.1 0.1 0.3 0.2 0.2 0.2 0.2 0.1 0.1 0.1 0.1 0.1 0.1 0.1
ES 76.9 69.7 80.5 83.1 41.4 36.9 43.7 44.8 25.8 21.4 25.4 25.7 34.9 32.2 36.2 37.6 21.7 20.1 22.4 23.3 11.9 10.2 11.2 11.4
FI 8.0 7.9 7.7 7.3 3.0 3.0 2.8 2.7 1.7 1.7 1.6 1.6 3.8 3.7 3.7 3.6 1.7 1.6 1.4 1.5 0.7 0.7 0.7 0.8
FR 125.4 119.3 119.6 118.1 51.7 49.3 48.8 47.7 16.2 15.3 15.3 14.9 67.4 64.7 66.1 65.8 34.2 33.0 33.1 34.1 7.1 7.6 7.9 8.1
GR 60.2 53.7 53.7 30.4 30.6 25.7 25.6 12.7 22.1 17.6 17.3 7.8 27.8 26.3 26.6 16.4 20.3 20.0 20.1 11.5 14.6 14.3 14.7 8.3
HR 1.8 1.8 1.7 1.7 0.8 0.8 0.8 0.8 0.2 0.2 0.2 0.2 1.0 1.0 0.9 0.8 0.7 0.6 0.5 0.5 0.5 0.4 0.4 0.4
HU 2.6 2.6 3.1 3.1 1.7 1.7 2.0 2.0 0.7 0.7 0.7 0.7 0.9 0.9 1.1 1.0 0.4 0.4 0.6 0.6 0.5 0.4 0.5 0.4
IE 8.8 9.3 8.8 8.6 5.0 4.9 4.4 3.9 4.4 4.3 3.7 3.3 3.8 4.4 4.3 4.4 2.5 2.7 2.7 3.0 1.8 2.2 2.1 2.2
IS 0.6 0.6 0.6 0.6 0.1 0.1 0.1 0.1 0.1 0.1 0.1 0.1 0.5 0.5 0.5 0.5 0.4 0.4 0.4 0.3 0.2 0.2 0.2 0.2
IT 98.0 76.7 78.8 74.0 23.5 19.0 20.6 20.4 11.7 9.5 10.7 10.8 70.2 53.5 53.7 49.5 43.5 32.9 33.1 31.7 29.7 21.5 21.7 19.8
LT 0.3 0.3 0.3 0.2 0.1 0.1 0.1 0.1 0.1 0.1 0.1 0.1 0.2 0.2 0.2 0.1 0.1 0.2 0.1 0.1 0.1 0.1 0.1 0.1
LU 2.5 2.6 2.4 2.2 0.4 0.5 0.4 0.4 0.3 0.4 0.3 0.2 1.8 1.9 1.7 1.6 1.1 1.2 1.0 1.0 0.2 0.3 0.4 0.3
LV 0.2 0.2 0.3 0.2 0.1 0.1 0.1 0.1 0.1 0.1 0.1 0.1 0.1 0.1 0.2 0.2 0.1 0.1 0.1 0.1 0.1 0.1 0.1 0.1
MT 0.5 0.6 0.6 0.6 0.2 0.2 0.2 0.2 0.1 0.1 0.1 0.1 0.3 0.3 0.4 0.3 0.2 0.2 0.2 0.2 0.0 0.0 0.1 0.1
NL 37.3 36.8 36.3 33.5 9.3 9.6 9.5 9.0 6.7 6.9 6.8 6.5 26.8 25.9 25.4 23.1 7.5 10.4 9.8 9.1 8.6 8.8 8.5 8.1
NO* 4.0 3.8 4.2 n.a. 0.4 0.4 0.6 n.a. 0.2 0.2 0.4 n.a. 3.6 3.4 3.4 n.a. 0.6 0.7 0.9 n.a. 0.3 0.3 0.4 n.a.
PL 6.0 6.0 6.4 6.4 2.7 2.7 3.0 3.1 0.9 0.9 1.0 1.1 3.1 3.1 3.2 3.2 1.8 1.8 1.9 1.9 1.5 1.6 1.6 1.6
PT 13.4 12.2 9.1 8.8 3.7 3.6 2.8 2.6 2.1 2.0 1.4 1.3 8.7 7.8 5.6 5.5 6.1 5.7 3.8 3.8 3.8 3.5 2.2 2.2
RO 1.3 1.3 1.3 1.3 0.6 0.6 0.6 0.6 0.3 0.3 0.3 0.2 0.7 0.7 0.7 0.7 0.3 0.3 0.3 0.3 0.4 0.3 0.3 0.3
SE 3.9 3.7 3.4 3.1 1.0 1.0 1.0 1.1 0.5 0.5 0.5 0.5 2.8 2.6 2.3 2.0 0.6 0.6 0.6 0.5 0.4 0.4 0.4 0.3
SI 0.7 0.8 0.8 0.7 0.2 0.3 0.3 0.3 0.1 0.1 0.1 0.1 0.3 0.4 0.4 0.4 0.3 0.3 0.3 0.3 0.2 0.3 0.3 0.2
SK 1.0 1.0 1.0 1.0 0.7 0.7 0.7 0.7 0.3 0.3 0.3 0.3 0.3 0.3 0.3 0.3 0.3 0.2 0.3 0.2 0.1 0.1 0.2 0.2
EU/EEA 510.4 467.7 477.9 442.2 193.2 177.1 184.2 169.2 103.2 91.2 95.3 84.4 290.0 264.8 267.7 247.5 153.5 143.4 144.3 134.6 90.2 81.8 82.0 73.8
(1) Gross carrying amounts, other than trading exposures.(2) Gross carrying amounts, loans and advances at amortised cost (excluding at fair value through OCI and through P&L, excluding trading exposures).
Statistical Annex
Loans: composition and asset quality
of which: loans and advances at amortised cost - by segment (volumes) (2)
Volumes bn EUR Loans and advances (1) HHs …of which mortgages NFCs …of which SMEs
* Norwegian banks have not implemented yet the reporting framework based on CRR2/CRD5. Therefore, Norwegian figures are included in the EBA Risk dashboard only until March 2021.
Individual country data includes subsidiaries, which are excluded from EU aggregate. For example, at country level the subsidiary in country X of a bank domiciled in country Y is included both in data for countries X and Y (for the latter as part of the consolidated entity). In the EU aggregate, only the consolidated entity domiciled in country Y is considered. The sample of banks is unbalanced and reviewed annually. Being an unbalanced sample, the number of reporting banks per country can display minor variations between quarters, which might accordingly affect quarterly changes in absolute and relative figures. As of Q1 2020 onwards UK banks are removed from the EU/EEA aggregate and subsidiaries of UK banks in EU member states are used instead.
…of which CRE
of which: non-performing loans and advances at amortised cost by segment (volumes) (2)
Volumes bn EUR
Non-performing loans and HHs …of which mortgages NFCs …of which SMEs …of which CRE
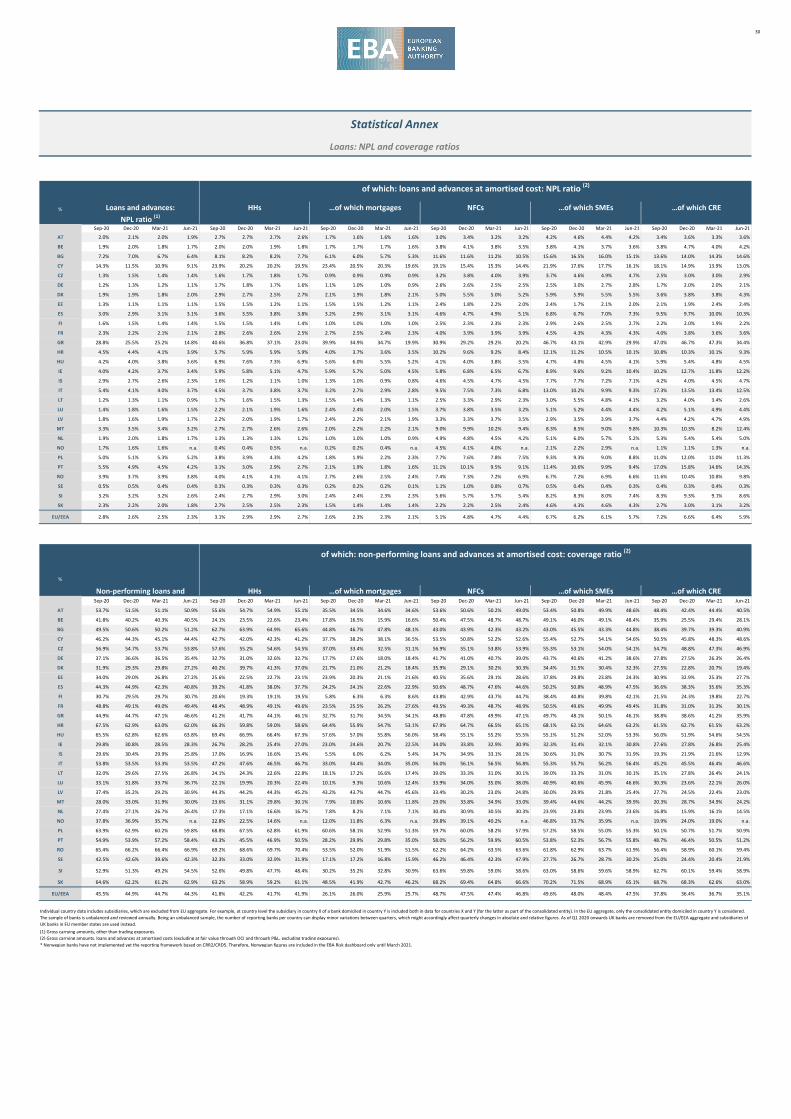
30
Sep-20 Dec-20 Mar-21 Jun-21 Sep-20 Dec-20 Mar-21 Jun-21 Sep-20 Dec-20 Mar-21 Jun-21 Sep-20 Dec-20 Mar-21 Jun-21 Sep-20 Dec-20 Mar-21 Jun-21 Sep-20 Dec-20 Mar-21 Jun-21
AT 2.0% 2.1% 2.0% 1.9% 2.7% 2.7% 2.7% 2.6% 1.7% 1.6% 1.6% 1.6% 3.0% 3.4% 3.2% 3.2% 4.2% 4.6% 4.4% 4.2% 3.4% 3.6% 3.3% 3.6%
BE 1.9% 2.0% 1.8% 1.7% 2.0% 2.0% 1.9% 1.8% 1.7% 1.7% 1.7% 1.6% 3.8% 4.1% 3.8% 3.5% 3.8% 4.1% 3.7% 3.6% 3.8% 4.7% 4.0% 4.2%
BG 7.2% 7.0% 6.7% 6.4% 8.1% 8.2% 8.2% 7.7% 6.1% 6.0% 5.7% 5.3% 11.6% 11.6% 11.2% 10.5% 15.6% 16.5% 16.0% 15.1% 13.6% 14.0% 14.3% 14.6%
CY 14.3% 11.5% 10.9% 9.1% 23.9% 20.2% 20.2% 19.5% 23.4% 20.5% 20.3% 19.6% 19.1% 15.4% 15.3% 14.4% 21.9% 17.6% 17.7% 16.1% 18.1% 14.9% 13.9% 13.0%
CZ 1.3% 1.5% 1.4% 1.4% 1.6% 1.7% 1.8% 1.7% 0.9% 0.9% 0.9% 0.9% 3.2% 3.8% 4.0% 3.9% 3.7% 4.6% 4.9% 4.7% 2.5% 3.0% 3.0% 2.9%
DE 1.2% 1.3% 1.2% 1.1% 1.7% 1.8% 1.7% 1.6% 1.1% 1.0% 1.0% 0.9% 2.6% 2.6% 2.5% 2.5% 2.5% 3.0% 2.7% 2.8% 1.7% 2.0% 2.0% 2.1%
DK 1.9% 1.9% 1.8% 2.0% 2.9% 2.7% 2.5% 2.7% 2.1% 1.9% 1.8% 2.1% 5.0% 5.5% 5.0% 5.2% 5.9% 5.9% 5.5% 5.5% 3.6% 3.8% 3.8% 4.3%
EE 1.3% 1.1% 1.1% 1.1% 1.5% 1.5% 1.2% 1.1% 1.5% 1.5% 1.2% 1.1% 2.4% 1.8% 2.2% 2.0% 2.4% 1.7% 2.1% 2.0% 2.1% 1.9% 2.4% 2.4%
ES 3.0% 2.9% 3.1% 3.1% 3.6% 3.5% 3.8% 3.8% 3.2% 2.9% 3.1% 3.1% 4.6% 4.7% 4.9% 5.1% 6.8% 6.7% 7.0% 7.3% 9.5% 9.7% 10.0% 10.3%
FI 1.6% 1.5% 1.4% 1.4% 1.5% 1.5% 1.4% 1.4% 1.0% 1.0% 1.0% 1.0% 2.5% 2.3% 2.3% 2.3% 2.9% 2.6% 2.5% 2.7% 2.2% 2.0% 1.9% 2.2%
FR 2.3% 2.2% 2.1% 2.1% 2.8% 2.6% 2.6% 2.5% 2.7% 2.5% 2.4% 2.3% 4.0% 3.9% 3.9% 3.9% 4.5% 4.3% 4.3% 4.3% 4.0% 3.8% 3.6% 3.6%
GR 28.8% 25.5% 25.2% 14.8% 40.6% 36.8% 37.1% 23.0% 39.9% 34.9% 34.7% 19.9% 30.9% 29.2% 29.2% 20.2% 46.7% 43.1% 42.9% 29.9% 47.0% 46.7% 47.3% 34.4%
HR 4.5% 4.4% 4.1% 3.9% 5.7% 5.9% 5.9% 5.9% 4.0% 3.7% 3.6% 3.5% 10.2% 9.6% 9.2% 8.4% 12.1% 11.2% 10.5% 10.1% 10.8% 10.3% 10.1% 9.3%
HU 4.2% 4.0% 3.8% 3.6% 6.9% 7.6% 7.3% 6.9% 5.6% 6.0% 5.5% 5.2% 4.1% 4.0% 3.8% 3.5% 4.7% 4.8% 4.5% 4.1% 5.9% 5.4% 4.8% 4.5%
IE 4.0% 4.2% 3.7% 3.4% 5.9% 5.8% 5.1% 4.7% 5.9% 5.7% 5.0% 4.5% 5.8% 6.8% 6.5% 6.7% 8.9% 9.6% 9.2% 10.4% 10.2% 12.7% 11.8% 12.2%
IS 2.9% 2.7% 2.6% 2.3% 1.6% 1.2% 1.1% 1.0% 1.3% 1.0% 0.9% 0.8% 4.6% 4.5% 4.7% 4.5% 7.7% 7.7% 7.2% 7.1% 4.2% 4.0% 4.5% 4.7%
IT 5.4% 4.1% 4.0% 3.7% 4.5% 3.7% 3.8% 3.7% 3.2% 2.7% 2.9% 2.8% 9.5% 7.5% 7.3% 6.8% 13.0% 10.2% 9.9% 9.3% 17.3% 13.5% 13.4% 12.5%
LT 1.2% 1.3% 1.1% 0.9% 1.7% 1.6% 1.5% 1.3% 1.5% 1.4% 1.3% 1.1% 2.5% 3.3% 2.9% 2.3% 3.0% 5.5% 4.8% 4.1% 3.2% 4.0% 3.4% 2.6%
LU 1.4% 1.8% 1.6% 1.5% 2.2% 2.1% 1.9% 1.6% 2.4% 2.4% 2.0% 1.5% 3.7% 3.8% 3.5% 3.2% 5.1% 5.2% 4.4% 4.4% 4.2% 5.1% 4.9% 4.4%
LV 1.8% 1.6% 1.9% 1.7% 2.2% 2.0% 1.9% 1.7% 2.4% 2.2% 2.1% 1.9% 3.3% 3.3% 3.7% 3.5% 2.9% 3.5% 3.9% 3.7% 4.4% 4.2% 4.7% 4.9%
MT 3.3% 3.5% 3.4% 3.2% 2.7% 2.7% 2.6% 2.6% 2.0% 2.2% 2.2% 2.1% 9.0% 9.9% 10.2% 9.4% 8.3% 8.5% 9.0% 9.8% 10.3% 10.3% 8.2% 12.4%
NL 1.9% 2.0% 1.8% 1.7% 1.3% 1.3% 1.3% 1.2% 1.0% 1.0% 1.0% 0.9% 4.9% 4.8% 4.5% 4.2% 5.1% 6.0% 5.7% 5.2% 5.3% 5.4% 5.4% 5.0%
NO 1.7% 1.6% 1.6% n.a. 0.4% 0.4% 0.5% n.a. 0.2% 0.2% 0.4% n.a. 4.5% 4.1% 4.0% n.a. 2.1% 2.2% 2.9% n.a. 1.1% 1.1% 1.3% n.a.
PL 5.0% 5.1% 5.3% 5.2% 3.8% 3.9% 4.3% 4.2% 1.8% 1.9% 2.2% 2.3% 7.7% 7.6% 7.8% 7.5% 9.3% 9.3% 9.0% 8.8% 11.0% 12.0% 11.0% 11.3%
PT 5.5% 4.9% 4.5% 4.2% 3.1% 3.0% 2.9% 2.7% 2.1% 1.9% 1.8% 1.6% 11.1% 10.1% 9.5% 9.1% 11.4% 10.6% 9.9% 9.4% 17.0% 15.8% 14.6% 14.3%
RO 3.9% 3.7% 3.9% 3.8% 4.0% 4.1% 4.1% 4.1% 2.7% 2.6% 2.5% 2.4% 7.4% 7.3% 7.2% 6.9% 6.7% 7.2% 6.9% 6.6% 11.6% 10.4% 10.8% 9.8%
SE 0.5% 0.5% 0.4% 0.4% 0.3% 0.3% 0.3% 0.3% 0.2% 0.2% 0.2% 0.1% 1.1% 1.0% 0.8% 0.7% 0.5% 0.4% 0.4% 0.3% 0.4% 0.3% 0.4% 0.3%
SI 3.2% 3.2% 3.2% 2.6% 2.4% 2.7% 2.9% 3.0% 2.4% 2.4% 2.3% 2.3% 5.6% 5.7% 5.7% 5.4% 8.2% 8.3% 8.0% 7.4% 8.3% 9.3% 9.1% 8.6%
SK 2.3% 2.2% 2.0% 1.8% 2.7% 2.5% 2.5% 2.3% 1.5% 1.4% 1.4% 1.4% 2.2% 2.2% 2.5% 2.4% 4.6% 4.3% 4.6% 4.3% 2.7% 3.0% 3.1% 3.2%
EU/EEA 2.8% 2.6% 2.5% 2.3% 3.1% 2.9% 2.9% 2.7% 2.6% 2.3% 2.3% 2.1% 5.1% 4.8% 4.7% 4.4% 6.7% 6.2% 6.1% 5.7% 7.2% 6.6% 6.4% 5.9%
T23_1 T23_1 T23_1 T23_1 T23_2 T23_2 T23_2 T23_2 T23_3 T23_3 T23_3 T23_3 T23_4 T23_4 T23_4 T23_4 T23_5 T23_5 T23_5 T23_5 T23_6 T23_6 T23_6 T23_6202009 202012 202103 202106 202009 202012 202103 202106 202009 202012 202103 202106 202009 202012 202103 202106 202009 202012 202103 202106 202009 202012 202103 202106
Sep-20 Dec-20 Mar-21 Jun-21 Sep-20 Dec-20 Mar-21 Jun-21 Sep-20 Dec-20 Mar-21 Jun-21 Sep-20 Dec-20 Mar-21 Jun-21 Sep-20 Dec-20 Mar-21 Jun-21 Sep-20 Dec-20 Mar-21 Jun-21
AT 53.7% 51.5% 51.1% 50.9% 55.6% 54.7% 54.9% 55.1% 35.5% 34.5% 34.6% 34.6% 53.6% 50.6% 50.2% 49.0% 53.4% 50.8% 49.9% 48.6% 48.4% 42.4% 44.4% 40.5%
BE 41.8% 40.2% 40.3% 40.5% 24.1% 23.5% 22.6% 23.4% 17.8% 16.5% 15.9% 16.6% 50.4% 47.5% 48.7% 48.7% 49.1% 46.0% 49.1% 48.4% 35.9% 25.5% 29.4% 28.1%
BG 49.5% 50.6% 50.2% 51.2% 62.7% 63.9% 64.9% 65.6% 44.8% 46.7% 47.8% 48.1% 43.0% 43.9% 42.3% 43.2% 43.0% 45.5% 43.3% 44.8% 38.4% 39.7% 39.3% 40.9%
CY 46.2% 44.3% 45.1% 44.4% 42.7% 42.0% 42.3% 41.2% 37.7% 38.2% 38.1% 36.5% 53.5% 50.8% 52.2% 52.6% 55.4% 52.7% 54.1% 54.6% 50.5% 45.8% 48.3% 48.6%
CZ 56.9% 54.7% 53.7% 53.8% 57.6% 55.2% 54.6% 54.5% 37.0% 33.4% 32.5% 31.1% 56.9% 55.1% 53.8% 53.9% 55.3% 53.1% 54.0% 54.1% 54.7% 48.8% 47.3% 46.9%
DE 37.1% 36.6% 36.5% 35.4% 32.7% 31.0% 32.6% 32.7% 17.7% 17.6% 18.0% 18.4% 41.7% 41.0% 40.7% 39.0% 43.7% 40.6% 41.2% 38.6% 27.8% 27.5% 26.3% 26.4%
DK 31.9% 29.3% 29.8% 27.2% 40.2% 39.7% 41.3% 37.0% 21.7% 21.0% 21.2% 18.4% 35.9% 29.1% 30.2% 30.3% 34.4% 31.5% 30.4% 32.3% 27.5% 22.8% 20.7% 19.4%
EE 34.0% 29.0% 26.8% 27.2% 25.6% 22.5% 22.7% 23.1% 23.9% 20.3% 21.1% 21.6% 40.5% 35.6% 29.1% 28.6% 37.8% 29.8% 23.8% 24.3% 30.9% 32.9% 25.3% 27.7%
ES 44.3% 44.9% 42.3% 40.8% 39.2% 41.8% 38.0% 37.7% 24.2% 24.1% 22.6% 22.9% 50.6% 48.7% 47.6% 44.6% 50.2% 50.8% 48.9% 47.5% 36.6% 38.3% 35.6% 35.3%
FI 30.7% 29.5% 29.7% 30.7% 20.6% 19.3% 19.1% 19.5% 5.8% 6.3% 6.3% 8.6% 43.8% 42.9% 43.7% 44.7% 38.4% 40.8% 39.8% 42.1% 21.5% 24.3% 19.8% 22.7%
FR 48.8% 49.1% 49.0% 49.4% 48.4% 48.9% 49.1% 49.6% 23.5% 25.5% 26.2% 27.6% 49.5% 49.3% 48.7% 48.9% 50.5% 49.6% 49.9% 49.4% 31.8% 31.0% 31.3% 30.1%
GR 44.9% 44.7% 47.1% 46.6% 41.2% 41.7% 44.1% 46.1% 32.7% 31.7% 34.5% 34.1% 48.8% 47.8% 49.9% 47.1% 49.7% 48.1% 50.1% 46.1% 38.8% 38.6% 41.2% 35.9%
HR 67.5% 62.9% 63.0% 62.0% 66.3% 59.8% 59.0% 58.6% 64.4% 55.9% 54.7% 53.1% 67.9% 64.7% 66.5% 65.1% 68.1% 62.1% 64.6% 63.2% 61.5% 62.7% 61.5% 63.2%
HU 65.5% 62.8% 62.6% 63.8% 69.4% 66.9% 66.4% 67.3% 57.6% 57.0% 55.8% 56.0% 58.4% 55.1% 55.2% 55.5% 55.1% 51.2% 52.0% 53.3% 56.0% 51.9% 54.6% 54.5%
IE 29.8% 30.8% 28.5% 28.3% 26.7% 28.2% 25.4% 27.0% 23.0% 24.6% 20.7% 22.5% 34.0% 33.8% 32.9% 30.9% 32.3% 31.4% 32.1% 30.8% 27.6% 27.8% 26.8% 25.4%
IS 29.6% 30.4% 29.9% 25.8% 17.0% 16.9% 16.6% 15.4% 5.5% 6.0% 6.2% 5.4% 34.7% 34.9% 33.1% 28.1% 30.6% 31.0% 30.7% 31.9% 19.3% 21.9% 21.6% 12.9%
IT 53.8% 53.5% 53.3% 53.5% 47.2% 47.6% 46.5% 46.7% 33.0% 34.4% 34.0% 35.0% 56.0% 56.1% 56.5% 56.8% 55.3% 55.7% 56.2% 56.4% 45.2% 45.5% 46.4% 46.6%
LT 32.0% 29.6% 27.5% 26.8% 24.1% 24.3% 22.6% 22.8% 18.1% 17.2% 16.6% 17.4% 39.0% 33.3% 31.0% 30.1% 39.0% 33.3% 31.0% 30.1% 35.1% 27.8% 26.4% 24.1%
LU 33.1% 31.8% 33.7% 36.7% 22.1% 19.9% 20.3% 22.4% 10.1% 9.3% 10.6% 12.4% 33.9% 34.0% 35.0% 38.0% 40.9% 40.6% 45.9% 46.6% 30.3% 23.6% 22.1% 26.0%
LV 37.4% 35.2% 29.2% 30.9% 44.3% 44.2% 44.3% 45.2% 43.2% 43.7% 44.7% 45.6% 33.4% 30.2% 23.0% 24.8% 30.0% 29.9% 21.8% 25.4% 27.7% 24.5% 22.4% 23.0%
MT 28.0% 33.0% 31.9% 30.0% 23.6% 31.1% 29.8% 30.1% 7.9% 10.8% 10.6% 11.8% 29.0% 33.8% 34.9% 33.0% 39.4% 44.6% 44.2% 39.9% 20.3% 28.7% 34.9% 24.2%
NL 27.4% 27.1% 26.7% 26.4% 17.3% 17.1% 16.6% 16.7% 7.8% 8.2% 7.1% 7.1% 30.4% 30.9% 30.5% 30.3% 23.9% 23.8% 23.9% 23.6% 16.8% 15.9% 16.1% 14.5%
NO 37.8% 36.9% 35.7% n.a. 22.8% 22.5% 14.6% n.a. 12.0% 11.8% 6.3% n.a. 39.8% 39.1% 40.2% n.a. 46.8% 33.7% 35.9% n.a. 19.9% 24.0% 19.0% n.a.
PL 63.9% 62.9% 60.2% 59.8% 68.8% 67.5% 62.8% 61.9% 60.6% 58.1% 52.9% 51.3% 59.7% 60.0% 58.2% 57.9% 57.2% 58.5% 55.0% 55.3% 50.1% 50.7% 51.7% 50.9%
PT 54.9% 53.9% 57.2% 58.4% 43.3% 45.5% 46.9% 50.5% 28.2% 29.9% 29.8% 35.0% 58.0% 56.2% 59.9% 60.5% 53.8% 52.3% 56.7% 55.8% 48.7% 46.4% 50.5% 51.2%
RO 65.4% 66.2% 66.4% 66.9% 69.2% 68.6% 69.7% 70.4% 53.5% 52.0% 51.9% 51.5% 62.2% 64.2% 63.5% 63.6% 61.8% 62.9% 63.7% 61.9% 56.4% 58.9% 60.1% 59.4%
SE 42.5% 42.6% 39.6% 42.3% 32.3% 33.0% 32.9% 31.9% 17.1% 17.2% 16.8% 15.9% 46.2% 46.4% 42.3% 47.9% 27.7% 26.7% 28.7% 30.2% 25.0% 24.4% 20.4% 21.9%
SI 52.9% 51.3% 49.2% 54.5% 52.6% 49.8% 47.7% 48.4% 30.2% 35.2% 32.8% 30.9% 63.6% 59.8% 59.0% 58.6% 63.0% 58.6% 59.6% 58.9% 62.7% 60.1% 59.4% 58.9%
SK 64.6% 62.2% 61.2% 62.9% 63.2% 58.9% 59.2% 61.1% 48.5% 41.9% 42.7% 46.2% 68.2% 69.4% 64.8% 66.6% 70.2% 71.5% 68.9% 65.1% 68.7% 68.3% 62.6% 63.0%
EU/EEA 45.5% 44.9% 44.7% 44.3% 41.8% 42.2% 41.7% 41.9% 26.1% 26.0% 25.9% 25.7% 48.7% 47.5% 47.4% 46.8% 49.6% 48.0% 48.4% 47.5% 37.8% 36.4% 36.7% 35.1%
(1) Gross carrying amounts, other than trading exposures.(2) Gross carrying amounts, loans and advances at amortised costs (excluding at fair value through OCI and through P&L, excluding trading exposures).
HHs …of which mortgages NFCs …of which SMEs …of which CRE
* Norwegian banks have not implemented yet the reporting framework based on CRR2/CRD5. Therefore, Norwegian figures are included in the EBA Risk dashboard only until March 2021.
Statistical Annex
Loans: NPL and coverage ratios
of which: loans and advances at amortised cost: NPL ratio (2)
% Loans and advances:NPL ratio (1)
HHs …of which mortgages NFCs …of which SMEs
Individual country data includes subsidiaries, which are excluded from EU aggregate. For example, at country level the subsidiary in country X of a bank domiciled in country Y is included both in data for countries X and Y (for the latter as part of the consolidated entity). In the EU aggregate, only the consolidated entity domiciled in country Y is considered. The sample of banks is unbalanced and reviewed annually. Being an unbalanced sample, the number of reporting banks per country can display minor variations between quarters, which might accordingly affect quarterly changes in absolute and relative figures. As of Q1 2020 onwards UK banks are removed from the EU/EEA aggregate and subsidiaries of UK banks in EU member states are used instead.
…of which CRE
of which: non-performing loans and advances at amortised cost: coverage ratio (2)
%
Non-performing loans and

31
%
Mar-21 Jun-21 Mar-21 Jun-21 Mar-21 Jun-21 Mar-21 Jun-21 Mar-21 Jun-21 Mar-21 Jun-21 Mar-21 Jun-21 Mar-21 Jun-21 Mar-21 Jun-21 Mar-21 Jun-21
AT 1.7% 1.8% 1.2% 1.0% 17.9% 17.7% 3.5% 3.1% 1.0% 1.0% 7.4% 7.4% 13.2% 13.6% 4.5% 4.6% 3.6% 3.6% 2.5% 2.3%
BE 4.3% 4.1% 0.6% 0.5% 15.1% 14.3% 4.7% 4.6% 1.2% 1.2% 11.1% 10.4% 15.6% 14.7% 6.0% 5.7% 1.6% 1.5% 2.6% 2.4%
BG 6.3% 6.2% 0.8% 0.8% 25.9% 25.1% 5.3% 6.0% 0.5% 0.5% 7.4% 7.7% 22.9% 23.1% 6.2% 6.6% 4.5% 4.5% 1.7% 2.0%
CY 1.2% 1.3% 0.3% 0.3% 9.0% 9.2% 0.7% 0.9% 0.6% 0.6% 12.2% 11.7% 18.9% 18.9% 7.4% 7.2% 20.4% 20.5% 1.0% 1.2%
CZ 4.1% 4.2% 0.5% 0.5% 23.7% 23.6% 4.2% 3.7% 1.1% 1.1% 4.8% 4.9% 16.2% 16.4% 5.9% 6.9% 1.6% 1.5% 2.1% 2.2%
DE 0.7% 0.7% 0.8% 0.7% 12.5% 12.4% 8.2% 8.2% 1.7% 1.8% 2.3% 2.2% 8.4% 8.1% 5.4% 5.1% 1.0% 1.0% 2.9% 2.7%
DK 2.8% 2.7% 0.5% 0.6% 7.2% 6.9% 2.6% 2.6% 0.3% 0.4% 2.7% 2.7% 6.7% 6.6% 4.0% 4.0% 0.8% 0.8% 1.4% 1.4%
EE 7.7% 8.3% 0.6% 0.3% 13.0% 13.5% 6.4% 5.5% 0.7% 0.7% 3.5% 3.8% 14.0% 14.1% 9.9% 10.0% 1.7% 1.7% 0.6% 0.6%
ES 2.6% 2.6% 1.8% 1.7% 17.4% 17.7% 6.0% 5.9% 0.7% 0.7% 7.6% 7.5% 17.9% 17.9% 6.6% 6.8% 5.8% 5.7% 3.7% 3.8%
FI 5.4% 5.1% 0.9% 0.9% 7.7% 8.6% 4.1% 4.2% 1.0% 1.1% 4.9% 4.7% 10.0% 6.6% 6.0% 5.9% 1.1% 1.1% 2.1% 2.1%
FR 3.9% 4.0% 2.1% 2.0% 13.0% 12.8% 4.3% 4.2% 0.6% 0.6% 4.7% 4.6% 12.7% 12.6% 5.8% 5.8% 2.6% 2.6% 2.6% 2.6%
GR 1.8% 1.7% 1.3% 1.3% 19.0% 18.1% 6.4% 6.6% 0.2% 0.2% 7.7% 7.1% 22.1% 20.5% 14.0% 16.0% 10.5% 10.9% 1.3% 1.2%
HR 4.7% 4.7% 0.5% 0.5% 17.8% 17.6% 6.5% 6.2% 2.7% 2.8% 9.2% 7.3% 20.1% 19.8% 7.2% 8.9% 13.2% 13.6% 2.2% 2.5%
HU 7.1% 7.4% 0.7% 0.7% 20.2% 19.5% 4.8% 4.4% 0.7% 0.7% 6.6% 6.7% 20.0% 19.6% 6.9% 7.2% 4.3% 4.2% 2.2% 2.5%
IE 5.2% 5.1% 0.5% 0.5% 18.5% 19.3% 3.6% 3.5% 0.6% 0.6% 2.6% 2.5% 9.0% 9.1% 4.4% 4.4% 7.9% 7.7% 4.3% 3.9%
IS 13.0% 12.8% 0.4% 0.4% 17.3% 16.7% 1.1% 0.9% 0.6% 0.5% 10.8% 10.5% 8.0% 8.1% 5.3% 5.8% 6.8% 8.3% 4.1% 4.4%
IT 2.2% 2.2% 1.2% 0.8% 27.9% 28.0% 3.6% 3.6% 1.1% 1.1% 8.3% 8.1% 16.3% 16.5% 5.5% 5.3% 3.7% 3.8% 3.2% 3.3%
LT 3.5% 3.4% 0.3% 0.3% 16.0% 15.8% 5.9% 5.4% 0.8% 0.8% 3.0% 2.7% 20.0% 19.7% 11.3% 11.1% 2.7% 2.5% 1.3% 1.3%
LU 13.7% 14.0% 0.8% 1.0% 10.2% 9.4% 1.5% 1.4% 0.5% 0.5% 8.8% 8.9% 7.8% 8.1% 6.4% 6.8% 1.6% 1.6% 1.7% 1.7%
LV 11.0% 12.2% 0.3% 0.3% 11.9% 12.9% 9.6% 9.2% 1.0% 1.1% 3.1% 3.3% 12.5% 12.2% 9.9% 10.3% 3.6% 3.8% 1.9% 1.6%
MT 0.2% 0.1% 0.0% 0.1% 5.7% 6.0% 5.9% 6.1% 1.0% 1.0% 6.7% 7.0% 15.6% 15.3% 7.2% 7.7% 13.9% 13.8% 3.2% 3.2%
NL 14.1% 14.6% 2.7% 2.5% 15.4% 15.2% 4.2% 3.7% 0.8% 0.8% 3.5% 3.6% 14.4% 14.2% 7.5% 7.1% 1.7% 1.7% 2.6% 2.7%
NO* 5.5% n.a. 4.1% n.a. 7.7% n.a. 4.3% n.a. 0.5% n.a. 10.5% n.a. 5.3% n.a. 13.0% n.a. 1.5% n.a. 2.6% n.a.
PL 1.5% 1.6% 1.7% 1.6% 23.8% 23.9% 2.5% 2.3% 1.0% 1.1% 5.2% 5.7% 18.8% 19.9% 7.8% 8.0% 3.9% 3.8% 4.6% 4.3%
PT 2.3% 2.3% 0.4% 0.4% 18.4% 18.4% 2.5% 2.6% 1.2% 1.1% 10.1% 9.8% 15.3% 15.9% 6.4% 6.3% 8.2% 8.4% 1.4% 1.5%
RO 7.5% 8.2% 0.7% 0.8% 20.6% 20.0% 4.5% 4.5% 1.2% 1.3% 9.1% 8.7% 24.3% 24.0% 10.6% 10.9% 2.7% 2.7% 1.8% 1.7%
SE 1.3% 1.3% 1.1% 1.2% 4.9% 5.0% 3.3% 3.2% 0.7% 0.7% 2.8% 2.7% 4.5% 4.6% 4.4% 4.2% 0.9% 0.9% 1.6% 1.5%
SI 1.6% 1.4% 1.5% 1.5% 26.7% 27.4% 5.1% 5.0% 1.1% 1.1% 7.1% 7.6% 20.2% 18.5% 12.1% 11.9% 3.6% 3.6% 4.6% 5.2%
SK 3.9% 4.1% 0.9% 0.9% 19.8% 17.5% 9.1% 9.5% 1.6% 1.6% 6.5% 6.3% 15.9% 15.7% 9.9% 10.1% 1.4% 1.4% 2.5% 2.7%
EU/EEA 3.8% 3.9% 1.6% 1.4% 15.2% 15.3% 4.8% 4.7% 0.9% 0.9% 5.3% 5.1% 12.9% 12.8% 6.0% 5.9% 2.9% 3.0% 2.7% 2.7%
T25_1 T25_1 T25_2 T25_2 T25_3 T25_3 T25_4 T25_4 T25_5 T25_5 T25_6 T25_6 T25_7 T25_7 T25_8 T25_8 T25_9 T25_9 T12_1 T12_1202103 202106 202103 202106 202103 202106 202103 202106 202103 202106 202103 202106 202103 202106 202103 202106 202103 202106 T12_1 T12_1
T12_1 T12_1T12_1 T12_1
%
T12_1 T12_1
Mar-21 Jun-21 Mar-21 Jun-21 Mar-21 Jun-21 Mar-21 Jun-21 Mar-21 Jun-21 Mar-21 Jun-21 Mar-21 Jun-21 Mar-21 Jun-21 Mar-21 Jun-21 T12_1 T12_1AT 1.4% 1.2% 27.4% 28.0% 8.8% 8.6% 2.4% 2.5% 0.5% 0.5% 0.1% 0.1% 1.0% 1.0% 0.6% 0.6% 1.1% 1.3% T12_1 T12_1BE 2.3% 2.1% 13.6% 13.0% 7.4% 7.1% 4.5% 9.2% 0.6% 0.6% 0.2% 0.2% 6.0% 5.7% 0.7% 0.7% 1.8% 1.9% T12_1 T12_1BG 0.9% 0.9% 12.1% 11.6% 2.2% 2.0% 1.3% 1.2% 0.0% 0.0% 0.2% 0.2% 0.6% 0.6% 0.2% 0.2% 0.8% 0.9% T12_1 T12_1CY 0.0% 0.0% 17.0% 17.7% 5.0% 4.6% 1.3% 1.2% 0.0% 0.0% 1.3% 1.2% 2.1% 2.0% 0.6% 0.6% 0.8% 0.8% T12_1 T12_1CZ 0.0% 0.0% 24.7% 23.3% 3.9% 4.4% 2.1% 2.2% 0.1% 0.1% 0.2% 0.2% 0.8% 0.8% 0.7% 0.8% 3.4% 3.1% T12_1 T12_1DE 4.1% 4.2% 38.3% 39.5% 4.4% 4.0% 4.5% 4.7% 0.3% 0.3% 0.2% 0.2% 1.5% 1.5% 0.4% 0.4% 2.6% 2.5% T12_1 T12_1
DK 1.8% 1.4% 62.8% 63.1% 2.0% 2.0% 2.0% 2.3% 0.2% 0.3% 0.5% 0.5% 0.8% 0.8% 0.3% 0.3% 0.6% 0.6% T12_1 T12_1
EE 0.0% 0.0% 32.8% 32.6% 4.3% 4.2% 2.9% 2.8% 0.0% 0.0% 0.1% 0.1% 0.7% 0.6% 0.3% 0.2% 0.7% 0.9% T12_1 T12_1ES 3.3% 3.3% 11.1% 11.0% 4.6% 4.7% 3.1% 3.1% 0.5% 0.5% 0.6% 0.6% 1.6% 1.5% 0.8% 0.8% 4.4% 4.2% T12_1 T12_1FI 5.8% 6.6% 39.7% 43.1% 5.9% 5.0% 2.4% 2.4% 0.1% 0.1% 0.2% 0.2% 0.9% 0.9% 0.6% 0.6% 1.2% 0.7% T12_1 T12_1FR 6.4% 6.5% 22.4% 22.8% 5.4% 5.2% 5.5% 5.7% 0.3% 0.3% 0.4% 0.4% 1.9% 1.8% 0.6% 0.6% 5.0% 5.0% T12_1 T12_1GR 0.0% 0.0% 6.8% 7.1% 2.1% 2.3% 1.4% 1.3% 0.0% 0.0% 0.3% 0.3% 1.5% 1.6% 1.3% 1.3% 2.3% 2.4% T12_1 T12_1HR 0.1% 0.1% 6.4% 6.6% 4.7% 4.4% 2.1% 2.1% 0.4% 0.4% 0.2% 0.2% 0.7% 0.7% 0.9% 1.1% 0.4% 0.5% T12_1 T12_1HU 1.7% 1.8% 13.7% 13.9% 3.8% 4.1% 2.9% 2.8% 0.0% 0.0% 0.2% 0.2% 0.6% 0.6% 0.3% 0.3% 3.1% 3.3% T12_1 T12_1IE 1.5% 2.0% 24.0% 24.0% 2.3% 2.3% 5.0% 5.0% 0.0% 0.0% 1.3% 1.2% 4.8% 4.9% 1.6% 1.5% 2.9% 2.6% T12_1 T12_1IS 1.8% 2.0% 23.6% 21.4% 1.0% 0.9% 4.5% 4.8% 0.0% 0.0% 0.2% 1.0% 0.2% 0.3% 0.8% 0.8% 0.4% 0.5% T12_1 T12_1IT 1.4% 1.5% 12.8% 12.9% 5.6% 5.5% 2.6% 2.7% 0.1% 0.1% 0.1% 0.1% 1.4% 1.4% 0.6% 0.6% 2.4% 2.6% T12_1 T12_1LT 0.2% 0.2% 27.9% 28.9% 1.9% 2.1% 2.8% 3.1% 0.0% 0.0% 0.1% 0.1% 0.8% 0.8% 0.3% 0.3% 1.2% 1.4% T12_1 T12_1LU 2.6% 2.5% 10.4% 10.1% 3.6% 3.6% 19.8% 19.8% 0.0% 0.1% 0.3% 0.3% 2.3% 2.3% 0.5% 0.3% 7.5% 7.9% T12_1 T12_1LV 0.0% 0.0% 26.7% 24.6% 1.1% 1.2% 4.1% 4.2% 0.2% 0.3% 0.2% 0.2% 1.1% 1.0% 0.3% 0.3% 1.3% 1.3% T12_1 T12_1MT 9.2% 9.4% 12.1% 11.9% 7.9% 6.7% 3.8% 3.6% 0.2% 0.2% 0.7% 0.7% 4.9% 5.2% 1.3% 1.4% 0.6% 0.7% T12_1 T12_1NL 3.2% 3.0% 18.4% 18.9% 3.0% 3.0% 3.3% 3.6% 0.2% 0.2% 0.2% 0.2% 3.2% 3.3% 0.5% 0.5% 1.1% 1.2% T12_1 T12_1
NO* 0.2% n.a. 29.3% n.a. 6.0% n.a. 6.8% n.a. 0.0% n.a. 0.4% n.a. 1.4% n.a. 0.4% n.a. 0.5% n.a. T12_1 T12_1PL 0.6% 0.4% 14.3% 13.6% 6.7% 5.9% 2.0% 2.1% 0.0% 0.0% 0.3% 0.3% 1.7% 1.7% 0.7% 0.7% 3.0% 2.8% T12_1 T12_1PT 2.6% 2.3% 12.3% 11.7% 5.9% 6.0% 2.6% 2.7% 0.2% 0.2% 0.7% 0.6% 1.8% 1.8% 1.5% 1.5% 6.2% 6.4% T12_1 T12_1RO 1.6% 1.7% 6.8% 6.7% 2.0% 2.0% 2.2% 2.3% 0.0% 0.0% 0.2% 0.2% 2.9% 2.9% 0.7% 0.7% 0.7% 0.7% T12_1 T12_1SE 4.4% 5.2% 61.7% 61.2% 3.9% 4.0% 2.0% 2.0% 0.1% 0.1% 0.2% 0.2% 0.7% 0.6% 0.4% 0.4% 0.9% 1.0% T12_1 T12_1SI 0.4% 0.9% 5.0% 4.9% 6.3% 6.5% 1.9% 1.9% 0.0% 0.0% 0.3% 0.3% 1.4% 1.3% 0.9% 0.9% 0.2% 0.2% T12_1 T12_1SK 0.6% 0.4% 17.6% 18.9% 3.4% 3.5% 2.6% 2.7% 0.0% 0.0% 0.2% 0.2% 1.3% 1.3% 0.7% 0.9% 2.2% 2.1% T12_1 T12_1
EU/EEA 3.9% 4.1% 25.0% 25.4% 4.8% 4.7% 3.9% 4.0% 0.3% 0.3% 0.3% 0.3% 1.9% 1.9% 0.6% 0.6% 3.1% 3.1% T12_1 T12_1
The data is based on gross carrying amounts, other than held for trading.
* Norwegian banks have not implemented yet the reporting framework based on CRR2/CRD5. Therefore, Norwegian figures are included in the EBA Risk dashboard only until March 2021.
Individual country data includes subsidiaries, which are excluded from EU aggregate. For example, at country level the subsidiary in country X of a bank domiciled in country Y is included both in data for countries X and Y (for the latter as part of the consolidated entity). In the EU aggregate, only the consolidated entity domiciled in country Y is considered. The sample of banks is unbalanced and reviewed annually. Being an unbalanced sample, the number of reporting banks per country can display minor variations between quarters, which might accordingly affect quarterly changes in absolute and relative figures. As of Q1 2020 onwards UK banks are removed from the EU/EEA aggregate and subsidiaries of UK banks in EU member states are used instead.
N A
dmin
istra
tive
and
supp
ort s
ervi
ce
activ
ities
O P
ublic
ad
min
istra
tion
and
defe
nce,
com
pulso
ry
soci
al se
curit
y
Distribution of NFC loans and advances by NACE code (other than trading exposures) (1/2)
A Ag
ricul
ture
, fo
rest
ry a
nd fi
shin
g
P Ed
ucat
ion
Q H
uman
hea
lth
serv
ices
and
soci
al
wor
k ac
tiviti
es
R Ar
ts,
ente
rtai
nmen
t and
re
crea
tion
S O
ther
serv
ices
Distribution of NFC loans and advances by NACE code (other than trading exposures) (2/2)
K Fi
nanc
ial a
nd
insu
ranc
e ac
tiviti
es
L Re
al e
stat
e ac
tiviti
es
M P
rofe
ssio
nal,
scie
ntifi
c an
d te
chni
cal a
ctiv
ities
Statistical Annex
Non-trading loans and advances to non-financial corporations by sector
G W
hole
sale
and
re
tail
trad
e
H Tr
ansp
ort a
nd
stor
age
I Acc
omm
odat
ion
and
food
serv
ice
activ
ities
J Inf
orm
atio
n an
d co
mm
unic
atio
n
B M
inin
g an
d qu
arry
ing
C M
anuf
actu
ring
D El
ectr
icity
, gas
, st
eam
and
air
cond
ition
ing
supp
ly
E W
ater
supp
ly
F Co
nstr
uctio
n

32
%
Mar-21 Jun-21 Mar-21 Jun-21 Mar-21 Jun-21 Mar-21 Jun-21 Mar-21 Jun-21 Mar-21 Jun-21 Mar-21 Jun-21 Mar-21 Jun-21 Mar-21 Jun-21 Mar-21 Jun-21
AT 4.4% 4.3% 5.3% 5.7% 3.8% 3.9% 2.8% 2.9% 1.2% 1.4% 3.5% 3.5% 3.8% 3.6% 4.5% 4.5% 7.1% 8.1% 2.9% 2.6%
BE 3.1% 3.2% 2.0% 1.3% 4.3% 4.3% 2.0% 1.9% 2.1% 2.0% 4.7% 4.6% 5.6% 5.1% 3.1% 3.0% 8.0% 8.6% 2.4% 2.4%
BG 6.0% 5.9% 57.6% 62.4% 6.2% 6.1% 7.8% 6.8% 19.9% 19.9% 23.6% 22.1% 10.7% 8.6% 6.4% 5.9% 13.2% 12.6% 16.8% 14.7%
CY 22.9% 20.2% 11.5% 10.6% 13.9% 13.1% 2.4% 2.0% 5.1% 5.0% 29.1% 26.9% 19.8% 19.3% 3.0% 3.1% 6.0% 6.0% 12.6% 10.9%
CZ 1.2% 1.4% 0.6% 0.4% 5.6% 5.3% 5.6% 5.2% 2.6% 2.9% 4.2% 5.1% 4.1% 3.7% 5.3% 4.6% 14.3% 15.1% 1.0% 1.6%
DE 3.8% 3.8% 4.4% 3.7% 3.6% 3.8% 1.0% 1.0% 0.8% 0.8% 6.1% 5.8% 3.8% 3.8% 5.7% 5.4% 5.4% 5.7% 2.2% 2.5%
DK 6.5% 5.8% 11.9% 19.5% 3.0% 3.4% 0.2% 0.1% 3.8% 3.3% 4.9% 5.1% 5.6% 5.4% 13.7% 14.7% 14.4% 16.3% 2.5% 2.1%
EE 2.6% 2.0% 0.0% 0.0% 2.1% 1.7% 0.6% 0.4% 0.2% 0.3% 5.9% 5.8% 1.7% 1.6% 2.0% 1.5% 10.4% 19.0% 1.7% 1.1%
ES 5.2% 5.2% 1.7% 2.3% 4.7% 4.6% 2.9% 3.3% 2.1% 2.2% 8.8% 8.9% 5.2% 5.3% 4.2% 5.1% 6.8% 9.6% 3.1% 2.6%
FI 8.3% 7.5% 25.9% 29.0% 4.3% 3.2% 0.3% 0.2% 0.2% 0.2% 2.3% 2.5% 2.1% 3.4% 6.8% 7.2% 3.2% 3.2% 0.8% 0.7%
FR 4.4% 4.3% 3.7% 4.5% 5.0% 4.9% 2.2% 1.2% 3.7% 3.6% 7.5% 7.4% 4.7% 4.6% 4.5% 4.2% 8.9% 9.3% 3.0% 3.0%
GR 36.2% 25.6% 35.9% 33.2% 32.1% 21.0% 1.3% 1.2% 16.5% 9.0% 49.7% 35.3% 38.5% 26.2% 15.1% 12.2% 23.7% 17.1% 33.5% 22.3%
HR 15.6% 16.0% 1.1% 1.0% 15.2% 14.0% 0.6% 0.6% 7.3% 7.0% 11.6% 9.7% 6.6% 5.7% 6.0% 5.7% 7.8% 8.6% 12.0% 11.0%
HU 2.3% 2.1% 2.6% 2.7% 5.0% 4.7% 1.2% 1.1% 1.3% 1.3% 4.4% 4.8% 3.2% 2.9% 5.6% 5.4% 3.7% 4.5% 3.3% 2.7%
IE 6.7% 6.5% 1.7% 0.9% 1.4% 1.4% 1.0% 1.4% 1.6% 1.4% 4.2% 5.4% 4.4% 4.0% 5.2% 7.1% 12.6% 16.1% 1.6% 1.1%
IS 0.7% 0.7% 49.5% 47.8% 3.4% 2.3% 0.0% 0.0% 2.0% 2.2% 5.4% 7.8% 2.4% 2.2% 5.9% 4.7% 16.9% 15.2% 2.0% 1.8%
IT 7.2% 6.8% 4.2% 4.9% 6.0% 5.6% 2.4% 2.3% 4.5% 4.0% 18.9% 17.1% 5.7% 5.3% 5.5% 5.3% 9.0% 8.9% 2.9% 2.7%
LT 4.2% 4.2% 10.2% 0.0% 4.1% 3.2% 0.1% 0.1% 0.1% 0.1% 8.6% 6.7% 2.2% 1.4% 1.3% 2.0% 15.0% 10.6% 0.2% 0.1%
LU 3.0% 3.4% 0.3% 0.2% 2.8% 2.5% 4.3% 4.4% 5.8% 5.4% 2.8% 2.9% 4.0% 2.6% 4.1% 2.1% 40.3% 40.6% 4.0% 4.1%
LV 2.5% 1.3% 0.8% 2.0% 10.3% 9.4% 1.4% 1.4% 1.1% 0.8% 3.4% 1.7% 1.3% 1.0% 6.5% 5.8% 12.5% 17.6% 0.5% 0.2%
MT 7.4% 3.2% 0.0% 0.0% 14.2% 13.9% 1.2% 1.1% 0.1% 0.1% 23.1% 22.1% 8.4% 6.8% 5.8% 6.0% 13.5% 17.3% 11.5% 8.2%
NL 6.4% 5.9% 11.5% 9.5% 4.6% 4.5% 1.3% 1.4% 4.0% 3.9% 5.6% 5.8% 4.1% 3.6% 5.6% 5.1% 7.9% 7.8% 1.9% 2.0%
NO* 0.3% n.a. 23.3% n.a. 1.3% n.a. 1.4% n.a. 4.6% n.a. 1.0% n.a. 4.5% n.a. 14.3% n.a. 3.1% 0.0% 1.2% n.a.
PL 6.4% 8.8% 1.7% 1.1% 8.7% 8.8% 1.0% 1.0% 2.4% 2.2% 14.3% 12.9% 7.1% 6.4% 7.4% 6.7% 18.0% 17.1% 3.0% 3.0%
PT 6.1% 5.5% 7.1% 6.5% 6.3% 6.0% 2.2% 2.2% 7.1% 7.0% 11.8% 11.4% 5.8% 5.4% 7.6% 7.0% 13.6% 13.8% 5.9% 4.5%
RO 5.2% 4.9% 32.1% 29.3% 11.8% 10.8% 8.8% 7.4% 3.0% 3.0% 13.1% 13.3% 4.1% 4.0% 4.3% 4.4% 10.1% 10.5% 5.5% 5.7%
SE 0.7% 0.4% 18.5% 24.4% 2.5% 1.6% 0.2% 0.2% 0.1% 0.0% 0.9% 0.7% 0.9% 0.6% 4.9% 2.2% 1.9% 2.9% 0.3% 0.3%
SI 6.6% 1.7% 0.9% 0.9% 3.4% 2.8% 0.1% 0.4% 3.8% 3.4% 9.2% 8.9% 12.9% 6.5% 4.2% 4.6% 18.7% 18.8% 3.0% 2.6%
SK 7.0% 7.4% 0.1% 0.7% 3.1% 2.5% 1.3% 1.3% 1.5% 1.4% 2.1% 2.2% 2.8% 2.6% 1.5% 1.9% 3.3% 3.7% 0.6% 0.5%
EU/EEA 5.7% 5.4% 7.0% 6.9% 5.4% 5.0% 1.9% 1.6% 2.6% 2.4% 10.1% 9.5% 5.7% 5.1% 5.9% 5.3% 9.0% 9.7% 2.8% 2.7%
T27_1 T27_1 T27_2 T27_2 T27_3 T27_3 T27_4 T27_4 T27_5 T27_5 T27_6 T27_6 T27_7 T27_7 T27_8 T27_8 T27_9 T27_9 T12_1 T12_1202103 202106 202103 202106 202103 202106 202103 202106 202103 202106 202103 202106 202103 202106 202103 202106 202103 202106 T12_1 T12_1
T12_1 T12_1T12_1 T12_1
%
T12_1 T12_1Mar-21 Jun-21 Mar-21 Jun-21 Mar-21 Jun-21 Mar-21 Jun-21 Mar-21 Jun-21 Mar-21 Jun-21 Mar-21 Jun-21 Mar-21 Jun-21 Mar-21 Jun-21 T12_1 T12_1
AT 1.9% 2.1% 1.4% 1.3% 3.4% 3.2% 4.4% 5.9% 0.0% 0.0% 2.0% 1.9% 0.8% 1.4% 8.3% 7.5% 13.1% 11.3% T12_1 T12_1BE 4.5% 4.5% 3.4% 3.7% 3.3% 3.2% 3.3% 1.4% 3.1% 2.9% 2.3% 1.9% 1.2% 1.2% 5.0% 4.5% 3.2% 2.4% T12_1 T12_1BG 0.0% 0.0% 17.3% 18.4% 10.5% 9.6% 17.7% 18.2% 9.1% 7.8% 7.6% 8.6% 2.2% 2.2% 37.2% 38.3% 6.3% 5.6% T12_1 T12_1CY 0.0% 0.0% 18.3% 17.5% 22.2% 20.6% 24.8% 14.5% 0.0% 0.0% 10.4% 11.9% 2.0% 2.0% 32.6% 33.0% 34.9% 35.9% T12_1 T12_1CZ 0.0% 0.0% 0.8% 0.9% 9.2% 8.4% 5.6% 4.6% 0.0% 0.0% 1.9% 1.4% 0.4% 0.4% 11.3% 7.6% 4.1% 4.5% T12_1 T12_1
DE 2.8% 2.9% 1.5% 1.5% 2.0% 2.4% 4.5% 4.3% 0.0% 0.0% 1.2% 1.1% 0.6% 0.7% 4.2% 2.5% 2.5% 2.3% T12_1 T12_1DK 3.3% 4.1% 1.7% 1.6% 3.7% 3.7% 2.9% 2.7% 0.0% 0.0% 0.4% 0.6% 7.9% 8.2% 8.5% 8.5% 3.0% 3.1% T12_1 T12_1
EE 0.0% 0.0% 1.6% 1.6% 0.2% 0.2% 6.4% 4.7% 0.0% 0.0% 1.1% 1.0% 2.7% 2.9% 14.2% 4.9% 2.0% 1.6% T12_1 T12_1ES 2.2% 1.9% 3.8% 3.8% 6.8% 6.0% 4.4% 4.6% 0.3% 0.3% 6.0% 6.7% 5.6% 3.5% 8.9% 12.3% 3.4% 3.3% T12_1 T12_1FI 0.5% 0.4% 0.9% 0.9% 1.4% 2.7% 1.5% 1.3% 0.0% 0.1% 1.1% 1.1% 2.2% 2.4% 2.7% 3.0% 4.3% 0.5% T12_1 T12_1FR 2.8% 2.6% 2.4% 2.4% 4.4% 4.7% 3.0% 3.4% 3.6% 10.6% 3.2% 3.3% 2.2% 2.1% 4.9% 5.5% 3.0% 3.0% T12_1 T12_1GR 36.9% 38.0% 30.1% 24.0% 38.3% 29.7% 23.4% 11.8% 27.1% 15.7% 50.5% 43.2% 25.3% 18.8% 22.5% 15.7% 30.5% 23.6% T12_1 T12_1HR 9.7% 6.6% 5.6% 4.0% 9.0% 5.7% 18.2% 18.8% 0.0% 0.0% 14.6% 13.6% 1.0% 1.2% 13.5% 10.9% 9.9% 8.0% T12_1 T12_1HU 1.9% 1.8% 2.1% 2.0% 2.4% 2.9% 3.8% 2.8% 0.7% 0.5% 1.9% 2.2% 3.5% 3.4% 2.5% 2.8% 14.9% 12.3% T12_1 T12_1IE 3.7% 2.7% 13.5% 13.5% 5.1% 3.8% 8.8% 6.6% 0.0% 0.0% 1.0% 1.1% 1.9% 2.2% 11.5% 11.4% 4.3% 5.9% T12_1 T12_1IS 0.1% 0.0% 3.7% 2.9% 7.2% 8.0% 9.5% 7.3% 6.2% 0.0% 0.2% 2.1% 0.6% 0.6% 4.6% 4.2% 2.1% 1.9% T12_1 T12_1IT 1.9% 1.7% 10.6% 10.0% 4.2% 3.6% 7.4% 7.3% 0.0% 0.8% 4.4% 4.1% 3.7% 3.4% 10.3% 10.0% 8.2% 7.5% T12_1 T12_1LT 0.0% 0.0% 2.3% 2.1% 2.1% 0.9% 1.6% 1.4% 0.0% 0.0% 5.6% 2.1% 3.3% 3.1% 0.2% 0.2% 0.2% 0.1% T12_1 T12_1LU 0.9% 0.7% 5.2% 4.8% 4.1% 4.3% 0.6% 0.5% 0.4% 0.2% 3.0% 2.7% 3.7% 3.4% 3.8% 7.8% 2.8% 2.7% T12_1 T12_1LV 0.3% 0.0% 1.4% 1.5% 0.9% 1.4% 5.1% 3.6% 0.0% 0.0% 3.9% 3.0% 0.1% 0.0% 11.2% 8.1% 1.0% 1.0% T12_1 T12_1MT 0.9% 1.0% 8.3% 8.7% 10.4% 0.7% 33.3% 26.3% 0.0% 0.0% 1.5% 1.4% 2.8% 2.7% 2.9% 2.6% 22.5% 21.1% T12_1 T12_1NL 10.9% 10.8% 1.4% 1.4% 6.0% 5.5% 4.3% 3.9% 0.0% 0.2% 4.1% 2.2% 3.1% 2.8% 6.4% 7.1% 4.3% 3.4% T12_1 T12_1
NO* 14.5% n.a. 0.9% n.a. 2.7% n.a. 1.3% n.a. 0.0% n.a. 0.1% n.a. 2.9% n.a. 1.5% n.a. 2.1% n.a. T12_1 T12_1PL 1.1% 1.6% 7.8% 7.6% 6.5% 7.1% 10.0% 8.4% 0.0% 0.0% 8.2% 7.9% 4.3% 3.7% 4.6% 4.7% 3.0% 3.0% T12_1 T12_1
PT 8.9% 10.5% 11.1% 10.6% 10.6% 10.1% 9.8% 11.4% 0.1% 0.1% 14.0% 14.2% 6.7% 6.5% 44.1% 42.9% 15.1% 13.5% T12_1 T12_1RO 0.4% 0.3% 3.5% 3.4% 10.2% 10.0% 3.9% 4.9% 1.5% 21.0% 1.9% 2.3% 1.7% 1.8% 3.9% 3.4% 8.2% 12.5% T12_1 T12_1SE 0.2% 0.2% 0.2% 0.1% 0.2% 0.1% 1.0% 0.9% 0.0% 0.0% 0.5% 0.5% 1.4% 0.7% 1.7% 0.8% 3.6% 3.4% T12_1 T12_1SI 0.1% 0.3% 5.5% 4.4% 10.9% 10.6% 8.3% 4.3% 29.2% 32.8% 6.5% 12.3% 2.8% 2.7% 8.3% 19.2% 8.9% 15.7% T12_1 T12_1SK 0.1% 0.1% 2.7% 2.4% 2.4% 2.5% 5.0% 4.9% 0.0% 0.0% 0.6% 0.7% 0.2% 0.2% 1.4% 0.9% 0.2% 0.2% T12_1 T12_1
EU/EEA 3.2% 3.0% 2.6% 2.6% 4.4% 4.4% 4.0% 4.2% 1.5% 4.0% 4.3% 4.3% 3.0% 2.6% 7.9% 8.2% 4.4% 4.2% T12_1 T12_1T12_1 T12_1
The data is based on gross carrying amounts, other than held for trading.
I Acc
omm
odat
ion
and
food
serv
ice
activ
ities
NPL ratios of NFC loans and advances by NACE code (other than trading exposures) (2/2)
B M
inin
g an
d qu
arry
ing
J Inf
orm
atio
n an
d co
mm
unic
atio
n
K Fi
nanc
ial a
nd
insu
ranc
e ac
tiviti
es
L Re
al e
stat
e ac
tiviti
es
M P
rofe
ssio
nal,
scie
ntifi
c an
d te
chni
cal a
ctiv
ities
N A
dmin
istra
tive
and
supp
ort s
ervi
ce
activ
ities
O P
ublic
ad
min
istra
tion
and
defe
nce,
com
pulso
ry
soci
al se
curit
y
NPL ratios of NFC loans and advances by NACE code (other than trading exposures) (1/2)
A Ag
ricul
ture
, fo
rest
ry a
nd fi
shin
g
Individual country data includes subsidiaries, which are excluded from EU aggregate. For example, at country level the subsidiary in country X of a bank domiciled in country Y is included both in data for countries X and Y (for the latter as part of the consolidated entity). In the EU aggregate, only the consolidated entity domiciled in country Y is considered. The sample of banks is unbalanced and reviewed annually. Being an unbalanced sample, the number of reporting banks per country can display minor variations between quarters, which might accordingly affect quarterly changes in absolute and relative figures. As of Q1 2020 onwards UK banks are removed from the EU/EEA aggregate and subsidiaries of UK banks in EU member states are used instead.* Norwegian banks have not implemented yet the reporting framework based on CRR2/CRD5. Therefore, Norwegian figures are included in the EBA Risk dashboard only until March 2021.
Statistical Annex
Non-trading loans and advances to non-financial corporations by sector
P Ed
ucat
ion
Q H
uman
hea
lth
serv
ices
and
soci
al
wor
k ac
tiviti
es
R Ar
ts,
ente
rtai
nmen
t and
re
crea
tion
S O
ther
serv
ices
C M
anuf
actu
ring
D El
ectr
icity
, gas
, st
eam
and
air
cond
ition
ing
supp
ly
E W
ater
supp
ly
F Co
nstr
uctio
n
G W
hole
sale
and
re
tail
trad
e
H Tr
ansp
ort a
nd
stor
age
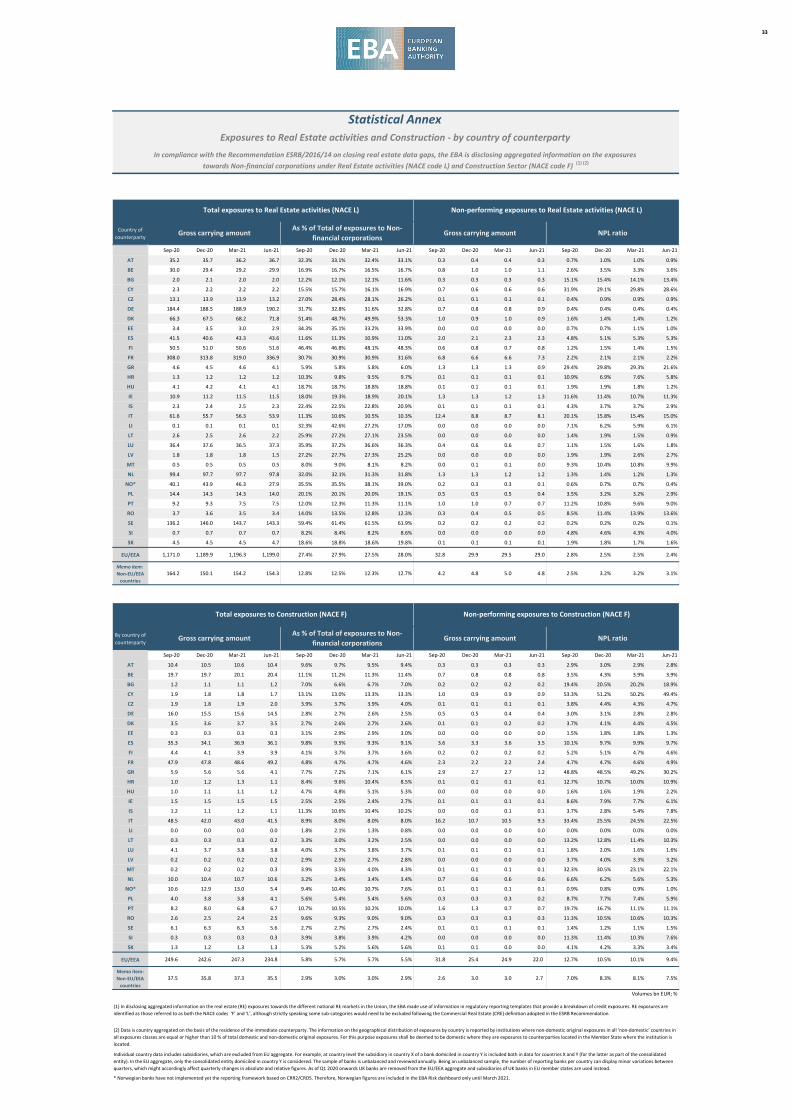
33
Country of counterparty
Sep-20 Dec-20 Mar-21 Jun-21 Sep-20 Dec-20 Mar-21 Jun-21 Sep-20 Dec-20 Mar-21 Jun-21 Sep-20 Dec-20 Mar-21 Jun-21
AT 35.2 35.7 36.2 36.7 32.3% 33.1% 32.4% 33.1% 0.3 0.4 0.4 0.3 0.7% 1.0% 1.0% 0.9%
BE 30.0 29.4 29.2 29.9 16.9% 16.7% 16.5% 16.7% 0.8 1.0 1.0 1.1 2.6% 3.5% 3.3% 3.6%
BG 2.0 2.1 2.0 2.0 12.2% 12.1% 12.1% 11.6% 0.3 0.3 0.3 0.3 15.1% 15.4% 14.1% 13.4%
CY 2.3 2.2 2.2 2.2 15.5% 15.7% 16.1% 16.9% 0.7 0.6 0.6 0.6 31.9% 29.1% 29.8% 28.6%
CZ 13.1 13.9 13.9 13.2 27.0% 28.4% 28.1% 26.2% 0.1 0.1 0.1 0.1 0.4% 0.9% 0.9% 0.9%
DE 184.4 188.5 188.9 190.2 31.7% 32.8% 31.6% 32.8% 0.7 0.8 0.8 0.9 0.4% 0.4% 0.4% 0.4%
DK 66.3 67.5 68.2 71.8 51.4% 48.7% 49.9% 53.3% 1.0 0.9 1.0 0.9 1.6% 1.4% 1.4% 1.2%
EE 3.4 3.5 3.0 2.9 34.3% 35.1% 33.2% 33.9% 0.0 0.0 0.0 0.0 0.7% 0.7% 1.1% 1.0%
ES 41.5 40.6 43.3 43.6 11.6% 11.3% 10.9% 11.0% 2.0 2.1 2.3 2.3 4.8% 5.1% 5.3% 5.3%
FI 50.5 51.0 50.6 51.6 46.4% 46.8% 48.1% 48.3% 0.6 0.8 0.7 0.8 1.2% 1.5% 1.4% 1.5%
FR 308.0 313.8 319.0 336.9 30.7% 30.9% 30.9% 31.6% 6.8 6.6 6.6 7.3 2.2% 2.1% 2.1% 2.2%
GR 4.6 4.5 4.6 4.1 5.9% 5.8% 5.8% 6.0% 1.3 1.3 1.3 0.9 29.4% 29.8% 29.3% 21.6%
HR 1.3 1.2 1.2 1.2 10.3% 9.8% 9.5% 9.7% 0.1 0.1 0.1 0.1 10.9% 6.9% 7.6% 5.8%
HU 4.1 4.2 4.1 4.1 18.7% 18.7% 18.8% 18.8% 0.1 0.1 0.1 0.1 1.9% 1.9% 1.8% 1.2%
IE 10.9 11.2 11.5 11.5 18.0% 19.3% 18.9% 20.1% 1.3 1.3 1.2 1.3 11.6% 11.4% 10.7% 11.3%
IS 2.3 2.4 2.5 2.3 22.4% 22.5% 22.8% 20.9% 0.1 0.1 0.1 0.1 4.3% 3.7% 3.7% 2.9%
IT 61.6 55.7 56.3 53.9 11.3% 10.6% 10.5% 10.3% 12.4 8.8 8.7 8.1 20.1% 15.8% 15.4% 15.0%
LI 0.1 0.1 0.1 0.1 32.3% 42.6% 27.2% 17.0% 0.0 0.0 0.0 0.0 7.1% 6.2% 5.9% 6.1%
LT 2.6 2.5 2.6 2.2 25.9% 27.2% 27.1% 23.5% 0.0 0.0 0.0 0.0 1.4% 1.9% 1.5% 0.9%
LU 36.4 37.6 36.5 37.3 35.9% 37.2% 36.6% 36.3% 0.4 0.6 0.6 0.7 1.1% 1.5% 1.6% 1.8%
LV 1.8 1.8 1.8 1.5 27.2% 27.7% 27.3% 25.2% 0.0 0.0 0.0 0.0 1.9% 1.9% 2.6% 2.7%
MT 0.5 0.5 0.5 0.5 8.0% 9.0% 8.1% 8.2% 0.0 0.1 0.1 0.0 9.3% 10.4% 10.8% 9.9%
NL 99.4 97.7 97.7 97.8 32.0% 32.1% 31.3% 31.8% 1.3 1.3 1.2 1.2 1.3% 1.4% 1.2% 1.3%
NO* 40.1 43.9 46.3 27.9 35.5% 35.5% 38.1% 39.0% 0.2 0.3 0.3 0.1 0.6% 0.7% 0.7% 0.4%
PL 14.4 14.3 14.3 14.0 20.1% 20.1% 20.0% 19.1% 0.5 0.5 0.5 0.4 3.5% 3.2% 3.2% 2.9%
PT 9.2 9.3 7.5 7.5 12.0% 12.3% 11.3% 11.1% 1.0 1.0 0.7 0.7 11.2% 10.8% 9.6% 9.0%
RO 3.7 3.6 3.5 3.4 14.0% 13.5% 12.8% 12.3% 0.3 0.4 0.5 0.5 8.5% 11.4% 13.9% 13.6%
SE 136.2 146.0 143.7 143.3 59.4% 61.4% 61.5% 61.9% 0.2 0.2 0.2 0.2 0.2% 0.2% 0.2% 0.1%
SI 0.7 0.7 0.7 0.7 8.2% 8.4% 8.2% 8.6% 0.0 0.0 0.0 0.0 4.8% 4.6% 4.3% 4.0%
SK 4.5 4.5 4.5 4.7 18.6% 18.8% 18.6% 19.8% 0.1 0.1 0.1 0.1 1.9% 1.8% 1.7% 1.6%
EU/EEA 1,171.0 1,189.9 1,196.3 1,199.0 27.4% 27.9% 27.5% 28.0% 32.8 29.9 29.5 29.0 2.8% 2.5% 2.5% 2.4%
Memo item: Non-EU/EEA
countries164.2 150.1 154.2 154.3 12.8% 12.5% 12.3% 12.7% 4.2 4.8 5.0 4.8 2.5% 3.2% 3.2% 3.1%
Volumes bn EUR; %T12_1 T12_1 T12_1 T12_1 T12_2 T12_2 T12_2 T12_2 T12_3 T12_3 T12_3 T12_3 T12_4 T12_4 T12_4 T12_4202009 202012 202103 202106 202009 202012 202103 202106 202009 202012 202103 202106 202009 202012 202103 202106
By country of counterparty
Sep-20 Dec-20 Mar-21 Jun-21 Sep-20 Dec-20 Mar-21 Jun-21 Sep-20 Dec-20 Mar-21 Jun-21 Sep-20 Dec-20 Mar-21 Jun-21
AT 10.4 10.5 10.6 10.4 9.6% 9.7% 9.5% 9.4% 0.3 0.3 0.3 0.3 2.9% 3.0% 2.9% 2.8%
BE 19.7 19.7 20.1 20.4 11.1% 11.2% 11.3% 11.4% 0.7 0.8 0.8 0.8 3.5% 4.3% 3.9% 3.9%
BG 1.2 1.1 1.1 1.2 7.0% 6.6% 6.7% 7.0% 0.2 0.2 0.2 0.2 19.4% 20.5% 20.2% 18.9%
CY 1.9 1.8 1.8 1.7 13.1% 13.0% 13.3% 13.3% 1.0 0.9 0.9 0.9 53.3% 51.2% 50.2% 49.4%
CZ 1.9 1.8 1.9 2.0 3.9% 3.7% 3.9% 4.0% 0.1 0.1 0.1 0.1 3.8% 4.4% 4.3% 4.7%
DE 16.0 15.5 15.6 14.5 2.8% 2.7% 2.6% 2.5% 0.5 0.5 0.4 0.4 3.0% 3.1% 2.8% 2.8%
DK 3.5 3.6 3.7 3.5 2.7% 2.6% 2.7% 2.6% 0.1 0.1 0.2 0.2 3.7% 4.1% 4.4% 4.5%
EE 0.3 0.3 0.3 0.3 3.1% 2.9% 2.9% 3.0% 0.0 0.0 0.0 0.0 1.5% 1.8% 1.8% 1.3%
ES 35.3 34.1 36.9 36.1 9.8% 9.5% 9.3% 9.1% 3.6 3.3 3.6 3.5 10.1% 9.7% 9.9% 9.7%
FI 4.4 4.1 3.9 3.9 4.1% 3.7% 3.7% 3.6% 0.2 0.2 0.2 0.2 5.2% 5.1% 4.7% 4.6%
FR 47.9 47.8 48.6 49.2 4.8% 4.7% 4.7% 4.6% 2.3 2.2 2.2 2.4 4.7% 4.7% 4.6% 4.9%
GR 5.9 5.6 5.6 4.1 7.7% 7.2% 7.1% 6.1% 2.9 2.7 2.7 1.2 48.8% 48.5% 49.2% 30.2%
HR 1.0 1.2 1.3 1.1 8.4% 9.6% 10.4% 8.5% 0.1 0.1 0.1 0.1 12.7% 10.7% 10.0% 10.9%
HU 1.0 1.1 1.1 1.2 4.7% 4.8% 5.1% 5.3% 0.0 0.0 0.0 0.0 1.6% 1.6% 1.9% 2.2%
IE 1.5 1.5 1.5 1.5 2.5% 2.5% 2.4% 2.7% 0.1 0.1 0.1 0.1 8.6% 7.9% 7.7% 6.1%
IS 1.2 1.1 1.2 1.1 11.3% 10.6% 10.4% 10.2% 0.0 0.0 0.1 0.1 3.7% 2.8% 5.4% 7.8%
IT 48.5 42.0 43.0 41.5 8.9% 8.0% 8.0% 8.0% 16.2 10.7 10.5 9.3 33.4% 25.5% 24.5% 22.5%
LI 0.0 0.0 0.0 0.0 1.8% 2.1% 1.3% 0.8% 0.0 0.0 0.0 0.0 0.0% 0.0% 0.0% 0.0%
LT 0.3 0.3 0.3 0.2 3.3% 3.0% 3.2% 2.5% 0.0 0.0 0.0 0.0 13.2% 12.8% 11.4% 10.3%
LU 4.1 3.7 3.8 3.8 4.0% 3.7% 3.8% 3.7% 0.1 0.1 0.1 0.1 1.8% 2.0% 1.6% 1.6%
LV 0.2 0.2 0.2 0.2 2.9% 2.5% 2.7% 2.8% 0.0 0.0 0.0 0.0 3.7% 4.0% 3.3% 3.2%
MT 0.2 0.2 0.2 0.3 3.9% 3.5% 4.0% 4.3% 0.1 0.1 0.1 0.1 32.3% 30.5% 23.1% 22.1%
NL 10.0 10.4 10.7 10.6 3.2% 3.4% 3.4% 3.4% 0.7 0.6 0.6 0.6 6.6% 6.2% 5.6% 5.3%
NO* 10.6 12.9 13.0 5.4 9.4% 10.4% 10.7% 7.6% 0.1 0.1 0.1 0.1 0.9% 0.8% 0.9% 1.0%
PL 4.0 3.8 3.8 4.1 5.6% 5.4% 5.4% 5.6% 0.3 0.3 0.3 0.2 8.7% 7.7% 7.4% 5.9%
PT 8.2 8.0 6.8 6.7 10.7% 10.5% 10.2% 10.0% 1.6 1.3 0.7 0.7 19.7% 16.7% 11.1% 11.1%
RO 2.6 2.5 2.4 2.5 9.6% 9.3% 9.0% 9.0% 0.3 0.3 0.3 0.3 11.3% 10.5% 10.6% 10.3%
SE 6.1 6.3 6.3 5.6 2.7% 2.7% 2.7% 2.4% 0.1 0.1 0.1 0.1 1.4% 1.2% 1.1% 1.5%
SI 0.3 0.3 0.3 0.3 3.9% 3.8% 3.9% 4.2% 0.0 0.0 0.0 0.0 11.3% 11.4% 10.3% 7.6%
SK 1.3 1.2 1.3 1.3 5.3% 5.2% 5.6% 5.6% 0.1 0.1 0.0 0.0 4.1% 4.2% 3.3% 3.4%
EU/EEA 249.6 242.6 247.3 234.8 5.8% 5.7% 5.7% 5.5% 31.8 25.4 24.9 22.0 12.7% 10.5% 10.1% 9.4%
Memo item: Non-EU/EEA
countries37.5 35.8 37.3 35.5 2.9% 3.0% 3.0% 2.9% 2.6 3.0 3.0 2.7 7.0% 8.3% 8.1% 7.5%
Volumes bn EUR; %
* Norwegian banks have not implemented yet the reporting framework based on CRR2/CRD5. Therefore, Norwegian figures are included in the EBA Risk dashboard only until March 2021.
Total exposures to Construction (NACE F) Non-performing exposures to Construction (NACE F)
Statistical AnnexExposures to Real Estate activities and Construction - by country of counterparty
In compliance with the Recommendation ESRB/2016/14 on closing real estate data gaps, the EBA is disclosing aggregated information on the exposures towards Non-financial corporations under Real Estate activities (NACE code L) and Construction Sector (NACE code F) (1) (2)
Total exposures to Real Estate activities (NACE L) Non-performing exposures to Real Estate activities (NACE L)
Gross carrying amount As % of Total of exposures to Non-
financial corporationsGross carrying amount NPL ratio
(2) Data is country aggregated on the basis of the residence of the immediate counterparty. The information on the geographical distribution of exposures by country is reported by institutions where non-domestic original exposures in all ‘non-domestic’ countries in all exposures classes are equal or higher than 10 % of total domestic and non-domestic original exposures. For this purpose exposures shall be deemed to be domestic where they are exposures to counterparties located in the Member State where the institution is located.
Individual country data includes subsidiaries, which are excluded from EU aggregate. For example, at country level the subsidiary in country X of a bank domiciled in country Y is included both in data for countries X and Y (for the latter as part of the consolidated entity). In the EU aggregate, only the consolidated entity domiciled in country Y is considered. The sample of banks is unbalanced and reviewed annually. Being an unbalanced sample, the number of reporting banks per country can display minor variations between quarters, which might accordingly affect quarterly changes in absolute and relative figures. As of Q1 2020 onwards UK banks are removed from the EU/EEA aggregate and subsidiaries of UK banks in EU member states are used instead.
Gross carrying amount As % of Total of exposures to Non-
financial corporationsGross carrying amount NPL ratio
(1) In disclosing aggregated information on the real estate (RE) exposures towards the different national RE markets in the Union, the EBA made use of information in regulatory reporting templates that provide a breakdown of credit exposures. RE exposures are identified as those referred to as both the NACE codes ‘F’ and ‘L’, although strictly speaking some sub-categories would need to be excluded following the Commercial Real Estate (CRE) definition adopted in the ESRB Recommendation.

34
% of loans and advances at amortised cost
Sep-20 Dec-20 Mar-21 Jun-21 Sep-20 Dec-20 Mar-21 Jun-21 Sep-20 Dec-20 Mar-21 Jun-21 Sep-20 Dec-20 Mar-21 Jun-21 Sep-20 Dec-20 Mar-21 Jun-21 Sep-20 Dec-20 Mar-21 Jun-21
AT 80.0% 79.1% 79.7% 80.1% 17.6% 18.3% 17.8% 17.5% 2.4% 2.6% 2.5% 2.4% 0.2% 0.2% 0.2% 0.2% 2.8% 3.0% 3.0% 3.2% 54.2% 51.6% 51.2% 51.2%
BE 86.6% 86.2% 86.0% 87.1% 11.2% 11.4% 11.6% 10.8% 2.3% 2.4% 2.4% 2.1% 0.1% 0.1% 0.1% 0.1% 2.9% 3.0% 3.1% 2.9% 43.0% 41.2% 41.2% 42.6%
BG 79.8% 80.2% 81.7% 82.7% 11.2% 10.8% 9.9% 9.6% 9.0% 9.0% 8.4% 7.7% 0.6% 0.6% 0.6% 0.5% 9.6% 8.5% 9.1% 9.6% 49.5% 50.5% 50.2% 51.1%
CY 63.0% 64.2% 65.7% 68.4% 16.1% 18.5% 17.1% 17.1% 20.9% 17.3% 17.2% 14.5% 0.4% 0.4% 0.4% 0.5% 1.7% 2.1% 2.1% 2.8% 47.1% 45.4% 46.2% 49.3%
CZ 93.5% 92.7% 93.1% 93.4% 5.2% 5.8% 5.5% 5.3% 1.3% 1.5% 1.4% 1.4% 0.1% 0.1% 0.1% 0.1% 7.2% 7.2% 7.0% 6.7% 56.9% 54.7% 53.7% 54.1%
DE 91.6% 89.2% 89.1% 90.2% 6.8% 9.2% 9.3% 8.4% 1.6% 1.6% 1.6% 1.4% 0.1% 0.1% 0.1% 0.1% 2.4% 2.4% 2.3% 2.6% 39.0% 38.0% 38.0% 38.7%
DK 88.9% 89.3% 89.7% 89.8% 8.1% 7.6% 7.3% 7.8% 3.0% 3.1% 2.9% 2.3% 0.2% 0.2% 0.2% 0.2% 5.6% 6.4% 6.2% 6.2% 43.9% 38.8% 40.2% 40.9%
EE 86.6% 87.8% 88.0% 90.2% 11.6% 10.7% 10.5% 8.4% 1.8% 1.5% 1.5% 1.4% 0.2% 0.2% 0.2% 0.1% 1.8% 1.9% 2.1% 2.6% 34.6% 29.7% 27.5% 28.1%
ES 90.5% 89.5% 89.1% 89.3% 6.0% 7.1% 7.5% 7.4% 3.5% 3.4% 3.5% 3.3% 0.5% 0.5% 0.5% 0.4% 8.0% 7.3% 7.1% 7.0% 45.0% 45.8% 44.7% 44.4%
FI 92.2% 92.7% 92.4% 93.1% 6.0% 5.6% 6.0% 5.5% 1.8% 1.7% 1.7% 1.4% 0.1% 0.1% 0.1% 0.1% 2.4% 2.6% 2.5% 2.4% 34.7% 33.4% 33.4% 37.5%
FR 90.1% 89.0% 89.0% 89.0% 7.1% 8.4% 8.3% 8.5% 2.7% 2.6% 2.7% 2.6% 0.2% 0.2% 0.2% 0.2% 4.3% 4.3% 4.3% 4.2% 50.5% 50.5% 49.9% 50.6%
GR 54.2% 56.0% 55.7% 69.6% 12.9% 13.8% 13.7% 13.2% 33.0% 30.3% 30.6% 17.2% 0.7% 0.6% 0.6% 0.6% 6.3% 5.7% 5.8% 5.4% 44.8% 44.6% 46.9% 46.4%
HR 84.4% 83.4% 84.2% 84.5% 10.4% 11.3% 10.6% 10.8% 5.2% 5.3% 5.1% 4.7% 0.6% 0.6% 0.6% 0.6% 7.1% 7.8% 7.8% 7.9% 67.5% 62.9% 63.1% 62.2%
HU 85.1% 83.3% 83.3% 84.1% 10.3% 12.1% 12.3% 12.2% 4.7% 4.6% 4.4% 3.7% 0.7% 0.8% 0.8% 0.8% 10.5% 9.9% 9.0% 8.7% 65.6% 62.9% 63.3% 64.7%
IE 80.4% 79.0% 79.2% 79.1% 14.4% 15.6% 15.8% 16.2% 5.2% 5.4% 5.0% 4.7% 0.7% 0.5% 0.5% 0.4% 5.5% 5.9% 5.7% 5.6% 29.9% 31.0% 29.3% 29.2%
IS 82.7% 83.3% 84.2% 85.2% 14.2% 13.9% 13.0% 12.2% 3.1% 2.8% 2.8% 2.6% 0.4% 0.4% 0.3% 0.3% 3.6% 3.7% 3.7% 3.6% 31.0% 31.3% 30.4% 26.2%
IT 82.7% 81.1% 81.7% 82.1% 11.4% 13.8% 13.3% 13.4% 5.9% 5.1% 5.0% 4.5% 0.2% 0.3% 0.3% 0.3% 3.5% 3.5% 3.3% 3.5% 53.8% 53.5% 53.3% 54.4%
LT 87.6% 89.7% 88.2% 89.4% 10.5% 8.4% 9.9% 9.0% 1.9% 1.9% 1.9% 1.5% 0.2% 0.1% 0.2% 0.2% 1.5% 1.8% 1.9% 2.1% 33.7% 31.1% 28.9% 29.4%
LU 91.9% 91.8% 92.2% 92.6% 5.8% 5.8% 5.7% 5.4% 2.3% 2.4% 2.1% 2.0% 0.2% 0.2% 0.2% 0.2% 1.9% 2.2% 2.3% 2.4% 34.0% 33.4% 34.6% 37.4%
LV 87.0% 87.0% 86.7% 88.1% 10.5% 10.6% 10.8% 9.8% 2.5% 2.3% 2.5% 2.1% 0.3% 0.4% 0.4% 0.5% 2.1% 2.1% 3.2% 2.8% 39.4% 38.7% 30.8% 34.5%
MT 88.1% 85.2% 86.0% 85.4% 7.6% 10.0% 9.6% 10.1% 4.3% 4.8% 4.4% 4.5% 0.3% 0.4% 0.4% 0.4% 4.3% 4.9% 4.2% 4.3% 30.6% 35.2% 36.1% 31.8%
NL 89.5% 89.9% 90.5% 90.9% 8.1% 7.7% 7.2% 7.0% 2.4% 2.4% 2.3% 2.1% 0.1% 0.1% 0.1% 0.1% 2.2% 2.4% 2.6% 2.4% 27.8% 27.7% 27.3% 27.1%
NO* 88.8% 90.4% 91.0% n.a. 9.2% 7.8% 7.1% n.a. 2.0% 1.9% 1.9% n.a. 0.1% 0.1% 0.1% n.a. 1.3% 1.3% 1.4% n.a. 38.2% 37.4% 36.3% n.a.
PL 84.8% 81.9% 81.5% 82.3% 10.1% 12.9% 13.1% 12.8% 5.1% 5.1% 5.4% 4.9% 0.4% 0.4% 0.4% 0.4% 6.1% 5.9% 5.5% 5.7% 64.1% 63.6% 60.5% 62.8%
PT 84.5% 82.2% 83.0% 83.1% 9.3% 12.2% 11.6% 11.9% 6.2% 5.7% 5.4% 5.0% 0.3% 0.4% 0.4% 0.4% 7.0% 5.9% 7.3% 7.1% 55.0% 53.9% 57.0% 58.8%
RO 78.8% 75.7% 76.5% 75.9% 16.5% 19.7% 18.9% 19.8% 4.6% 4.6% 4.6% 4.2% 1.0% 1.1% 1.1% 1.1% 10.4% 10.3% 10.1% 10.4% 65.4% 66.3% 66.4% 69.6%
SE 95.2% 95.5% 95.7% 95.9% 4.2% 4.0% 3.9% 3.7% 0.6% 0.5% 0.5% 0.4% 0.0% 0.0% 0.0% 0.0% 1.6% 1.8% 2.1% 1.9% 44.1% 44.9% 41.7% 42.5%
SI 90.0% 88.1% 88.0% 88.9% 6.4% 8.1% 8.2% 7.7% 3.6% 3.7% 3.8% 3.4% 0.7% 0.7% 0.7% 0.6% 7.7% 5.9% 5.7% 5.3% 58.9% 55.5% 54.0% 58.3%
SK 80.9% 81.6% 82.8% 83.0% 16.6% 16.1% 14.8% 14.9% 2.5% 2.3% 2.4% 2.1% 0.2% 0.3% 0.3% 0.2% 3.0% 3.3% 3.6% 3.5% 64.8% 62.4% 61.4% 61.5%
EU/EEA 88.6% 87.7% 87.9% 88.4% 8.0% 9.1% 9.0% 8.8% 3.4% 3.2% 3.1% 2.8% 0.2% 0.2% 0.2% 0.2% 4.1% 4.0% 4.1% 4.1% 46.6% 46.1% 46.0% 46.6%
T14_0 T14_0 T14_0 T14_0 T14_1 T14_1 T14_1 T14_1 T14_2 T14_2 T14_2 T14_2 T14_3 T14_3 T14_3 T14_3
202009 202012 202103 202106 202009 202012 202103 202106 202009 202012 202103 202106 202009 202012 202103 202106
Volumes bn EUR, % as share of fair value financial assets
Sep-20 Dec-20 Mar-21 Jun-21 Sep-20 Dec-20 Mar-21 Jun-21 Sep-20 Dec-20 Mar-21 Jun-21 Sep-20 Dec-20 Mar-21 Jun-21
64.2 62.9 61.5 60.7 59.0% 61.1% 62.8% 63.7% 33.3% 31.3% 29.3% 28.2% 7.7% 7.6% 7.9% 8.1%
121.2 110.1 101.4 98.0 33.4% 35.5% 39.7% 39.9% 55.4% 54.9% 50.6% 50.8% 11.1% 9.6% 9.8% 9.4%
4.1 4.1 4.0 4.1 77.6% 77.7% 79.9% 76.9% 21.4% 21.3% 18.9% 21.7% 1.1% 1.1% 1.2% 1.4%
1.5 1.3 1.3 1.3 74.4% 71.1% 71.7% 73.6% 1.6% 2.3% 1.4% 1.0% 24.0% 26.6% 26.8% 25.4%
9.2 7.1 7.5 8.5 32.4% 39.5% 42.8% 42.2% 63.6% 55.6% 51.6% 52.8% 4.0% 5.0% 5.6% 5.0%
1,125.7 1,085.7 1,017.6 986.6 21.0% 21.1% 20.6% 21.7% 74.0% 73.5% 73.7% 72.6% 4.9% 5.5% 5.8% 5.8%
531.2 529.7 525.2 511.1 12.8% 13.0% 14.0% 14.2% 86.9% 86.8% 78.8% 79.4% 0.3% 0.2% 7.2% 6.4%
3.2 3.0 2.9 2.8 36.8% 33.7% 22.6% 22.2% 62.6% 65.9% 77.0% 77.4% 0.6% 0.4% 0.4% 0.4%
554.2 512.8 515.3 504.2 44.2% 48.6% 48.8% 48.5% 53.1% 48.7% 48.1% 48.1% 2.7% 2.7% 3.1% 3.4%
247.9 222.9 231.0 224.4 23.4% 22.5% 23.6% 24.7% 74.5% 75.6% 74.8% 73.6% 2.1% 2.0% 1.6% 1.6%
2,235.4 2,105.4 2,247.4 2,155.5 29.5% 29.2% 34.0% 35.5% 67.1% 67.4% 62.4% 60.8% 3.4% 3.4% 3.6% 3.7%
27.9 29.0 29.4 29.1 53.8% 53.5% 60.1% 59.2% 43.4% 43.9% 37.3% 37.1% 2.9% 2.5% 2.6% 3.7%
5.1 5.0 4.9 5.0 40.5% 44.2% 46.4% 46.0% 57.9% 52.8% 52.0% 52.8% 1.6% 2.9% 1.6% 1.2%
9.2 11.3 14.8 14.8 49.7% 39.8% 44.3% 41.4% 43.5% 35.2% 34.6% 34.7% 6.8% 25.0% 21.1% 23.9%
42.3 44.5 46.7 44.1 66.4% 61.7% 60.2% 66.5% 29.9% 34.7% 35.8% 29.4% 3.7% 3.7% 4.0% 4.2%
3.4 3.5 3.5 3.7 85.6% 87.0% 86.5% 86.7% 7.8% 5.7% 4.3% 4.4% 6.6% 7.4% 9.2% 8.9%
403.8 369.9 376.6 394.2 63.2% 60.8% 63.7% 66.2% 33.2% 35.5% 32.4% 30.1% 3.6% 3.8% 3.9% 3.7%
0.7 0.8 0.9 1.9 94.4% 95.3% 94.6% 44.7% 3.5% 3.4% 3.6% 54.4% 2.1% 1.4% 1.9% 0.9%
57.5 14.0 13.7 12.9 14.2% 58.3% 62.7% 61.7% 40.7% 37.0% 29.8% 29.9% 45.0% 4.7% 7.5% 8.4%
1.8 1.6 1.7 1.6 48.0% 44.5% 46.5% 40.8% 51.5% 55.1% 53.1% 58.8% 0.6% 0.4% 0.4% 0.4%
2.4 2.3 2.3 2.5 65.6% 71.8% 69.4% 68.8% 33.6% 27.3% 29.6% 30.3% 0.9% 0.9% 0.9% 0.9%
281.8 267.2 274.1 268.4 43.6% 44.2% 42.8% 44.0% 53.5% 52.9% 54.4% 52.9% 2.9% 2.9% 2.8% 3.1%
64.6 68.9 66.4 n.a. 8.4% 10.4% 10.0% n.a. 69.9% 68.0% 66.4% n.a. 21.7% 21.6% 23.5% n.a.
47.0 46.6 44.8 43.2 64.3% 69.3% 67.6% 63.6% 24.1% 19.8% 20.8% 25.2% 11.6% 10.9% 11.6% 11.2%
54.0 50.1 43.8 44.0 71.0% 70.3% 68.6% 69.7% 16.4% 16.8% 18.5% 17.6% 12.6% 12.9% 12.9% 12.7%
10.9 12.2 14.0 14.4 96.7% 96.7% 96.0% 95.5% 2.2% 2.5% 3.3% 3.7% 1.0% 0.8% 0.7% 0.8%
136.4 120.3 135.2 132.5 34.8% 38.4% 42.3% 43.8% 64.7% 61.1% 57.2% 55.6% 0.5% 0.5% 0.5% 0.6%
4.7 6.0 5.7 5.5 82.0% 64.4% 64.2% 63.0% 16.1% 34.1% 34.1% 36.6% 1.9% 1.5% 1.7% 0.4%
2.4 2.2 1.9 2.0 33.5% 48.0% 54.3% 64.4% 64.2% 50.7% 44.2% 34.3% 2.4% 1.3% 1.5% 1.3%
5,879.0 5,573.3 5,696.3 5,457.9 31.8% 31.9% 34.3% 35.9% 64.5% 64.2% 61.0% 59.6% 3.8% 3.9% 4.6% 4.5%
* Norwegian banks have not implemented yet the reporting framework based on CRR2/CRD5. Therefore, Norwegian figures are included in the EBA Risk dashboard only until March 2021.
(2) from June 2021 and onwards, the gross carrying amount of assets and accumulated impairments that are purchased or originated as credit-impaired at initial recognition are not included in the impairment stages, as it was the case in previous periods.
(1) Applicable only to IFRS reporting banks.Individual country data includes subsidiaries, which are excluded from EU aggregate. For example, at country level the subsidiary in country X of a bank domiciled in country Y is included both in data for countries X and Y (for the latter as part of the consolidated entity). In the EU aggregate, only the consolidated entity domiciled in country Y is considered. The sample of banks is unbalanced and reviewed annually. Being an unbalanced sample, the number of reporting banks per country can display minor variations between quarters, which might accordingly affect quarterly changes in absolute and relative figures. As of Q1 2020 onwards UK banks are removed from the EU/EEA aggregate and subsidiaries of UK banks in EU member states are used instead.
SE
SI
SK
EU/EEA
LT
LU
LV
IS
IT
PL
PT
RO
MT
NL
NO*
HR
HU
IE
FI
FR
GR
DK
EE
ES
CY
CZ
DE
AT
BE
BG
Total fair valued financial assets Level 2 financial assets Level 3 financial assets
Fair valued financial assets
Level 1 financial assets
Statistical Annex
IFRS 9 specific data (1)
Loans and advances at amortised cost: distribution among stages according to IFRS 9 (2)
Stage 1 Stage 2 Stage 3Coverage ratio of stage 1 loans
and advancesCoverage ratio of stage 2 loans
and advancesCoverage ratio of stage 3 loans
and advances

35
T15 1 T15 1 T15 2 T15 2 T15 3 T15 3 T15 4 T15 4 T15 5 T15 5 T15 6 T15 6 T15 7 T15 7 T15 8 T15 8 T15 9 T15 9
Dec-20 Jun-21 Dec-20 Jun-21 Dec-20 Jun-21 Dec-20 Jun-21 Dec-20 Jun-21 Dec-20 Jun-21 Dec-20 Jun-21 Dec-20 Jun-21 Dec-20 Jun-2194.0 79.6 27% 29% 61% 57% 93.6 79.6 5% 5% 1% 1% 33% 34% 57% 55% 5% 5%
183.2 176.3 41% 41% 49% 45% 175.4 178.5 2% 2% 0% 0% 12% 12% 84% 84% 2% 1%
5.5 5.9 75% 71% 19% 20% 5.5 5.9 1% 1% 0% 0% 66% 60% 29% 32% 4% 7%
3.7 3.5 93% 88% 2% 4% 3.6 3.5 0% 0% 0% 0% 17% 20% 83% 80% 0% 0%
26.0 32.0 95% 96% 5% 3% 26.0 32.0 2% 1% 12% 14% 10% 9% 76% 77% 0% 0%
518.5 478.2 40% 39% 30% 24% 458.1 411.6 26% 29% 2% 3% 27% 22% 37% 38% 8% 8%
47.3 47.6 48% 48% 47% 46% 46.7 45.3 47% 52% 1% 1% 2% 4% 25% 22% 25% 21%
4.1 1.5 82% 55% 18% 45% 4.1 1.5 0% 0% 6% 16% 0% 0% 77% 46% 17% 38%
453.7 480.6 52% 56% 18% 17% 437.1 464.8 12% 11% 1% 1% 35% 32% 52% 57% 0% 0%
42.4 42.7 42% 43% 43% 39% 41.2 42.7 7% 7% 0% 0% 11% 12% 52% 47% 30% 34%
1,008.8 1,039.1 53% 52% 22% 22% 927.5 903.0 19% 23% 0% 0% 19% 16% 61% 60% 1% 1%
40.0 46.0 67% 69% 29% 27% 39.9 45.8 2% 3% 0% 0% 35% 31% 63% 66% 0% 0%
7.7 10.4 87% 85% 7% 9% 7.7 10.4 2% 2% 0% 0% 41% 43% 57% 56% 0% 0%
7.6 17.7 99% 99% 0% 1% 7.6 13.1 2% 17% 0% 0% 15% 15% 80% 67% 4% 1%
38.6 41.0 41% 36% 52% 47% 33.7 34.3 17% 22% 0% 0% 63% 51% 19% 26% 1% 2%
1.3 2.5 67% 83% 20% 10% 0.7 1.5 100% 100% 0% 0% 0% 0% 0% 0% 0% 0%
440.4 510.4 63% 61% 27% 28% 426.8 472.6 9% 12% 0% 0% 31% 32% 59% 55% 2% 1%
1.8 1.9 88% 89% 11% 11% 1.8 1.9 1% 1% 0% 0% 1% 2% 58% 58% 40% 40%
23.9 23.3 18% 24% 54% 51% 25.5 23.3 0% 0% 0% 0% 31% 49% 68% 50% 1% 1%
1.8 1.9 49% 46% 48% 51% 1.8 1.9 0% 0% 0% 0% 10% 10% 69% 66% 21% 24%
3.1 3.2 60% 62% 38% 36% 3.1 3.2 0% 0% 0% 0% 36% 35% 63% 65% 0% 0%
252.1 246.8 50% 49% 35% 35% 251.4 245.4 1% 2% 1% 1% 32% 31% 36% 38% 30% 28%
18.5 n.a. 37% n.a. 7% n.a. 17.0 n.a. 27% n.a. 30% n.a. 30% n.a. 8% n.a. 5% n.a.
47.3 52.3 97% 100% 3% 0% 47.3 52.3 1% 1% 0% 0% 63% 56% 36% 43% 0% 0%
84.3 70.9 61% 60% 35% 34% 84.3 70.9 4% 2% 0% 0% 40% 49% 52% 38% 5% 11%
19.5 20.9 96% 89% 2% 9% 19.5 20.9 34% 39% 0% 0% 25% 25% 21% 19% 21% 17%
57.6 64.1 78% 79% 16% 15% 56.5 61.2 16% 21% 14% 13% 3% 3% 53% 51% 13% 12%
6.6 6.6 34% 33% 31% 32% 6.6 6.6 1% 0% 0% 0% 64% 64% 35% 36% 0% 0%
6.8 7.0 80% 78% 19% 21% 6.8 7.0 0% 2% 0% 0% 1% 14% 98% 83% 0% 0%
3,281 3,345 51% 52% 28% 26% 3,096 3,068 15% 17% 1% 1% 26% 24% 53% 53% 6% 5%
(1) Direct exposures through Non-derivative financial assets. Information on sovereign exposures is only available for institutions that have sovereign exposures of at least 1% of total “Debt securities and loans receivables”.(2) The breakdown by accounting portfolios refers to the Total carrying amount of General governments exposures through Non-derivative financial assets.
T16_1 T16_1 T16_2 T16_2 T16_3 T16_3 T16_4 T16_4 T16_5 T16_5202012 202106 202012 202106 202012 202106 202012 202106 202012 202106
Dec-20 Jun-21 Dec-20 Jun-21 Dec-20 Jun-21 Dec-20 Jun-21 Dec-20 Jun-2111% 9% 8% 9% 38% 40% 28% 27% 14% 16%
5% 6% 5% 3% 26% 29% 30% 30% 33% 32%
6% 2% 3% 14% 49% 41% 39% 38% 4% 6%
2% 3% 33% 21% 54% 60% 8% 13% 2% 3%
4% 4% 5% 6% 32% 34% 38% 42% 20% 14%
8% 8% 8% 8% 28% 28% 15% 16% 40% 39%
37% 92% 12% 2% 34% 4% 9% 1% 7% 1%
62% 1% 6% 27% 19% 40% 11% 27% 2% 5%
6% 10% 14% 13% 37% 35% 29% 26% 13% 16%
27% 26% 4% 9% 27% 24% 28% 25% 15% 17%
17% 16% 9% 10% 32% 27% 19% 19% 23% 28%
4% 3% 12% 11% 20% 16% 19% 19% 46% 51%
7% 3% 26% 22% 33% 35% 31% 34% 3% 6%
28% 25% 3% 4% 27% 23% 36% 42% 7% 6%
23% 25% 8% 7% 29% 37% 31% 27% 8% 4%
26% 35% 22% 11% 52% 52% 0% 1% 0% 2%
6% 4% 10% 9% 46% 46% 22% 25% 16% 16%
23% 22% 6% 10% 65% 61% 6% 6% 0% 0%
9% 14% 7% 7% 49% 48% 30% 26% 5% 5%
7% 2% 5% 19% 69% 56% 17% 19% 3% 4%
8% 7% 13% 10% 44% 44% 35% 36% 1% 3%
6% 6% 10% 7% 32% 35% 22% 22% 29% 30%
19% n.a. 15% n.a. 43% n.a. 9% n.a. 14% n.a.
6% 5% 11% 9% 55% 52% 24% 28% 4% 6%
23% 24% 27% 9% 16% 26% 25% 30% 10% 10%
27% 19% 8% 9% 46% 44% 12% 19% 7% 9%
28% 32% 16% 17% 40% 34% 10% 11% 5% 5%
8% 7% 10% 16% 49% 44% 23% 22% 11% 10%
7% 2% 12% 7% 25% 41% 49% 40% 8% 10%
12% 12% 10% 9% 34% 32% 21% 22% 22% 24%
* Norwegian banks have not implemented yet the reporting framework based on CRR2/CRD5. Therefore, Norwegian figures are included in the EBA Risk dashboard only until March 2021.
NO*
HR
HU
IE
LT
LU
LV
MT
ES
IS
IT
NL
FI
Sovereign exposure
Direct exposures towards General governments (1)
Total carrying amount (net of short positions)of which (2):
Other financial assets
Financial assets held for trading
Fair value through P&L
Fair value through OCI
Amortised costVolumes bn EUR, % of total sov exposure
DK
EE
DE
GR
CY
FR
Total gross carrying amountof which:
CZ
AT
BE
BG
to other EU/EEA countries
to home country
CZ
DE
DK
EE
PT
FR
GR
HR
RO
SE
EU/EEA
ES
SI
SK
MT
PL
PT
RO
SI
SK
NL
EU/EEA
SE
FI
HU
IE
IS
IT
Sovereign exposure
Total gross carrying amount by maturity% of total sov exposure
LV
Statistical Annex
Sovereign exposures
Individual country data includes subsidiaries, which are excluded from EU aggregate. For example, at country level the subsidiary in country X of a bank domiciled in country Y is included both in data for countries X and Y (for the latter as part of the consolidated entity). In the EU aggregate, only the consolidated entity domiciled in country Y is considered. The sample of banks is unbalanced and reviewed annually. Being an unbalanced sample, the number of reporting banks per country can display minor variations between quarters, which might accordingly affect quarterly changes in absolute and relative figures. As of Q1 2020 onwards UK banks are removed from the EU/EEA aggregate and subsidiaries of UK banks in EU member states are used instead.
10Y - more3M - 1Y0 - 3M
AT
CY
BE
BG
1Y - 5Y 5Y - 10Y
NO*
PL
LT
LU
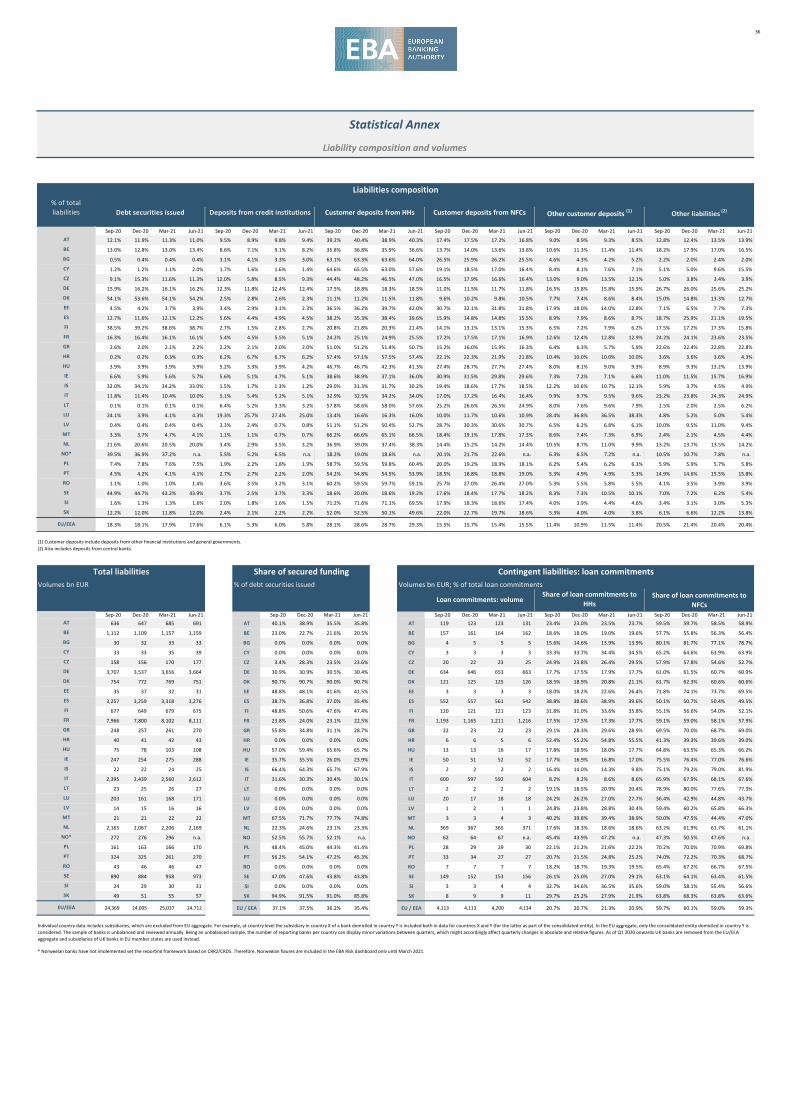
36
Sep-20 Dec-20 Mar-21 Jun-21 Sep-20 Dec-20 Mar-21 Jun-21 Sep-20 Dec-20 Mar-21 Jun-21 Sep-20 Dec-20 Mar-21 Jun-21 Sep-20 Dec-20 Mar-21 Jun-21 Sep-20 Dec-20 Mar-21 Jun-21
12.1% 11.9% 11.3% 11.0% 9.5% 8.9% 9.8% 9.4% 39.2% 40.4% 38.9% 40.3% 17.4% 17.5% 17.2% 16.8% 9.0% 8.9% 9.3% 8.5% 12.8% 12.4% 13.5% 13.9%
13.0% 12.8% 13.0% 13.4% 8.6% 7.1% 9.1% 8.2% 35.8% 36.8% 35.9% 36.6% 13.7% 14.0% 13.6% 13.8% 10.6% 11.3% 11.4% 11.4% 18.2% 17.9% 17.0% 16.5%
0.5% 0.4% 0.4% 0.4% 3.1% 4.1% 3.3% 3.0% 63.1% 63.3% 63.6% 64.0% 26.5% 25.9% 26.2% 25.5% 4.6% 4.3% 4.2% 5.2% 2.2% 2.0% 2.4% 2.0%
1.2% 1.2% 1.1% 2.0% 1.7% 1.6% 1.6% 1.4% 64.6% 65.5% 63.0% 57.6% 19.1% 18.5% 17.0% 16.4% 8.4% 8.1% 7.6% 7.1% 5.1% 5.0% 9.6% 15.5%
9.1% 15.3% 11.6% 11.3% 12.0% 5.8% 8.5% 9.3% 44.4% 48.2% 46.5% 47.0% 16.5% 17.9% 16.6% 16.4% 13.0% 9.0% 13.5% 12.1% 5.0% 3.8% 3.4% 3.9%
15.9% 16.2% 16.1% 16.2% 12.3% 11.8% 12.4% 12.4% 17.5% 18.8% 18.3% 18.5% 11.0% 11.5% 11.7% 11.8% 16.5% 15.8% 15.8% 15.9% 26.7% 26.0% 25.6% 25.2%
54.1% 53.6% 54.1% 54.2% 2.5% 2.8% 2.6% 2.3% 11.1% 11.2% 11.5% 11.8% 9.6% 10.2% 9.8% 10.5% 7.7% 7.4% 8.6% 8.4% 15.0% 14.8% 13.3% 12.7%
4.5% 4.2% 3.7% 3.9% 3.4% 2.9% 3.1% 2.3% 36.5% 36.2% 39.7% 42.0% 30.7% 32.1% 31.8% 31.8% 17.9% 18.0% 14.0% 12.8% 7.1% 6.5% 7.7% 7.3%
12.7% 11.6% 12.1% 12.2% 5.6% 4.4% 4.9% 4.5% 38.2% 35.3% 38.4% 39.6% 15.9% 14.8% 14.8% 15.5% 8.9% 7.9% 8.6% 8.7% 18.7% 25.9% 21.1% 19.5%
38.5% 39.2% 38.6% 38.7% 2.7% 1.5% 2.8% 2.7% 20.8% 21.8% 20.3% 21.4% 14.1% 13.1% 13.1% 15.3% 6.5% 7.2% 7.9% 6.2% 17.5% 17.2% 17.3% 15.8%
16.3% 16.4% 16.1% 16.1% 5.4% 4.5% 5.5% 5.1% 24.2% 25.1% 24.9% 25.5% 17.2% 17.5% 17.1% 16.9% 12.6% 12.4% 12.8% 12.9% 24.2% 24.1% 23.6% 23.5%
2.6% 2.0% 2.1% 2.2% 2.2% 2.1% 2.0% 2.0% 51.0% 51.2% 51.4% 50.7% 15.2% 16.0% 15.9% 16.3% 6.4% 6.3% 5.7% 5.9% 22.6% 22.4% 22.8% 22.8%
0.2% 0.2% 0.3% 0.3% 6.2% 6.7% 6.7% 6.2% 57.4% 57.1% 57.5% 57.4% 22.1% 22.3% 21.9% 21.8% 10.4% 10.0% 10.0% 10.0% 3.6% 3.6% 3.6% 4.3%
3.9% 3.9% 3.9% 3.9% 5.2% 3.3% 3.9% 4.2% 46.7% 46.7% 42.3% 41.3% 27.4% 28.7% 27.7% 27.4% 8.0% 8.1% 9.0% 9.3% 8.9% 9.3% 13.2% 13.9%
6.6% 5.9% 5.6% 5.7% 5.6% 5.1% 4.7% 5.1% 38.6% 38.9% 37.1% 36.0% 30.9% 31.5% 29.8% 29.6% 7.3% 7.2% 7.1% 6.6% 11.0% 11.5% 15.7% 16.9%
32.0% 34.1% 34.2% 33.0% 1.5% 1.7% 1.3% 1.2% 29.0% 31.3% 31.7% 30.2% 19.4% 18.6% 17.7% 18.5% 12.2% 10.6% 10.7% 12.1% 5.9% 3.7% 4.5% 4.9%
11.8% 11.4% 10.4% 10.0% 5.1% 5.4% 5.2% 5.1% 32.9% 32.5% 34.2% 34.0% 17.0% 17.2% 16.4% 16.4% 9.9% 9.7% 9.5% 9.6% 23.2% 23.8% 24.3% 24.9%
0.1% 0.1% 0.1% 0.1% 6.4% 5.2% 3.3% 3.2% 57.8% 58.6% 58.0% 57.6% 25.2% 26.6% 26.5% 24.9% 8.0% 7.6% 9.6% 7.9% 2.5% 2.0% 2.5% 6.2%
24.1% 3.9% 4.1% 4.3% 19.3% 25.7% 27.4% 25.0% 13.4% 16.6% 16.3% 16.0% 10.0% 11.7% 10.6% 10.9% 28.4% 36.8% 36.5% 38.3% 4.8% 5.2% 5.0% 5.4%
0.4% 0.4% 0.4% 0.4% 3.3% 2.4% 0.7% 0.8% 51.1% 51.2% 50.4% 52.7% 28.7% 30.3% 30.6% 30.7% 6.5% 6.2% 6.8% 6.1% 10.0% 9.5% 11.0% 9.4%
3.3% 3.7% 4.7% 4.1% 1.1% 1.1% 0.7% 0.7% 66.2% 66.6% 65.1% 66.5% 18.4% 19.1% 17.8% 17.3% 8.6% 7.4% 7.3% 6.9% 2.4% 2.1% 4.5% 4.4%
21.6% 20.6% 20.5% 20.0% 3.4% 2.9% 3.5% 3.2% 36.9% 39.0% 37.4% 38.3% 14.4% 15.2% 14.2% 14.4% 10.5% 8.7% 11.0% 9.9% 13.2% 13.7% 13.5% 14.2%
39.5% 36.9% 37.2% n.a. 5.5% 5.2% 6.5% n.a. 18.2% 19.0% 18.6% n.a. 20.1% 21.7% 22.6% n.a. 6.3% 6.5% 7.2% n.a. 10.5% 10.7% 7.8% n.a.
7.4% 7.8% 7.6% 7.5% 1.9% 2.2% 1.8% 1.9% 58.7% 59.5% 59.8% 60.4% 20.0% 19.2% 18.9% 18.1% 6.2% 5.4% 6.2% 6.3% 5.9% 5.9% 5.7% 5.8%
4.5% 4.2% 4.1% 4.1% 2.7% 2.7% 2.2% 2.0% 54.2% 54.8% 54.5% 53.9% 18.5% 18.8% 18.8% 19.0% 5.3% 4.9% 4.9% 5.3% 14.9% 14.6% 15.5% 15.8%
1.1% 1.0% 1.0% 1.4% 3.6% 3.5% 3.2% 3.1% 60.2% 59.5% 59.7% 59.1% 25.7% 27.0% 26.4% 27.0% 5.3% 5.5% 5.8% 5.5% 4.1% 3.5% 3.9% 3.9%
44.9% 44.7% 43.2% 43.9% 3.7% 2.5% 3.7% 3.3% 18.6% 20.0% 18.6% 19.2% 17.6% 18.4% 17.7% 18.2% 8.3% 7.3% 10.5% 10.1% 7.0% 7.2% 6.2% 5.4%
1.6% 1.3% 1.3% 1.6% 2.0% 1.8% 1.6% 1.5% 71.2% 71.6% 71.1% 69.5% 17.9% 18.3% 18.6% 17.4% 4.0% 3.9% 4.4% 4.6% 3.4% 3.1% 3.0% 5.3%
12.2% 12.0% 11.8% 12.0% 2.4% 2.1% 2.2% 2.2% 52.0% 52.5% 50.1% 49.6% 22.0% 22.7% 19.7% 18.6% 5.3% 4.0% 4.0% 3.8% 6.1% 6.6% 12.2% 13.8%
18.3% 18.1% 17.9% 17.6% 6.1% 5.3% 6.0% 5.8% 28.1% 28.6% 28.7% 29.3% 15.5% 15.7% 15.4% 15.5% 11.4% 10.9% 11.5% 11.4% 20.5% 21.4% 20.4% 20.4%
(1) Customer deposits include deposits from other financial institutions and general governments.(2) Also includes deposits from central banks.
T05_1 T05_1 T05_1 T05_1 T05_1 T04_2 T04_2 T04_2 T04_2 T05_2 T05_2 T05_2 T05_2 T05_3 T05_3 T05_3 T05_3 T05_4 T05_4 T05_4 T05_4202009 202012 202103 202106 202009 202012 202103 202106 202009 202012 202103 202106 202009 202012 202103 202106 202009 202012 202103 202106
T05_3
Volumes bn EUR % of debt securities issued Volumes bn EUR; % of total loan commitments
Sep-20 Dec-20 Mar-21 Jun-21 Sep-20 Dec-20 Mar-21 Jun-21 Sep-20 Dec-20 Mar-21 Jun-21 Sep-20 Dec-20 Mar-21 Jun-21 Sep-20 Dec-20 Mar-21 Jun-21636 647 685 691 AT 40.1% 38.9% 35.5% 35.8% AT 119 123 123 131 23.4% 23.0% 23.5% 23.7% 59.5% 59.7% 58.5% 58.9%
1,112 1,109 1,157 1,159 BE 23.0% 22.7% 21.6% 20.5% BE 157 161 164 162 18.6% 18.0% 19.0% 19.6% 57.7% 55.8% 56.3% 56.4%
30 32 33 33 BG 0.0% 0.0% 0.0% 0.0% BG 4 5 5 5 15.6% 14.6% 13.9% 13.9% 80.1% 81.7% 77.1% 78.7%
33 33 35 39 CY 0.0% 0.0% 0.0% 0.0% CY 3 3 3 3 33.3% 33.7% 34.4% 34.5% 65.2% 64.6% 63.9% 63.9%
158 156 170 177 CZ 3.4% 28.3% 23.5% 23.6% CZ 20 22 23 25 24.9% 23.8% 26.4% 29.5% 57.9% 57.8% 54.6% 52.7%
3,707 3,537 3,656 3,664 DE 30.9% 30.9% 30.5% 30.4% DE 634 646 653 663 17.7% 17.5% 17.9% 17.7% 61.0% 61.5% 60.7% 60.9%
754 772 769 751 DK 90.7% 90.7% 90.0% 90.7% DK 121 125 125 126 18.5% 18.9% 20.8% 21.1% 61.7% 62.3% 60.6% 60.6%
35 37 32 31 EE 48.8% 48.1% 41.6% 41.5% EE 3 3 3 3 18.0% 18.2% 22.6% 26.4% 71.8% 74.1% 73.7% 69.5%
3,257 3,259 3,318 3,276 ES 38.7% 36.8% 37.0% 35.4% ES 552 557 561 542 38.8% 38.6% 38.9% 39.6% 50.1% 50.7% 50.4% 49.5%
677 649 679 675 FI 48.8% 50.6% 47.6% 47.4% FI 120 121 121 123 31.8% 31.0% 33.6% 35.8% 55.1% 56.6% 54.0% 52.1%
7,966 7,800 8,102 8,111 FR 23.8% 24.0% 23.1% 22.5% FR 1,193 1,165 1,211 1,216 17.5% 17.5% 17.3% 17.7% 59.1% 59.0% 58.1% 57.9%
248 257 261 270 GR 55.8% 34.8% 31.1% 28.7% GR 22 23 22 23 29.1% 28.3% 29.6% 28.9% 69.5% 70.0% 68.7% 69.0%
40 41 42 43 HR 0.0% 0.0% 0.0% 0.0% HR 6 6 5 6 52.4% 55.2% 54.8% 55.5% 41.3% 39.3% 39.6% 39.0%
75 78 103 108 HU 57.0% 59.4% 65.6% 65.7% HU 13 13 16 17 17.8% 18.9% 18.0% 17.7% 64.8% 63.5% 65.3% 66.2%
247 254 275 288 IE 35.7% 35.5% 26.0% 23.9% IE 50 51 52 52 17.7% 16.9% 16.8% 17.0% 75.5% 76.4% 77.0% 76.6%
22 22 24 25 IS 66.4% 64.3% 65.7% 67.9% IS 2 2 2 2 16.4% 14.0% 14.3% 9.8% 75.1% 79.2% 79.0% 81.9%
2,395 2,439 2,560 2,612 IT 31.6% 30.3% 30.4% 30.1% IT 600 597 592 604 8.2% 8.2% 8.6% 8.6% 65.9% 67.9% 68.1% 67.6%
23 25 26 27 LT 0.0% 0.0% 0.0% 0.0% LT 2 2 2 2 19.1% 18.5% 20.9% 20.4% 78.9% 80.0% 77.6% 77.3%
203 161 168 171 LU 0.0% 0.0% 0.0% 0.0% LU 20 17 18 18 24.2% 26.2% 27.0% 27.7% 36.4% 42.9% 44.8% 43.7%
14 15 16 16 LV 0.0% 0.0% 0.0% 0.0% LV 1 2 1 1 24.8% 23.8% 28.8% 30.4% 59.4% 60.2% 65.8% 66.3%
21 21 22 22 MT 67.5% 71.7% 77.7% 74.8% MT 3 3 4 3 40.2% 39.8% 39.4% 38.9% 50.0% 47.5% 44.4% 47.0%
2,165 2,067 2,206 2,169 NL 22.3% 24.6% 23.1% 23.3% NL 369 367 365 371 17.6% 18.3% 18.6% 18.6% 63.2% 61.9% 61.7% 61.1%
272 276 296 n.a. NO 52.5% 55.7% 52.1% n.a. NO 62 64 67 n.a. 45.4% 43.9% 47.2% n.a. 47.3% 50.5% 47.6% n.a.
161 163 166 170 PL 48.4% 45.0% 44.3% 41.4% PL 28 29 29 30 22.1% 21.2% 21.6% 22.2% 70.2% 70.0% 70.9% 69.8%
324 325 261 270 PT 56.2% 54.1% 47.2% 45.3% PT 33 34 27 27 20.7% 21.5% 24.8% 25.2% 74.0% 72.2% 70.3% 68.7%
43 46 46 47 RO 0.0% 0.0% 0.0% 0.0% RO 7 7 7 7 18.2% 18.7% 19.3% 19.5% 65.4% 67.2% 66.7% 67.5%
890 884 958 973 SE 47.0% 47.6% 43.8% 43.8% SE 149 152 153 156 26.1% 25.0% 27.0% 29.1% 63.1% 64.1% 63.4% 61.5%
24 29 30 31 SI 0.0% 0.0% 0.0% 0.0% SI 3 3 4 4 32.7% 34.6% 36.5% 35.6% 59.0% 58.1% 55.4% 56.6%
49 51 55 57 SK 94.9% 91.5% 91.0% 85.8% SK 8 9 9 11 29.7% 25.2% 27.9% 21.9% 63.8% 68.3% 63.8% 63.6%
24,369 24,005 25,037 24,712 EU / EEA 37.1% 37.5% 36.2% 35.4% EU / EEA 4,113 4,113 4,200 4,134 20.7% 20.7% 21.3% 20.9% 59.7% 60.1% 59.0% 59.3%
* Norwegian banks have not implemented yet the reporting framework based on CRR2/CRD5. Therefore, Norwegian figures are included in the EBA Risk dashboard only until March 2021.
SK
EU/EEA
Individual country data includes subsidiaries, which are excluded from EU aggregate. For example, at country level the subsidiary in country X of a bank domiciled in country Y is included both in data for countries X and Y (for the latter as part of the consolidated entity). In the EU aggregate, only the consolidated entity domiciled in country Y is considered. The sample of banks is unbalanced and reviewed annually. Being an unbalanced sample, the number of reporting banks per country can display minor variations between quarters, which might accordingly affect quarterly changes in absolute and relative figures. As of Q1 2020 onwards UK banks are removed from the EU/EEA aggregate and subsidiaries of UK banks in EU member states are used instead.
NO*
PL
SE
RO
CY
CZ
DE
DK
SI
HR
EE
GR
PT
HU
IS
IT
LT
LU
LV
MT
NL
IE
ES
FI
FR
BE
BG
Share of loan commitments to HHs
Share of loan commitments to NFCs
AT
Contingent liabilities: loan commitmentsTotal liabilities Share of secured funding
Loan commitments: volume
SI
SK
EU/EEA
NO*
PL
PT
RO
SE
NL
GR
HR
HU
IE
IT
LT
LU
LV
MT
IS
FR
Other liabilities (2)
AT
BE
BG
CY
CZ
DE
DK
EE
ES
FI
Statistical Annex
Liability composition and volumes
Liabilities composition% of total liabilities Debt securities issued Deposits from credit institutions Customer deposits from HHs Customer deposits from NFCs Other customer deposits (1)

37
Sep-20 Dec-20 Mar-21 Jun-21 Sep-20 Dec-20 Mar-21 Jun-21 Sep-20 Dec-20 Mar-21 Jun-21 Sep-20 Dec-20 Mar-21 Jun-21 Sep-20 Dec-20 Mar-21 Jun-21 Sep-20 Dec-20 Mar-21 Jun-21AT 47.0 49.9 49.9 50.7 40% 38% 38% 37% 62% 61% 61% 63% -17% -16% -16% -16% 5% 7% 7% 6% 9% 10% 10% 9%
BE 72.1 76.9 77.3 77.8 49% 46% 46% 46% 65% 64% 64% 64% -4% -3% -3% -2% -16% -13% -14% -13% 6% 6% 6% 5%
BG 4.6 4.7 4.7 4.9 26% 25% 25% 24% 34% 34% 34% 35% 4% 5% 4% 4% 33% 33% 34% 34% 3% 3% 3% 3%
CY 3.6 3.6 3.6 3.5 63% 42% 43% 44% 14% 33% 34% 34% 3% 2% 3% 2% 10% 13% 11% 9% 10% 10% 10% 10%
CZ 11.8 12.6 12.5 13.2 19% 18% 18% 18% 77% 76% 76% 77% 1% 1% 0% 0% -2% 0% 0% 0% 5% 5% 5% 5%
DE 193.2 200.0 199.5 205.9 59% 55% 55% 53% 29% 30% 31% 31% -1% -1% -1% -1% 5% 8% 8% 9% 8% 8% 8% 8%
DK 37.8 39.3 39.6 40.9 4% 3% 4% 3% 78% 80% 79% 78% 0% 0% 0% 0% 10% 8% 9% 9% 8% 9% 9% 10%
EE 4.4 4.5 4.3 4.3 8% 8% 6% 6% 59% 60% 61% 61% 0% 0% 0% 0% 32% 31% 33% 33% 1% 1% 0% 0%
ES 192.1 199.7 199.9 200.7 67% 65% 64% 63% 55% 54% 58% 59% -26% -25% -25% -25% -7% -4% -8% -8% 11% 11% 11% 11%
FI 41.1 43.2 42.5 42.8 18% 17% 17% 17% 82% 81% 81% 82% -3% -2% -2% -2% -4% -2% -3% -3% 7% 7% 7% 6%
FR 419.6 438.9 438.4 445.0 34% 33% 33% 32% 34% 35% 33% 34% 0% 0% 0% 1% 27% 27% 28% 27% 6% 6% 6% 6%
GR 24.4 25.1 22.7 20.0 224% 217% 242% 281% -178% -175% -199% -246% 0% 0% -1% -2% 55% 58% 58% 63% 0% 0% 0% 3%
HR 6.0 6.3 6.2 6.3 37% 35% 35% 35% 58% 58% 58% 59% 2% 3% 3% 2% 3% 4% 4% 4% 0% 0% 0% 0%
HU 7.8 8.4 10.2 10.8 3% 3% 18% 19% 92% 90% 82% 82% 2% 2% 1% -1% 2% 5% -1% 0% 0% 0% 0% 0%
IE 44.3 45.9 46.8 47.1 38% 39% 39% 39% 70% 67% 66% 66% -5% -5% -5% -5% -9% -6% -7% -6% 6% 6% 6% 6%
IS 3.7 4.0 4.2 4.3 42% 42% 40% 39% 51% 55% 54% 56% 1% 0% 0% 1% 4% 1% 4% 2% 2% 2% 2% 2%
IT 169.3 171.7 173.1 172.1 54% 54% 54% 52% 34% 32% 35% 36% -3% -3% -2% -2% 6% 8% 5% 6% 9% 9% 9% 8%
LT 1.9 2.1 2.1 2.1 51% 46% 46% 47% 32% 38% 36% 36% 0% 0% 0% 0% 16% 18% 18% 0% 0% 0% 0%
LU 20.4 20.8 21.2 21.6 51% 50% 50% 49% 45% 44% 46% 44% 1% 3% 3% 5% 1% 2% 0% 2% 1% 1% 1% 1%
LV 1.5 1.6 1.6 1.6 58% 54% 54% 54% 45% 49% 48% 49% 0% 0% 0% 0% -4% -3% -3% -3% 0% 0% 0% 0%
MT 1.7 1.8 1.6 1.6 57% 56% 51% 51% 39% 36% 41% 42% 2% 3% 3% 2% 2% 5% 6% 5% 0% 0% 0% 0%
NL 123.7 123.7 128.3 129.8 34% 35% 36% 36% 59% 59% 57% 59% 0% -1% 0% -1% -3% -3% -4% -4% 11% 11% 11% 10%
NO* 20.8 23.2 24.3 n.a. 22% 21% 21% n.a. 71% 72% 73% n.a. 3% 2% 1% n.a. -4% -4% -4% n.a. 9% 9% 9% n.a.
PL 19.1 19.2 18.8 19.1 23% 22% 22% 23% 12% 10% 9% 12% 5% 5% 4% 3% 60% 63% 64% 63% 0% 0% 0% 0%
PT 26.4 27.0 20.9 21.5 63% 61% 55% 54% 23% 24% 28% 27% -16% -16% -17% -15% 22% 23% 27% 27% 8% 7% 7% 7%
RO 5.0 5.7 5.5 5.5 46% 42% 43% 43% 35% 40% 40% 36% 3% 3% 3% 3% 16% 14% 14% 18% 0% 0% 0% 0%
SE 47.6 52.2 52.6 53.8 17% 17% 16% 16% 69% 70% 70% 69% 2% 2% 4% 5% 4% 4% 2% 3% 8% 7% 8% 7%
SI 2.9 3.0 3.0 3.2 49% 46% 46% 44% 52% 52% 52% 55% 1% 1% 1% 1% -2% 0% 0% -1% 0% 0% 0% 0%
SK 4.1 4.2 4.4 4.4 24% 24% 23% 23% 67% 68% 68% 68% 1% 1% 1% 1% -2% -2% 0% -1% 10% 9% 9% 9%
EU/EEA 1,462.9 1,520.4 1,530.4 1,516.4 46% 44% 44% 44% 42% 42% 43% 43% -5% -5% -4% -4% 9% 11% 10% 10% 8% 8% 8% 7%
190001 190001 190001 190001T31_1 T31_1 T31_1 T31_1 T07_1 T07_1 T07_1 T07_1 T07_2 T07_2 T07_2 T07_2 T07_3 T07_3 T07_3 T07_3 T07_4 T07_4 T07_4 T07_4
202009 202012 202103 202106 202009 202012 202103 202106 202009 202012 202103 202106 202009 202012 202103 202106 202009 202012 202103 202106 202009 202012 202103 202106
Sep-20 Dec-20 Mar-21 Jun-21 Sep-20 Dec-20 Mar-21 Jun-21 Sep-20 Dec-20 Mar-21 Jun-21 Sep-20 Dec-20 Mar-21 Jun-21 Sep-20 Dec-20 Mar-21 Jun-21 Sep-20 Dec-20 Mar-21 Jun-21
AT 299.5 298.5 302.2 312.4 84.8% 84.4% 84.4% 84.9% 0.4% 0.5% 0.5% 0.4% 3.0% 3.1% 3.3% 3.5% 10.2% 10.3% 10.1% 9.8% 1.6% 1.7% 1.7% 1.4%
BE 398.6 400.1 403.4 393.0 82.4% 82.6% 82.8% 83.5% 0.7% 0.7% 0.9% 0.8% 1.8% 1.7% 1.7% 1.7% 8.9% 8.7% 8.6% 8.1% 6.2% 6.3% 6.0% 5.9%
BG 19.7 19.7 20.2 20.3 91.4% 91.5% 91.9% 91.8% 0.0% 0.0% 0.0% 0.0% 0.5% 0.6% 0.5% 0.6% 8.1% 7.9% 7.6% 7.6% 0.0% 0.0% 0.0% 0.0%
CY 19.2 19.3 19.2 18.8 86.1% 87.7% 87.8% 87.4% 0.7% 0.8% 0.8% 0.9% 0.4% 0.4% 0.2% 0.1% 12.7% 11.1% 11.2% 11.4% 0.0% 0.1% 0.1% 0.1%
CZ 51.8 53.2 52.8 55.2 83.2% 84.1% 84.4% 84.3% 0.4% 0.2% 0.2% 0.2% 2.5% 2.3% 2.3% 2.5% 12.4% 12.1% 11.8% 11.6% 1.5% 1.3% 1.3% 1.5%
DE 1,155.9 1,174.8 1,200.0 1,216.7 78.2% 77.0% 77.7% 78.4% 2.4% 2.4% 2.3% 2.2% 5.8% 6.8% 6.7% 6.1% 11.7% 11.5% 11.1% 11.1% 1.9% 2.2% 2.2% 2.3%
DK 188.3 190.8 193.9 198.1 82.0% 82.6% 82.7% 83.3% 0.2% 0.2% 0.2% 0.2% 7.4% 6.8% 7.0% 6.4% 8.8% 8.6% 8.4% 8.2% 1.6% 1.8% 1.8% 1.9%
EE 16.0 16.0 14.4 14.7 89.6% 89.4% 89.5% 89.7% 0.0% 0.0% 0.0% 0.0% 0.5% 0.4% 0.4% 0.5% 8.9% 9.0% 9.1% 8.9% 1.1% 1.1% 1.0% 0.9%
ES 1,366.4 1,381.1 1,388.0 1,368.0 86.0% 85.7% 86.5% 86.7% 0.7% 0.7% 0.7% 0.6% 2.9% 2.7% 2.7% 2.7% 9.4% 9.5% 9.4% 9.3% 1.0% 1.4% 0.8% 0.7%
FI 217.8 222.1 217.2 216.5 79.7% 80.9% 82.3% 81.9% 0.5% 0.4% 0.5% 0.5% 4.2% 3.5% 2.7% 2.6% 9.0% 8.8% 8.5% 8.5% 6.6% 6.4% 6.0% 6.5%
FR 2,569.5 2,588.6 2,615.0 2,646.8 84.6% 85.1% 85.1% 85.6% 1.4% 1.4% 1.3% 1.3% 3.1% 2.8% 2.9% 2.6% 10.2% 10.0% 9.9% 9.5% 0.8% 0.8% 0.8% 0.9%
GR 165.4 165.3 163.8 153.0 89.3% 89.5% 89.1% 87.9% 0.7% 0.7% 0.7% 1.0% 2.4% 2.5% 2.8% 3.2% 7.4% 7.1% 7.2% 7.7% 0.2% 0.1% 0.1% 0.2%
HR 25.4 25.6 25.4 25.9 89.0% 89.2% 89.6% 89.8% 0.0% 0.0% 0.0% 0.0% 1.7% 1.7% 1.2% 1.1% 9.3% 9.0% 9.1% 9.1% 0.0% 0.0% 0.0% 0.1%
HU 51.7 52.0 62.2 65.6 88.5% 88.5% 88.4% 87.8% 0.0% 0.0% 0.0% 0.0% 1.3% 1.4% 0.9% 2.0% 10.1% 10.0% 10.6% 10.0% 0.1% 0.1% 0.1% 0.2%
IE 218.4 224.5 230.5 231.0 84.4% 85.3% 84.5% 84.5% 1.8% 1.8% 2.0% 1.9% 2.9% 2.6% 3.4% 3.2% 9.6% 9.2% 8.8% 8.8% 1.2% 1.1% 1.2% 1.6%
IS 17.1 17.9 19.1 19.1 88.5% 88.3% 88.5% 88.6% 0.0% 0.0% 0.0% 0.0% 1.7% 1.7% 1.6% 1.5% 9.7% 9.8% 9.7% 9.7% 0.1% 0.2% 0.2% 0.2%
IT 1,012.4 1,004.0 1,008.9 1,017.9 84.0% 83.4% 82.9% 84.0% 1.5% 1.8% 1.7% 1.8% 3.7% 3.8% 4.0% 3.3% 9.7% 9.9% 10.3% 10.2% 1.1% 1.1% 1.1% 0.7%
LT 8.7 9.0 8.9 9.3 88.9% 88.7% 88.6% 89.1% 0.0% 0.0% 0.0% 0.0% 0.4% 0.4% 0.5% 0.5% 8.3% 8.5% 8.6% 8.1% 2.4% 2.4% 2.3% 2.3%
LU 98.6 101.9 105.1 105.4 85.6% 86.5% 86.7% 86.7% 2.2% 2.2% 2.1% 2.1% 0.5% 0.4% 0.4% 0.4% 9.7% 8.9% 8.8% 8.5% 2.0% 2.1% 2.0% 2.3%
LV 6.0 5.9 6.6 6.5 88.5% 88.8% 90.1% 90.0% 0.0% 0.0% 0.0% 0.0% 0.5% 0.3% 0.3% 0.2% 11.0% 10.8% 9.6% 9.6% 0.0% 0.0% 0.0% 0.1%
MT 9.1 8.8 8.4 8.3 89.5% 89.4% 89.1% 88.9% 0.7% 0.9% 1.2% 1.2% 0.3% 0.1% 0.0% 0.0% 9.5% 9.6% 9.7% 9.9% 0.0% 0.0% 0.0% 0.0%
NL 643.4 648.9 679.7 677.5 78.6% 78.5% 79.2% 79.0% 0.9% 0.9% 0.9% 0.9% 2.2% 2.2% 2.2% 2.1% 13.7% 13.2% 12.8% 12.3% 4.6% 5.2% 5.0% 5.7%
NO* 104.6 109.3 113.6 n.a. 89.1% 88.5% 88.5% n.a. 0.0% 0.0% 0.0% n.a. 0.9% 0.9% 0.9% n.a. 9.3% 9.9% 10.0% n.a. 0.7% 0.7% 0.6% n.a.
PL 109.1 110.1 108.4 108.4 89.8% 86.2% 86.0% 88.6% 0.0% 0.0% 0.0% 0.0% 1.9% 4.7% 4.1% 1.3% 8.1% 8.9% 9.7% 9.8% 0.2% 0.2% 0.2% 0.2%
PT 171.3 170.2 133.2 135.0 86.4% 86.8% 86.1% 85.4% 0.5% 0.5% 0.5% 0.4% 3.3% 3.1% 3.8% 4.3% 8.4% 8.3% 8.4% 8.3% 1.4% 1.3% 1.2% 1.6%
RO 25.2 25.4 25.1 25.7 77.4% 75.9% 72.9% 72.9% 0.0% 0.0% 0.0% 0.0% 7.2% 9.0% 11.5% 11.7% 15.3% 15.0% 15.4% 15.0% 0.1% 0.2% 0.2% 0.4%
SE 235.4 247.9 250.2 249.9 61.1% 59.0% 60.6% 60.3% 0.1% 0.1% 0.1% 0.1% 2.5% 2.5% 3.3% 2.7% 8.7% 8.7% 8.5% 8.3% 27.6% 29.7% 27.5% 28.7%
SI 16.2 19.7 19.9 20.3 86.4% 85.2% 84.9% 85.9% 0.0% 0.0% 0.0% 0.0% 3.4% 6.4% 6.9% 6.1% 10.2% 8.4% 8.2% 8.0% 0.0% 0.0% 0.0% 0.0%
SK 23.6 24.0 23.9 23.6 90.2% 90.8% 91.4% 90.6% 0.0% 0.0% 0.0% 0.4% 0.7% 0.6% 0.3% 0.6% 8.5% 8.0% 7.9% 8.2% 0.5% 0.5% 0.4% 0.2%
EU/EEA 8,749.6 8,841.2 8,975.5 8,877.7 82.8% 82.6% 82.8% 83.2% 1.2% 1.2% 1.2% 1.2% 3.5% 3.5% 3.6% 3.3% 10.2% 10.1% 10.0% 9.8% 2.4% 2.6% 2.4% 2.5%
* Norwegian banks have not implemented yet the reporting framework based on CRR2/CRD5. Therefore, Norwegian figures are included in the EBA Risk dashboard only until March 2021.
Statistical Annex
Composition of own funds and risk-weighted assets
Composition of own funds (Tier 1 capital)
Volumes bn EUR; %
Own funds (Tier 1 capital) volume
Capital instruments eligible as CET1 Capital
Retained earnings Accumulated other comprehensive income
Other CET1 components
Individual country data includes subsidiaries, which are excluded from EU aggregate. For example, at country level the subsidiary in country X of a bank domiciled in country Y is included both in data for countries X and Y (for the latter as part of the consolidated entity). In the EU aggregate, only the consolidated entity domiciled in country Y is considered. The sample of banks is unbalanced and reviewed annually. Being an unbalanced sample, the number of reporting banks per country can display minor variations between quarters, which might accordingly affect quarterly changes in absolute and relative figures. As of Q1 2020 onwards UK banks are removed from the EU/EEA aggregate and subsidiaries of UK banks in EU member states are used instead.
Additional Tier 1 capital
RWA compositionVolumes bn EUR;
% RWA volume Credit risk capital requirements (excl. securitisation)
Securitisation capital requirements
Market risk capital requirements Operational risk capital requirements
Other capital requirements

38
%
Sep-20 Dec-20 Mar-21 Jun-21 Sep-20 Dec-20 Mar-21 Jun-21 Sep-20 Dec-20 Mar-21 Jun-21 Sep-20 Dec-20 Mar-21 Jun-21 Sep-20 Dec-20 Mar-21 Jun-21
AT 4.4% 4.6% 6.6% 8.7% 19.9% 19.4% 18.1% 18.4% 9.1% 9.2% 9.2% 9.5% 1.4% 0.4% 1.7% -0.4% -0.5% 1.0% 0.1% 1.9%
BE 3.6% 4.7% 4.5% 7.0% 16.3% 16.1% 15.7% 15.8% 5.5% 5.6% 6.0% 6.1% -0.6% -0.2% 1.5% 1.2% 3.3% 3.1% 2.5% -0.1%
BG 6.1% 5.8% 8.9% 10.8% 18.5% 18.3% 17.1% 17.0% 7.7% 7.8% 7.7% 8.0% 1.8% 1.0% 2.7% 1.6% 0.3% 1.4% 0.4% 1.5%
CY -4.8% -4.4% 2.2% 0.3% 19.9% 20.0% 18.9% 18.8% 6.7% 6.9% 7.4% 7.9% 0.1% 0.2% 0.0% 0.0% 1.8% 2.6% 1.7% 1.5%
CZ 7.4% 7.4% 8.0% 9.8% 21.3% 21.1% 18.9% 18.9% 5.7% 5.8% 5.9% 5.9% -1.8% -0.5% 3.5% 2.9% 3.5% 2.5% -0.7% -0.4%
DE 1.4% 0.5% 4.7% 4.1% 15.0% 14.8% 14.8% 14.4% 9.4% 9.6% 11.0% 10.9% 1.7% 1.8% 4.3% 3.3% 1.4% 1.5% 1.7% 1.2%
DK 3.5% 4.1% 8.7% 8.1% 14.2% 14.0% 13.3% 13.5% 4.8% 5.1% 6.0% 5.7% 0.0% 0.6% 2.9% 2.0% 2.3% 2.4% 2.3% 2.6%
EE 7.2% 7.3% 6.6% 7.9% 13.2% 13.7% 12.6% 12.9% 4.5% 4.8% 4.3% 4.4% 0.6% 0.4% 1.2% 1.4% 2.9% 2.3% 0.5% 0.4%
ES -3.4% -3.9% 16.2% 11.9% 27.0% 25.4% 26.9% 27.6% 9.5% 8.9% 10.0% 10.4% 3.2% 2.0% 3.5% 1.3% -0.5% 0.6% 0.0% 1.8%
FI 5.9% 6.0% 8.1% 9.0% 13.5% 13.3% 13.4% 13.3% 6.9% 6.9% 7.7% 7.6% 2.9% 2.0% 4.4% 2.9% -0.4% 0.5% -0.6% 0.4%
FR 4.3% 4.3% 5.3% 7.3% 14.2% 14.0% 13.8% 13.8% 10.2% 10.3% 10.5% 10.5% 1.8% 2.8% 5.0% 3.6% 1.7% 1.0% 0.6% 2.2%
GR -3.1% -6.5% -1.0% -32.7% 20.0% 20.5% 21.7% 22.7% 4.3% 4.5% 4.7% 5.4% -0.1% 0.3% 5.0% 3.1% 8.5% 9.5% 10.9% -11.8%
HR 6.1% 5.2% 7.3% 8.3% 16.3% 16.1% 15.0% 14.9% 6.9% 7.0% 6.4% 6.8% 1.5% 1.0% 2.7% 1.6% 0.7% 0.7% -0.4% 0.9%
HU 9.7% 9.8% 13.9% 15.4% 28.2% 27.8% 28.0% 28.5% 14.7% 14.9% 14.3% 15.0% -0.3% 0.0% 3.2% 2.4% 3.4% 2.7% 1.2% 1.0%
IE -4.5% -3.2% 6.0% 6.7% 13.3% 13.3% 13.1% 13.1% 4.7% 4.7% 4.9% 5.2% 1.0% 1.0% 1.5% 0.9% 1.5% 1.8% 1.7% 2.1%
IS 2.1% 4.4% 11.1% 11.8% 15.0% 15.2% 15.5% 16.2% 4.3% 4.4% 5.3% 5.4% -0.3% 1.0% 2.6% 2.5% 0.9% 0.8% 1.0% 1.1%
IT 3.8% 0.4% 8.7% 8.3% 15.3% 15.5% 14.8% 14.9% 11.5% 12.1% 13.5% 13.6% 1.0% 0.8% 2.4% 1.7% 3.2% 3.0% 4.9% 3.9%
LT 11.6% 11.2% 10.3% 11.1% 17.0% 16.3% 13.7% 14.0% 8.7% 8.8% 8.0% 8.4% 1.1% 1.2% 2.4% 1.9% 1.3% 1.4% -0.2% 0.5%
LU 5.8% 5.8% 4.1% 6.5% 13.4% 13.1% 12.4% 12.6% 8.4% 8.4% 8.4% 8.6% 0.7% 0.9% 1.3% -0.1% 2.5% 2.4% 1.5% 4.1%
LV 5.6% 7.1% 8.4% 11.4% 15.6% 15.2% 16.1% 16.3% 8.5% 8.4% 8.4% 8.5% -0.8% -0.5% 3.0% 2.0% 0.4% 1.8% -0.9% 0.4%
MT -0.7% -3.0% 3.1% 3.5% 16.8% 16.8% 16.6% 16.7% 5.0% 5.2% 5.4% 5.5% 0.3% 0.7% 0.4% 0.5% 0.5% 0.5% 0.6% 0.7%
NL 3.1% 3.2% 7.2% 8.5% 23.5% 23.3% 22.7% 21.8% 5.0% 5.1% 5.5% 5.5% 0.3% 0.1% 2.3% 1.4% 1.5% 1.5% 1.7% 2.2%
NO* 7.2% 7.4% 10.2% n.a. 16.4% 16.7% 16.9% n.a. 2.9% 3.1% 3.7% n.a. 2.2% 1.8% 1.7% n.a. 1.2% 1.1% 0.7% n.a.
PL 5.5% -0.2% 6.7% 7.8% 21.9% 22.3% 21.0% 21.5% 8.2% 8.5% 9.2% 9.4% -0.8% -0.6% 5.1% 2.4% 1.2% -4.7% -3.2% 0.1%
PT 1.0% -0.2% 3.6% 4.1% 16.0% 16.1% 16.0% 16.1% 7.6% 7.8% 7.8% 8.1% -1.6% -1.7% 2.2% 1.3% 2.6% 2.6% 2.2% 2.4%
RO 12.8% 11.4% 17.1% 15.3% 27.0% 26.5% 24.4% 24.3% 7.6% 7.7% 7.5% 7.8% 1.7% 1.7% 2.3% 2.2% 3.9% 4.3% 3.8% 4.0%
SE 7.9% 8.9% 11.1% 11.8% 18.6% 18.7% 17.2% 17.4% 6.7% 6.9% 6.8% 7.1% 1.2% 0.8% 2.8% 1.5% 0.7% 1.4% 0.1% 0.8%
SI 16.2% 16.6% 9.3% 11.6% 17.5% 16.7% 17.0% 17.0% 8.9% 8.6% 9.4% 9.8% 0.7% 0.9% 1.8% 2.5% 1.7% 1.4% -0.3% 0.9%
SK 6.0% 6.4% 7.2% 9.5% 22.2% 21.9% 20.0% 20.2% 8.7% 8.9% 8.8% 9.2% 0.5% 0.6% 0.5% 0.4% 0.5% 0.5% 0.7% 0.6%
EU/EEA 2.5% 1.9% 7.7% 7.4% 17.7% 17.4% 17.1% 17.1% 8.9% 9.0% 9.7% 9.8% 1.5% 1.6% 3.7% 2.4% 1.5% 1.5% 1.4% 1.8%
T29_1 T29_1 T29_1 T29_1 T29_2 T29_2 T29_2 T29_2 T29_3 T29_3 T29_3 T29_3 T29_4 T29_4 T29_4 T29_4 T29_5 T29_5 T29_5 T29_5
%
Sep-20 Dec-20 Mar-21 Jun-21 Sep-20 Dec-20 Mar-21 Jun-21 Sep-20 Dec-20 Mar-21 Jun-21 Sep-20 Dec-20 Mar-21 Jun-21 Sep-20 Dec-20 Mar-21 Jun-21
AT 10.0% 9.9% 9.3% 9.3% 7.8% 7.9% 7.3% 7.2% 0.5% 0.6% 1.6% 0.7% 4.2% 4.7% 0.9% 0.9% 2.9% 2.4% 3.3% 2.8%
BE 7.7% 7.7% 7.4% 6.8% 6.5% 6.3% 7.5% 6.1% 0.1% 0.3% 1.3% 0.0% 4.1% 3.5% 0.7% 0.2% 2.4% 2.0% 4.4% 2.9%
BG 5.9% 6.0% 5.7% 5.7% 6.6% 6.7% 5.9% 5.9% 0.0% -0.1% -0.1% -0.2% 6.5% 7.3% 3.6% 3.4% 3.2% 2.8% 3.9% 2.6%
CY 10.7% 10.3% 10.8% 10.8% 7.6% 8.9% 8.7% 8.9% 0.6% 0.7% 0.4% 0.7% 10.5% 10.5% 3.5% 4.7% 4.1% 3.7% 2.5% 2.8%
CZ 7.3% 7.3% 7.1% 7.2% 6.4% 6.6% 6.2% 6.4% 0.3% 0.4% 1.2% 0.0% 4.5% 4.6% 1.0% 0.0% 3.0% 2.6% 4.1% 4.0%
DE 10.4% 10.5% 10.4% 10.3% 9.7% 9.9% 9.5% 9.4% 0.5% 1.0% 1.5% 1.4% 3.1% 3.2% 0.5% 0.5% 2.3% 2.7% 5.1% 4.1%
DK 7.6% 7.8% 7.8% 7.7% 6.7% 6.8% 5.8% 5.9% 0.5% 0.3% 0.6% -0.1% 2.5% 2.2% -0.4% 0.1% 0.6% 0.9% 2.0% 1.9%
EE 5.2% 5.5% 5.3% 5.2% 5.2% 5.4% 5.3% 5.2% 0.2% 0.2% 0.3% 0.1% 2.1% 2.3% 1.2% 0.5% 1.2% 0.5% -0.1% 0.2%
ES 10.4% 9.8% 10.4% 12.4% 9.0% 8.5% 8.9% 9.1% 1.2% 1.7% 2.3% 2.7% 10.9% 9.7% 7.2% 6.4% 11.1% 11.2% -4.7% -1.4%
FI 7.1% 7.0% 6.9% 7.0% 5.1% 5.3% 4.8% 4.7% 0.4% 0.4% 0.0% -0.1% 2.6% 2.2% 0.8% 0.4% 1.5% 1.9% 4.3% 3.3%
FR 11.0% 11.2% 11.2% 11.3% 8.6% 8.5% 9.0% 8.1% 0.2% 0.3% 1.0% 0.2% 3.6% 3.8% 1.8% 1.7% 0.2% 0.2% 1.6% 1.5%
GR 6.6% 7.5% 8.2% 8.1% 6.1% 6.5% 6.8% 7.1% 1.1% 1.2% 0.3% 0.2% 19.3% 20.6% 24.6% 34.1% 2.6% 5.6% 3.4% 2.6%
HR 6.0% 6.0% 5.8% 5.8% 6.1% 6.0% 5.8% 5.9% 0.3% 0.8% 1.1% 0.5% 4.5% 4.6% 1.4% 1.3% 2.3% 2.2% 2.1% 2.4%
HU 10.8% 10.6% 10.9% 11.0% 14.6% 14.5% 17.4% 15.8% 1.5% 0.6% -0.2% 0.4% 6.8% 6.6% 0.9% 0.5% 2.6% 3.3% 3.8% 3.7%
IE 6.9% 7.0% 7.1% 7.1% 6.2% 6.8% 6.3% 6.9% 2.0% 1.7% 1.8% 0.3% 10.1% 8.7% -0.7% -1.3% -0.2% -0.2% 0.8% 1.5%
IS 5.7% 5.9% 6.7% 6.8% 4.5% 4.7% 4.8% 4.6% 0.1% 0.1% 0.2% 0.1% 5.1% 3.9% -1.9% -1.6% 2.3% 2.5% 3.5% 3.6%
IT 11.8% 12.8% 11.2% 11.2% 8.3% 8.9% 8.8% 8.8% 1.1% 1.4% 0.4% 0.4% 6.2% 7.5% 3.5% 3.5% -0.3% 0.4% 3.0% 1.9%
LT 6.4% 6.5% 6.1% 6.0% 4.9% 5.1% 4.6% 4.6% 0.1% 0.1% 0.0% -0.1% 1.6% 1.4% -0.2% -0.1% 3.7% 3.5% 3.0% 3.3%
LU 9.1% 9.3% 9.1% 9.1% 6.8% 6.8% 6.9% 6.9% -0.1% 0.0% 0.6% 0.0% 1.6% 1.4% 0.6% 0.7% 1.7% 1.5% 2.4% 2.0%
LV 8.0% 8.0% 8.1% 8.2% 6.4% 6.4% 6.1% 6.1% 0.2% 0.2% 1.0% 0.4% 2.2% 1.8% 2.0% -0.2% 1.3% 1.5% 1.0% 1.4%
MT 8.0% 8.0% 8.1% 7.9% 8.4% 8.5% 10.8% 10.6% 0.0% 0.1% -0.1% 0.0% 5.3% 8.6% -0.8% -0.6% 1.6% 1.1% 1.8% 1.8%
NL 10.4% 10.4% 10.4% 10.4% 6.3% 6.7% 8.2% 7.1% 0.4% 0.5% 0.4% 0.4% 6.4% 5.4% 0.4% -0.5% 3.8% 3.7% 5.6% 4.9%
NO* 5.2% 5.6% 6.2% n.a. 3.7% 3.9% 4.0% n.a. 0.3% 0.1% -0.1% n.a. 4.8% 4.4% 0.2% n.a. 1.4% 1.3% 2.6% n.a.
PL 6.5% 6.7% 6.8% 7.0% 8.0% 8.2% 8.6% 8.7% 1.6% 1.9% 2.1% 2.4% 4.6% 5.2% 3.3% 3.3% 4.4% 3.6% 4.7% 4.3%
PT 7.7% 7.8% 7.5% 6.7% 5.4% 5.5% 4.9% 4.9% 0.4% 1.7% 4.9% 4.6% 7.3% 7.2% 4.5% 3.5% 2.7% 2.9% 2.8% 4.1%
RO 10.0% 9.7% 9.5% 9.3% 8.9% 9.1% 8.2% 8.3% -0.3% 0.5% -0.4% -0.3% 5.4% 6.1% -0.5% 1.8% 3.4% 3.5% 4.1% 3.9%
SE 8.2% 8.3% 7.7% 7.5% 5.4% 5.4% 4.5% 4.3% 0.5% 0.3% 0.3% -0.5% 2.4% 2.2% 0.5% 0.2% 2.8% 2.7% 2.8% 3.5%
SI 9.6% 9.2% 9.8% 9.7% 7.6% 7.5% 7.2% 7.4% 0.3% 0.5% -0.4% 0.3% 3.7% 3.6% -0.7% -1.7% -8.6% -9.8% 2.7% 2.9%
SK 9.0% 9.0% 8.1% 8.0% 9.7% 9.0% 6.7% 6.7% -0.1% 0.0% 0.6% 0.2% 5.3% 4.8% 2.7% 2.0% 2.1% 2.8% 4.6% 4.1%
EU/EEA 10.1% 10.2% 10.2% 10.5% 8.0% 8.1% 8.3% 8.0% 0.6% 0.8% 1.0% 0.8% 5.6% 5.5% 2.5% 2.4% 2.7% 2.8% 2.2% 2.2%
* Norwegian banks have not implemented yet the reporting framework based on CRR2/CRD5. Therefore, Norwegian figures are included in the EBA Risk dashboard only until March 2021.
Individual country data includes subsidiaries, which are excluded from EU aggregate. For example, at country level the subsidiary in country X of a bank domiciled in country Y is included both in data for countries X and Y (for the latter as part of the consolidated entity). In the EU aggregate, only the consolidated entity domiciled in country Y is considered. The sample of banks is unbalanced and reviewed annually. Being an unbalanced sample, the number of reporting banks per country can display minor variations between quarters, which might accordingly affect quarterly changes in absolute and relative figures. As of Q1 2020 onwards UK banks are removed from the EU/EEA aggregate and subsidiaries of UK banks in EU member states are used instead.Other expenses include for instance taxes, extraordinary effects, impact from discontinued operations, impairment or (-) reversal of impairment on non-financial assets. These expenses are shown with a positive sign (like in the columns to the left). In case there are effects resulting in negative expenses (i.e. a positive income) they have a negative sign.
Components of RoE: expenses, costs, provisions, impairments
Staff expenses / equity Other admin. (incl. depreciation) expenses / equity
Provisions / equity Impairments (credit risk losses) / equity
Other (incl. tax) / equity
Statistical Annex
Profitability analysis: main drivers within RoE
Components of RoE: revenue side
RoE(Return on Equity)
Net interest income / equity Net fee & commission income / equity
Net trading income (incl. FV result) / equity
Other operating income / equity

39
Sep-20 Dec-20 Mar-21 Jun-21 Sep-20 Dec-20 Mar-21 Jun-21 Sep-20 Dec-20 Mar-21 Jun-21 Sep-20 Dec-20 Mar-21 Jun-21 Sep-20 Dec-20 Mar-21 Jun-21 Sep-20 Dec-20 Mar-21 Jun-21AT 22.7 9.1 2.4 1.0 50.2% 51.1% 36.5% 50.4% 48.6% 48.3% 63.4% 49.6% 38.3% 42.4% 48.9% 48.3% 2.8% 3.9% 4.6% 10.2% 49.1% 42.2% 50.3% 48.0%
BE 25.9 8.3 4.1 1.6 37.3% 21.7% 22.8% 8.3% 60.2% 75.4% 75.4% 90.7% 32.3% 25.0% 41.0% 43.0% 1.7% 2.8% 7.2% 4.6% 15.1% 14.9% 11.9% 22.1%
BG 1.5 0.3 0.5 0.3 26.9% 27.7% 19.4% 19.7% 71.5% 70.5% 78.8% 75.3% 25.0% 32.5% 17.8% 8.4% 3.4% 4.6% 8.6% 3.1% 41.7% 50.6% 20.3% 33.6%
CY 9.3 9.2 0.0 0.0 39.0% 39.2% 68.7% 69.1% 58.1% 57.9% 31.3% 30.9% 24.4% 23.8% 38.6% 33.4% 6.0% 6.5% 7.8% 6.6% 24.0% 25.6% 29.0% 25.0%
CZ
DE 9.3 2.8 2.4 1.0 47.2% 41.2% 14.1% 17.7% 51.2% 58.1% 84.3% 79.4% 19.1% 25.8% 31.6% 47.8% 2.1% 6.5% 5.0% 9.9% 22.2% 13.7% 11.6% 13.7%
DK - - - - - - - - - - - - - - - - - - - -
EE 0.7 0.2 0.1 0.0 57.1% 68.8% 98.6% 93.9% 42.4% 31.2% 1.4% 6.1% 24.9% 35.4% 19.9% 19.4% 0.8% 1.8% 0.1% 0.1% 22.5% 24.5% 12.5% 8.0%
ES 83.8 57.9 47.7 22.2 72.5% 77.4% 75.7% 57.7% 27.3% 22.4% 24.2% 42.1% 17.9% 26.0% 28.2% 26.2% 3.9% 5.1% 5.6% 7.6% 22.6% 24.1% 23.4% 28.1%
FI 15.0 7.3 7.6 7.7 72.6% 100.0% 100.0% 100.0% 27.4% 0.0% 0.0% 0.0% 7.3% 1.7% 2.0% 2.3% 1.0% 0.2% 0.2% 0.2% 17.0% 4.5% 4.7% 4.0%
FR 131.2 41.4 16.8 7.1 13.6% 19.9% 27.2% 18.1% 85.2% 78.1% 68.3% 80.7% 12.8% 25.4% 25.8% 33.9% 1.6% 2.5% 3.5% 4.6% 26.1% 19.3% 25.3% 31.1%
GR 22.2 4.1 2.2 1.4 43.3% 7.7% 12.5% 8.7% 55.5% 87.9% 87.5% 91.3% 32.0% 27.9% 38.7% 41.7% 17.5% 7.0% 14.1% 15.6% 24.1% 25.6% 12.3% 10.6%
HR 3.8 2.6 2.2 1.4 18.5% 10.1% 8.3% 2.1% 52.1% 48.1% 41.2% 26.5% 29.5% 31.8% 25.6% 13.8% 2.7% 2.8% 2.1% 2.5% 41.9% 40.3% 49.6% 49.9%
HU 13.8 8.8 1.3 0.9 53.4% 56.1% 49.7% 54.7% 44.7% 41.8% 46.6% 45.3% 16.6% 28.1% 39.9% 30.1% 3.0% 4.5% 6.9% 6.5% 40.9% 39.8% 29.2% 35.7%
IE 9.0 1.8 1.1 0.5 48.3% 37.2% 36.0% 30.2% 50.8% 61.9% 62.4% 69.8% 35.4% 65.2% 56.7% 74.6% 7.8% 6.1% 6.1% 3.7% 18.7% 19.8% 18.3% 31.8%
IS 1.4 0.0 0.0 0.0 21.1% 59.1% 100.0% 100.0% 77.6% 40.9% - - 38.0% 79.1% 85.6% - 1.1% 5.9% 14.4% - 18.8% 11.1% - -
IT 151.7 116.0 70.9 36.5 31.5% 26.3% 26.0% 17.2% 65.6% 70.4% 71.0% 78.6% 22.4% 33.8% 34.4% 46.7% 1.1% 1.5% 2.2% 3.1% 33.4% 37.5% 35.1% 37.4%
LT 0.3 0.1 0.1 0.0 54.5% 92.9% 95.9% 67.0% 45.4% 7.1% 4.1% 33.0% 29.2% 30.3% 31.9% 59.0% 0.0% 0.1% 0.4% - 12.4% 8.6% 7.0% -
LU 2.1 1.1 0.9 0.8 9.8% 7.1% 5.6% 0.0% 87.0% 91.1% 94.2% 99.9% 16.2% 16.9% 17.8% 52.2% 7.5% 4.6% 3.7% 3.5% 21.2% 59.3% 32.2% 20.3%
LV 0.2 0.1 0.1 0.0 71.5% 97.3% 99.6% 100.0% 28.5% 2.7% 0.4% - 31.5% 37.8% 40.0% 31.8% 0.2% 0.2% 0.2% - 14.6% 8.2% 6.3% -
MT 1.1 0.6 0.3 0.1 37.8% 24.1% 23.0% 34.1% 52.0% 55.6% 64.1% 59.8% 15.2% 41.6% 57.6% 24.8% 1.0% 5.7% 7.3% 27.5% 111.8% 40.1% 71.1% 89.1%
NL 36.7 1.7 1.5 0.7 22.0% 34.1% 41.7% 30.9% 76.8% 65.3% 58.1% 69.0% 29.1% 26.5% 41.2% 38.4% 2.4% 4.6% 13.1% 3.2% 19.0% 11.6% 6.2% 20.5%
NO
PL 6.6 1.4 0.8 0.3 39.0% 46.5% 33.4% 22.5% 61.0% 53.5% 66.6% 77.5% 20.8% 33.8% 36.9% 20.1% 1.9% 12.9% 15.8% 19.3% 28.6% 30.2% 31.5% 37.1%
PT 45.8 41.5 27.7 27.0 46.1% 45.2% 40.9% 37.7% 53.6% 54.5% 58.5% 61.8% 18.7% 25.2% 23.7% 26.8% 6.0% 7.3% 8.6% 8.6% 41.4% 42.9% 47.3% 49.5%
RO 1.9 0.0 0.1 0.0 40.9% 7.8% 79.3% 75.8% 56.1% 92.2% 20.7% 24.2% 39.7% 47.0% 54.0% 64.3% 10.8% 33.3% 13.0% 11.2% 56.6% 2.6% 27.9% 42.0%
SE 23.7 24.8 23.7 22.3 95.6% 99.9% 100.0% 100.0% 4.4% 0.1% 0.0% 0.0% 6.5% 4.7% 4.3% 3.7% 0.1% 0.1% 0.1% 0.1% 7.7% 7.0% 5.4% 12.0%
SI 1.6 0.9 0.8 0.2 43.1% 26.4% 27.3% 18.4% 56.3% 72.6% 71.5% 81.6% 19.9% 44.4% 46.0% 57.4% 3.7% 6.1% 5.5% 8.2% 46.9% 31.4% 36.5% 43.4%
SK 4.3 2.3 0.5 0.2 64.3% 73.5% 55.9% 63.6% 33.7% 26.5% 44.0% 36.3% 43.9% 47.5% 59.2% 57.4% 0.7% 0.9% 1.2% 0.5% 50.3% 45.8% 34.2% 53.4%
EU/EEA 585.8 317.5 202.1 123.4 39.6% 45.2% 50.8% 48.3% 58.9% 52.9% 47.5% 50.2% 20.3% 27.8% 27.2% 28.2% 2.9% 3.3% 3.9% 4.5% 27.9% 31.1% 31.3% 37.0%
102.71 190001 190001 190001 190001T91_1 T91_1 T91_1 T91_1 T91_2 T91_2 T91_2 T91_2 T91_3 T91_3 T91_3 T91_3 T91_4 T91_4 T91_4 T91_4 T91_5 T91_5 T91_5 T91_5 T91_6 T91_6 T91_6 T91_6
202009 202012 202103 202106 202009 202012 202103 202106 202009 202012 202103 202106 202009 202012 202103 202106 202009 202012 202103 202106 202009 202012 202103 202106
Sep-20 Dec-20 Mar-21 Jun-21 Sep-20 Dec-20 Mar-21 Jun-21 Sep-20 Dec-20 Mar-21 Jun-21 Sep-20 Dec-20 Mar-21 Jun-21 Sep-20 Dec-20 Mar-21 Jun-21 Sep-20 Dec-20 Mar-21 Jun-21
AT 14.0 24.4 29.1 28.5 53.7% 56.9% 55.8% 55.3% 44.6% 41.9% 43.0% 43.5% 36.4% 37.9% 38.6% 38.7% 1.8% 3.7% 4.5% 5.0% 29.4% 44.9% 280.9% 42.2%
BE 2.8 35.8 37.7 37.8 55.6% 38.9% 38.6% 38.8% 39.8% 58.0% 58.2% 58.2% 34.0% 21.9% 20.2% 18.8% 5.4% 2.0% 2.4% 3.1% 16.7% 11.6% 11.8% 10.8%
BG 0.8 1.9 1.9 2.0 33.2% 28.6% 28.5% 29.2% 65.8% 70.2% 70.5% 69.7% 33.2% 34.1% 32.6% 34.3% 2.4% 5.9% 6.5% 8.9% 55.5% 42.6% 58.3% 44.0%
CY - - 9.0 8.7 - - 39.0% 39.1% - - 58.0% 58.0% - - 30.6% 32.5% - - 6.8% 6.5% - - 26.3% 25.2%
CZ
DE 15.0 20.6 19.8 20.9 66.2% 62.3% 65.4% 61.8% 33.3% 36.7% 33.7% 36.4% 21.6% 22.3% 18.8% 20.8% 3.2% 4.1% 4.9% 4.8% 16.8% 17.9% 21.1% 23.4%
DK - - - - - - - - - - - - - - - - - - - -
EE 0.4 0.8 0.7 0.7 39.1% 47.3% 54.1% 61.5% 60.6% 51.5% 45.2% 37.9% 28.1% 23.4% 21.5% 19.4% 0.4% 1.0% 1.0% 1.4% 13.5% 13.3% 24.7% 22.3%
ES 105.8 127.3 136.3 147.4 81.8% 79.2% 80.4% 84.4% 18.1% 20.6% 19.5% 15.4% 17.9% 17.9% 22.5% 22.7% 2.8% 4.2% 5.8% 6.4% 35.4% 41.8% 34.8% 32.0%
FI 3.6 0.1 0.1 0.0 57.3% 0.1% 0.1% 0.1% 42.7% 99.8% 99.8% 99.8% 13.3% - - - 0.9% - - - 15.6% - - -
FR 131.6 217.1 228.4 223.7 12.1% 11.6% 12.3% 13.0% 86.8% 86.9% 86.6% 85.6% 11.9% 13.5% 17.9% 18.8% 1.1% 1.7% 2.0% 2.3% 26.1% 27.9% 28.1% 29.1%
GR 5.4 23.4 25.4 24.1 67.2% 53.1% 49.0% 47.7% 32.7% 46.6% 50.1% 51.3% 32.5% 39.0% 39.5% 39.7% 28.0% 21.2% 21.2% 19.5% 23.0% 22.5% 24.7% 25.6%
HR 1.0 2.1 2.4 2.9 33.1% 36.4% 34.0% 31.0% 62.6% 60.5% 63.0% 63.4% - - - - - - - - - - - -
HU 1.3 1.3 12.8 13.7 57.7% 57.9% 57.5% 56.5% 41.7% 39.2% 40.2% 41.1% - - - - - - - - - - - -
IE 14.7 21.4 21.8 21.4 60.8% 57.9% 57.3% 57.3% 39.2% 41.8% 42.4% 42.4% 30.1% 35.0% 34.3% 45.7% 7.3% 11.6% 12.7% 13.5% 22.6% 20.2% 19.3% 20.0%
IS 1.3 1.5 1.5 2.5 32.8% 32.6% 32.8% 24.6% 66.6% 67.0% 66.8% 74.1% - - - - - - - - - - - -
IT 31.7 57.8 103.9 123.4 43.2% 48.7% 40.1% 40.4% 54.4% 49.0% 56.3% 56.5% 19.0% 25.7% 29.8% 30.2% 2.7% 2.9% 2.7% 2.8% 30.2% 35.4% 36.8% 35.3%
LT 0.1 0.3 0.3 0.3 50.5% 44.0% 47.2% 58.7% 49.5% 56.0% 52.8% 41.3% 28.1% 23.9% 27.1% 27.4% 0.5% 0.2% 0.4% 0.6% 16.3% 16.2% 10.9% 8.2%
LU 2.4 3.3 3.2 2.7 16.2% 16.0% 16.9% 11.8% 80.1% 79.9% 79.0% 85.3% 11.5% 12.5% 14.3% 4.1% 4.2% 4.8% 4.3% 3.4% 6.1% 7.9% 5.2% 4.6%
LV 0.1 0.2 0.2 0.3 31.2% 45.6% 47.9% 62.4% 68.8% 54.4% 52.1% 37.6% 18.1% 24.4% 26.7% 30.0% 0.4% 0.3% 0.4% 1.9% 19.0% 20.0% 25.4% 32.6%
MT 0.2 0.7 0.9 1.1 51.1% 53.5% 43.9% 39.7% 44.8% 35.5% 38.6% 41.2% 9.1% 14.1% 15.4% 26.5% 4.1% 1.2% 1.6% 2.9% 62.3% 40.2% 37.8% 17.7%
NL 14.5 46.9 45.3 43.7 24.4% 22.4% 22.2% 22.7% 73.0% 75.9% 76.1% 75.7% 13.5% 25.6% 24.2% 22.9% 1.7% 3.8% 4.7% 5.5% 17.0% 16.5% 16.2% 15.2%
NO
PL 9.2 14.0 13.5 13.4 62.2% 52.5% 52.3% 53.7% 37.8% 47.5% 46.5% 45.2% 19.9% 39.8% 39.2% 42.3% 1.9% 2.6% 4.6% 5.7% 35.6% 34.4% 32.0% 35.0%
PT 1.7 5.2 7.8 9.8 54.3% 58.5% 72.7% 66.8% 45.7% 41.5% 27.1% 32.8% 11.6% 9.7% 11.4% 18.4% 3.3% 2.8% 3.6% 4.2% 31.1% 33.5% 33.6% 41.5%
RO 1.4 3.2 2.9 2.7 80.6% 57.6% 57.8% 60.0% 19.0% 40.5% 40.7% 38.6% 35.5% 50.6% 50.0% 48.3% 3.1% 9.6% 10.9% 12.4% 49.5% 60.4% 61.0% 59.2%
SE 0.9 3.2 5.2 6.8 47.6% 57.1% 76.8% 84.4% 52.4% 42.8% 23.1% 15.6% - - - - - - - - - - - -
SI 0.6 2.0 2.0 2.2 42.9% 60.6% 57.2% 54.0% 53.6% 38.7% 42.2% 45.5% 15.7% 8.3% 10.5% 16.8% 4.4% 4.1% 5.6% 5.9% 41.6% 37.5% 36.0% 40.5%
SK 0.8 2.3 3.6 3.7 56.6% 68.8% 80.9% 78.5% 42.9% 31.0% 19.1% 21.5% 40.6% 45.4% 38.7% 39.0% 2.2% 2.1% 2.0% 2.8% 57.2% 53.3% 52.1% 54.1%
EU/EEA 350.7 579.1 674.2 702.0 45.6% 40.9% 41.1% 43.1% 53.5% 57.9% 57.5% 55.5% 17.1% 20.7% 23.6% 24.4% 2.6% 4.0% 4.5% 4.7% 27.8% 28.9% 38.8% 28.4%
Compliance table on the Guidelines on Covid -19 measures reporting and disclosure
Individual country data includes subsidiaries, which are excluded from EU aggregate. For example, at country level the subsidiary in country X of a bank domiciled in country Y is included both in data for countries X and Y (for the latter as part of the consolidated entity). In the EU aggregate, only the consolidated entity domiciled in country Y is considered. The sample of banks is unbalanced and reviewed annually. Being an unbalanced sample, the number of reporting banks per country can display minor variations between quarters, which might accordingly affect quarterly changes in absolute and relative figures.
Coverage of NPLs
Loans and advances with expired EBA-compliant moratoriaVolumes bn EUR;
% Total of which: Households of which: NFCs Stage 2 Non-performing Coverage of NPLs
Statistical Annex
Overview on EBA-compliant Moratoria
Loans and advances with non-expired EBA-compliant moratoria
Volumes bn EUR; %
Total of which: Households of which: NFCs Stage 2 Non-performing

40
Sep-20 Dec-20 Mar-21 Jun-21 Sep-20 Dec-20 Mar-21 Jun-21 Sep-20 Dec-20 Mar-21 Jun-21 Sep-20 Dec-20 Mar-21 Jun-21 Sep-20 Dec-20 Mar-21 Jun-21AT 2.8 3.4 3.9 4.2 0.9% 1.0% 1.3% 2.3% 0.9% 1.0% 15.7% 14.4% 26.0% 23.1% 6.5% 6.7% 54.9% 54.5% 60.4% 61.6%
BE 0.9 1.9 1.8 1.4 31.2% 32.9% 28.3% 14.2% 41.1% 8.1% 6.5% 4.8% 2.7% 2.6% 3.6% 12.5% 21.4% 17.4% 25.8% 43.1%
BG 0.0 0.1 0.1 0.3 - 13.2% 13.0% 23.4% 4.2% 6.3% 4.7% 7.2% 7.2% 4.2% 3.2% 2.6% 88.6% 76.4% 79.1% 66.9%
CY - - - - - - - - - - - - - - - - - - - -
CZ
DE 7.8 9.9 11.2 12.7 2.2% 5.2% 2.6% 2.3% 6.2% 1.6% 0.7% 4.6% 11.1% 12.2% 11.4% 10.4% 46.8% 43.5% 45.4% 45.1%
DK 0.8 0.8 0.9 0.8 - - - - - - - - - - - - - - - -
EE 0.0 0.0 0.0 0.0 5.0% 2.5% 3.9% 10.7% 0.4% 6.2% 5.6% 11.1% 32.4% 23.0% 18.0% 12.5% 52.7% 55.0% 56.9% 54.7%
ES 92.1 102.1 108.7 106.8 4.3% 1.6% 1.6% 1.4% 5.3% 1.1% 1.1% 1.3% 3.4% 5.8% 5.8% 10.8% 86.0% 90.3% 86.0% 61.7%
FI 1.1 1.0 1.1 1.4 13.6% 0.4% 10.2% 5.0% 0.5% 22.6% 21.7% 5.0% 35.5% 17.1% 32.8% 25.8% 35.9% 42.8% 18.6% 36.4%
FR 115.4 126.8 131.7 118.9 17.9% 49.9% 38.7% 17.4% 61.2% 27.3% 21.7% 18.2% 2.9% 2.1% 2.8% 6.8% 3.9% 3.9% 20.9% 50.0%
GR 2.7 4.6 5.3 5.6 - 0.0% 0.3% 0.3% 0.5% 0.3% 0.0% 0.0% 0.1% 0.5% 0.5% 2.1% 99.4% 99.2% 99.2% 97.6%
HR 0.0 0.0 0.1 0.1 26.7% 6.9% 6.6% 12.3% 18.6% 25.2% 13.0% 7.5% 19.4% 9.3% 8.2% 0.7% 23.5% 33.5% 44.1% 61.5%
HU 0.3 0.8 1.4 2.0 - - - - - - - - - - - - - - - -
IE 0.4 0.7 1.0 1.2 - 1.5% 6.3% 4.3% 2.3% 7.0% 2.0% 1.8% 1.1% 0.9% 1.3% 1.9% 28.2% 29.0% 29.9% 48.5%
IS 0.0 0.1 0.1 0.1 - - - - - - - - - - - - - - - -
IT 56.8 82.1 100.5 110.7 0.7% 0.7% 0.6% 0.9% 0.6% 1.3% 1.4% 1.5% 2.7% 2.1% 1.5% 7.2% 26.2% 24.2% 24.4% 24.2%
LT 0.0 0.0 0.0 0.0 2.3% 9.7% 32.5% 37.2% 42.2% 15.0% 1.6% 15.1% 37.5% 42.8% 52.2% 40.8% 18.0% 32.3% 13.6% 6.9%
LU 0.1 0.1 0.1 0.1 - 4.0% 8.6% 7.5% 14.2% 7.6% 0.1% 0.6% 0.6% 0.1% 0.7% 13.7% 22.4% 28.8% 26.5% 30.3%
LV 0.0 0.0 0.0 0.0 - 25.9% 11.3% 43.6% 59.6% 43.4% 40.2% 15.0% 38.5% 28.7% 47.3% 40.2% 1.9% 1.4% 1.2% 1.2%
MT 0.1 0.2 0.2 0.3 - - - - - - 0.0% 0.3% 6.7% 4.0% 3.7% 3.2% 22.0% 22.9% 23.7% 48.6%
NL 1.9 2.7 3.1 3.2 6.1% 11.2% 13.6% 9.9% 17.5% 15.8% 13.0% 19.9% 28.3% 22.3% 24.6% 24.2% 36.6% 37.8% 36.2% 40.7%
NO
PL 1.4 2.2 2.9 3.5 10.9% 16.6% 25.0% 25.3% 45.2% 35.7% 28.0% 27.8% 27.4% 28.9% 29.5% 27.4% 16.5% 17.6% 15.5% 19.5%
PT 6.0 6.8 6.8 7.1 0.1% 0.9% 1.3% 0.4% 1.7% 0.8% 0.8% 0.9% 0.9% 1.3% 3.0% 3.8% 51.6% 52.2% 55.5% 83.8%
RO 0.5 0.9 1.0 1.0 0.1% 0.5% 0.6% 0.3% 1.2% 0.4% 0.2% 0.4% 1.2% 1.2% 0.7% 30.4% 95.9% 95.5% 92.6% 62.1%
SE 0.1 0.1 0.1 0.1 - - - - - - - - - - - - - - - -
SI 0.1 0.2 0.1 0.1 - 0.5% 0.4% 0.7% - 2.4% 2.5% 4.0% 8.5% 14.0% 6.3% 31.8% 91.2% 82.9% 90.8% 62.9%
SK 0.3 0.5 0.6 0.7 0.4% 1.8% 2.2% 1.6% 3.4% 1.8% 1.2% 1.4% 1.5% 0.6% 0.6% 1.1% 52.2% 45.1% 45.9% 53.2%
EU/EEA 288.7 343.2 378.0 377.3 8.9% 19.6% 14.6% 6.6% 26.9% 11.2% 8.8% 7.3% 3.7% 4.0% 4.0% 8.4% 38.1% 38.6% 43.2% 46.1%
T93_1 T93_1 T93_1 T93_1 T93_2 T93_2 T93_2 T93_2 T93_3 T93_3 T93_3 T93_3 T93_4 T93_4 T93_4 T93_4202009 202012 202103 202106 202009 202012 202103 202106 202009 202012 202103 202106 202009 202012 202103 202106
Sep-20 Dec-20 Mar-21 Jun-21 Sep-20 Dec-20 Mar-21 Jun-21 Sep-20 Dec-20 Mar-21 Jun-21 Sep-20 Dec-20 Mar-21 Jun-21
AT 71.8% 73.9% 74.4% 75.4% 31.3% 47.8% 48.7% 46.6% 0.7% 2.7% 2.8% 3.5% 23.1% 18.5% 18.2% 20.6%
BE 29.3% 53.6% 59.0% 77.0% 5.1% 6.4% 9.9% 12.2% 0.2% 1.1% 2.1% 3.1% 7.3% 10.9% 9.7% 9.1%
BG 92.9% 90.2% 90.3% 90.3% 5.9% 8.2% 9.4% 11.5% 0.3% 1.1% 1.3% 1.5% 35.4% 64.3% 54.6% 47.6%
CY - - - - - - - - - - - - - - - -
CZ
DE 79.1% 78.4% 78.7% 78.8% 7.5% 13.8% 19.4% 18.5% 0.5% 1.4% 1.6% 1.6% 8.0% 13.4% 17.4% 16.2%
DK 83.7% 82.4% 81.4% 82.7% 25.9% 13.9% 15.9% 21.1% 16.6% 20.5% 23.2% 27.6% 7.2% 6.9% 13.8% 19.4%
EE 85.5% 78.6% 80.3% 83.4% 13.3% 24.2% 32.3% 20.2% 22.8% 19.5% 20.7% 17.6% 67.0% 46.7% 51.6% 43.5%
ES 78.3% 78.2% 82.2% 82.4% 2.3% 9.2% 11.9% 17.6% 0.2% 0.6% 1.0% 2.0% 18.2% 13.2% 13.2% 13.7%
FI 74.9% 75.8% 76.9% 68.5% 5.2% 11.4% 7.9% 4.4% 0.6% 1.2% 7.8% 6.5% 15.2% 15.4% 28.2% 24.2%
FR 53.1% 55.0% 68.6% 67.5% 5.6% 12.9% 15.7% 24.4% 1.4% 1.8% 2.2% 3.2% 9.0% 8.6% 9.0% 8.7%
GR 64.9% 64.0% 64.2% 64.5% 1.0% 3.8% 5.7% 7.5% 0.3% 0.6% 0.7% 0.9% 1.4% 5.3% 12.6% 9.3%
HR 71.0% 49.8% 55.9% 68.3% 47.0% 46.8% 60.6% 70.2% - - - 2.7% - - - 50.7%
HU 70.7% 70.5% 76.6% 75.2% 11.0% 12.7% 5.6% 7.5% 0.0% 0.9% 0.7% 1.4% 35.3% 8.6% 11.9% 25.1%
IE 76.2% 86.4% 84.6% 82.6% 3.2% 25.6% 28.4% 33.4% 4.5% 3.3% 7.8% 8.0% 9.5% 2.6% 3.4% 4.5%
IS 93.3% 89.7% 89.6% 89.5% 51.4% 62.3% 61.1% 60.6% 1.8% 8.1% 8.0% 8.1% 6.3% 32.8% 33.6% 34.2%
IT 81.6% 86.6% 86.3% 86.8% 5.1% 10.9% 10.5% 12.7% 0.1% 0.2% 0.3% 0.5% 18.2% 23.2% 21.8% 21.5%
LT 17.5% 29.8% 16.6% 16.2% 10.0% 1.4% - 12.9% - - 25.9% 24.7% - - 21.0% 21.4%
LU 83.0% 85.4% 85.1% 84.8% 9.3% 16.7% 15.2% 21.5% 3.5% 7.3% 5.0% 12.9% 3.5% 7.6% 7.6% 11.8%
LV 80.0% 75.7% 80.0% 80.0% - - - - - - - - - - - -
MT 46.3% 48.2% 49.2% 49.4% 12.8% 17.9% 33.1% 31.1% 0.7% 1.0% 2.7% 5.9% 9.3% 3.2% 14.5% 10.4%
NL 84.8% 83.2% 85.2% 93.1% 22.5% 28.1% 28.6% 26.5% 3.0% 4.1% 4.1% 5.0% 13.6% 13.0% 11.8% 12.8%
NO
PL 67.1% 62.6% 39.8% 69.7% 9.1% 13.4% 14.1% 16.3% 0.0% 0.7% 1.1% 1.6% 31.3% 17.3% 24.3% 18.5%
PT 78.7% 78.8% 78.6% 77.2% 7.1% 14.7% 15.9% 11.5% 0.2% 0.4% 0.3% 0.4% 20.1% 25.7% 29.5% 27.8%
RO 28.1% 28.6% 26.5% 30.2% 9.9% 12.6% 12.3% 27.4% 0.5% 0.4% 0.5% 0.3% 9.1% 8.2% 11.6% 12.2%
SE 72.9% 72.4% 69.6% 69.4% 26.2% 24.9% 32.7% 36.4% 1.8% 4.1% 6.0% 5.6% 29.8% 18.6% 20.5% 23.4%
SI 39.5% 34.6% 43.9% 43.8% 0.7% 8.9% 15.5% 19.3% - 0.0% 0.2% 0.4% - - 23.3% 22.7%
SK 31.4% 39.0% 41.4% 43.8% 20.4% 36.3% 41.3% 53.5% 0.3% 0.4% 0.2% 0.5% 39.7% 55.1% 65.6% 32.5%
EU/EEA 68.4% 71.1% 77.5% 78.2% 4.9% 11.7% 13.6% 18.5% 0.7% 1.1% 1.4% 2.0% 10.4% 10.4% 11.8% 12.1%
Compliance table on the Guidelines on Covid -19 measures reporting and disclosure
Statistical Annex
Overview of public guarantee schemes (PGS)
Newly originated loans and advances subject to public guarantee schemes
Volumes bn EUR Newly originated loans subject to PGS
of which: Residual maturity <= 6 months
of which: Residual maturity > 6 months <= 12 months
of which: Residual maturity > 1 year <= 2 years
of which: Residual maturity > 2 years <= 5 years
Coverage of non-performing loans subject to PGS
Newly originated loans and advances subject to public guarantee schemes
Public guarantee received
Individual country data includes subsidiaries, which are excluded from EU aggregate. For example, at country level the subsidiary in country X of a bank domiciled in country Y is included both in data for countries X and Y (for the latter as part of the consolidated entity). In the EU aggregate, only the consolidated entity domiciled in country Y is considered. The sample of banks is unbalanced and reviewed annually. Being an unbalanced sample, the number of reporting banks per country can display minor variations between quarters, which might accordingly affect quarterly changes in absolute and relative figures.
Loans subject to PGS classified as stage 2
Non-performing loans subject to PGS

41
Methodological note
Risk Indicators' (RIs) heatmap
The heatmap provides a quick overview of the main RIs, in which it is possible to find the category, number and designationof the specific RI, its historic development and the three buckets in which each data point is assigned to across time (greenfor the “best” bucket, yellow for the intermediary one and red for the “worst” bucket). The “sample of reporting banks”returns the actual number of banks that submitted the expected data for that reference date (consolidated view).
For each of the RIs' quarterly data, the distribution across the three buckets is computed in respect of the sum of totalassets for all banks that are included in the EBA’s reporting sample in each reference date. From reference periods March2020 onwards, the sum of total asses no longer includes UK banks.. Thus, if we observe any given bucket increasing itspercentage, we immediately acknowledge that more assets are being assigned to that bucket. However, this does notnecessarily mean that more banks are comprised within the bucket (the sum of total assets for all banks is fixed, as well asthe total assets from each bank taken individually).
The traffic light of each RI can assume three colours (green, yellow and red) depending on the latest developments on the“worst” bucket of the RI comparing to the whole time series. If the “worst” bucket is progressing positively (i.e. in casefewer assets are being assigned to it), the traffic light should be moving away from red getting closer to green. The colour iscomputed considering the 33rd and the 67th percentile of the time series.
To help reading the heatmap, let us consider the example of the cost to income ratio:
The green traffic light for the ratio points to the good behaviour of this RI in the last quarter relating to past observations.
More than just declaring if the “worst” bucket has more or less percentage of assets assigned to it, this traffic lightapproach delivers simultaneously an insight to the latest developments in the RI’s “worst” bucket and to the relativeposition of that data point comparing to all other observations in the same bucket.
The Risk Assessment (RA) meter summarizes the developments in all the KRIs included in the heatmap, providing a singlemeasure. It is computed as the weighted average across the KRIs sum of total assets in the "intermediate" and "worst"bucket. The average is weighted in order to guarantee that each KRI category (solvency, credit risk and asset quality,earnings and balance sheet structure) receives the same weight. Since each category includes a different number of KRIs,the weight of each KRI is thus different. The risk perception increases with higher values of the RA meter: the closer to100%, the higher the risk.
< 50% 12.6% 12.2% 12.5% 13.7% 14.5%
[50% - 60%] 25.0% 12.0% 32.6% 34.0% 36.3%
> 60% 62.5% 75.8% 54.9% 52.3% 49.3%
Cost to income ratio

42
aRisk Indicators in the DashboardNr Risk Indicator code Dashboard name Formula
Template Row Column Template Row Column Template Row Column Template Row Column
1 SVC_1 Tier 1 capital ratio Tier 1 capital (A) / Total risk exposure amount (B) C 01.00 015 010 C 02.00 010 010
2 SVC_2 Total capital ratio Own funds (A) / Total risk exposure amount (B) C 01.00 010 010 C 02.00 010 010
3 SVC_3 CET 1 capital ratio Common equity TIER 1 capital (A) / Total risk exposure amount (B) C 01.00 020 010 C 02.00 010 010
4 SVC_29 CET 1 ratio (fully loaded)Common equity TIER 1 capital (A) / Total risk exposure amount (B) with both, numerator and denominator, being adjusted for transitional effects
5 SVC_13 Leverage ratioTier 1 capital - transitional definition (A) / Total Leverage Ratio exposure - using a transitional definition of Tier 1 capital (B)
C 47.00 320 010 C 47.00 300 010
6 SVC_12 Leverage ratio (fully phased-in definition of Tier 1)Tier 1 capital - fully phased-in definition (A) / Total Leverage Ratio exposure - using a fully phased-in definition of Tier 1 capital (B)
C 47.00 310 010 C 47.00 290 010
7 AQT_3.2 Share of non-performing loans and advances(NPL ratio)
Non-performing loans and advances (A) / Total gross loans and advances (B)
F 18.00005, 070, 191, 221
060 F 18.00005, 070, 191, 221
010
8 AQT_41.2 Coverage ratio of non-performing loans and advancesAccumulated impairment, accumulated negative changes in fair value due to credit risk for non-performing loans and advances (A) / Total gross non-performing loans and advances (B)
F 18.00005, 070, 191, 221
150 F 18.00005,070, 191, 221
060
9 AQT_42.2 Forbearance ratio - Loans and advances (gross amount) (FBL)Exposures with forbearance measures for loans and advances [A] / total instruments on BS [B]
F 19.00005, 070, 191, 221
010 F 18.00005, 070, 191, 221
010
10 AQT_3.1Non-performing debt instruments (loans and advances & debt securities) other than held for trading to total gross debt instruments (NPE ratio)
Non-performing debt instruments (loans and advances & debt securities) other than held for trading (A) / Total gross debt instruments (B)
F 18.00 330 060 F 18.00 330 010
11 PFT_21Return on equity (numerator annualised, denominator as average)(2) Profit or loss for the year (A) / Total equity (B) F 02.00 670 010 F 01.03 300 010
12 PFT_24Return on assets (numerator annualised, denominator as average)(2) Profit or loss for the year (A) / Total assets (B) F 02.00 670 010 F 01.01 380 010
13 PFT_23 Cost to income ratioAdministrative and depreciation expenses (A) / Total net operating income (B)
F 02.00 360, 385, 390 010 F 02.00 355 010
14 PFT_25 Net interest income to total net operating incomeNet interest income (Interest income (A) - Interest expenses (B)) / Total net operating income (C)
F 02.00 010 010 F 02.00 090 010 F 02.00 355 010
15 PFT_26 Net fee and comission income to total net operating incomeNet fee and commission income (Fee and commission income (A) - Fee and commission expenses (B)) / Total net operating income (C)
F 02.00 200 010 F 02.00 210 010 F 02.00 355 010
16 PFT_29 Net trading income to total net operating incomeNet gains or losses on financial assets and liabilities held for trading (A) / Total net operating income (B)
F 02.00280, 285, 287, 290, 295
010 F 02.00 355 010
17 PFT_41Net interest margin (numerator annualised, denominator as average)(2) Interest income (A) - interest expenses (B) / Interest earning assets (C) F 02.00 010 010 F 02.00 090 010 F 01.01
010, 080, 090, 094, 095, 120, 130, 173, 174, 177, 178, 232, 233, 236, 237, 098, 099, 143, 144, 182, 183
010
18 PFT_43 Cost of risk (3)
(3) Increases due to origination and acquisition + Changes due to change in credit risk (net) + Changes due to modifications without derecognition (net) + Changes due to update in the institution's methodology for estimation (net) + Other adjustments] (annualised) (A) / Total gross loans and advances subject to impairment (B + C)
F 12.01080, 250, 430, 670
020, 040, 050, 070, 110, 120, 125
F 04.03.1 110015, 030, 040, 041
F 04.04.1 070015, 030, 040, 041
19 FND_32 Loans and advances-to-deposits ratio for households and non-financial corporations
Total loans and advances to non-financial corporations and households (A + B) / Total deposits to non-financial corporations and households (C)
F 05.01 080 050, 060 F 04.01 170, 180 010 F 08.01 260, 310010, 020, 030, 034, 035
20 FND_33 Asset encumbrance ratio(4) Total encumbered assets and collateral (A) / Total assets and collateral (B+C)
F 32.01 & F32.02 010, 130 010 F 32.01 010 010, 060 F 32.02 130 010, 040
21 LIQ_17 Liquidity coverage ratio Liquidity Buffer (A) / Net Liquidity Outflow (B) C 76.00 010 010 C 76.00 020 010
(1) The data points refer to the latest version of either FINREP tables ("F") or COREP tables ("C") (http://www.eba.europa.eu/regulation-and-policy/supervisory-reporting/implementing-technical-standard-on-supervisory-reporting). For more information regarding the Risk Indicators formulas, applicable to each reporting framework, please see the List and Methodological Guide available here (http://www.eba.europa.eu/risk-analysis-and-data/risk-indicators-guide).
(2) For the calculation of the average the previous December figure is used as an “anchor” for the subsequent year, and the second the number is taken from the latest quarter observation, i.e. Q1, Q2, Q3 or Q4.(3) Applicable only to IFRS reporting banks. For nGAAP banks the formula is: Increases and other adjustments in allowances due to amounts set aside for estimated loan losses during the period + Decreases due to amounts reversed for estimated loan losses during the period] (A) / Total gross loans and advances subject to impairment (B + C + D)(4) Encumbered assets (recognised on the balance sheet) are considered at their carrying value, collateral received is considered as at fair value.
Data Point A(1) Data Point B(1) Data Point D(1)
{C 01.00(r020, c10) - C 05.01(r010, c010) - C 01.00(r440, c010) + MIN ([C 01.00(r530, c10) - C 01.00(r740, c10) - C 05.01(r010, c020) - C 01.00(r720, c10) + MIN ([C 01.00(r750, c10) - C 01.00(r970, c10) - C 05.01(r010, c030)], 0)], 0)} / ( {C 02.00;r010;c010} - {C 05.01;r010;c040} )
Data Point C(1)

43
Risk Indicators in the Statistical Annex
Template Row Column Template Row Column
Cash balances RDB_1 Ratio Cash positions (A) / Total Assets (B) F 01.01 020, 030, 040 010 F 01.01 380 010
Equity instruments RDB_2 Ratio Equity instruments (A) / Total Assets (B) F 01.01070, 093, 097, 110, 142, 172, 176, 235,
390010 F 01.01 380 010
Debt securities RDB_3 Ratio Debt securities (A) / Total Assets (B) F 01.01080, 094, 098, 120, 173, 143 ,177, 182,
232, 236010 F 01.01 380 010
Loans and advances RDB_4 Ratio Loans and advances (A) / Total Assets (B) F 01.01090, 095, 099, 130, 144, 174, 178, 183,
233, 237010 F 01.01 380 010
Derivatives RDB_5 Ratio Derivatives (A) / Total Assets (B) F 01.01 060, 092, 240 010 F 01.01 380 010
Other assets RDB_6 (4) Ratio Other assets (A) / Total Assets (B) F 01.01250, 260, 270, 300, 330, 360, 370, 375
010 F 01.01 380 010
Total assets RDB_1 Denominator Total assets F 01.01 380 010
Total financial assets AQT_68.1 (4) Denominator Total financial instruments on the asset side F01.01010, 050, 091, 096, 100, 141, 171, 175, 181, 231, 234, 240
010
Share of financial assets valued at (amortised) cost AQT_68.3 (4) Ratio Financial instruments measured at (amortised) cost (A) / Total financial instruments on the asset side (B) F01.01 010, 181, 231, 234 010 F01.01010, 050, 091, 096, 100, 141, 171, 175, 181, 231, 234, 240
010
Share of financial assets at fair value through OCI AQT_68.2 (4) Ratio Financial instruments measured at FV through other comprehensive income (A) / Total financial instruments on the asset side (B)
F01.01 141, 175 010 F01.01010, 050, 091, 096, 100, 141, 171, 175, 181, 231, 234, 240
010
Share of financial assets at fair value through profit&loss (3) AQT_68.1 (4) Ratio Financial instruments measured at FV through P&L (A) / Total financial instruments on the asset side (B) F01.01050, 091, 096, 100,
171, 240010 F01.01
010, 050, 091, 096, 100, 141, 171, 175, 181, 231, 234, 240
010
Loans and advances AQT_3.2 Denominator Total gross loans and advances F 18.00 005, 070, 191, 221 010 n/a n/a n/a
Loans and advances: HHs n/a Gross carrying amount of loans at amortised costs to Households F 18.00 150 010 n/a n/a n/a
Loans and advances: Mortgages n/a Gross carrying amount of loans at amortised costs to Households of which: Loans collateralised by residential immovable property
F 18.00 160 010 n/a n/a n/a
Loans and advances: NFCs n/a Gross carrying amount of loans at amortised costs to Non-financial corporations F 18.00 120 010 n/a n/a n/a
Loans and advances: SME n/a Gross carrying amount of loans at amortised costs to NFCs of which: Small and Medium-sized Enterprises F 18.00 130 010 n/a n/a n/a
Loans and advances: CRE n/a Gross carrying amount of loans at amortised costs to NFCs of which: Loans collateralised by commercial immovable property
F 18.00 140 010 n/a n/a n/a
Non-performing loans and advances AQT_3.2 Numerator Non-performing loans and advances F 18.00 005, 070, 191, 221 060 n/a n/a n/a
Non-performing loans and advances: HHs n/a Gross carrying amount of non-performing loans at amortised costs to Households F 18.00 150 060 n/a n/a n/a
Non-performing loans and advances: Mortgages n/a Gross carrying amount of non-performing loans at amortised costs to Households of which: Loans collateralised by residential immovable property
F 18.00 160 060 n/a n/a n/a
Data Point A(1) Data Point B(1)
Annex seriesRisk Indicator
codeRI's parameter
shownFormula

44
Non-performing loans and advances: NFCs n/a Gross carrying amount of non-performing loans at amortised costs to Non-financial corporations F 18.00 120 060 n/a n/a n/a
Non-performing loans and advances: SME n/a Gross carrying amount of non-performing loans at amortised costs to NFCs of which: Small and Medium-sized Enterprises
F 18.00 130 060 n/a n/a n/a
Non-performing loans and advances: CRE n/a Gross carrying amount of non-performing loans at amortised costs to NFCs of which: Loans collateralised by commercial immovable property
F 18.00 140 060 n/a n/a n/a
NPL Ratio AQT_3.2 Ratio Non-performing loans and advances (A) / Total gross loans and advances (B) F 18.00 005,070, 191, 221 060 F 18.00 005,070, 191, 221 010
NPL ratio: HHs n/a Ratio Gross carrying amounts of loans at amortised costs to Households: Non-performing (A) / Gross carrying amount (B) F 18.00 150 060 F 18.00 150 010
NPL ratio: Mortgages n/a Ratio Gross carrying amounts of loans at amortised costs to Households of which: Loans collateralised by residential immovable property: Non-performing (A) / Gross carrying amount (B)
F 18.00 160 060 F 18.00 160 010
NPL ratio: NFCs n/a Ratio Gross carrying amounts of loans at amortised costs to Non-financial corporations: Non-performing (A) / Gross carrying amount (B)
F 18.00 120 060 F 18.00 120 010
NPL ratio: SME n/a Ratio Gross carrying amounts of loans at amortised costs to NFCs of which: Small and Medium-sized Enterprises: Non-performing (A) / Gross carrying amount (B)
F 18.00 130 060 F 18.00 130 010
NPL ratio: CRE n/a Ratio Gross carrying amounts of loans at amortised costs to NFCs of which: Loans collateralised by commercial immovable property: Non-performing (A) / Gross carrying amount (B)
F 18.00 140 060 F 18.00 140 010
Coverage ratio of non-performing loans and advances AQT_41.2 Ratio Accumulated impairment, accumulated negative changes in fair value due to credit risk for non-performing loans and advances (A) / Total gross non-performing loans and advances (B)
F 18.00 005,070, 191, 221 150 F 18.00 005, 070, 191, 221 060
Coverage ratio: HHs n/a Ratio Gross carrying amounts of loans at amortised costs to Households: Accumulated impairment (A) / Non-performing (B) F 18.00 150 150 F18.00 150 060
Coverage ratio: Mortgages n/a Ratio Gross carrying amounts of loans at amortised costs to Households of which: Loans collateralised by residential immovable property: Accumulated impairment (A) / Non-performing (B)
F 18.00 160 150 F18.00 160 060
Coverage ratio: NFCs n/a Ratio Gross carrying amounts of loans at amortised costs to Non-financial corporations: Accumulated impairment (A) / Non-performing (B)
F 18.00 120 150 F18.00 120 060
Coverage ratio: SME n/a Ratio Gross carrying amounts of loans at amortised costs to NFCs of which: Small and Medium-sized Enterprises Accumulated impairment (A) / Non-performing (B)
F 18.00 130 150 F18.00 130 060
Coverage ratio: CRE n/a Ratio Gross carrying amounts of loans at amortised costs to NFCs of which: Loans collateralised by commercial immovable property Accumulated impairment (A) / Non-performing (B)
F 18.00 140 150 F18.00 140 060
NFCs loans and advances - A Agriculture, forestry and fishing n/a Ratio NFCs loans and advances - A Agriculture, forestry and fishing (A) / Total gross carrying amount Loans and advances (B) F 06.01 010 010 F06.01 190 010
NFCs loans and advances - B Mining and quarrying n/a Ratio NFCs loans and advances - B Mining and quarrying (A) / Total gross carrying amount Loans and advances (B) F 06.01 020 010 F06.01 190 010
NFCs loans and advances - C Manufacturing n/a Ratio NFCs loans and advances - C Manufacturing (A) / Total gross carrying amount Loans and advances (B) F 06.01 030 010 F06.01 190 010
NFCs loans and advances - D Electricity, gas, steam and air conditioning supply n/a Ratio NFCs loans and advances - D Electricity, gas, steam and air conditioning supply (A) / Total gross carrying amount Loans and advances (B)
F 06.01 040 010 F06.01 190 010
NFCs loans and advances - E Water supply n/a Ratio NFCs loans and advances - E Water supply (A) / Total gross carrying amount Loans and advances (B) F 06.01 050 010 F06.01 190 010
NFCs loans and advances - F Construction n/a Ratio NFCs loans and advances - F Construction (A) / Total gross carrying amount Loans and advances (B) F 06.01 060 010 F06.01 190 010
NFCs loans and advances - G Wholesale and retail trade n/a Ratio NFCs loans and advances - G Wholesale and retail trade (A) / Total gross carrying amount Loans and advances (B) F 06.01 070 010 F06.01 190 010

45
NFCs loans and advances - H Transport and storage n/a Ratio NFCs loans and advances - H Transport and storage (A) / Total gross carrying amount Loans and advances (B) F 06.01 080 010 F06.01 190 010
NFCs loans and advances - I Accommodation and food service activities n/a Ratio NFCs loans and advances - I Accommodation and food service activities (A) / Total gross carrying amount Loans and advances (B)
F 06.01 090 010 F06.01 190 010
NFCs loans and advances - J Information and communication n/a Ratio NFCs loans and advances - J Information and communication (A) / Total gross carrying amount Loans and advances (B) F 06.01 100 010 F06.01 190 010
NFCs loans and advances - K Financial and insurance activities n/a Ratio NFCs loans and advances - K Financial and insurance activities (A) / Total gross carrying amount Loans and advances (B) F 06.01 105 010 F06.01 190 010
NFCs loans and advances - L Real estate activities n/a Ratio NFCs loans and advances - L Real estate activities (A) / Total gross carrying amount Loans and advances (B) F 06.01 110 010 F06.01 190 010
NFCs loans and advances - M Professional, scientific and technical activities n/a Ratio NFCs loans and advances - M Professional, scientific and technical activities (A) / Total gross carrying amount Loans and advances (B)
F 06.01 120 010 F06.01 190 010
NFCs loans and advances - N Administrative and support service activities n/a Ratio NFCs loans and advances - N Administrative and support service activities (A) / Total gross carrying amount Loans and advances (B)
F 06.01 130 010 F06.01 190 010
NFCs loans and advances - O Public administration and defence, compulsory social security n/a Ratio NFCs loans and advances - O Public administration and defence, compulsory social security (A) / Total gross carrying amount Loans and advances (B)
F 06.01 140 010 F06.01 190 010
NFCs loans and advances - P Education n/a Ratio NFCs loans and advances - P Education (A) / Total gross carrying amount Loans and advances (B) F 06.01 150 010 F06.01 190 010
NFCs loans and advances - Q Human health services and social work activities n/a Ratio NFCs loans and advances - Q Human health services and social work activities (A) / Total gross carrying amount Loans and advances (B)
F 06.01 160 010 F06.01 190 010
NFCs loans and advances - R Arts, entertainment and recreation n/a Ratio NFCs loans and advances - R Arts, entertainment and recreation (A) / Total gross carrying amount Loans and advances (B) F 06.01 170 010 F06.01 190 010
NFCs loans and advances - S Other services n/a Ratio NFCs loans and advances - S Other services (A) / Total gross carrying amount Loans and advances (B) F 06.01 180 010 F06.01 190 010
NFCs NPLs - A Agriculture, forestry and fishing n/a Ratio NFCs loans and advances - A Agriculture, forestry and fishing : Non-performing (A) /Loans and advances (B) F 06.01 010 012 F06.01 010 010
NFCs NPLs - B Mining and quarrying n/a Ratio NFCs loans and advances - B Mining and quarrying : Non-performing (A) /Loans and advances (B) F 06.01 020 012 F06.01 020 010
NFCs NPLs - C Manufacturing n/a Ratio NFCs loans and advances - C Manufacturing : Non-performing (A) /Loans and advances (B) F 06.01 030 012 F06.01 030 010
NFCs NPLs - D Electricity, gas, steam and air conditioning supply n/a Ratio NFCs loans and advances - D Electricity, gas, steam and air conditioning supply : Non-performing (A) /Loans and advances (B)
F 06.01 040 012 F06.01 040 010
NFCs NPLs - E Water supply n/a Ratio NFCs loans and advances - E Water supply : Non-performing (A) /Loans and advances (B) F 06.01 050 012 F06.01 050 010
NFCs NPLs - F Construction n/a Ratio NFCs loans and advances - F Construction : Non-performing (A) /Loans and advances (B) F 06.01 060 012 F06.01 060 010
NFCs NPLs - G Wholesale and retail trade n/a Ratio NFCs loans and advances - G Wholesale and retail trade : Non-performing (A) /Loans and advances (B) F 06.01 070 012 F06.01 070 010
NFCs NPLs - H Transport and storage n/a Ratio NFCs loans and advances - H Transport and storage : Non-performing (A) /Loans and advances (B) F 06.01 080 012 F06.01 080 010
NFCs NPLs - I Accommodation and food service activities n/a Ratio NFCs loans and advances - I Accommodation and food service activities : Non-performing (A) /Loans and advances (B) F 06.01 090 012 F06.01 090 010

46
NFCs NPLs - J Information and communication n/a Ratio NFCs loans and advances - J Information and communication : Non-performing (A) /Loans and advances (B) F 06.01 100 012 F06.01 100 010
NFCs NPLs - K Financial and insurance activities n/a Ratio NFCs loans and advances - K Financial and insurance activities : Non-performing (A) /Loans and advances (B) F 06.01 105 012 F06.01 105 010
NFCs NPLs - L Real estate activities n/a Ratio NFCs loans and advances - L Real estate activities : Non-performing (A) /Loans and advances (B) F 06.01 110 012 F06.01 110 010
NFCs NPLs - M Professional, scientific and technical activities n/a Ratio NFCs loans and advances - M Professional, scientific and technical activities : Non-performing (A) /Loans and advances (B)
F 06.01 120 012 F06.01 120 010
NFCs NPLs - N Administrative and support service activities n/a Ratio NFCs loans and advances - N Administrative and support service activities : Non-performing (A) /Loans and advances (B) F 06.01 130 012 F06.01 130 010
NFCs NPLs - O Public administration and defence, compulsory social security n/a Ratio NFCs loans and advances - O Public administration and defence, compulsory social security : Non-performing (A) /Loans and advances (B)
F 06.01 140 012 F06.01 140 010
NFCs NPLs - P Education n/a Ratio NFCs loans and advances - P Education : Non-performing (A) /Loans and advances (B) F 06.01 150 012 F06.01 150 010
NFCs NPLs - Q Human health services and social work activities n/a Ratio NFCs loans and advances - Q Human health services and social work activities : Non-performing (A) /Loans and advances (B)
F 06.01 160 012 F06.01 160 010
NFCs NPLs - R Arts, entertainment and recreation n/a Ratio NFCs loans and advances - R Arts, entertainment and recreation : Non-performing (A) /Loans and advances (B) F 06.01 170 012 F06.01 170 010
NFCs NPLs - S Other services n/a Ratio NFCs loans and advances - S Other services : Non-performing (A) /Loans and advances (B) F 06.01 180 012 F06.01 180 010
Proportion of exposures to NACE L (Real Estate Activities) n/a Ratio Exposures to NACE L (Real Estate Activities) (A) / Total exposures to non-financial corporations (B) F 20.07.1 110 010 F 20.07.1 190 010
Non-performing exposures to NACE L (Real Estate Activities) n/a Ratio Non-performing exposures to NACE L (A) / Total exposures to NACE L (Real Estate Activities) (B) F 20.07.1 110 012 F 20.07.1 110 010
Proportion of exposures to NACE F (Construction) n/a Ratio Exposures to NACE F (Construction) (A) / Total exposures to non-financial corporations (B) F 20.07.1 060 010 F 20.07.1 190 010
Non-performing exposures to NACE F (Construction) n/a Ratio Non-performing exposures to NACE F (A) / Total exposures to NACE F (Construction) (B) F 20.07.1 060 012 F 20.07.1 060 010
Stage 1 loans and advances (3) AQT_65 Ratio Stage 1 loans and advances at amortised cost (A) / Sum of stage 1, 2 and 3 loans and advances at amortised cost (B) F 04.04.1 070 015 F 04.04.1 070 015, 030, 040
Stage 2 loans and advances (3) AQT_66 Ratio Stage 2 loans and advances at amortised cost (A) / Sum of stage 1, 2 and 3 loans and advances at amortised cost (B) F 04.04.1 070 030 F 04.04.1 070 015, 030, 040
Stage 3 loans and advances (3) AQT_67 Ratio Stage 3 loans and advances at amortised cost (A) / Sum of stage 1, 2 and 3 loans and advances at amortised cost (B) F 04.04.1 070 040 F 04.04.1 070 015, 030, 040
Coverage ratio stage 1 of loans and advances (3) AQT_79.1 Ratio Accumulated impairments (A) / Gross carrying amount (B) for loans and advances at amortised cost in stage 1 F 04.04.1 070 050 F 04.04.1 070 015
Coverage ratio stage 2 of loans and advances (3) AQT_79.2 Ratio Accumulated impairments (A) / Gross carrying amount (B) for loans and advances at amortised cost in stage 2 F 04.04.1 070 060 F 04.04.1 070 030
Coverage ratio stage 3 of loans and advances (3) AQT_79.3 Ratio Accumulated impairments (A) / Gross carrying amount (B) for loans and advances at amortised cost in stage 3 F 04.04.1 070 070 F 04.04.1 070 040
Total fair valued financial assets (3) n/a Calculation (AQT_68.1 + AQT_68.2) * Total Financial Assets n/a n/a n/a n/a n/a n/a
Level 1 financial assets (3) AQT_80.1 RatioFinancial assets recognised at fair value through profit and loss and at fair value through other comprehensive income and hedge accounting derivatives, which are Level 1 assets (A) / total financial assets recognised at fair value through profit and loss and at fair value through other comprehensive income and hedge accounting derivatives (B)
F 14.00010, 056, 060, 101,
140010 F 14.00
010, 056, 060, 101, 140
010, 020, 030

47
Level 2 financial assets (3) AQT_80.2 RatioFinancial assets recognised at fair value through profit and loss and at fair value through other comprehensive income and hedge accounting derivatives, which are Level 2 assets (A) / total financial assets recognised at fair value through profit and loss and at fair value through other comprehensive income and hedge accounting derivatives (B)
F 14.00010, 056, 060, 101,
140020 F 14.00
010, 056, 060, 101, 140
010, 020, 030
Level 3 financial assets (3) AQT_80.3 RatioFinancial assets recognised at fair value through profit and loss and at fair value through other comprehensive income and hedge accounting derivatives, which are Level 3 assets (A) / total financial assets recognised at fair value through profit and loss and at fair value through other comprehensive income and hedge accounting derivatives (B)
F 14.00010, 056, 060, 101,
140030 F 14.00
010, 056, 060, 101, 140
010, 020, 030
Sovereign exposure - Total gross carrying amount n/a Total gross carrying amount C 33.00 010 010
Sovereign exposure - Total net of short positions n/a Total net of short positions C 33.00 010 020
Sovereign exposure - Financial assets held for trading n/a Ratio Sovereign exposure treated as Financial assets held for trading / Sum of the sovereign exposure values at fair value through P&L , OCI and amortised cost (B)
C 33.00 010 030 C 33.00 010030, 040, 050, 060, 070, 080, 090, 100,
110, 120
Sovereign exposure - Fair value through P&L n/a Ratio Sovereign exposure treated as Fair value through P&L (A) / Sum of the sovereign exposure values at fair value through P&L , OCI and amortised cost (B)
C 33.00 010 060 C 33.00 010030, 040, 050, 060, 070, 080, 090, 100,
110, 120
Sovereign exposure - Fair value through OCI n/a Ratio Sovereign exposure treated as Fair value through OCI (A) / Sum of the sovereign exposure values at fair value through P&L , OCI and amortised cost (B)
C 33.00 010 080 C 33.00 010030, 040, 050, 060, 070, 080, 090, 100,
110, 120
Sovereign exposure - Amortised cost n/a Ratio Sovereign exposure treated as Amortised cost (A) / Sum of the sovereign exposure values at fair value through P&L , OCI and amortised cost (B)
C 33.00 010 100 C 33.00 010030, 040, 050, 060, 070, 080, 090, 100,
110, 120
Sovereign exposure - Other n/a Calculation Residual Calculation: 1 - (A/B) C 33.00 010 030, 060, 080, 100 C 33.00 010030, 040, 050, 060, 070, 080, 090, 100,
110, 120
Sovereign exposure maturities 0 - 3M n/a Ratio Sovereign exposure maturities 0 - 3M (A) / Sum of the sovereign exposure values in all maturities (B) C 33.00 170 010 C 33.00170, 180, 190, 200,
210, 220, 230010
Sovereign exposure maturities 3M - 1Y n/a Ratio Sovereign exposure maturities 3M - 1Y (A) / Sum of the sovereign exposure values in all maturities (B) C 33.00 180 010 C 33.00170, 180, 190, 200,
210, 220, 230010
Sovereign exposure maturities 1Y - 5Y n/a Ratio Sovereign exposure maturities 1Y - 5Y (A) / Sum of the sovereign exposure values in all maturities (B) C 33.00 190, 200, 210 010 C 33.00170, 180, 190, 200,
210, 220, 230010
Sovereign exposure maturities 5Y - 10Y n/a Ratio Sovereign exposure maturities 5Y - 10Y (A) / Sum of the sovereign exposure values in all maturities (B) C 33.00 220 010 C 33.00170, 180, 190, 200,
210, 220, 230010
Sovereign exposure maturities 10Y - more n/a Ratio Sovereign exposure maturities 10Y - more (A) / Sum of the sovereign exposure values in all maturities (B) C 33.00 230 010 C 33.00170, 180, 190, 200,
210, 220, 230010
Debt securities issued FND_9 Ratio Debt securities issued (A) / Total liabilities (B) F 01.02050, 065, 090, 130,
143010 F 01.02 300 010
Deposits from credit institutions FND_10 Ratio Deposits from credit institutions (A) / Total liabilities (B) F 08.01 160010, 020, 030, 034,
035F 01.02 300 010
Customer deposits from HHs n/a Ratio Deposits from HHs (A) / Total liabilities (B) F 08.01 310010, 020, 030, 034,
035F01.02 300 010
Customer deposits from NFCs n/a Ratio Deposits from NFCs (A) / Total liabilities (B) F 08.01 260010, 020, 030, 034,
035F01.02 300 010

48
Other deposits n/a Ratio Other deposits (A) / Total liabilities (B) F 08.01 110, 210010, 020, 030, 034,
035F01.02 300 010
Other liabilities n/a Calculation Residual Calculation: 1 - (A/B) F 08.01 110, 210, 260, 310010, 020, 030, 034,
035F01.02 300 010
Total liabilities FND_18 Denominator Total deposits other than from banks (A) / Total liabilities (B) n/a n/a n/a F 01.02 300 010
n/a n/a n/a n/a n/a n/a
FND_28 Numerator Covered bonds (A) / Total liabilities (B) F 08.01 390010, 020, 030, 034,
035n/a n/a n/a
FND_29 Numerator Asset-backed securities (A) / Total liabilities (B) F 08.01 380010, 020, 030, 034,
035n/a n/a n/a
Loan commitments: volume n/a Gross carrying amount F 18.00 340 010 n/a n/a n/a
Share of loan commitments to HHs n/a Ratio Loan commitments to HHs (A) / Total loan commitments given (B) F 18.00 400 010 F 18.00 340 010
Share of loan commitments to NFCs n/a Ratio Loan commitments to NFCs (A) / Total loan commitments given (B) F 18.00 390 010 F 18.00 340 010
Own funds (Tier 1 capital) volume n/a Tier 1 capital volume (A) C 01.00 015 010 n/a n/a n/a
Capital instruments eligible as CET1 Capital n/a Ratio Capital instruments eligible as CET1 Capital (A) / Tier 1 capital volume (B) C 01.00 030 010 C01.00 015 010
Retained earnings n/a Ratio Retained earnings (A) / Tier 1 capital volume (B) C 01.00 130 010 C01.00 015 010
Accumulated other comprehensive income n/a Ratio Accumulated other comprehensive income (A) / Tier 1 capital volume (B) C 01.00 180 010 C01.00 015 010
Other CET1 components n/a Calculation Residual Calculation: 1 - (A/B) C 01.00 030, 130, 180, 530 010 C01.00 015 010
Additional Tier 1 capital n/a Ratio Additional Tier 1 capital C 01.00 530 010 C01.00 015 010
RWA volume n/a RWA volume C 02.00 010 010 n/a n/a n/a
Calculated as SCV_4 - Securitisation risk exposure amounts of total credit risk exposure amounts n/a n/a n/a n/a n/a n/a
SCV_4 Ratio Risk-weighted exposure amounts for credit, counterparty credit and dilution risks and free deliveries (A) / Total risk exposure amount (B)
C 02.00 040 010 C 02.00 010 010
Securitisation capital requirements n/a Ratio Securitisation positions (SA and IRB) (A) / Risk-weighted exposure amounts for credit, counterparty credit and dilution risks and free deliveries (B)
C 02.00 220, 430, 470 010 C 02.00 010 010
Market risk capital requirements SCV_8 Ratio Total risk exposure amount for position, foreign exchange and commodities risks (A) / Total risk exposure amount (B) C 02.00 520 010 C 02.00 010 010
Operational risk capital requirements SCV_9 Ratio Total risk exposure amount for OpR (A) / Total risk exposure amount (B) C 02.00 590 010 C 02.00 010 010
Other capital requirements n/a Ratio Residual in total capital requirements n/a n/a n/a n/a n/a n/a
Net interest income on equity (numerator annualised, denominator as average) (2) n/a Ratio (Interest income - Interest expense )(A) / Equity (B) F 02.00 010, 090 010 F 01.03 300 010
Net fee & commission income on equity (numerator annualised, denominator as average) (2) n/a Ratio Fee & commission income - Fee & commission expense (A) / Equity (B) F 02.00 200, 210 010 F 01.03 300 010
Net trading income (incl. FV result) on equity (numerator annualised, denominator as average) (2) n/a Ratio Net Gains or (-) losses on financial assets and liabilities: held for trading, trading, non-trading financial assets mandatorily
at fair value through profit or loss, designated at fair value through profit or loss (A) / Equity (B)F 02.00 280, 285, 287, 290 010 F 01.03 300 010
Other operating income on equity (numerator annualised, denominator as average) (2) n/a Ratio Total net operating income - net interest income - Fee & commission income - net trading income (A) / Equity (B) F 02.00
010, 090, 200, 210, 280, 285, 287, 290,
355010 F 01.03 300 010
Staff expenses on equity (numerator annualised, denominator as average) (2) n/a Ratio Staff expenses (A) / Equity (B) F 02.00 370 010 F 01.03 300 010
Other admin. (incl. depreciation) expenses on equity (numerator annualised, denominator as average) (2) n/a Ratio Other admin. (incl. depreciation) expenses (A) / Equity (B) F 02.00 380, 390 010 F 01.03 300 010
Provisions on equity (numerator annualised, denominator as average) (2) n/a Ratio Provisions (A) / Equity (B) F 02.00 430 010 F 01.03 300 010
Impairments (credit risk losses) on equity (numerator annualised, denominator as average) (2) n/a Ratio Impairments (credit risk losses) (A) / Equity (B) F 02.00 460 010 F 01.03 300 010
Share of secured funding
Calculated as sum (numerator FND_28 and FND_29) / numerator FND_9
Credit risk capital requirements (excl. securitisation)

49
Other (incl. tax) on equity (numerator annualised, denominator as average) (2) n/a Ratio Profit or (-) loss for the year - Total operating income + Staff expenses + Other admin. Expenses + Provisions + Impairments (A) / Equity (B)
F 02.00670, 355, 370, 380,
390, 430, 460010 F 01.03 300 010
Loans and advances with non-expired EBA-compliant moratoria: Total n/a Total Loans and advances with non-expired EBA-compliant moratoria F 91.01 0010 0010
Loans and advances with non-expired EBA-compliant moratoria: HHs n/a Ratio Households (A) / Total Loans and advances with non-expired EBA-compliant moratoria (B) F 91.01 0020 0010 F 91.01 0010 0010
Loans and advances with non-expired EBA-compliant moratoria: NFCs n/a Ratio NFCs (A) / Total Loans and advances with non-expired EBA-compliant moratoria (B) F 91.01 0040 0010 F 91.01 0010 0010
Loans and advances with non-expired EBA-compliant moratoria: Stage 2 n/a Ratio Stage 2 (A) / Total Loans and advances with non-expired EBA-compliant moratoria (B) F 91.01 0010 0050 F 91.01 0010 0010
Loans and advances with non-expired EBA-compliant moratoria: Non-performing n/a Ratio Non-performing (A) / Total Loans and advances with non-expired EBA-compliant moratoria (B) F 91.01 0010 0060 F 91.01 0010 0010
Loans and advances with non-expired EBA-compliant moratoria: Coverage of NPLs
n/a Ratio Coverage of NPLs (A) / Non-performing (B) F 91.01 0010 0150 F 91.01 0010 0060
Loans and advances with expired EBA-compliant moratoria: Total n/a Ratio Total Loans and advances with expired EBA-compliant moratoria F 91.03 0010 0010
Loans and advances with expired EBA-compliant moratoria: HHs n/a Ratio Households (A) / Total Loans and advances with expired EBA-compliant moratoria (B) F 91.03 0020 0010 F 91.03 0010 0010
Loans and advances with expired EBA-compliant moratoria: NFCs n/a Ratio NFCs (A) / Total Loans and advances with expired EBA-compliant moratoria (B) F 91.03 0040 0010 F 91.03 0010 0010
Loans and advances with expired EBA-compliant moratoria: Stage 2 n/a Ratio Stage 2 (A) / Total Loans and advances with expired EBA-compliant moratoria (B) F 91.03 0010 0040 F 91.03 0010 0010
Loans and advances with expired EBA-compliant moratoria: Non-performing n/a Ratio Non-performing (A) / Total Loans and advances with expired EBA-compliant moratoria (B) F 91.03 0010 0050 F 91.03 0010 0010
Loans and advances with expired EBA-compliant moratoria: Coverage of NPLs n/a Ratio Coverage of NPLs (A) / Non-performing (B) F 91.03 0010 0120 F 91.03 0010 0050
Loans subject to PGS: newly originated n/a Total loans subject to PGS F 90.03 0010 0030
Loans subject to PGS: residual maturity <= 6 months n/a Ratio Residual maturity <= 6 months (A) / Total loans subject to PGS (B) F 90.03 0010 0050 F 90.03 0010 0030
Loans subject to PGS: residual maturity > 6 months <= 12 months n/a Ratio Residual maturity > 6 months <= 12 months (A) / Total loans subject to PGS (B) F 90.03 0010 0060 F 90.03 0010 0030
Loans subject to PGS: residual maturity > 1 year <= 2 years n/a Ratio Residual maturity > 1 year <= 2 years (A) / Total loans subject to PGS (B) F 90.03 0010 0070 F 90.03 0010 0030
Loans subject to PGS: residual maturity > 2 years <= 5 years n/a Ratio Residual maturity > 2 years <= 5 years (A) / Total loans subject to PGS (B) F 90.03 0010 0080 F 90.03 0010 0030
Loans subject to PGS: public guarantee received n/a Ratio Guarantee received (A) / Total loans subject to PGS (B) F 91.05 0010 0150 F 90.03 0010 0030
Loans subject to PGS: classified as stage 2 n/a Ratio Loans subject to PGS classified as stage 2 (A) / Total loans subject to PGS (B) F 91.05 0010 0040 F 90.03 0010 0030
Loans subject to PGS: non-performing loans n/a Ratio Non-performing loans subject to PGS (A) / Total loans subject to PGS (B) F 91.05 0010 0050 F 90.03 0010 0030
Loans subject to PGS: coverage ratio of non-performing loans subject to PGS n/a Ratio Accumulated impairment, accumulated negative changes in fair value due to credit risk of non-performing loans subject to PGS (A) / Non-performing loans subject to PGS (B)
F 91.05 0010 0120 F 91.05 0010 0050
(2) For the calculation of the average the previous December figure is used as an “anchor” for the subsequent year, and the second the number is taken from the latest quarter observation, i.e. Q1, Q2, Q3 or Q4.(3) Applicable only to IFRS reporting banks.(4) The formula presented in this document for this risk indicator differs from the formula presented in the EBA list of risk indicators published on the EBA website, which will be subject to future revision.
(1) The data points refer to the latest version of either FINREP tables ("F") or COREP tables ("C") (http://www.eba.europa.eu/regulation-and-policy/supervisory-reporting/implementing-technical-standard-on-supervisory-reporting). For more information regarding the Risk Indicators formulas, applicable to each reporting framework, please see the List and Methodological Guide available here (http://www.eba.europa.eu/risk-analysis-and-data/risk-indicators-guide).
