risk-benefit analysis : maintaining essential rmncah
TRANSCRIPT

Risk-Benefit Analysis : Maintaining Essential RMNCAH
Services vs. Risk of Covid-19 Infection
Comparison of lives saved through continued provision of
essential services vs. lives lost due to increased exposure to the virus
1. Mitigation strategies
❖ WHO June 2020 guidance document + country-defined
2. Estimation of lives saved maintaining essential services
❖ Using LiST /Spectrum
❖ Required: Estimates of impact of mitigation strategies on coverage
(and effectiveness) of essential interventions
3. Estimation of lives lost through increased risk of infection
❖ Required: Estimates of impact of mitigation strategies on risk of COVID-transmission
❖ Risk to patient, caregiver (for children), and health care provider
❖ Methodology example: LSHTM - Risk-benefit analysis immunization

Analysis Steps
1. Determine interventions/intervention packages to include
2. Determine original coverage
3. Figure out impact of COVID on coverage of different interventions/intervention packages
4. Establish mitigation strategies
5. Estimate impact of mitigation strategies on coverage (also added risk of COVID transmission for
health worker and client)
6. Calculate number of lives saved through improved coverage (using LiST Tool)
7. Carry out COVID risk analysis to estimate number of lives lost in maintaining coverage of essential services
8. Calculate benefit-risk ratios

Step 1. Determine Packages/Interventions to Include in Analysis
Breastfeeding
Complementary feeding - Education only
Complementary feeding - Supplementary feeding + Education
BCG - Single dose
Polio - Three doses
Pentavalent
DPT - Three doses
Hib - Three doses
HepB - Three doses
Pneumococcal - Three doses
Rotavirus - Two doses
Meningococcal A - Single dose
Malaria vaccine - Three doses
Measles - Single dose
Vitamin A supplementation
Zinc supplementation
ORS - Oral Rehydration Solution
Antibiotics for treatment of dysentery
Zinc for treatment of diarrhea
Oral antibiotics for pneumonia
Vitamin A for treatment of measles
ACTs - Artemisinin compounds for treatment of malaria
SAM - treatment for severe acute malnutrition
MAM - treatment for moderate acute malnutrition
Improved sanitation - Utilization of latrines
Improved water source
Improved water source - Water connection in the home
Hand washing with soap
Hygienic Disposal of Children's stool
ITN
Folic acid supplementation/fortification
Safe abortion services
Post abortion case management
Ectopic pregnancy case management
Blanket iron supplementation/fortification
Breastfeeding
Vaccines
Child Health
Malnutrition
Other
FP - Pills
FP - Condoms
FP - Injectables
FP - Implants
FP - IUD
FP - Female Sterilization
FP - Male Sterilization
FP - Traditional Methods
TT - Tetanus toxoid vaccination
IPTp - Intermittent preventive treatment of malaria during pregnancy
Syphilis detection and treatment
Calcium supplementation
Iron supplementation in pregnancy
Multiple micronutrient supplementation in pregnancy
Balanced energy supplementation
Hypertensive disorder case management
Diabetes case management
Malaria case management
MgSO4 management of pre-eclampsia
PMTCT - Prevention of Mother-to-Child Transmission
Clean birth practices
Immediate assessment and stimulation
Labor and delivery management
Neonatal resuscitation
Antenatal corticosteroids for preterm labor
Antibiotics for pPRoM
MgSO4 management of eclampsia
AMTSL - Active management of the third stage of labor
Induction of labor for pregnancies lasting 41+ weeks
Maternal sepsis case management
Clean Postnatal Practices
Chlorhexidine
Case management of premature babies
Thermal care
Kangaroo-Mother Care (KMC)
Full supportive care of prematurity
Case management of neonatal sepsis/pneumonia
Oral antibiotics
Injectable antibiotics
Full supportive care
Family Planning
Antenatal Care
Delivery Care
Newborn Care
Packages/Interventions Included in LiSTImpact Model
Make freestanding intervention
Take out of package

Step 2+3. Determine Coverage pre-COVID and with COVID
❖ Determine original coverage for key interventions
❖ Either from national documents or extract from Spectrum/LiST model
❖ Figure out coverage reduction/disruption under COVID
❖ HMIS data
❖ For packages such as FP, antenatal care, etc. % reduction can be
applied to all sub-interventions (e.g. folic acid supplementation, syphilis
testing, etc.)
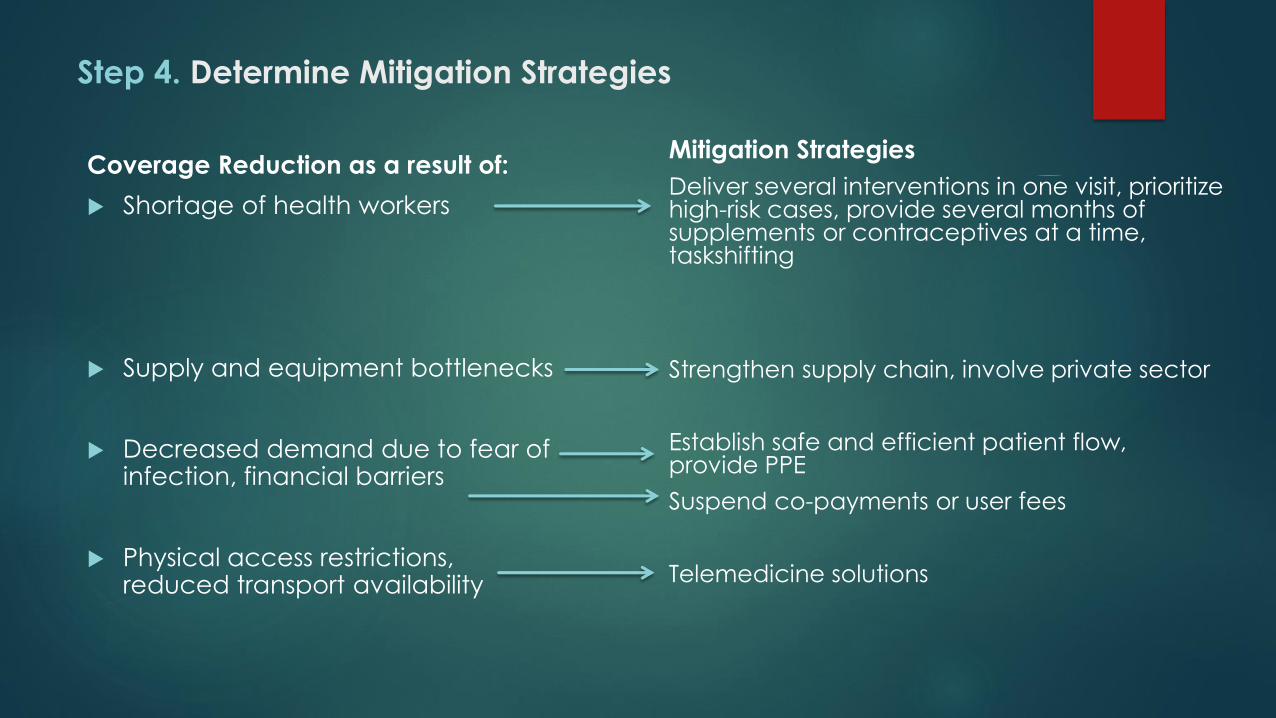
Step 4. Determine Mitigation Strategies
Coverage Reduction as a result of:
Shortage of health workers
Supply and equipment bottlenecks
Decreased demand due to fear of infection, financial barriers
Physical access restrictions, reduced transport availability
Mitigation Strategies
Deliver several interventions in one visit, prioritize high-risk cases, provide several months of supplements or contraceptives at a time, taskshifting
Strengthen supply chain, involve private sector
Establish safe and efficient patient flow, provide PPE
Suspend co-payments or user fees
Telemedicine solutions

Step 5. Estimate impact of mitigation strategies on coverage
and COVID transmission risk
Example Antenatal Care:
Reduce required number of ANC visits, provide all relevant care in those reduced visits, provide woman with several months of micronutrient supplements at a time
Impact on coverage:
Maintains pre-COVID coverage
Impact on effectiveness:
Might keep effectiveness of ANC about the same
Impact on risk of COVID transmission:
Redudes transmission risk as it reduces required number of trips to the health facility and contacts with a health care provider, reducing risk of transmission and risk of COVID mortality among pregnant women and health care providers

Step 6. Calculate number of lives saved through improved
coverage
All calculations in Excel except for this step
Use of Spectrum/LiST tool to calculate number of lives saved
Since LiST data entry relatively complex, Excel model will prep and
arrange data so they can easily be copied into the LiSt tool (below)
LiST results copied back into Excel model
2020 With
COVID
After
Mitigation
TT - Tetanus toxoid vaccination 76.5 61.2
IPTp - Intermittent preventive treatment of malaria during pregnancy 0.0 0.0
Syphilis detection and treatment 13.8 11.0
Calcium supplementation 0.0 0.0
Iron supplementation in pregnancy 19.3 15.4
Multiple micronutrient supplementation in pregnancy 0.0 0.0
Balanced energy supplementation 0.0 0.0
Hypertensive disorder case management 48.4 38.7
Diabetes case management 18.2 14.6
Malaria case management 54.2 43.4
MgSO4 management of pre-eclampsia 14.3 11.4
PMTCT - Prevention of Mother-to-Child Transmission 0.0 0.0
Antenatal Care

Step 7. Calculate number of lives lost through excess COVID
transmission risk
Excess Risk
Additional infections/deaths among households that are
attributable to a health facility visit, that would not have occurred during the course of the epidemic if not for the visit to the health
facility.
Excel model based on Abbas K. et al. 2020. Benefit-risk analysis of
health benefits of routine childhood immunisation against the
excess risk of SARS-CoV-2 infections during the COVID-19 pandemic
in Africa. The Lancet Global Health.

Step 7. Calculate number of lives lost through excess COVID
transmission risk Excess Risk Calculation
Country
Variable Mean Min Max Comment
Number of children receiving vaccination/adults receiving
health intervention xI
20,000 20,000 20,000
Number of visits for vaccination/health intervention x v 1 1 3
Reproduction number for SARS-CoV2 R0 2.5 1.6 3.6Expected number of cases directly generated by one case in a
population where all individuals are susceptible to infection
Duration of period at risk (in months) T 6 5 6
Length of community spread. After this period, between 40% and
70% of the population will have been infected (corresponds to
herd immunity required for R0 between 1.6 and 3.6
Proportion of SARS-CoV2 infected population at end of risk
periodΘ 60% 38% 72%
Duration of infectiousness (day) Ψ7 4 11
Number of days an infected individual spreads the virus on
average
Risk ratio of a vaccinator being infected and infectious vs.
another community memberl1 2.5 1 4
Higher risk of being infected (between 1 and 4 times) because of
higher frequency of exposure to other people
Community member: 6 contacts per day
Vaccinator: 21 potentially infectious contacts per day
Risk ratio potentially infectious contact of a vaccinator
transmitting vs. another community memberl2 0.62 0.25 1
Lower risk of onward transmission (between 0.25 and 1 times)
because most of their contacts with vaccinees are brief, and
they have enhanced risk awareness and use corresponding
protective measures including basic respiratory hygiene and
personal protective equipment as available
Average number of transmission-relevant contacts of a
community member per day N 6 2 10
Number of non-vaccinator contacts of child and carer during
their travel to the vaccine clinic and in the waiting roomn 5.5 1 10
Prevalence among community members on any given day
(ΘΨ / T)po 2.3% 1.0% 4.4%
Assumes reasonably flat epidemic curve, total cases spread out
over months of community spread as specified above
Prevalence among health care provider on any given day (
l1xpo)pv 5.8% 1.0% 17.6%
Higher risk due to increased number of potentially infectious
contacts
Probability of transmission given potentially infectious contact
with community members (R0/NΨ)t0 6.0% 20.0% 3.3% General risk of acquiring infection in the community
Probability of transmission given potentially infectious contact
with vaccinators (l2xt0)tv 3.7% 5.0% 3.3%
For vaccination visits (child + caretaker):
Probability for a SARS-CoV-2 infection for the whole household
of a child who gets vaccinated P 2.0% 0.001 0.032
One minus the probability of either the infant or the mother not
being infected by either the vaccinator or anyone else on any of
the vaccination visits
Probability for excess SARS-CoV-2 infection for the whole
household of a child who gets vaccinated (Px (1-Θ))PECHild 0.8% 0.001 0.009
Probability of facility-visit related infection x Percent of
population who has not gotten infected at the end of the risk
period
For adult visits:
Probability for a SARS-CoV-2 infection for the whole household
of an adult seeking carePE 1.0% 0.001 0.017
One minus the probability of the adult not being infected by
either the health care provider or anyone else on the visit or visits
to the health facility
Probability for excess SARS-CoV-2 infection for the whole
household of an adult seeking care (Px (1-Θ))PEAdult 0.4% 0.000 0.005
Infection rate within household 100%
Assumption that if either child or caretaker gets infected they will
infect all other household members, owing to the high secondary
attack rates observed for family gatherings
Infection fatality rate
Children (aged <20) P 0.00161% 0.00019% 0.00586%
Adults (aged 20-59) P 0.08464% 0.03936% 0.15629%
Older adults (60+) P 3.28379% 1.73737% 5.53980%
Household Age Distribution
Average Household Size 6.6 2017-18 DHS
Children (aged <20) 3.3 2017-18 DHS
Adults (aged 20-59) 2.9 2017-18 DHS
Older adults (60+) 0.4 2017-18 DHS
Mean Min Max
Number of Excess Infections due to vaccination 1053 85 1,171
Number of Excess Deaths due to vaccination 2.8 0.1 5.2
Number of Excess Infections due to adult facility visit 529 42 93
Number of Excess Deaths due to adult facility visit 2.8 0.1 5.2
Additional infections/deaths among households that are attributable to a vaccination visit/adult visit to a health facility, that would not have
occurred during the course of the epidemic if not for vaccination/adult visit to a health facility.
Based on Verity R, Okell LC, Dorigatti I, et al. Estimates of the
severity of coronavirus disease 2019: a model-based analysis.
Lancet Infect Dis 2020; published online March 30.
DOI:10.1016/S1473-3099(20)30243-7.
Based on: Abbas K. et al. 2020. Benefit-risk analysis of health benefits of routine childhood immunisation against the excess risk of SARS-CoV-2 infections during the COVID-19
pandemic in Africa. The Lancet Global Health doi: 10.1016/S2214-109X(20)30308-9
Pakistan
Additional risk of
infection incurred
traveling to clinic,
waiting at clinic and
interacting with
health care worker
Also additional risk
incurred by health
care worker
providing the
intervention
Depending on
community
prevalence and
mitigation strategies
in place

Step 8. Calculate benefit-risk ratios
Morocco
Lives
Saved
through
Mitigation
Measures
Lives Lost
through
Added
COVID
Infections
Benefit-
Risk Ratio
Family Planning 8 (4) 2.1
Antenatal Care 64 (4) 17.5
Delivery Care 261 (9) 28.6
Newborn Care 1,125 (8) 145.1
Breastfeeding -- -- --
Vaccines 212 (74) 2.8
Child Health 50 (6) 8.7
TOTAL 1,720 (105) 16.5

Key Findings Across Countries
Overall Benefit-Risk Ratio across countries between 11.7 and 79.2, i.e. for every 11.7 to 79.2 livesgained due to increased RMNCA coverage, there was one excess COVID death.
More specifically, for all countries and for all health packages, the benefit risk ratio was (in manycases significantly) above 1, i.e.,maintaining services saved more lives than were lost due to additionaldeaths caused by COVID acquired during contacts with the health system.
The number of lives saved depended on a large number of factors and their interactions, mainly:
❖ Interventions included (the more highly effective RMNCAH interventions included, the higher the impact)
❖ Baseline coverage (the lower the initial coverage, the lower the impact of disruption and recovery)
❖ Coverage disruption (the higher the initial disruption, the more impactful the potential recovery)
❖ Number and impact of mitigation measures
❖ HH size and age structure of population (COVID assumed to spread within family, older population suffering much higher fatality than children and younger adults)

High-Impact RMNACH Interventions
Health Packages with the Highest Benefit-Risk Ratios:
❖ Breastfeeding (low number of contacts with health system, extremely effective intervention, long-termimpacts (1-2 years), large number of lives saved)
❖ Newborn care (highly effective interventions such as clean delivery care, newborn resuscitation andtreatment of newborn sepsis/pneumonia)
❖ Delivery care (AMTSL, C-section and assietd vaginal delivery saving many lives)
Health Packages with Lower, but Still Positive Benefit-Risk Ratios:
❖ Child Health (in particular, when high-impact interventions such as ORS, ARI treatment included)
❖ Antenatal Care (main impact seen when tetanus toxid coverage is restored, many lives saved due to timelyrecognition of pregnancy complications not capcturd here, but under delivery and EmOC care)
❖ Vaccine (assumption that vaccination disruption is temporary, impact only calculated for one year, in whichexisting herd immunity does still provide protection, important that vaccination catch up after interruption)
❖ Family Planning – main impact on number of birth and pregnancies, not deaths

Mitigation Measures
Mitigation Measures Reducing Transmission Risk
❖ Some empirical studies available on effectiveness of mitigation measures, but wide range of estimates
❖ Most effective: Hygiene and social distancing measures, in particular masks and PPE with training ofhealth care providers in correct usage
❖ Also effective: Move to e-/telehealth and move of selected services to community level/outreach teams
Mitigation Measures Improving Coverage
❖ No empirical, published data available at all
❖ Effort to try and err on the conservative side when estimating impact
❖ Total impact capped so WITH mitigation coverage did not exceed original baseline coverage by more than2%
❖ Most measures working through restoration of confidence of population in safety of health facility visits
❖ Some measures increasing coverage through the fixing of supply side shortages (staff, supplies)
❖ Impact of any individual measures usually in the 1-5% range

Limitations of Risk-Benefit Exercise
Recent and constantly shifting nature of the COVID-19 pandemic (second, third waves,
new strains of the virus, vaccine development) makes estimates and predictions difficult
Limited empirical evidence available to support estimates for the impact of mitigation
measures on reduced transmission of COVID-19
No evidence to support estimates for the impact of mitigation measures on increased
coverage. These estimates must be communicated with this caution
HMIS data of varying quality, problem of delayed or missing data, no data for breastfeeding
New application of the LiST model (previously only used for gradual scale-up of coverage,
never for disruption)
LiST model only capable of producing annual estimates, which complicates what can be
modeled