risk-based return on sales (ros) as a tool for complex ... · michael burton, director of...
TRANSCRIPT

© 2010 TASC, [email protected] © 2010 TASC, Inc.
SCEA/ISPA ConferenceSCEA/ISPA Conference0808--11 June 201011 June 2010
Peter J. Braxton, Technical FellowPeter J. Braxton, Technical FellowRichard L. Coleman, Director of Cost and Richard L. Coleman, Director of Cost and
Risk AnalysisRisk AnalysisMichael Burton, Director of Contracts, Michael Burton, Director of Contracts,
Northrop Grumman ShipbuildingNorthrop Grumman Shipbuilding
Risk-Based Return OnSales (ROS) As a Tool For
Complex Contract Negotiations
Presented at the 2010 ISPA/SCEA Joint Annual Conference and Training Workshop - www.iceaaonline.com

© 2010 TASC, [email protected]
Contract Negotiations – Government and Contractor Views
Risk-Based Return On Sales (ROS)1 Recap– Four main Contract Types as functions that map Cost to Profit,
Price, and ROS– Analytical and empirical methods for determining distributions– Incorporation of terms and conditions (Ts & Cs)
Contract Negotiations Scenario
Risk-Based ROS Negotiations Tool
Exploring the Scenario
Bottom Line
Outline
2
1. Risk-Based Return On Sales (ROS) for Proposals with Mitigating Terms and Conditions, P.J. Braxton, R.L. Coleman, E.R. Druker, B.L. Cullis, C.M. Kanick, A.V. Bapat, J.M. Callahan, B.P. Caccavale, SCEA/ISPA 2009.
Presented at the 2010 ISPA/SCEA Joint Annual Conference and Training Workshop - www.iceaaonline.com

© 2010 TASC, [email protected]
Contract Price is of paramount importance– Translates directly to cost to the government
– Measured against budgets– Combines with other costs to make up total phase costs
– Program Management Office (PMO)– Government-Furnished Equipment (GFE)– Other Government Costs (OGCs)
Final Contract Price ultimately matters, but budget constraints may drive Target Price– This is the price the government fools themselves into believing
they might actually pay– Critical issue for commodities requiring “full funding”
Shareline and Ceiling Price are viewed as devices to magically control cost
Fee is viewed as a necessary evil of capitalism– Various degrees of appreciation for the health of the industrial
base – generally reactive more than proactive
Contract Negotiations – Government View
3
Presented at the 2010 ISPA/SCEA Joint Annual Conference and Training Workshop - www.iceaaonline.com

© 2010 TASC, [email protected]
(1) Target Cost– If you don’t get Target Cost right, you’re “mis-calibrated”– “You can’t manage your way out of a bad deal”
(2) Target Fee– This is what makes the company profitable and makes the
owners / shareholders happy– Needs to be enough to be sufficient after erosion
– ROS (expected not bid!) measured against corporate hurdle rate
(3) Shareline– Determines how quickly things get worse from a profit
perspective
(4) Ts & Cs– Provide protection against factors “out of our control”– Not going to make you well if you got #1-3 wrong!
Contract Negotiations – Contractor View
4
Presented at the 2010 ISPA/SCEA Joint Annual Conference and Training Workshop - www.iceaaonline.com
© 2010 TASC, [email protected]
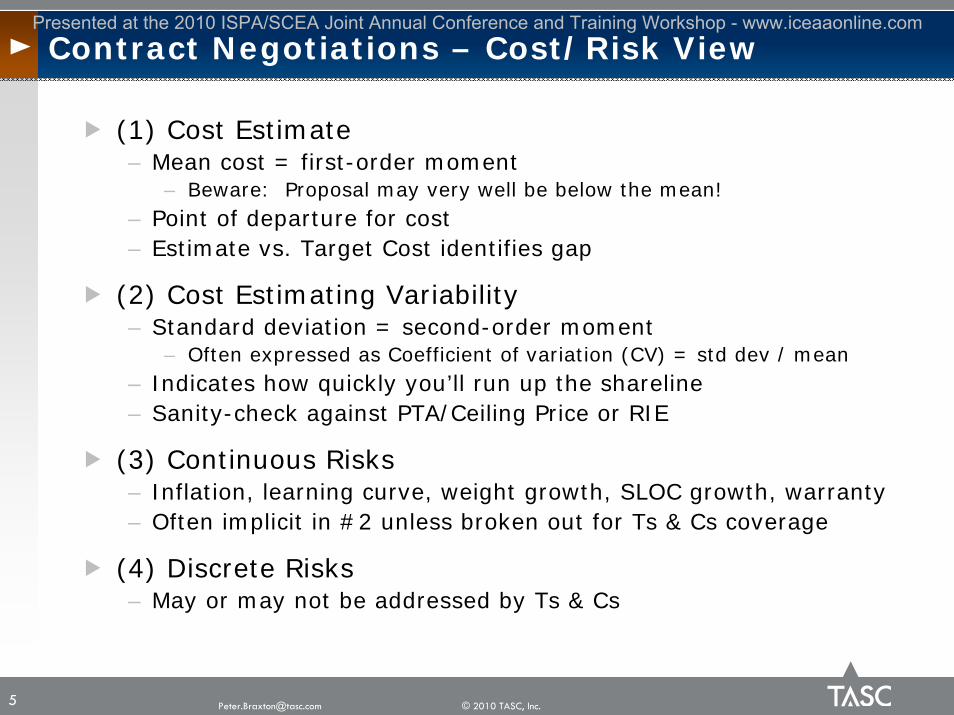
(1) Cost Estimate– Mean cost = first-order moment
– Beware: Proposal may very well be below the mean!– Point of departure for cost– Estimate vs. Target Cost identifies gap
(2) Cost Estimating Variability– Standard deviation = second-order moment
– Often expressed as Coefficient of variation (CV) = std dev / mean– Indicates how quickly you’ll run up the shareline– Sanity-check against PTA/Ceiling Price or RIE
(3) Continuous Risks– Inflation, learning curve, weight growth, SLOC growth, warranty– Often implicit in #2 unless broken out for Ts & Cs coverage
(4) Discrete Risks– May or may not be addressed by Ts & Cs
Contract Negotiations – Cost/Risk View
5
Presented at the 2010 ISPA/SCEA Joint Annual Conference and Training Workshop - www.iceaaonline.com

© 2010 TASC, [email protected]
Four main Contract Types– Firm-Fixed-Price (FFP) [FAR 16.202]– Fixed-Price Incentive (FPI) [FAR 16.204]– Cost-Plus-Incentive-Fee (CPIF) [FAR 16.304]– Cost-Plus-Fixed-Fee (CPFF) [FAR 16.306]
Each Contract Type determines functions that map Cost (X) to:– Profit (Y)=f(X), Price = X+Y, and ROS = Y/(X+Y)
Given a distribution of Cost, can determine distribution of Profit, Price, and ROS– Analytical method, i.e., calculus– Empirical method, i.e., Monte Carlo simulation
Incorporation of terms and conditions (Ts & Cs)– Take some cost risk “off the shareline”
Risk-Based Return On Sales (ROS) Recap
6
Presented at the 2010 ISPA/SCEA Joint Annual Conference and Training Workshop - www.iceaaonline.com

© 2010 TASC, [email protected]
Typical Set of InputsTarget Cost (TC) = $10.0MTarget Profit (Fee) (TF) = $1.0MTarget Price (TP) = $11.0M [all]10% Profit (ROC)9.1% Margin (ROS) [all]70/30 Over-Target Shareline40/60 Under-Target Shareline [CPIF/FPI]Min Fee (mF) = 3%, Max Fee (MF) = 20% [CPIF]Ceiling Price (CP) = 130% [FPI]
Overarching Contract Elements
7
( )over
highCS
mFTFTCRIE −+=
( )under
lowCS
TFMFTCRIE −−=
( )overGSTPCPTCPTA −
+=
Cost Estimating Body of Knowledge (CEBoK), Module 14 Contract Pricing, SCEA, 2009.
Target Cost 10.0$ Target Profit 1.0$ 10.0% Profit PercentTarget Price 11.0$ 9.1% Margin PercentMin Fee 0.3$ 3.0% Min Fee PercentMax Fee 2.0$ 20.0% Max Fee PercentUnder Gov Share 40%Under Cont Share 60%Over Gov Share 70%Over Cont Share 30%PTA 12.9$ Ceiling Price 13.0$ 130.0% Ceiling Price PercentRIE Low 8.3$ RIE High 12.3$
Target Cost 10.0$ Target Profit 1.0$ 10.0% Profit PercentTarget Price 11.0$ 9.1% Margin PercentMin Fee 0.3$ 3.0% Min Fee PercentMax Fee 2.0$ 20.0% Max Fee PercentUnder Gov Share 40%Under Cont Share 60%Over Gov Share 70%Over Cont Share 30%PTA 12.9$ Ceiling Price 13.0$ 130.0% Ceiling Price PercentRIE Low 8.3$ RIE High 12.3$
yellow fill = inputblue fill = calculated
Presented at the 2010 ISPA/SCEA Joint Annual Conference and Training Workshop - www.iceaaonline.com

© 2010 TASC, [email protected]
Percentiles (20/50/80) and mean are shown on graph– Symmetric: Mode = Median = Mean
Distribution of ROS Illustrated – FFP
8
9.1%, 0.5009.1%, 0.500
-2.4%, 0.200
20.6%, 0.800
0.0
0.1
0.2
0.3
0.4
0.5
0.6
0.7
0.8
0.9
1.0
-30% -25% -20% -15% -10% -5% 0% 5% 10% 15% 20% 25% 30% 35% 40% 45% 50%0
CDF (MC 10K)
CDF (MC 100)
CDF (analytical)
key points
PDF (analytical)
Presented at the 2010 ISPA/SCEA Joint Annual Conference and Training Workshop - www.iceaaonline.com

© 2010 TASC, [email protected]
Percentiles (20/50/80) and mean are shown on graph– Skew right: Mode < Median < Mean
Distribution of ROS Illustrated – FPI
9
10.9%, 0.581
9.1%, 0.500
5.2%, 0.200
16.7%, 0.800
0.0
0.1
0.2
0.3
0.4
0.5
0.6
0.7
0.8
0.9
1.0
-20% -15% -10% -5% 0% 5% 10% 15% 20% 25% 30% 35% 40%0.0
MC (10K)
MC (100)
CDF (analytical)
key points
PDF (analytical)
Larger Contractor Share stretches out
distribution
Smaller Contractor Share bunches up
distribution
Discontinuity at change in shareline slope (Cost = TC)
Distribution stretches out the most past PTA (unfavorable)
Presented at the 2010 ISPA/SCEA Joint Annual Conference and Training Workshop - www.iceaaonline.com

© 2010 TASC, [email protected]
Percentiles (20/50/80) and mean are shown on graph– Skew right: Mode < Median < Mean
Distribution of ROS Illustrated – CPIF
10
10.6%, 0.570
9.1%, 0.500
5.2%, 0.200
16.7%, 0.800
0.0
0.1
0.2
0.3
0.4
0.5
0.6
0.7
0.8
0.9
1.0
-20% -15% -10% -5% 0% 5% 10% 15% 20% 25% 30% 35% 40%0.0
MC (10K)
MC (100)
CDF (analytical)
key points
PDF (analytical)
Distribution bunches up above Max Fee
Between Min and Max Fee, identical to FPI!
Distribution bunches up the most below Min Fee
Presented at the 2010 ISPA/SCEA Joint Annual Conference and Training Workshop - www.iceaaonline.com

© 2010 TASC, [email protected]
Percentiles (20/50/80) and mean are shown on graph– Skew right: Mode < Median < Mean
Distribution of ROS Illustrated – CPFF
11
9.3%, 0.553
9.1%, 0.500
8.2%, 0.200
10.3%, 0.800
0.0
0.1
0.2
0.3
0.4
0.5
0.6
0.7
0.8
0.9
1.0
6% 7% 8% 9% 10% 11% 12% 13% 14% 15% 16% 17%0
CDF (MC 10K)
CDF (MC 100)
CDF (analytical)
key points
PDF (analytical)
Presented at the 2010 ISPA/SCEA Joint Annual Conference and Training Workshop - www.iceaaonline.com

© 2010 TASC, [email protected]
0.0
0.1
0.2
0.3
0.4
0.5
0.6
0.7
0.8
0.9
1.0
-20.00% -15.00% -10.00% -5.00% 0.00% 5.00% 10.00% 15.00% 20.00% 25.00% 30.00% 35.00% 40.00%
CPFF CPIF FPI FFP
Distribution of ROS – Contract Types Comparison
12
Range of share ratios generates a “pinwheel”
between CPFF (100/0) and FFP (0/100)
Past PTA stretches the pinwheel
Past Min/Max Fee truncates the pinwheel
Pinwheel is asymmetric (except for FFP)
Presented at the 2010 ISPA/SCEA Joint Annual Conference and Training Workshop - www.iceaaonline.com

© 2010 TASC, [email protected]
Sole-source negotiation
FPI contract type– CPIF would behave similarly within the RIE
Government and contractor agree to disagree on distribution of cost– Mean and standard deviation
Contract Negotiations Scenario
13
Presented at the 2010 ISPA/SCEA Joint Annual Conference and Training Workshop - www.iceaaonline.com

© 2010 TASC, [email protected]
Fixed Price Incentive Firm (FPIF)
Target Cost (TC) = $10.0MTarget Profit (Fee) (TF) = $1.0MTarget Price (TP) = $11.0M
10% Profit (ROC)9.1% Margin (ROS) [all]
70/30 Over-Target Shareline40/60 Under-Target Shareline
Ceiling Price (CP) = 130% [FPI]
Contract Negotiations Scenario
14
( )overGSTPCPTCPTA −
+=
yellow fill = inputblue fill = calculated
Target Cost 10.0$ Target Profit 1.0$ 10.0% Profit PercentTarget Price 11.0$ 9.1% Margin PercentUnder Gov Share 40%Under Cont Share 60%Over Gov Share 70%Over Cont Share 30%PTA 12.9$ Ceiling Price 13.0$ 130.0% Ceiling Price Percent
Target Cost 10.0$ Target Profit 1.0$ 10.0% Profit PercentTarget Price 11.0$ 9.1% Margin PercentUnder Gov Share 40%Under Cont Share 60%Over Gov Share 70%Over Cont Share 30%PTA 12.9$ Ceiling Price 13.0$ 130.0% Ceiling Price Percent
Presented at the 2010 ISPA/SCEA Joint Annual Conference and Training Workshop - www.iceaaonline.com

© 2010 TASC, [email protected]
FPI – Pathological Cases
15
0.0
0.1
0.2
0.3
0.4
0.5
0.6
0.7
0.8
0.9
1.0
-20.00% -15.00% -10.00% -5.00% 0.00% 5.00% 10.00% 15.00% 20.00% 25.00% 30.00% 35.00% 40.00%
base case
padded cost
aggressive cost
understated variability
Aggressive cost and understated variability have similar impact on
20th percentile
PTA TC
Presented at the 2010 ISPA/SCEA Joint Annual Conference and Training Workshop - www.iceaaonline.com

© 2010 TASC, [email protected]
Quad chart dashboard– Upper left: Contract Geometry
– Key points highlighted (Target Cost, PTA)– The function which enables mapping of Cost
– Lower left: Distribution of Cost– CDF and PDF views– Output of cost estimating process (proposal/ICE and POE/ICE)
– Upper right: Distribution of Price– What the government cares about – compare with Budget
– Lower right: Distribution of ROS– What the contractor cares about – compare with hurdle rate
Enables common view – Graphical depiction produces more clear and intuitive results
Let’s go to the Excel!
Risk-Based ROS Negotiations Tool
16
Presented at the 2010 ISPA/SCEA Joint Annual Conference and Training Workshop - www.iceaaonline.com

© 2010 TASC, [email protected]
Risk-Based ROS Negotiations Tool
17
TC10.0$ TF
10.0%GS‐u40.0%GS‐o70.0%CP
130.0%
mean10.0$ CV
15.0%
$10.0 , $11.0
$12.9 , $13.0
$10.0 , $1.0
$12.9 , $0.1
9.1%
1.1%
‐10.0%
‐5.0%
0.0%
5.0%
10.0%
15.0%
20.0%
25.0%
30.0%
35.0%
40.0%
$(5.0)
$‐
$5.0
$10.0
$15.0
$20.0
$5.0 $6.0 $7.0 $8.0 $9.0 $10.0 $11.0 $12.0 $13.0 $14.0 $15.0 Cost
Contract Geometry ‐ FPI
Price Profit Margin Percent
$10.0
$11.3
$8.7
$10.0 , 0.5
0.00
0.10
0.20
0.30
0.40
0.50
0.60
0.70
0.80
0.90
1.00
$5.0 $6.0 $7.0 $8.0 $9.0 $10.0 $11.0 $12.0 $13.0 $14.0 $15.0 Cost
Cost Distribution
20th percentile50th percentile80th percentilemean
$10.5
$11.0
$11.9
51.81%
$11.05 0.00
0.10
0.20
0.30
0.40
0.50
0.60
0.70
0.80
0.90
1.00
$5.0 $6.0 $7.0 $8.0 $9.0 $10.0 $11.0 $12.0 $13.0 $14.0 $15.0 Cost
Price Distribution
20th percentile50th percentile80th percentilemean
cdf
5.2%
9.1%
16.7%
58.12%
10.9%0.00
0.10
0.20
0.30
0.40
0.50
0.60
0.70
0.80
0.90
1.00
‐20.0%‐15.0%‐10.0%‐5.0% 0.0% 5.0% 10.0%15.0%20.0%25.0%30.0%35.0%40.0%Cost
ROS Distribution
20th percentile50th percentile80th percentilemean
cdf
hurdle rate
Presented at the 2010 ISPA/SCEA Joint Annual Conference and Training Workshop - www.iceaaonline.com

© 2010 TASC, [email protected]
Vary parameters one at a time– Essentially sensitivity analysis
Two major inputs:– Contract geometry
– This is the subject of the negotiations
– Probabilistic cost estimate– This is the subject of the reconciliation
Ts & Cs treated offline in Monte Carlo simulation– After inputs have been refined using the tool
Exploring the Scenario
18
Presented at the 2010 ISPA/SCEA Joint Annual Conference and Training Workshop - www.iceaaonline.com

© 2010 TASC, [email protected]
Contractor Initial Position
19
TC12.0$ TF
18.0%GS‐u70.0%GS‐o85.0%CP
135.0%
mean11.5$ CV
15.0%
$12.0 , $14.2
$14.4 , $16.2
$12.0 , $2.2 $14.4 , $1.8
15.3%
11.1%
‐10.0%
‐5.0%
0.0%
5.0%
10.0%
15.0%
20.0%
25.0%
30.0%
35.0%
40.0%
$(5.0)
$‐
$5.0
$10.0
$15.0
$20.0
$5.0 $6.0 $7.0 $8.0 $9.0 $10.0 $11.0 $12.0 $13.0 $14.0 $15.0 Cost
Contract Geometry ‐ FPI
Price Profit Margin Percent
$11.5
$13.0
$10.0
$11.5 , 0.5
0.00
0.10
0.20
0.30
0.40
0.50
0.60
0.70
0.80
0.90
1.00
$5.0 $6.0 $7.0 $8.0 $9.0 $10.0 $11.0 $12.0 $13.0 $14.0 $15.0 Cost
Cost Distribution
20th percentile50th percentile80th percentilemean
$12.7
$13.8 48.46%
$13.76 0.00
0.10
0.20
0.30
0.40
0.50
0.60
0.70
0.80
0.90
1.00
$5.0 $6.0 $7.0 $8.0 $9.0 $10.0 $11.0 $12.0 $13.0 $14.0 $15.0 Cost
Price Distribution
20th percentile50th percentile80th percentilemean
cdf
13.4%
16.7%
21.7%
54.94%
17.4%0.00
0.10
0.20
0.30
0.40
0.50
0.60
0.70
0.80
0.90
1.00
‐20.0%‐15.0%‐10.0%‐5.0% 0.0% 5.0% 10.0%15.0%20.0%25.0%30.0%35.0%40.0%Cost
ROS Distribution
20th percentile50th percentile80th percentilemean
cdf
hurdle rate
Presented at the 2010 ISPA/SCEA Joint Annual Conference and Training Workshop - www.iceaaonline.com

© 2010 TASC, [email protected]
Government Initial Position
20
TC10.0$ TF
13.0%GS‐u90.0%GS‐o50.0%CP
125.0%
mean10.0$ CV
30.0%
$10.0 , $11.3 $12.4 , $12.5
$10.0 , $1.3
$12.4 , $0.1
11.5%
0.8%
‐10.0%
‐5.0%
0.0%
5.0%
10.0%
15.0%
20.0%
25.0%
30.0%
35.0%
40.0%
$(5.0)
$‐
$5.0
$10.0
$15.0
$20.0
$5.0 $6.0 $7.0 $8.0 $9.0 $10.0 $11.0 $12.0 $13.0 $14.0 $15.0 Cost
Contract Geometry ‐ FPI
Price Profit Margin Percent
$10.0
$12.5
$7.5
$10.0 , 0.5
0.00
0.10
0.20
0.30
0.40
0.50
0.60
0.70
0.80
0.90
1.00
$5.0 $6.0 $7.0 $8.0 $9.0 $10.0 $11.0 $12.0 $13.0 $14.0 $15.0 Cost
Cost Distribution
20th percentile50th percentile80th percentilemean
$9.0
$11.3
$12.5
39.31%
$10.57 0.00
0.10
0.20
0.30
0.40
0.50
0.60
0.70
0.80
0.90
1.00
$5.0 $6.0 $7.0 $8.0 $9.0 $10.0 $11.0 $12.0 $13.0 $14.0 $15.0 Cost
Price Distribution
20th percentile50th percentile80th percentilemean
cdf
‐0.2%
11.5%
17.2%
43.21%
9.0%0.00
0.10
0.20
0.30
0.40
0.50
0.60
0.70
0.80
0.90
1.00
‐20.0%‐15.0%‐10.0%‐5.0% 0.0% 5.0% 10.0%15.0%20.0%25.0%30.0%35.0%40.0%Cost
ROS Distribution
20th percentile50th percentile80th percentilemean
cdf
hurdle rate
Presented at the 2010 ISPA/SCEA Joint Annual Conference and Training Workshop - www.iceaaonline.com

© 2010 TASC, [email protected]
Contractor Counteroffer
21
TC11.5$ TF
16.0%GS‐u80.0%GS‐o75.0%CP
130.0%
mean11.5$ CV
20.0%
$11.5 , $13.3 $13.6 , $15.0
$11.5 , $1.8 $13.6 , $1.3
13.8%
8.7%
‐10.0%
‐5.0%
0.0%
5.0%
10.0%
15.0%
20.0%
25.0%
30.0%
35.0%
40.0%
$(5.0)
$‐
$5.0
$10.0
$15.0
$20.0
$5.0 $6.0 $7.0 $8.0 $9.0 $10.0 $11.0 $12.0 $13.0 $14.0 $15.0 Cost
Contract Geometry ‐ FPI
Price Profit Margin Percent
$11.5
$13.4
$9.6
$11.5 , 0.5
0.00
0.10
0.20
0.30
0.40
0.50
0.60
0.70
0.80
0.90
1.00
$5.0 $6.0 $7.0 $8.0 $9.0 $10.0 $11.0 $12.0 $13.0 $14.0 $15.0 Cost
Cost Distribution
20th percentile50th percentile80th percentilemean
$11.8
$13.3
$14.8
43.77%
$13.05 0.00
0.10
0.20
0.30
0.40
0.50
0.60
0.70
0.80
0.90
1.00
$5.0 $6.0 $7.0 $8.0 $9.0 $10.0 $11.0 $12.0 $13.0 $14.0 $15.0 Cost
Price Distribution
20th percentile50th percentile80th percentilemean
cdf
9.2%
13.8%
18.9%
46.41%
13.3%0.00
0.10
0.20
0.30
0.40
0.50
0.60
0.70
0.80
0.90
1.00
‐20.0%‐15.0%‐10.0%‐5.0% 0.0% 5.0% 10.0%15.0%20.0%25.0%30.0%35.0%40.0%Cost
ROS Distribution
20th percentile50th percentile80th percentilemean
cdf
hurdle rate
Presented at the 2010 ISPA/SCEA Joint Annual Conference and Training Workshop - www.iceaaonline.com

© 2010 TASC, [email protected]
Government Counteroffer
22
TC10.0$ TF
15.0%GS‐u90.0%GS‐o60.0%CP
130.0%
mean10.5$ CV
25.0%
$10.0 , $11.5 $12.5 , $13.0
$10.0 , $1.5
$12.5 , $0.5
13.0%
3.8%
‐10.0%
‐5.0%
0.0%
5.0%
10.0%
15.0%
20.0%
25.0%
30.0%
35.0%
40.0%
$(5.0)
$‐
$5.0
$10.0
$15.0
$20.0
$5.0 $6.0 $7.0 $8.0 $9.0 $10.0 $11.0 $12.0 $13.0 $14.0 $15.0 Cost
Contract Geometry ‐ FPI
Price Profit Margin Percent
$10.5
$12.6
$8.4
$10.5 , 0.5
0.00
0.10
0.20
0.30
0.40
0.50
0.60
0.70
0.80
0.90
1.00
$5.0 $6.0 $7.0 $8.0 $9.0 $10.0 $11.0 $12.0 $13.0 $14.0 $15.0 Cost
Cost Distribution
20th percentile50th percentile80th percentilemean
$10.1
$11.8
$13.0
38.86%
$11.32 0.00
0.10
0.20
0.30
0.40
0.50
0.60
0.70
0.80
0.90
1.00
$5.0 $6.0 $7.0 $8.0 $9.0 $10.0 $11.0 $12.0 $13.0 $14.0 $15.0 Cost
Price Distribution
20th percentile50th percentile80th percentilemean
cdf
3.0%
11.0%
16.5%
43.82%
9.5%0.00
0.10
0.20
0.30
0.40
0.50
0.60
0.70
0.80
0.90
1.00
‐20.0%‐15.0%‐10.0%‐5.0% 0.0% 5.0% 10.0%15.0%20.0%25.0%30.0%35.0%40.0%Cost
ROS Distribution
20th percentile50th percentile80th percentilemean
cdf
hurdle rate
Presented at the 2010 ISPA/SCEA Joint Annual Conference and Training Workshop - www.iceaaonline.com

© 2010 TASC, [email protected]
Consider Risk and ROS in negotiations– Rigor and quantitative analysis of Cost applied to Contracts
Government and contractor need to understand each other’s perspectives– Primary objectives of affordability and profitability, respectively– Acknowledge other party’s interests without compromising one’s
own
Negotiations are adversarial, but relationship is symbiotic– Money paid to contractors gets reinvested in:
– Economy – via employees, owners/shareholders– Industrial base – via corporate training, retention, facilities– Government – via taxes!
Not that many levers!
Avoid doing something unnatural!– Contract type and geometry should be appropriate– Use government “weighted guidelines” for fee
Bottom Line
23
Presented at the 2010 ISPA/SCEA Joint Annual Conference and Training Workshop - www.iceaaonline.com

© 2010 TASC, [email protected]
Contract Types Overview
Profit, Price, and ROS function for four main Contract Types
Analytical Derivation of ROS distribution– General Approach– Four main Contract Types
Analytical Derivation of Price distribution– FPI
Pathological Cases– Padded cost– Aggressive cost– Understated variability
Appendix
24
Presented at the 2010 ISPA/SCEA Joint Annual Conference and Training Workshop - www.iceaaonline.com

© 2010 TASC, [email protected]
Fixed-Price– Firm-Fixed-Price (FFP) [FAR 16.202]– Fixed-Price Incentive (FPI) [FAR 16.204]
Cost-Reimbursement [FAR 16.3]– Cost-Plus-Incentive-Fee (CPIF) [FAR 16.304]– Cost-Plus-Award-Fee (CPAF) [FAR 16.305]– Cost-Plus-Fixed-Fee (CPFF) [FAR 16.306]
Contract Types vary according to – Degree and timing of the responsibility assumed by the
contractor for the costs– Amount and nature of the profit incentive offered to the
contractor for achieving or exceeding specified standards or goals
We’ll omit CPAF because it is by definition subjective
Contract Types Overview
25
Cost Estimating Body of Knowledge (CEBoK), Module 14 Contract Pricing, SCEA, 2009.
Incentive contracts [FAR
16.4]
ROS could be negative!
ROS strictly positive
Cost + Fee = Price
Price – Cost = Profit
Presented at the 2010 ISPA/SCEA Joint Annual Conference and Training Workshop - www.iceaaonline.com

© 2010 TASC, [email protected]
FFP
$10.0 , $11.0
$10.0 , $1.0
9.1%
$(5.0)
$-
$5.0
$10.0
$15.0
$20.0
$5.0 $6.0 $7.0 $8.0 $9.0 $10.0 $11.0 $12.0 $13.0 $14.0 $15.0
-10.0%
-5.0%
0.0%
5.0%
10.0%
15.0%
20.0%
25.0%
30.0%
35.0%
40.0%
Price Profit Margin Percent
Firm-Fixed-Price (FFP)
26
OVERRUNUNDERRUN
Essentially a 0/100
shareline!
Fixed Price = $11M
Tip: All contract types yield the same Profit ($1M) and Price ($11M) at the Target Cost ($10M)
Cost Estimating Body of Knowledge (CEBoK), Module 14 Contract Pricing, SCEA, 2009.
Contract Data Elements: TP = FFP
ROS goes negative when
Cost exceeds FFP
Mill
ions
Millions
Presented at the 2010 ISPA/SCEA Joint Annual Conference and Training Workshop - www.iceaaonline.com

© 2010 TASC, [email protected]
FPI
$10.0 , $11.0
$12.9 , $13.0
$12.9 , $0.1
$10.0 , $1.0 1.1%
9.1%
$(5.0)
$-
$5.0
$10.0
$15.0
$20.0
$5.0 $6.0 $7.0 $8.0 $9.0 $10.0 $11.0 $12.0 $13.0 $14.0 $15.0
-10.0%
-5.0%
0.0%
5.0%
10.0%
15.0%
20.0%
25.0%
30.0%
35.0%
40.0%
Price Profit Margin Percent
Fixed-Price Incentive (FPI)
27
Under-target shareline Over-target
shareline
“Converts to FFP”after PTA
When Cost = Point of Total Assumption (PTA),
Price = Ceiling Price
OVERRUNUNDERRUN
Cost Estimating Body of Knowledge (CEBoK), Module 14 Contract Pricing, SCEA, 2009.
Contract Data Elements: TC, TP, Sharelines,
Ceiling PriceM
illio
ns
Millions
Presented at the 2010 ISPA/SCEA Joint Annual Conference and Training Workshop - www.iceaaonline.com

© 2010 TASC, [email protected]
CPIF
$12.3 , $12.6 $10.0 , $11.0 $8.3 , $10.3
$12.3 , $0.3
$10.0 , $1.0 $8.3 , $2.0
2.4%
9.1%
19.4%
$(5.0)
$-
$5.0
$10.0
$15.0
$20.0
$5.0 $6.0 $7.0 $8.0 $9.0 $10.0 $11.0 $12.0 $13.0 $14.0 $15.0
-10.0%
-5.0%
0.0%
5.0%
10.0%
15.0%
20.0%
25.0%
30.0%
35.0%
40.0%
Price Profit Margin Percent
Cost-Plus-Incentive Fee (CPIF)
28
OVERRUNUNDERRUN
“Converts to CPFF”when min (or max)
fee reached
Max fee Min fee
Under-target shareline
Over-target shareline
Range of IncentiveEffectiveness (RIE)
Cost Estimating Body of Knowledge (CEBoK), Module 14 Contract Pricing, SCEA, 2009.
Contract Data Elements: TC, TF, Sharelines,
Min/Max Fee
Mill
ions
Millions
Presented at the 2010 ISPA/SCEA Joint Annual Conference and Training Workshop - www.iceaaonline.com

© 2010 TASC, [email protected]
CPFF
$10.0 , $11.0
$10.0 , $1.0
9.1%
$(5.0)
$-
$5.0
$10.0
$15.0
$20.0
$5.0 $6.0 $7.0 $8.0 $9.0 $10.0 $11.0 $12.0 $13.0 $14.0 $15.0
-10.0%
-5.0%
0.0%
5.0%
10.0%
15.0%
20.0%
25.0%
30.0%
35.0%
40.0%
Price Profit Margin Percent
Cost-Plus-Fixed-Fee (CPFF)
29
Fee is a fixed amount…
…but decreasing percentage
Essentially a 100/0
shareline!
OVERRUNUNDERRUN
Cost Estimating Body of Knowledge (CEBoK), Module 14 Contract Pricing, SCEA, 2009.
Contract Data Elements: TC, FF = TF
Mill
ions
Millions
Presented at the 2010 ISPA/SCEA Joint Annual Conference and Training Workshop - www.iceaaonline.com

© 2010 TASC, [email protected]
Profit Compare
$(5.0)
$-
$5.0
$10.0
$5.0 $6.0 $7.0 $8.0 $9.0 $10.0 $11.0 $12.0 $13.0 $14.0 $15.0
CPFF CPIF FPI FFP
Note that CPIF and FPI “go parallel” to CPFF and FFP, respectively
30
Contract Types Comparison – Profit (Y)
CPFF and FFP define the
“envelope” of possible outcomes
Presented at the 2010 ISPA/SCEA Joint Annual Conference and Training Workshop - www.iceaaonline.com

© 2010 TASC, [email protected]
Price Comparison
$(5.0)
$-
$5.0
$10.0
$15.0
$20.0
$5.0 $6.0 $7.0 $8.0 $9.0 $10.0 $11.0 $12.0 $13.0 $14.0 $15.0
CPFF CPIF FPI FFP
Note that CPIF and FPI “go parallel” to CPFF and FFP, respectively
31
Contract Types Comparison – Price (X+Y)
CPFF and FFP define the
“envelope” of possible outcomes
Presented at the 2010 ISPA/SCEA Joint Annual Conference and Training Workshop - www.iceaaonline.com

© 2010 TASC, [email protected]
ROS Compare
-20.0%
-15.0%
-10.0%
-5.0%
0.0%
5.0%
10.0%
15.0%
20.0%
25.0%
30.0%
35.0%
40.0%
$5.0 $6.0 $7.0 $8.0 $9.0 $10.0 $11.0 $12.0 $13.0 $14.0 $15.0
CPFF CPIF FPI FFP
Contract Types Comparison – ROS (Y/(X+Y))
32
CPFF and FFP define the
“envelope” of possible outcomes
Presented at the 2010 ISPA/SCEA Joint Annual Conference and Training Workshop - www.iceaaonline.com

© 2010 TASC, [email protected]
Without Ts and Cs
Transformation of random variables!– We math nerds always get excited about real-world
applications of something we learned in school and thought we’d never use again!
Define random variables:– X = Cost– Y = Profit (Fee) = f(X), where f is determined by contract type
– Bright green line from earlier contract type graphs– Piecewise linear function for all major contract types
(FFP/FPI/CPIF/CPFF)– Monotonically non-increasing function of Cost
– In fact, monotonically decreasing except for CPFF– X+Y = Price
– Monotonically non-decreasing function of Cost– In fact, monotonically increasing except for FFP
– Z = ROS = Y/(X+Y) = 1 - X/(X+Y)– Monotonically decreasing function of Cost (for all contract types)
Distribution of ROS (Analytical)
33
Distributions of Profit, Price, and ROS are continuous but not smooth
at “break points”
Presented at the 2010 ISPA/SCEA Joint Annual Conference and Training Workshop - www.iceaaonline.com

© 2010 TASC, [email protected]
CPFF
7.0%
8.0%
0.9862
0.8439
$13.3
$11.5
0.0%
2.0%
4.0%
6.0%
8.0%
10.0%
12.0%
14.0%
16.0%
$5.0 $6.0 $7.0 $8.0 $9.0 $10.0 $11.0 $12.0 $13.0 $14.0 $15.00
0.25
0.5
0.75
1
Margin Percent Margin Points Cost CDF CDF Points Cost PDF PDF Points
Distribution of ROS – Geometric Interpretation
34
( ) ( ) =≥=≤ MXPZP 3.13$%0.70138.09862.01 =−
( ) =≥≥ MXMP 5.11$3.13$1423.08439.09862.0 =−
( ) =≤≤ %0.8%0.7 ZP
Presented at the 2010 ISPA/SCEA Joint Annual Conference and Training Workshop - www.iceaaonline.com

© 2010 TASC, [email protected]
Using the Cumulative Distribution Function (CDF) and logic (cf. Cadenza)
The formula for g(z) depends on f(X) and hence contract type– Since f(X) is piecewise linear, there’s always a simple solution– We’ll enumerate the solutions for the four basic contract types
The outlined step has interesting conceptual and geometric interpretations– Probability that Profit is less than profit percentage times cost! [slap forehead]– As z goes from 0 to 1, the line y = (z/(1-z))x traces out 90 degrees, starting
from the x-axis and rotating counterclockwise to the y-axis– Intersects the decreasing Profit function further and further to the left– Hence captures a bigger and bigger chunk of the right part of the PDF of cost!
Distribution of ROS – The “Easy Way”
35
( ) ( ) ( ) =⎟⎠⎞
⎜⎝⎛
−≤=⎟
⎠⎞
⎜⎝⎛
−≤+=⎟⎟
⎠
⎞⎜⎜⎝
⎛+
≤−z
zXXfPz
XXfXPXfX
XzP11
1
( ) ( ) ( ) =⎟⎟⎠
⎞⎜⎜⎝
⎛≤
+−=⎟
⎠⎞
⎜⎝⎛ ≤
+=≤= z
xfXXPz
YXYPzZPzFZ 1
( )( ) ( )( ) ( )( )zgFzgXPzgXP X−=≤−=≥ 11
Presented at the 2010 ISPA/SCEA Joint Annual Conference and Training Workshop - www.iceaaonline.com

© 2010 TASC, [email protected]
Using the Probability Density Function (PDF) and Jacobeans (!)
Agrees with PDF derived from CDF from the “Easy Way”– Applying Chain Rule from calculus!
Distribution of ROS – The “Hard Way”
36
( ) ( ) ( )( ) ( ) ( )( ) ( )zgzgpzgzgFzFdzdzp XXZZ ''' ⋅−=⋅−==
Presented at the 2010 ISPA/SCEA Joint Annual Conference and Training Workshop - www.iceaaonline.com

© 2010 TASC, [email protected]
FFP = Target Price = Target Cost + Target Profit
Profit = FFP – Cost
Linear function (slope of -1)
Distribution of ROS – FFP
37
( ) XTPxfY −==TP
XTPZ −=
( )( ) ( )( )zTPXPzTPXPz
zXXTPP −≤−=−≥=⎟⎠⎞
⎜⎝⎛
−≤− 111
1
( ) ( )( )zTPFzF XZ −−= 11 ( ) ( )( )zTPpTPzp XZ −⋅= 1Take
derivative, apply chain
rule
Linear Combinations property: X is Normal
implies Z is Normal
Presented at the 2010 ISPA/SCEA Joint Annual Conference and Training Workshop - www.iceaaonline.com

© 2010 TASC, [email protected]
Over-Target Shareline Adjustment until Point of Total Assumption (PTA)– Converts to FFP
Under-Target Shareline Adjustment
Piecewise linear function (three regimes)
Incentive Formula – FPI
38
( )( )( )
⎪⎩
⎪⎨
⎧
>≤<
≤
−−−−+
==PTAX
PTAXTCTCX
XCPTCXCSTF
XTCCSTFXfY over
under
TPTFZTCX =⇔=
CPPTACPZPTAX −
=⇔=
Presented at the 2010 ISPA/SCEA Joint Annual Conference and Training Workshop - www.iceaaonline.com

© 2010 TASC, [email protected]
Distribution of ROS – FPI
39
( )
( )( )
( )( )
( )( )⎪⎪⎪⎪
⎩
⎪⎪⎪⎪
⎨
⎧
−<
<≤−
≥
−−
⎟⎟⎠
⎞⎜⎜⎝
⎛+
−+−
⎟⎟⎠
⎞⎜⎜⎝
⎛+
−+−
=
CPPTACPz
TPTFz
CPPTACP
TPTFz
CPzFzGSCS
zTCCSTFF
zGSCSzTCCSTFF
zF
X
overover
overX
underunder
underX
Z
11
11
11
( )( ) ( )( )⎟⎟⎠
⎞⎜⎜⎝
⎛+
−+≤−=⎟⎟
⎠
⎞⎜⎜⎝
⎛⎟⎠⎞
⎜⎝⎛−
≤−+zGSCS
zTCCSTFXPXz
zXTCCSTFPunderunder
underunder
111
( )( ) ( )( )⎟⎟⎠
⎞⎜⎜⎝
⎛+
−+≤−=⎟⎟
⎠
⎞⎜⎜⎝
⎛⎟⎠⎞
⎜⎝⎛−
≤−−zGSCS
zTCCSTFXPXz
zTCXCSTFPoverover
overover
111
( )( )CPzXPXz
zXCPP −≤−=⎟⎟⎠
⎞⎜⎜⎝
⎛⎟⎠⎞
⎜⎝⎛−
≤− 111
Presented at the 2010 ISPA/SCEA Joint Annual Conference and Training Workshop - www.iceaaonline.com

© 2010 TASC, [email protected]
Distribution of ROS – FPI
40
( )
( )( )( )
( )( )( )
( )( )⎪⎪⎪⎪
⎩
⎪⎪⎪⎪
⎨
⎧
−<
<≤−
≥
−⋅
⎟⎟⎠
⎞⎜⎜⎝
⎛+
−+⎟⎟⎠
⎞⎜⎜⎝
⎛
++
⎟⎟⎠
⎞⎜⎜⎝
⎛+
−+⎟⎟⎠
⎞⎜⎜⎝
⎛
++
=
CPPTACPz
TPTFz
CPPTACP
TPTFz
CPzpCPzGSCS
zTCCSTFpzGSCS
TCCSTFzGSCS
zTCCSTFpzGSCS
TCCSTF
zp
X
overover
overX
overover
over
underunder
underX
underunder
under
Z
1
1
1
2
2
Take derivative, apply chain
rule
Presented at the 2010 ISPA/SCEA Joint Annual Conference and Training Workshop - www.iceaaonline.com

© 2010 TASC, [email protected]
Over-Target Shareline Adjustment down to Min Fee– Converts to CPFF
Under-Target Shareline Adjustment up to Max Fee– Converts to CPFF
Piecewise linear function (four regimes)
Incentive Formula – CPIF
41
( ) ( )( )
⎪⎪⎩
⎪⎪⎨
⎧
>≤<
≤<≤
−−−+
==
high
high
low
low
over
under
RIEXRIEXTC
TCXRIERIEX
mFTCXCSTF
XTCCSTFMF
XfY
TPTFZTCX =⇔=
MFRIEMFZRIEXlow
low +=⇔=
mFRIEmFZRIEX
highhigh +
=⇔=
Presented at the 2010 ISPA/SCEA Joint Annual Conference and Training Workshop - www.iceaaonline.com

© 2010 TASC, [email protected]
Distribution of ROS – CPIF
42
( )
( )( )
( )( )
⎪⎪⎪⎪⎪
⎩
⎪⎪⎪⎪⎪
⎨
⎧
+<
<≤+
+<≤
+≥
⎟⎟⎠
⎞⎜⎜⎝
⎛⎟⎠⎞
⎜⎝⎛ −
−
⎟⎟⎠
⎞⎜⎜⎝
⎛+
−+−
⎟⎟⎠
⎞⎜⎜⎝
⎛+
−+−
⎟⎟⎠
⎞⎜⎜⎝
⎛⎟⎠⎞
⎜⎝⎛ −
−
=
mFRIEmFz
TPTFz
mFRIEmF
MFRIEMFz
TPTF
MFRIEMFz
mFz
zF
zGSCSzTCCSTFF
zGSCSzTCCSTFF
MFz
zF
zF
high
high
low
low
X
overover
overX
underunder
underX
X
Z
11
11
11
11
( )( ) ( )( )⎟⎟⎠
⎞⎜⎜⎝
⎛+
−+≤−=⎟⎟
⎠
⎞⎜⎜⎝
⎛⎟⎠⎞
⎜⎝⎛−
≤−+zGSCS
zTCCSTFXPXz
zXTCCSTFPunderunder
underunder
111
( )( ) ( )( )⎟⎟⎠
⎞⎜⎜⎝
⎛+
−+≤−=⎟⎟
⎠
⎞⎜⎜⎝
⎛⎟⎠⎞
⎜⎝⎛−
≤−−zGSCS
zTCCSTFXPXz
zTCXCSTFPoverover
overover
111
⎟⎟⎠
⎞⎜⎜⎝
⎛⎟⎠⎞
⎜⎝⎛ −
≤−=⎟⎟⎠
⎞⎜⎜⎝
⎛⎟⎠⎞
⎜⎝⎛−
≤ MFz
zXPXz
zMFP 111 ⎟⎟
⎠
⎞⎜⎜⎝
⎛⎟⎠⎞
⎜⎝⎛ −
≤−=⎟⎟⎠
⎞⎜⎜⎝
⎛⎟⎠⎞
⎜⎝⎛−
≤ mFz
zXPXz
zmFP 111
Presented at the 2010 ISPA/SCEA Joint Annual Conference and Training Workshop - www.iceaaonline.com

© 2010 TASC, [email protected]
Distribution of ROS – CPIF
43
( ) ( )( )( )
( )( )( )
⎪⎪⎪⎪⎪
⎩
⎪⎪⎪⎪⎪
⎨
⎧
+<
<≤+
+<≤
+≥
⎟⎟⎠
⎞⎜⎜⎝
⎛⎟⎠⎞
⎜⎝⎛ −
⎟⎟⎠
⎞⎜⎜⎝
⎛+
−+⎟⎟⎠
⎞⎜⎜⎝
⎛
++
⎟⎟⎠
⎞⎜⎜⎝
⎛+
−+⎟⎟⎠
⎞⎜⎜⎝
⎛
++
⎟⎟⎠
⎞⎜⎜⎝
⎛⎟⎠⎞
⎜⎝⎛ −
=
mFRIEmFz
TPTFz
mFRIEmF
MFRIEMFz
TPTF
MFRIEMFz
mFz
zpz
mFzGSCS
zTCCSTFpzGSCS
TCCSTFzGSCS
zTCCSTFpzGSCS
TCCSTF
MFz
zpz
MF
zp
high
high
low
low
X
overover
overX
overover
over
underunder
underX
underunder
under
X
Z
1
1
1
1
2
2
2
2
Take derivative, apply chain
rule
Presented at the 2010 ISPA/SCEA Joint Annual Conference and Training Workshop - www.iceaaonline.com

© 2010 TASC, [email protected]
Fixed Fee amount = TF– Linear (constant) function
Distribution of ROS – CPFF
44
( ) TFxfY ==XTF
TFZ+
=
⎟⎟⎠
⎞⎜⎜⎝
⎛⎟⎠⎞
⎜⎝⎛ −
≤−=⎟⎟⎠
⎞⎜⎜⎝
⎛⎟⎠⎞
⎜⎝⎛ −
≥=⎟⎟⎠
⎞⎜⎜⎝
⎛⎟⎠⎞
⎜⎝⎛−
≤ TFz
zXPTFz
zXPXz
zTFP 1111
( ) ⎟⎟⎠
⎞⎜⎜⎝
⎛⎟⎠⎞
⎜⎝⎛ −
= TFz
zpzTFzp XZ
12( ) ⎟⎟
⎠
⎞⎜⎜⎝
⎛⎟⎠⎞
⎜⎝⎛ −
−= TFz
zFzF XZ11
Take derivative, apply chain
rule
Presented at the 2010 ISPA/SCEA Joint Annual Conference and Training Workshop - www.iceaaonline.com

© 2010 TASC, [email protected]
Over-Target Shareline Adjustment until Point of Total Assumption (PTA)– Converts to FFP
Under-Target Shareline Adjustment
Piecewise linear function (three regimes)
Incentive Formula – FPI
45
( )( )
⎪⎩
⎪⎨
⎧
>≤<
≤−+−−
=PTAX
PTAXTCTCX
CPTCXGSTP
XTCGSTPR over
under
TFTCTPYXRTCX +==+=⇔=CPYXRPTAX =+=⇔=
TCGSTPYXRX under−=+=⇔= 0
Presented at the 2010 ISPA/SCEA Joint Annual Conference and Training Workshop - www.iceaaonline.com

© 2010 TASC, [email protected]
Distribution of Price (R = X+Y) – FPI
46
( )
⎪⎪⎪⎪
⎩
⎪⎪⎪⎪
⎨
⎧
≥<≤
<≤−
⎟⎟⎠
⎞⎜⎜⎝
⎛ −+
⎟⎟⎠
⎞⎜⎜⎝
⎛ −−
=CPR
CPRTPTPRTCGSTP
GSTPrTCF
GSrTPTCF
rFunder
overX
underX
R
1
( )( ) ⎟⎟⎠
⎞⎜⎜⎝
⎛ −−≤=≤−−
underunder GS
rTPTCXPrXTCGSTPP
( )( ) ⎟⎟⎠
⎞⎜⎜⎝
⎛ −+≤=≤−+
overover GS
TPrTCXPrTCXGSTPP
( ) ( )PTAXPCPRP ≤−== 1 discrete “chunk”of probability
Presented at the 2010 ISPA/SCEA Joint Annual Conference and Training Workshop - www.iceaaonline.com

© 2010 TASC, [email protected]
Distribution of ROS – FPI
47
Take derivative, apply chain
rule
( )
( )⎪⎪⎪⎪
⎩
⎪⎪⎪⎪
⎨
⎧
=<≤
<≤−
−
⎟⎟⎠
⎞⎜⎜⎝
⎛ −+
⎟⎟⎠
⎞⎜⎜⎝
⎛ −−
=CPR
CPRTPTPRTCGSTP
PTAFGS
TPrTCpGS
GSrTPTCp
GS
rpunder
X
overX
over
underX
under
R
1
1
1
discrete “chunk”of probability
Presented at the 2010 ISPA/SCEA Joint Annual Conference and Training Workshop - www.iceaaonline.com

© 2010 TASC, [email protected]
Comparison graphs for cases:– Base case: Base cost = Target Cost ($10.0M), standard
deviation = $1.5M (15% CV)– Aggressive cost: True base cost is $11.5M instead of $10.0M– Padded cost: True base cost is $8.5M instead of $10.0M– Understated variability: True standard deviation is $3.0M
instead of $1.5M
Summary table across all contract types:
Distribution of ROS – Pathological Cases
48
MONTE CARLO
FFP FPI CPIF CPFF FFP FPI CPIF CPFF FFP FPI CPIF CPFF FFP FPI CPIF CPFF20th percentile -2.2% 5.1% 5.2% 8.1% 11.4% 10.5% 10.3% 9.3% -16.0% 1.3% 2.3% 7.3% -13.6% 2.0% 2.4% 7.4%median (50th percentile) 8.9% 9.1% 9.0% 9.1% 22.9% 18.2% 18.2% 10.5% -4.6% 4.6% 4.6% 8.0% 9.4% 9.1% 9.6% 9.1%mean 9.0% 11.0% 10.6% 9.3% 22.8% 19.1% 16.6% 10.8% -4.5% 4.4% 5.8% 8.1% 9.3% 12.5% 12.5% 7.5%80th percentile 20.3% 16.8% 16.7% 10.2% 34.2% 26.9% 21.6% 12.1% 6.9% 8.4% 8.3% 8.9% 32.0% 25.4% 21.2% 11.9%
Base case ($10M) Padded cost ($8.5M) Aggressive cost ($11.5M) Understated variability
Presented at the 2010 ISPA/SCEA Joint Annual Conference and Training Workshop - www.iceaaonline.com

© 2010 TASC, [email protected]
FFP – Pathological Cases
49
0.0
0.1
0.2
0.3
0.4
0.5
0.6
0.7
0.8
0.9
1.0
-30% -25% -20% -15% -10% -5% 0% 5% 10% 15% 20% 25% 30% 35% 40% 45% 50%
base casepadded costaggressive costunderstated variability
Aggressive cost and understated variability have similar impact on
20th percentile
All normal distributions –huge difference at all
percentiles
Presented at the 2010 ISPA/SCEA Joint Annual Conference and Training Workshop - www.iceaaonline.com

© 2010 TASC, [email protected]
CPIF – Pathological Cases
50
0.0
0.1
0.2
0.3
0.4
0.5
0.6
0.7
0.8
0.9
1.0
-20.00% -15.00% -10.00% -5.00% 0.00% 5.00% 10.00% 15.00% 20.00% 25.00% 30.00% 35.00% 40.00%
base casepadded costaggressive costunderstated variability
Extreme bunching at
Min Fee
RIEhigh TC RIElow
Presented at the 2010 ISPA/SCEA Joint Annual Conference and Training Workshop - www.iceaaonline.com

© 2010 TASC, [email protected]
CPFF – Pathological Cases
51
0.0
0.1
0.2
0.3
0.4
0.5
0.6
0.7
0.8
0.9
1.0
6% 7% 8% 9% 10% 11% 12% 13% 14% 15% 16% 17%
base casepadded costaggressive costunderstated variability
Aggressive cost and understated variability have similar impact on
20th percentile
Presented at the 2010 ISPA/SCEA Joint Annual Conference and Training Workshop - www.iceaaonline.com

© 2010 TASC, [email protected] © 2009 TASC, Inc.52
Presented at the 2010 ISPA/SCEA Joint Annual Conference and Training Workshop - www.iceaaonline.com