risk-based evaluation of offshore oil and gas … evaluation of offshore oil and gas operations ......
TRANSCRIPT
Research Report by Argonne’s Strategic Alliance for Global Energy Solutions (SAGES)
AUGUST 2017
Risk-Based Evaluation of Offshore Oil and Gas Operations Using a
Multiple Physical Barrier Approach
Argonne SAGES Research Report for BSEE
ii | Risk-Based Evaluation of Offshore Oil and Gas Operations
AUTHORS Bruce P. Hamilton
Erna Gevondyan
Joseph C. Braun
Daniel M. Fraser
Edited by: Stephanie Hill
ACKNOWLEDGMENTS The authors wish to acknowledge the enthusiastic participation of many Bureau of Safety and Environmental Enforcement (BSEE) staff for their help, suggestions, guidance and cooperation toward preparing this document, with special recognition for the time and contributions of Michael Pittman, Jarvis Abbott, and Kelly Griggs – BSSE HQ, Sterling.
The authors would also like to recognize the efforts of David Grabaskas, Roy Lindley, Dennis Moore, Alex Sas-Jaworsky, and Mike Vander Staak for their technical contributions to several of the risk analysis studies discussed in this report.
The authors thank the International Electrotechnical Commission (IEC) for permission to reproduce information from its International Standards. All such extracts are copyright of IEC, Geneva, Switzerland. All rights reserved. Further information on the IEC is available from www.iec.ch. IEC has no responsibility for the placement and context in which the extracts and contents are reproduced by the author, nor is IEC in any way responsible for the other content or accuracy therein.
Disclaimer
This report was prepared by Argonne National Laboratory (ANL) under contract to the Department of Energy (DOE) through an inter-agency agreement between the Department of the Interior, Bureau of Safety and Environmental Enforcement (BSEE) and the DOE. The opinions, findings, conclusions, and recommendations expressed in the report are those of the authors and they do not necessarily reflect the views or policies of BSEE.
This report was prepared as an account of work sponsored by an agency of the United States Government. Neither the United States Government nor any agency thereof, nor UChicago Argonne, LLC, nor any of their employees or officers, makes any warranty, express or implied, or assumes any legal liability or responsibility for the accuracy, completeness, or usefulness of any information, apparatus, product, or process disclosed, or represents that its use would not infringe privately owned rights. Reference herein to any specific commercial product, process, or service by trade name, trademark, manufacturer, or otherwise, does not necessarily constitute or imply its endorsement, recommendation, or favoring by the United States Government or any agency thereof. The views and opinions of document authors expressed herein do not necessarily state or reflect those of the United States Government or any agency thereof, Argonne National Laboratory, or UChicago Argonne, LLC
August 2017
Risk-Based Evaluation of Offshore Oil and Gas Operations | iii
EXECUTIVE SUMMARY This report identifies a risk-analysis technique, developed by Argonne, that focuses on physical barriers in the offshore oil and gas industry. It studies the careful design, construction, operation, and maintenance of physical barriers to provide a greater degree of safety and environmental protection.
The focus on physical barriers unifies safety and risk analyses across many industries. However, safety approaches in each industry must adapt to the unique features of that industry. Argonne’s approach to offshore oil and gas risk analysis begins with the proper characterization of risk, and this characterization is reached by distinguishing process safety from industrial safety. To have a streamlined approach for process safety in the oil and gas industry, a consistent definition of barriers is needed. This report builds upon the fundamental definition of physical barriers and describes the system and the difference between industrial and process safety.
Currently, the oil and gas industry recognizes two meanings for the word barrier—the literal meaning and the figurative meaning. As a result, process safety and industrial safety are often conflated. The industry has demonstrated a very strong commitment to industrial safety in facilities. There has been a steady reduction in the loss of life and health from industrial accidents in facilities. However, most major industry incidents that involve multiple fatalities or permanent total disabilities, extensive damage to the structures, or severe impact to the environment are related to process integrity.
These observations have led the Argonne team to develop the Multiple Physical Barriers (MPB) approach for evaluating process safety. In the MPB Approach, the only barriers are physical barriers. Training, people, and procedures are important, but they are not barriers in their own rights. For example, failure to follow a correct procedure may cause a major accident, but only by means of its impact on the performance of a physical barrier.
How then do people in the industry ensure that physical barriers are performing their critical safety functions? The answer is to ensure that success paths—systems, components, and human actions needed to ensure the success (of a barrier)—are in place and are capable of performing their functions in all expected conditions and circumstances. A collection of success paths is sometimes called a success tree.
This report summarizes the application of Argonne’s approach, which includes identifying multiple physical barriers and developing success paths. The objective of this approach is to support BSEE’s goal of enhancing safety in the offshore oil and gas industry. This approach helps implement key objectives such as the following:
• expanding BSEE’s tools for enhanced oversight of high-risk activities and equipment bydeveloping and implementing a systematic methodology to understand and manage high-riskareas
Argonne SAGES Research Report for BSEE
iv | Risk-Based Evaluation of Offshore Oil and Gas Operations
• facilitating BSEE's utilization of data to develop a variety of applications for MPB models;MPB models can be used as tools to visualize the critical barrier systems in offshoreoperations
• using the MPB and success path models to facilitate productive communication betweenoperators and BSEE and to help all parties focus on improving safety outcomes on the OuterContinental Shelf (OCS).
August 2017
Risk-Based Evaluation of Offshore Oil and Gas Operations | v
TABLE OF CONTENTS
Authors .................................................................................................................... ii Acknowledgments .................................................................................................... ii Executive Summary ................................................................................................. iii Table of Contents ...................................................................................................... v List of Figures ......................................................................................................... vii List of Tables .......................................................................................................... viii Acronyms and abbreviations ................................................................................ viii Introduction ............................................................................................................. 10
Background ............................................................................................................................ 10 Study Objectives ..................................................................................................................... 10
Multiple Physical Barrier Approach to Operational Risk Management .............. 11 Issue Background .................................................................................................................... 11 Physical Barriers ..................................................................................................................... 12 Success Paths .......................................................................................................................... 14
Example Applications of the Multiple Physical Barrier Approach ...................... 17 Drilling .................................................................................................................................... 17 Full Opening Safety Valve ........................................................................................................ 18 Conventional Drilling Versus Managed-Pressure Drilling .......................................................... 23 Blowout Preventer System Reliability ...................................................................................... 28 Completion and Production ..................................................................................................... 36 Installing and Deinstalling a Production Packer ........................................................................ 36 Workover ............................................................................................................................... 40 Coiled Tubing Equipment Safety Analysis ................................................................................. 40 Coiled Tubing Inspection Workshop – A Risk-Based Approach .................................................. 43 Plug and Abandonment ........................................................................................................... 43
Research Findings .................................................................................................. 44 Observations .......................................................................................................................... 44 Application of the MPB Approach to BSEE Operations and Governance .................................... 45 Strategy 1: Ensure a consistent, national approach to detection of noncompliance and incident investigation ........................................................................................................................... 45 Strategy 2: Examine the full life cycle of offshore operations and adapt to changing conditions 45 Strategy 3: Further incorporate risk-based decision making into core safety functions .............. 46 Strategy 4: Develop and sustain a well-trained, high-performing and diverse workforce ........... 46 Strategy 5: Enhance BSEE’s decision making through the collection, management, and analysis of high quality information. ..................................................................................................... 47
Conclusions and Recommendations .................................................................... 47 Conclusions ............................................................................................................................ 47 Recommendations .................................................................................................................. 47
Argonne SAGES Research Report for BSEE
vi | Risk-Based Evaluation of Offshore Oil and Gas Operations
APPENDIX I Success Path Diagrams for Variety of Offshore Oil and Gas Technologies and Operations .................................................................. 1
Success Path Notation ............................................................................................. 1 Drilling Success Paths.............................................................................................. 2
FOSV Success Path ....................................................................................................................2 Fluid Column Success Paths .......................................................................................................3 Blind Shear Ram Success Path ...................................................................................................8 Casing and Cement Success Paths ............................................................................................ 15
Completion and Production Success Paths ......................................................... 18 Seal Bore Production Packer Success Paths .............................................................................. 18 Production Pipeline Success Path ............................................................................................ 21
Workover Success Paths ....................................................................................... 22 Coiled Tubing Success Paths .................................................................................................... 22
Use of Success Paths in Risk-Based Inspection ................................................. 36 Crane Utilization Success Path ................................................................................................. 36

August 2017
Risk-Based Evaluation of Offshore Oil and Gas Operations | vii
LIST OF FIGURES Figure 1 Uses of the Term Barriers Figure 2 Sketch Depicting the Physical Barriers Found During Drilling Operations Figure 3 Argonne Multiple Physical Barrier Approach Template for FOSV Figure 4 Fluid Column Success Path (Conventional Drilling) Figure 5 Fluid Column Success Path (Managed-Pressure Drilling) Figure 6 Illustration of Barriers, Safety Functions, and Success Paths for Three Drilling Scenarios Figure 7 BSR HP Close Top Level Success Path Figure 8 Manual HP Close Success Path Overview Figure 9 Manual HP Close – Command Signal Figure 10 Manual HP Close – Surface Control System Figure 11 Manual HP Close – MUX System Figure 12 Manual HP Close – Control Pod Figure 13 Manual HP Close – BOP Shuttle Valves Figure 14 Manual HP Close – Ram Hardware Figure 15 Success Path for a Seal Bore Production Packer Figure 16 Success Path for Packer Retrieval Figure 17 Example Barrier Configuration Diagram for a PC-3 Well Figure I-1 Success Path for a Full Opening Safety Valve Figure I-2 Success Path for a Fluid Column in Conventional Drilling Figure I-3 Success Path for a Fluid Column in Managed Pressure Drilling Figure I-4 Success Path for a Fluid Column in Kick Circulation Via Choke Line Figure I-5 Illustration of Barriers, Safety Functions, and Success Paths for Three Drilling Scenarios Figure I-6 Success Path for Choke and Lines in MPD Figure I-7 Success Path for a Rotating Control Device in MPD Figure I-8 Success Path for the Manual Actuation of BSR HP Close Figure I-9 Success Path for the Emergency Disconnect Figure I-10 Success Path for the DMAS of Manufacturer #1 Figure I-11 Success Path for the DMAS of Manufacturer #2 Figure I-12 Success Path for a Hydraulic Power Support System Figure I-13 Success Path for an AC Power Support System Figure I-14 Success Path for a MUX Support System Figure I-15 Success Path for a Pod Select Support System Figure I-16 Success Path for Casing Figure I-17 Success Path for Cement Figure I-18 Success Path for a Seal Bore Production Packer without Gas Lift Figure I-19 Success Path for Retrieval of a Seal Bore Production Packer without Gas Lift Figure I-20 Success Path for a Pipeline Figure I-21 Success Path for Coil Tubing Well Control Barriers Figure I-22 Success Path for Stripper Figure I-23 Success Path for Pipe Ram
Argonne SAGES Research Report for BSEE
viii | Risk-Based Evaluation of Offshore Oil and Gas Operations
Figure I-24 Success Path for Annular Preventer Figure I-25 Success Path for Coiled Tubing String Figure I-26 Success Path for Down-Hole Flow Check Assembly Figure I-27 Success Path for Blind Ram Figure I-28 Success Path for Shear Ram as Part of Shear and Blind Ram System Figure I-29 Success Path for Blind Ram as Part of Shear and Blind Ram System Figure I-30 Success Path for Shear-Blind Ram Figure I-31 Success Path for Air Over Hydraulic Pump for Stripper Figure I-32 Success Path for Hand Pump for Stripper Figure I-33 Success Path for Hydraulic Pump Figure I-34 Success Path for Accumulator System Figure I-35 High-Level Success Path for Safe Crane Utilization Figure I-36 Success Path for Safe Crane Operation and Inspection Figure I-37 Success Path for Inspections Component of Safe Crane Utilization
LIST OF TABLES Table 1 Success Path Diagram Notation Table 2 Using the MPB Approach to Compare Conventional and Managed-Pressure Drilling Table 3 SIL Category Overview IEC 61508 Table 4 BSR HP Close Failure Probability Estimates Table 5 Summary of the Coiled Tubing Barrier Configurations for Each Pressure Category
ACRONYMS AND ABBREVIATIONS AC Alternating Current ANL Argonne National Laboratory APD Application for Permit to Drill API American Petroleum Institute BOEM Bureau of Ocean Energy Management BOEMRE Bureau of Ocean Energy Management BOP Blowout Preventer bopd Barrels of Oil Per Day BSEE Bureau of Safety and Environmental Enforcement BSR Blind Shear Ram CBHP Constant Bottom-Hole Pressure CBP Choke Back Pressure CCF Common Cause Failure CCU Central Control Unit CF Circulating Friction DMAS Deadman/Autoshear System DWOP Deepwater Operation Plan EDS Emergency Disconnect System/Sequence
August 2017
Risk-Based Evaluation of Offshore Oil and Gas Operations | ix
FG Fracture Gradient FMECA Failure Modes and Effect Analysis FOSV Full-Opening Safety Valve HP High-Pressure HPHT High-Pressure, High-Temperature HSE Health, Safety, and Environmental IEC International Electrotechnical Commission JIP Joint Implementation Project KDV Kick Detection Volume KRT Kick Response Time KWF Kill Weight Fluid LMRP Lower Marine Riser Package LOP Leak-Off Pressure MASP Maximum Allowable Surface Pressure MPB Multiple Physical Barrier MPD Managed Pressure Drilling MUX Multiplex MW Mud Weight NOG Norwegian Oil and Gas Association NRC Nuclear Regulatory Commission OCS Outer Continental Shelf PC Pressure Category PFD Probability of Failure per Demand PP Pore Pressure PRA Probabilistic Risk Assessment RCD Rotating Control Device ROV Remotely Operated Vehicles RP Recommended Protocol RRF Risk-Reduction Factor SBP Surface Back-Pressure SEM Subsea Electronic Module SIL Safety Integrity Level SME Subject Matter Expert SPM Sub Plate Mounted TIW Texas Iron Works
Argonne SAGES Research Report for BSEE
10 | Risk-Based Evaluation of Offshore Oil and Gas Operations
INTRODUCTION Safely exploring, developing, and producing oil and gas on the Outer Continental Shelf (OCS) is a long, multistep process that starts many years prior to the first production of oil and gas. The Bureau of Safety and Environmental Enforcement (BSEE) works throughout this process to reduce the risks of operating offshore. Argonne National Laboratory (“Argonne”) provides technical assistance to BSEE in developing tools and capabilities that facilitate the utilization of a risk-based approach in BSEE’s management and governance processes.
BACKGROUND The Department of the Interior's Inspector General, as well as other external bodies (including the Transportation Safety Board, National Academy of Engineers, and the Oil Spill Commission), recommended that BSEE develop a dynamic, regulatory framework capable of incorporating data about the relative risks of regulated activities. These bodies highlighted the importance of an efficient, technically sound, and legally defensible regulatory approach. Such an approach would use risk-based analysis as a prioritizing tool and would include regulations that require risk analysis to assess operations defined as “high risk.” Since the time of those recommendations, BSEE has embarked on an investment strategy to develop and implement tools and processes that support a more comprehensive approach to risk-informed regulatory activities such as regulation, inspection, permitting, and policy analysis.
Furthermore, BSEE and Argonne have developed a model for incorporating risk-informed decision-making principles through a Multiple Physical Barrier (MPB) identification and analysis methodology. BSEE and Argonne also recommend ways to incorporate risk analysis into BSEE's existing governance and approach to assessing and regulating high-risk activities such as drilling, well-completions, and well-workovers.
STUDY OBJECTIVES Building on earlier MPB model-development efforts, BSEE enlisted the services of Argonne to provide technical assistance for the development and implementation of tools and processes that would support a more comprehensive and effective approach to risk-informed regulatory activities. This assistance includes the development of a risk-based screening methodology for identifying important barriers in offshore hydrocarbon development operations in a way that highlights critical barrier systems for consistent analysis and inspection. Argonne has also assisted BSEE in applying the MPB model to a range of production scenarios and safety systems; drilling scenarios with multiple rig types; and differing operational environments, such as deepwater and high-pressure, high-temperature (HPHT).
Specific examples of this work include the following:
• expanding BSEE’s tools for enhanced oversight of high-risk activities and equipment bydeveloping and implementing a systematic methodology to understand and manage high-riskareas, including pipelines, drilling, completions, and well-workovers
August 2017
Risk-Based Evaluation of Offshore Oil and Gas Operations | 11
• facilitating BSEE's utilization of its data to develop a variety of applications of MPB models,which can be used as tools to visualize critical barrier systems in each of the operationsdescribed above
• using information and insights culled from interactions with operators and BSEE subjectmatter experts (SMEs), as well as an analysis of BSEE data on facility construction andoperation, to develop MPB models that equip BSEE with tools to visually analyze criticalbarrier systems, related regulations, and industry standards all at once. This can helpdetermine the inspectable characteristics that BSEE can focus on to improve safety outcomeson the OCS.
Argonne’s technical assistance on risk-based management and governance for BSEE has yielded this report, which is organized in the following parts:
• introduction of the MPB Approach as a systematic, clear, and comprehensive approach formanaging operational safety risks
• overview of MPB Applications conducted for offshore drilling, production, completions, andworkover activities
• description of the research findings• summary conclusions and recommendations
The report’s appendix provides a collection of MPB models Argonne developed illustrating critical barriers that must be maintained to ensure safe operation for a variety of offshore operations and technologies.
MULTIPLE PHYSICAL BARRIER APPROACH TO OPERATIONAL RISK MANAGEMENT
ISSUE BACKGROUND Argonne has been actively involved in assessing the safety of nuclear reactors since its inception in 1946. When asked to provide assistance for enhancing safety measures in the offshore oil and gas industry, Argonne developed the MPB Approach. The MPB Approach aims to enable the industry to move in the most direct and systematic fashion to a position where operational (or process) risks can be identified, evaluated, and acted upon to improve the safety of offshore operations.
The MPB Approach is based on key principles from nuclear power plant safety and also from other industries1. However, the nuclear industry and the upstream oil and gas industry could hardly be more dissimilar. Nuclear power plants remain in one place for their entire lifetimes and carry out a single mission of producing electricity for distribution over a land-based electrical grid. Because nuclear power plants spend all but a fraction of their time in a steady-state
1 Since 2010 Argonne has been researching operational risk and comparing approaches from a variety of applications including nuclear, aviation, maritime, transportation, and chemical safety.
Argonne SAGES Research Report for BSEE
12 | Risk-Based Evaluation of Offshore Oil and Gas Operations
situation, the Nuclear Regulatory Commission (NRC) uses Probabilistic Risk Assessment (PRA) to estimate risk by determining what can go wrong, how likely malfunctions are to happen, and what the consequences of these malfunctions are.
In the oil and gas industry, however, offshore facilities perform many different functions, most notably drilling, completion, production, workover, and closure or abandonment of offshore subsea wells. Offshore facilities perform these functions under operating conditions that change from day to day. Hence, a major adaptation from the nuclear-style PRA approach is required to better address this dynamic environment in offshore oil and gas operations. The MPB Approach to operational risk (safety) management was born out of this necessity.
Argonne’s MPB Approach enables effective risk management by determining what must go right. By focusing on success, this approach combines risk variables and prioritizes them so they become manageable. The approach is applied qualitatively at first, in order to delineate, characterize, and illustrate how critical safety functions are to be met. Analytical tools then help quantitatively assess risks associated with critical safety functions under a variety of scenarios and prioritize strategies that balance costs and benefits while managing risks.
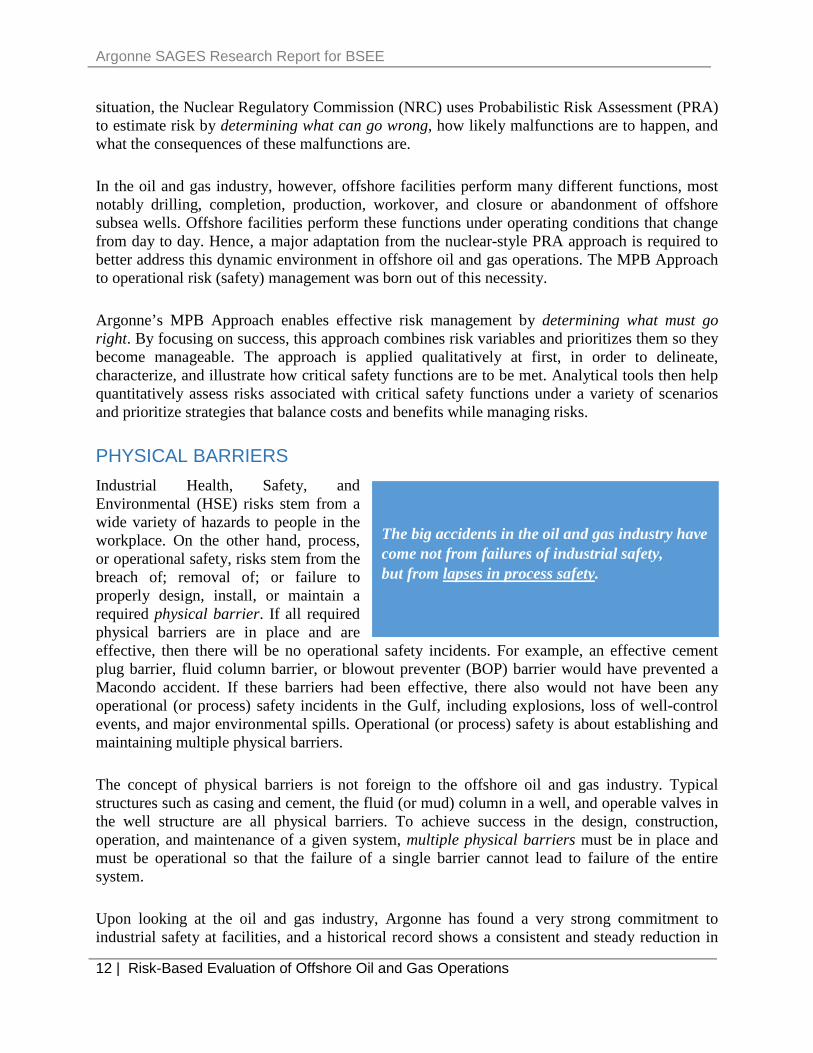
PHYSICAL BARRIERS Industrial Health, Safety, and Environmental (HSE) risks stem from a wide variety of hazards to people in the workplace. On the other hand, process, or operational safety, risks stem from the breach of; removal of; or failure to properly design, install, or maintain a required physical barrier. If all required physical barriers are in place and are effective, then there will be no operational safety incidents. For example, an effective cement plug barrier, fluid column barrier, or blowout preventer (BOP) barrier would have prevented a Macondo accident. If these barriers had been effective, there also would not have been any operational (or process) safety incidents in the Gulf, including explosions, loss of well-control events, and major environmental spills. Operational (or process) safety is about establishing and maintaining multiple physical barriers.
The concept of physical barriers is not foreign to the offshore oil and gas industry. Typical structures such as casing and cement, the fluid (or mud) column in a well, and operable valves in the well structure are all physical barriers. To achieve success in the design, construction, operation, and maintenance of a given system, multiple physical barriers must be in place and must be operational so that the failure of a single barrier cannot lead to failure of the entire system.
Upon looking at the oil and gas industry, Argonne has found a very strong commitment to industrial safety at facilities, and a historical record shows a consistent and steady reduction in
The big accidents in the oil and gas industry have come not from failures of industrial safety, but from lapses in process safety.
August 2017
Risk-Based Evaluation of Offshore Oil and Gas Operations | 13
the loss of life and health from industrial accidents.
Another finding is that big accidents in the oil and gas industry have come not from failures of industrial safety, but from lapses in process safety (called “operational risk” by the IADC Deepwater Well Control Guidelines, 2nd Edition, 2015).
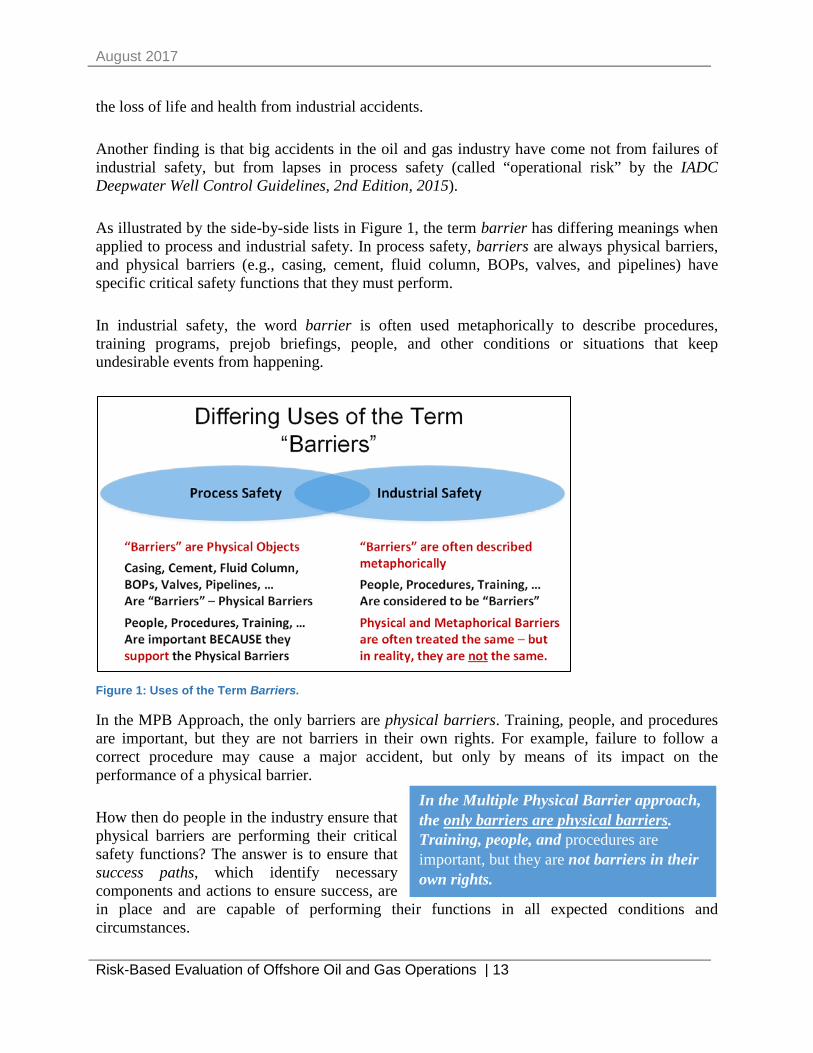
As illustrated by the side-by-side lists in Figure 1, the term barrier has differing meanings when applied to process and industrial safety. In process safety, barriers are always physical barriers, and physical barriers (e.g., casing, cement, fluid column, BOPs, valves, and pipelines) have specific critical safety functions that they must perform.
In industrial safety, the word barrier is often used metaphorically to describe procedures, training programs, prejob briefings, people, and other conditions or situations that keep undesirable events from happening.
Figure 1: Uses of the Term Barriers.
In the MPB Approach, the only barriers are physical barriers. Training, people, and procedures are important, but they are not barriers in their own rights. For example, failure to follow a correct procedure may cause a major accident, but only by means of its impact on the performance of a physical barrier.
How then do people in the industry ensure that physical barriers are performing their critical safety functions? The answer is to ensure that success paths, which identify necessary components and actions to ensure success, are in place and are capable of performing their functions in all expected conditions and circumstances.
In the Multiple Physical Barrier approach, the only barriers are physical barriers. Training, people, and procedures are important, but they are not barriers in their own rights.

Argonne SAGES Research Report for BSEE
14 | Risk-Based Evaluation of Offshore Oil and Gas Operations
SUCCESS PATHS A success path is a series or collection of equipment, procedures, software, processes, and human actions that ensure physical barriers are able to meet their critical safety functions.
Success path diagrams are used to characterize, delineate, and illustrate steps that must be taken to achieve success in the design, maintenance, and operation of each component in the system.
The development of a success path diagram focuses on two principal questions:
• What physical barriers are required for the operation at hand?• What is needed to ensure that these physical barriers “succeed” in meeting their critical
safety functions?
These questions marry two principles: the focus on physical barriers, which is foundational to the nuclear safety industry; and the ability to diagram and trace how critical systems function (e.g., performance qualification standards), which forms a key part of safety training for engineers and inspectors in the US Navy and the Coast Guard.
It is precisely the understanding of what needs to work correctly (especially for physical barriers) that paves the way toward elucidating failure modes. In effect, this approach is designed to help orchestrate a shift in operational awareness with the aim of improving operational risk management.
As will be illustrated, the use of success paths in the MPB Approach provides a number of key benefits, including the following:
• It is the fastest systematic mechanism for identifying the root cause of operational safetyrisks that lead to injury, downtime, and increased costs. This top-down approach starts with ahigh-level view of the system and enables systematic drill-downs for characterizing criticalsystem components.
• It helps government agencies, as well as energy companies and other stakeholders, develop acommon understanding of key safety risks and build consensus on cost-effective risk-mitigation measures.
• It provides a consistent, risk-informed communications framework for intuitivelycommunicating with rig workers, senior executives, regulators, and everyone in between. Rigworkers quickly identify their roles within the success paths and readily understand how theiractions are integral to maintaining the success of the barrier.
• A well-charted success path enables decision makers to intuitively comprehend the keypoints required for success and to then participate intelligently in the discussion about risksand safety. Further, it provides a consistent and rigorous basis for defending decisions thathave been made (for example, to senior executives or third parties). The foundations of thisapproach have been demonstrated to hold up in legal situations.
August 2017
Risk-Based Evaluation of Offshore Oil and Gas Operations | 15
• It also serves as an optimal training tool that enables students to quickly and intuitively graspkey operational safety issues. Each physical barrier can be systematically analyzed to identifythe foundational basis needed to safely manage the operational working environment on arig.
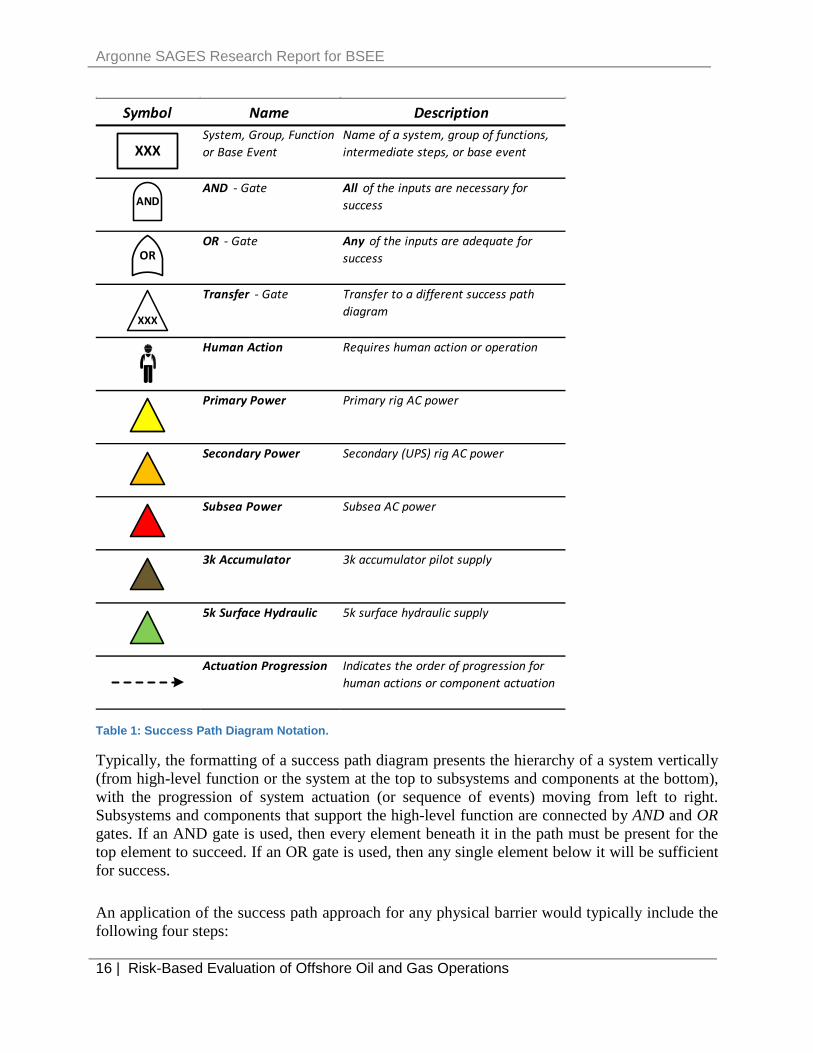
Success path diagrams utilize a notation very similar to that of fault trees. However, unlike fault trees, possible failure modes for systems and components are not specified. Instead, the action that is necessary for system success is highlighted. An overview of success path notation is shown in Table 1. A box is used to group a collection of functions and intermediate steps or to designate a base event, a cone-shaped AND gate is used to indicate all inputs necessary for success, an arrow-shaped OR gate notes that any single input is adequate for success, a symbol of a person conveys that human action is required, and a triangular transfer gate is used to direct readers to a different success path diagram. Additional support systems are represented with triangular shapes colored yellow for primary rig AC power, orange for secondary rig AC power, read for subsea AC power, brown for a 3k accumulator, and green for a 5k surface hydraulic supply. A dashed line is used to indicate the order of progression for human actions or component actuation.
Argonne SAGES Research Report for BSEE
16 | Risk-Based Evaluation of Offshore Oil and Gas Operations
Symbol Name DescriptionSystem, Group, Function or Base Event
Name of a system, group of functions, intermediate steps, or base event
AND - Gate All of the inputs are necessary for success
OR - Gate Any of the inputs are adequate for success
Transfer - Gate Transfer to a different success path diagram
Human Action Requires human action or operation
Primary Power Primary rig AC power
Secondary Power Secondary (UPS) rig AC power
Subsea Power Subsea AC power
3k Accumulator 3k accumulator pilot supply
5k Surface Hydraulic 5k surface hydraulic supply
Actuation Progression Indicates the order of progression for human actions or component actuation
AND
OR
XXX
XXX
Table 1: Success Path Diagram Notation.
Typically, the formatting of a success path diagram presents the hierarchy of a system vertically (from high-level function or the system at the top to subsystems and components at the bottom), with the progression of system actuation (or sequence of events) moving from left to right. Subsystems and components that support the high-level function are connected by AND and OR gates. If an AND gate is used, then every element beneath it in the path must be present for the top element to succeed. If an OR gate is used, then any single element below it will be sufficient for success.
An application of the success path approach for any physical barrier would typically include the following four steps:
August 2017
Risk-Based Evaluation of Offshore Oil and Gas Operations | 17
• Identify the physical barrier systems that need to be in place for a given operation and theassociated critical safety function(s). (This is usually a statement of success, such as “Pumpsdeliver needed pressure and flow under all expected conditions.”)
• Ensure that the physical barrier support system(s) are designed and configured to performtheir critical safety functions under all expected conditions.
• Monitor the performance of all critical equipment and implement preplanned actions andstrategies for restoring barrier functions if one or more of the barrier systems fails orbecomes degraded.
• Maintain all critical equipment in a condition to perform as needed during all expectedconditions.
The following section provides examples of applying the Argonne MPB Approach to high-risk areas related to offshore oil and gas operations.
EXAMPLE APPLICATIONS OF THE MULTIPLE PHYSICAL BARRIER APPROACH
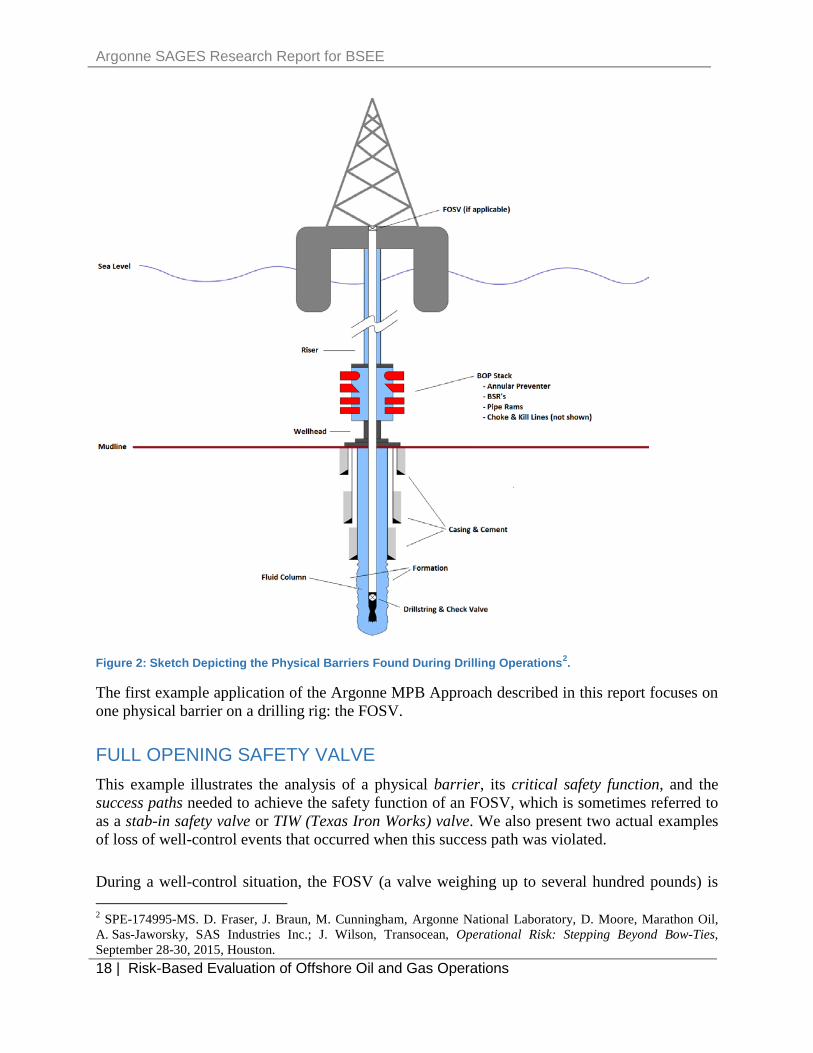
DRILLING The following diagram (Figure 2) shows a simplified sketch depicting the physical barriers found during drilling operations:
The fluid column is the primary barrier that keeps hydrocarbons where they belong. It must be balanced to maintain a bottom-hole pressure that is higher than the pore pressure of the formation, but lower than the fracture gradient of the formation.
The casing and cement elements that line the sides of the well keep hydrocarbons from entering the well in an unwanted manner.
The wellhead binds all of the casing strings together and provides structural support for all of the casing below the well and all of the equipment located above the well.
The BOP stack surrounds the casing, annulus, and drill string. The stack includes several different types of rams, each with its own special function. The BOP includes annular preventers, pipe rams, shear rams, and choke-and-kill lines (not shown in Figure 2).
The riser connects the fluid column in the BOP stack to the floating rig.
The drill string has two important physical barriers: the drill string check valve, which prevents backflow up the drill pipe, and the full opening safety valve (FOSV), which is available for insertion at the top of the drill pipe and stops flow when the wellbore is open to the atmosphere.
Argonne SAGES Research Report for BSEE
18 | Risk-Based Evaluation of Offshore Oil and Gas Operations
Figure 2: Sketch Depicting the Physical Barriers Found During Drilling Operations2.
The first example application of the Argonne MPB Approach described in this report focuses on one physical barrier on a drilling rig: the FOSV.
FULL OPENING SAFETY VALVE This example illustrates the analysis of a physical barrier, its critical safety function, and the success paths needed to achieve the safety function of an FOSV, which is sometimes referred to as a stab-in safety valve or TIW (Texas Iron Works) valve. We also present two actual examples of loss of well-control events that occurred when this success path was violated.
During a well-control situation, the FOSV (a valve weighing up to several hundred pounds) is
2 SPE-174995-MS. D. Fraser, J. Braun, M. Cunningham, Argonne National Laboratory, D. Moore, Marathon Oil, A. Sas-Jaworsky, SAS Industries Inc.; J. Wilson, Transocean, Operational Risk: Stepping Beyond Bow-Ties,September 28-30, 2015, Houston.
August 2017
Risk-Based Evaluation of Offshore Oil and Gas Operations | 19
screwed into the top of the drill pipe or tubing to prevent drilling fluids from flowing out of the drill pipe and onto the rig floor. Typically, the FOSV must be manually installed by the rig crew as quickly as possible once the command to begin well control has been issued.
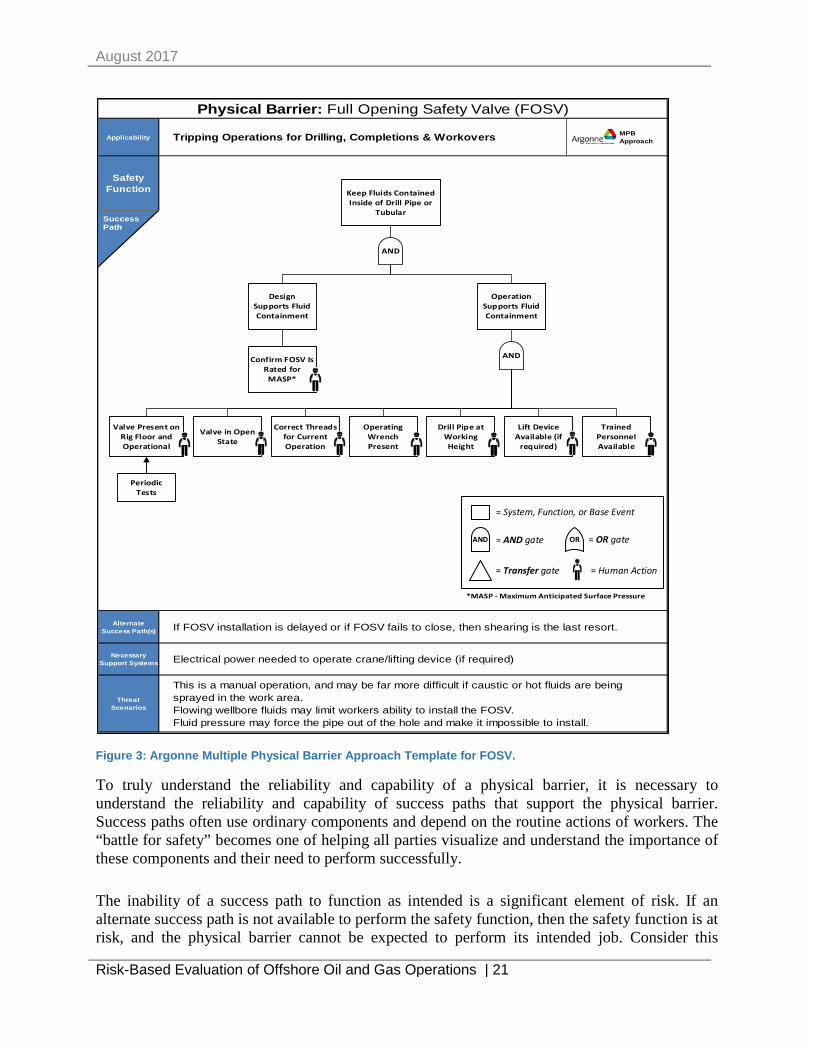
Applicability. Figure 3 provides a completed MPB template for the FOSV. As noted in the first row of the template, this barrier analysis was specifically considered for operations of offshore drilling, completions, and workovers.
Success Path. The main body of the MPB template displays a success path for the FOSV with a concise statement of the barrier’s purpose (in a rectangular box at the top of the diagram). This is the critical safety function. The noted critical safety function of an FOSV is to “keep fluids contained inside of drill pipe or tubular.”
Directly below the critical safety function is an AND gate noting that both proper design and proper operation of the FOSV are essential to support fluid containment. The success path further demonstrates that, for the design and setup of the FOSV to be successful, the FOSV must be properly rated for pressures that could be produced by the well. (BSEE, for example, requires that the FOSV be rated at the same pressures as the BOP system.)
Similarly, this success path shows that not only must the FOSV be designed and set up properly, but a whole series of operational actions and monitoring actions must also take place. These operations are illustrated below the second AND gate as a set of individual boxes. Each box represents a specific action that must be observed and confirmed. These actions include the following:
• ensuring that the FOSV is readily available on the rig drill floor• ensuring that the FOSV is in an OPEN state, since it could be very hard to install if closed
(for example, think of screwing a cap on the end of a flowing garden hose)• ensuring that the threads at the bottom of the FOSV are matched to the drill pipe or tubular
used in the wellbore (in some cases, this can be accomplished by adding thread crossovers tothe FOSV)
• ensuring that the special operating wrench for the FOSV is readily available so the valve canbe closed once it’s installed
• ensuring that the tool joint is at working height, so the rig crew can install the FOSV• ensuring that the lifting device is available to lift the barrier into position• ensuring that people adequately trained in FOSV installation are readily available at all times
Alternate Success Paths. In diagramming the success path, industry specialists are forced to systematically think through the entire operation of the physical barrier and identify items that are needed for the barrier to be successful. Below the success path is a box for specifying alternative success paths, which may be deployed if the current barrier fails. For example, if the FOSV fails to close, then shearing is a last resort.
Argonne SAGES Research Report for BSEE
20 | Risk-Based Evaluation of Offshore Oil and Gas Operations
Necessary Support Systems. The next block in the diagram is used to identify any functions that are needed to support the success path. In this case, electric power would be needed to operate an electrical hoist. If there is no power, the success path is not complete, and the barrier would not be operable. Carefully identifying these support systems is an important part of the MPB Approach. This step also helps identify “common cause” failures (such as the loss of power) that can impact multiple barriers.
Threat Scenarios. The final block, at the bottom of the MPB template, is used for “called-out” threats that may come from external events and that can impact the ability of the success path to perform its safety function. In the case of the FOSV, high temperatures or caustic fluids spraying from the drill pipe could prevent successful installation.
August 2017
Risk-Based Evaluation of Offshore Oil and Gas Operations | 21
Applicability MPB Approach
Safety Function
Alternate Success Path(s)
Necessary Support Systems
Threat Scenarios
Physical Barrier: Full Opening Safety Valve (FOSV)
This is a manual operation, and may be far more difficult if caustic or hot fluids are being sprayed in the work area.Flowing wellbore fluids may limit workers ability to install the FOSV.Fluid pressure may force the pipe out of the hole and make it impossible to install.
If FOSV installation is delayed or if FOSV fails to close, then shearing is the last resort.
Tripping Operations for Drilling, Completions & Workovers
Electrical power needed to operate crane/lifting device (if required)
*MASP - Maximum Anticipated Surface Pressure
Success Path
= AND gate = OR gateAND OR
Keep Fluids Contained Inside of Drill Pipe or
Tubular
Design Supports Fluid Containment
Confirm FOSV Is Rated for
MASP*
Operation Supports Fluid Containment
AND
Valve Present on Rig Floor and Operational
Valve in Open State
Operating Wrench Present
Drill Pipe at Working Height
Lift Device Available (if
required)
Trained Personnel Available
Correct Threads for Current Operation
Periodic Tests
AND
OR = OR gate
= Human Action
AND = AND gate
= Transfer gate
= System, Function, or Base Event
Figure 3: Argonne Multiple Physical Barrier Approach Template for FOSV.
To truly understand the reliability and capability of a physical barrier, it is necessary to understand the reliability and capability of success paths that support the physical barrier. Success paths often use ordinary components and depend on the routine actions of workers. The “battle for safety” becomes one of helping all parties visualize and understand the importance of these components and their need to perform successfully.
The inability of a success path to function as intended is a significant element of risk. If an alternate success path is not available to perform the safety function, then the safety function is at risk, and the physical barrier cannot be expected to perform its intended job. Consider this
Argonne SAGES Research Report for BSEE
22 | Risk-Based Evaluation of Offshore Oil and Gas Operations
example from a recent offshore incident report3:
On 27 September 2012, a well-control incident occurred (on a Gulf of Mexico location) ....At the time of the incident, the platform rig was on a location contracted for recompletion work. As the rig was pulling 2 7/8” tubing out of the well, the well started flowing, and wellbore fluids spewed out to a height of 30–40 feet in the air. As the well was flowing, well-control procedures called for the stabbing of the TIW valve into the 2 7/8” tubing by using the hydraulic hoist on the rig floor; however, the hoist was unavailable at the time because it was being used to lower 2 7/8” tubing down the V-door. This resulted in an uncontrollable, timed event….
Few people would think twice about using a hoist to lift a component on a drill floor, but when the hoist is not available to lift the FOSV into position for emergency insertion, the success path is invalidated, and there is no barrier. One method of mitigating the risk of similar barrier failure in the future could be to provide an alternate lifting mechanism for the FOSV. The device could be manufactured with suitable handles rig workers can use to manually place it in position. In this case, an alternative success path would be indicated by an OR gate in the success path diagram.
Sadly, in another incident in the Gulf of Mexico,
An FOSV was not adequately restored to operating condition after it was used for a cementing operation. When it was later called upon to operate in an emergency, it was blocked with sand and cement and could not be closed. The ensuing blowout caused the evacuation of the rig and a significant spill and contributed to the loss of a crew member4.
In this example, there was an FOSV present on the rig floor. However, the valve was not in operational condition. Once again, the barrier failure can be mapped to either a box in the success path or to one of the limiting factors noted in the MPB template.
The value of the Argonne MPB Approach is that it focuses on identifying the physical barriers, their critical functions, and the success paths (both automated and human) needed to ensure full success and safety. The approach is sufficiently intuitive for everyday use, yet powerful enough for large-scale integration and the quantification of risks. When it comes to operational safety on offshore oil and gas facilities, the “devil is in the details,” and the MPB Approach guides practitioners to systematically find and identify those details. The benefits are both for the operational team on its path toward intuitively understanding the safety implications of their roles and for the regulator through the identification of key areas for inspection.
As explained in the next example, the Argonne MPB Approach is also useful in applying risk-based techniques to compare and discuss alternative well-control techniques.
3http://www.bsee.gov/uploadedFiles/BSEE/Inspection_and_Enforcement/Accidents_and_Incidents/acc_repo/2012/HI%20A443%20Black%20Elk%2027%20Sep%202012.pdf. 4 OCS Report MMS 2002-062.
August 2017
Risk-Based Evaluation of Offshore Oil and Gas Operations | 23
CONVENTIONAL DRILLING VERSUS MANAGED-PRESSURE DRILLING Drilling fluid is one of the most dynamic and critical barriers used during the drilling process. The fluid barrier must be properly monitored and maintained at all times to be reliable. In this section, we will analyze fluid column barrier success paths to assess the benefits and limitations of the following alternative methods:
Drilling conventionally where well control is maintained solely via the use of a static or circulating drilling fluid column; and
Managed-pressure drilling (MPD), in which well control is maintained throughout the drilling operation by using a constant bottom-hole pressure (CBHP) method, sometimes also known as surface back-pressure (SBP).
In a barrier analysis, the fluid pressure barrier is sustained as long as fluid pressure remains between the pore pressure (PP) and the fracture gradient (FG) of the formation. This is the critical function of the barrier. In practice, the safety functions are realized quite differently.
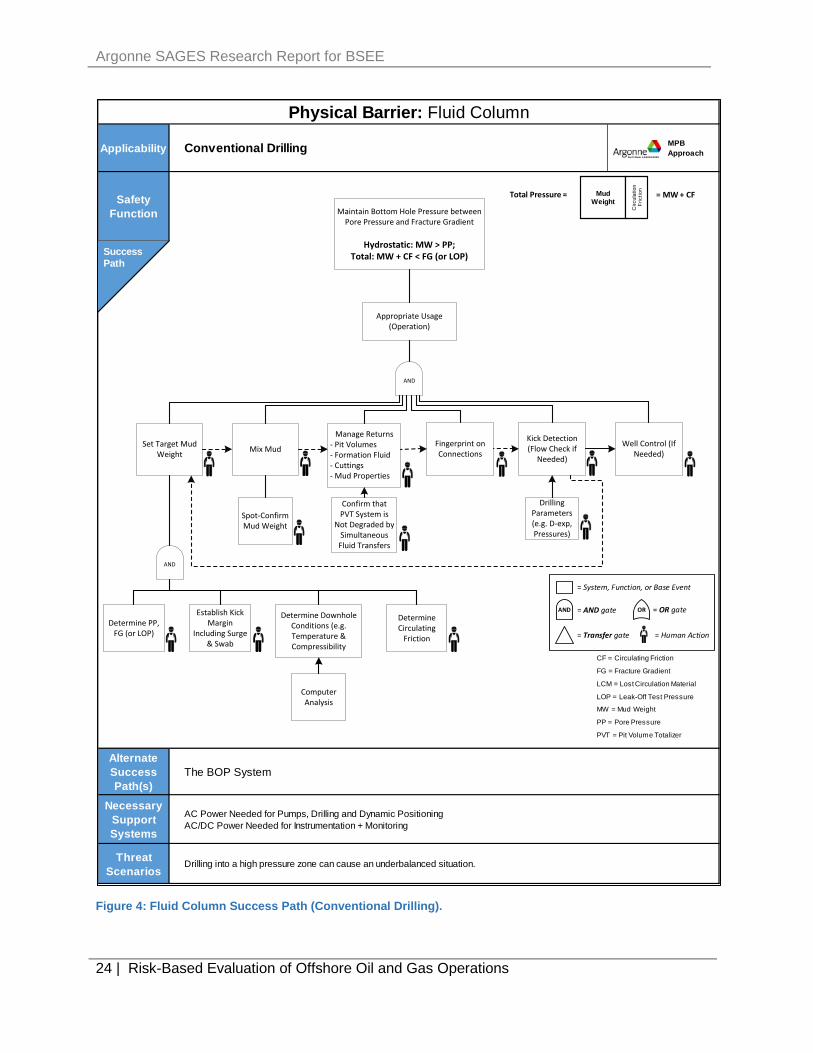
The safety function of the fluid pressure barrier for conventional drilling is specified in two parts. First, the mud weight (MW) plus the circulating friction (CF) must be less than the FG. Initially, the FG is estimated. Later, leak-off pressure (LOP) at the weakest point in the wellbore is measured via a leak-off test. The safety function ensures that mud being circulated does not fracture the formation. Additionally, as a separate requirement, the pressure induced by the static MW must be greater than the PP. This way, the well will still be overbalanced when the pressure induced by the CF of the mud is eliminated as the pumps are stopped. When either of these limits is exceeded and when fluid is either being lost to the formation or a kick is occurring, the primary barrier is degraded, possibly to the extent that it is no longer effective.
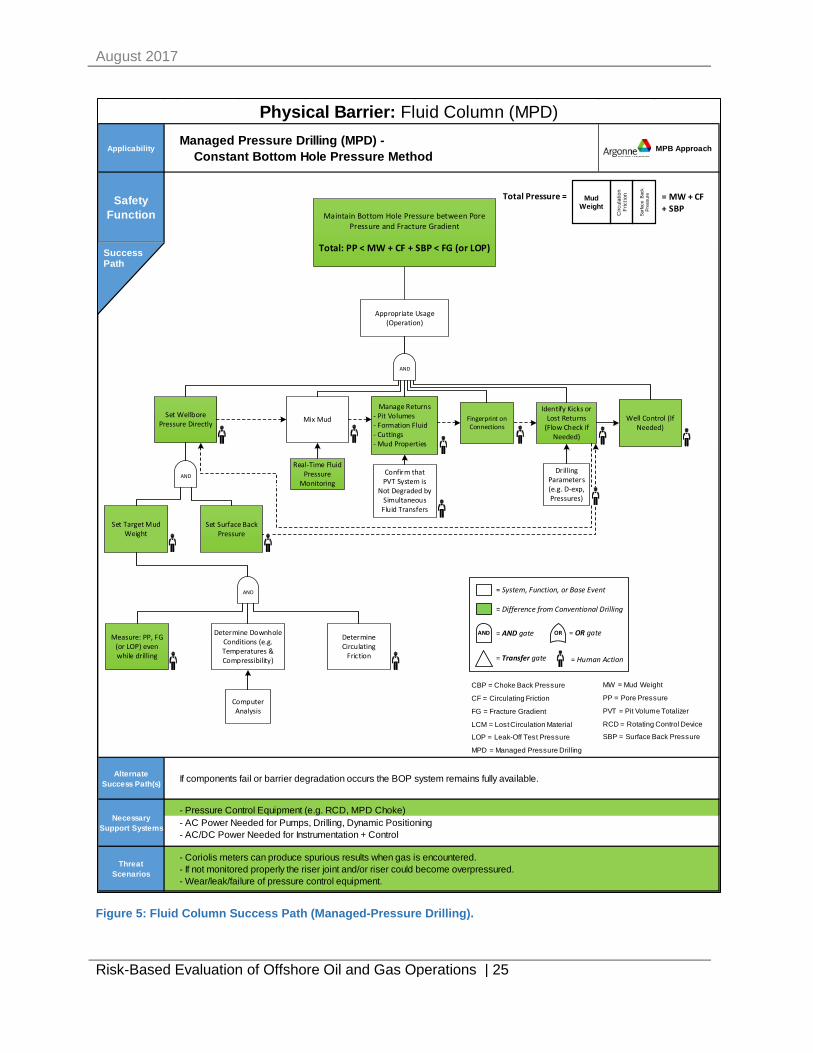
The safety function of the MPD drilling scenario does not require that the static MW be greater than the PP, as in the conventional drilling scenario. Rather, it relies on the SBP from the MPD chokes to compensate for a reduced MW. The SBP can be used to either raise or lower the overall pressure. Furthermore, SBP pressure changes can be accomplished quickly, in a matter of seconds, unlike the conventional model of changing mud weight. This adds both precision and flexibility to the MPD drilling scenario, as will be seen in the success path discussion.
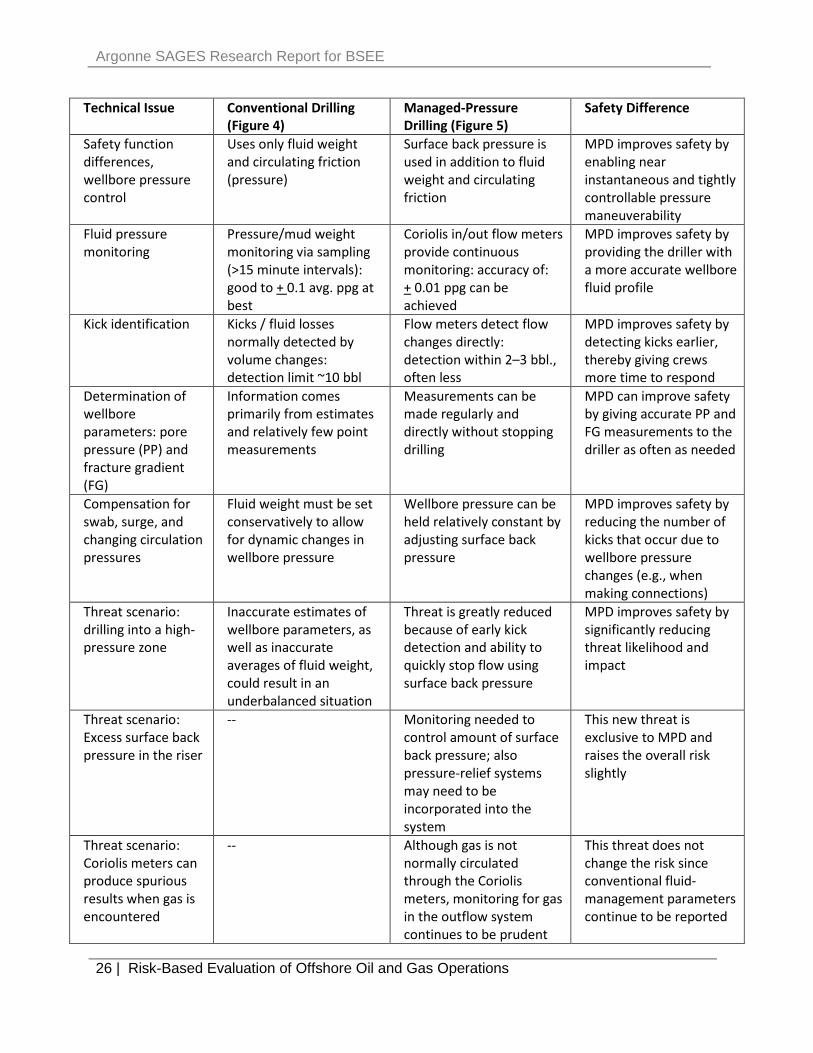
The success path in Figure 4 highlights a well-defined safety function for the conventional drilling fluid column and elucidates some key steps to support that safety function. Similarly, the success path in Figure 5 illustrates the safety function for MPD using a specific, constant bottom-hole pressure method with a pressure-containing rotating control device (RCD) located just below the riser tensioner. Key differences in the MPD diagram are highlighted in green. By comparing these two figures side by side, one can immediately see the similarities and differences in the two processes. This serves as a starting point for comparing the safety features of the two processes. A quick comparison is shown, for example, in Table 2.
Argonne SAGES Research Report for BSEE
24 | Risk-Based Evaluation of Offshore Oil and Gas Operations
Applicability MPB Approach
Safety Function
Alternate Success Path(s)
Necessary Support Systems
Threat Scenarios
Drilling into a high pressure zone can cause an underbalanced situation.
Physical Barrier: Fluid Column
Conventional Drilling
The BOP System
AC Power Needed for Pumps, Drilling and Dynamic PositioningAC/DC Power Needed for Instrumentation + Monitoring
Success Path
CF = Circulating Friction
FG = Fracture Gradient
LCM = Lost Circulation Material
LOP = Leak-Off Test Pressure
MW = Mud Weight
PP = Pore Pressure
PVT = Pit Volume Totalizer
Total Pressure = Mud Weight
Circ
ulat
ion
Fric
tion
= MW + CF
Maintain Bottom Hole Pressure between Pore Pressure and Fracture Gradient
Hydrostatic: MW > PP;Total: MW + CF < FG (or LOP)
Appropriate Usage (Operation)
AND
Manage Returns- Pit Volumes- Formation Fluid- Cuttings- Mud Properties
Kick Detection (Flow Check if
Needed)
Well Control (If Needed)Mix MudSet Target Mud
Weight
AND
Spot-Confirm Mud Weight
Confirm that PVT System is
Not Degraded by Simultaneous Fluid Transfers
Drilling Parameters (e.g. D-exp, Pressures)
Determine PP, FG (or LOP)
Establish Kick Margin
Including Surge & Swab
Determine Downhole Conditions (e.g. Temperature & Compressibility
Determine Circulating
Friction
Computer Analysis
Fingerprint on Connections
OR = OR gate
= Human Action
AND = AND gate
= Transfer gate
= System, Function, or Base Event
Figure 4: Fluid Column Success Path (Conventional Drilling).
August 2017
Risk-Based Evaluation of Offshore Oil and Gas Operations | 25
Applicability MPB Approach
Safety Function
Alternate Success Path(s)
Threat Scenarios
- Coriolis meters can produce spurious results when gas is encountered.- If not monitored properly the riser joint and/or riser could become overpressured.- Wear/leak/failure of pressure control equipment.
Physical Barrier: Fluid Column (MPD)Managed Pressure Drilling (MPD) - Constant Bottom Hole Pressure Method
If components fail or barrier degradation occurs the BOP system remains fully available.
- Pressure Control Equipment (e.g. RCD, MPD Choke)- AC Power Needed for Pumps, Drilling, Dynamic Positioning- AC/DC Power Needed for Instrumentation + Control
Necessary Support Systems
Success Path
CBP = Choke Back Pressure
CF = Circulating Friction
FG = Fracture Gradient
LCM = Lost Circulation Material
LOP = Leak-Off Test Pressure
MPD = Managed Pressure Drilling
MW = Mud Weight
PP = Pore Pressure
PVT = Pit Volume Totalizer
RCD = Rotating Control Device
SBP = Surface Back Pressure
= Differences from Conventional Drilling
Total Pressure = Mud Weight
Circ
ulat
ion
Fric
tion
Surfa
ceBa
ck
Pres
sure = MW + CF
+ SBPMaintain Bottom Hole Pressure between Pore
Pressure and Fracture Gradient
Total: PP < MW + CF + SBP < FG (or LOP)
Appropriate Usage (Operation)
AND
Set Wellbore Pressure Directly
AND
Set Target Mud Weight
Set Surface Back Pressure
AND
Measure: PP, FG (or LOP) even while drilling
Determine Downhole Conditions (e.g. Temperatures & Compressibility)
Determine Circulating
Friction
Mix Mud
Manage Returns- Pit Volumes- Formation Fluid- Cuttings- Mud Properties
Identify Kicks or Lost Returns
(Flow Check if Needed)
Well Control (If Needed)
Confirm that PVT System is
Not Degraded by Simultaneous Fluid Transfers
Drilling Parameters (e.g. D-exp, Pressures)
Computer Analysis
Real-Time Fluid Pressure
Monitoring
Fingerprint on Connections
OR = OR gate
= Human Action
AND = AND gate
= Transfer gate
= System, Function, or Base Event
= Difference from Conventional Drilling
Figure 5: Fluid Column Success Path (Managed-Pressure Drilling).
Argonne SAGES Research Report for BSEE
26 | Risk-Based Evaluation of Offshore Oil and Gas Operations
Technical Issue Conventional Drilling (Figure 4)
Managed-Pressure Drilling (Figure 5)
Safety Difference
Safety function differences, wellbore pressure control
Uses only fluid weight and circulating friction (pressure)
Surface back pressure is used in addition to fluid weight and circulating friction
MPD improves safety by enabling near instantaneous and tightly controllable pressure maneuverability
Fluid pressure monitoring
Pressure/mud weight monitoring via sampling (>15 minute intervals): good to + 0.1 avg. ppg at best
Coriolis in/out flow meters provide continuous monitoring: accuracy of: + 0.01 ppg can beachieved
MPD improves safety by providing the driller with a more accurate wellbore fluid profile
Kick identification Kicks / fluid losses normally detected by volume changes: detection limit ~10 bbl
Flow meters detect flow changes directly: detection within 2–3 bbl., often less
MPD improves safety by detecting kicks earlier, thereby giving crews more time to respond
Determination of wellbore parameters: pore pressure (PP) and fracture gradient (FG)
Information comes primarily from estimates and relatively few point measurements
Measurements can be made regularly and directly without stopping drilling
MPD can improve safety by giving accurate PP and FG measurements to the driller as often as needed
Compensation for swab, surge, and changing circulation pressures
Fluid weight must be set conservatively to allow for dynamic changes in wellbore pressure
Wellbore pressure can be held relatively constant by adjusting surface back pressure
MPD improves safety by reducing the number of kicks that occur due to wellbore pressure changes (e.g., when making connections)
Threat scenario: drilling into a high-pressure zone
Inaccurate estimates of wellbore parameters, as well as inaccurate averages of fluid weight, could result in an underbalanced situation
Threat is greatly reduced because of early kick detection and ability to quickly stop flow using surface back pressure
MPD improves safety by significantly reducing threat likelihood and impact
Threat scenario: Excess surface back pressure in the riser
-- Monitoring needed to control amount of surface back pressure; also pressure-relief systems may need to be incorporated into the system
This new threat is exclusive to MPD and raises the overall risk slightly
Threat scenario: Coriolis meters can produce spurious results when gas is encountered
-- Although gas is not normally circulated through the Coriolis meters, monitoring for gas in the outflow system continues to be prudent
This threat does not change the risk since conventional fluid-management parameters continue to be reported

August 2017
Risk-Based Evaluation of Offshore Oil and Gas Operations | 27
Threat scenario: Wear / leak / failure of the rotating control device (RCD)
Monitoring needed to respond to leaks or failure of the RCD
This new threat is exclusive to MPD and raises the overall risk slightly
Table 2: Using the MPB Approach to Compare Conventional and Managed-Pressure Drilling5.
As demonstrated in the above comparison, the Argonne MPB Approach provides a systematic and repeatable process for illustrating, understanding, and comparing different technology systems and weighing the pros and cons of each. Differences that impact operational risk can be readily seen in the comparison.
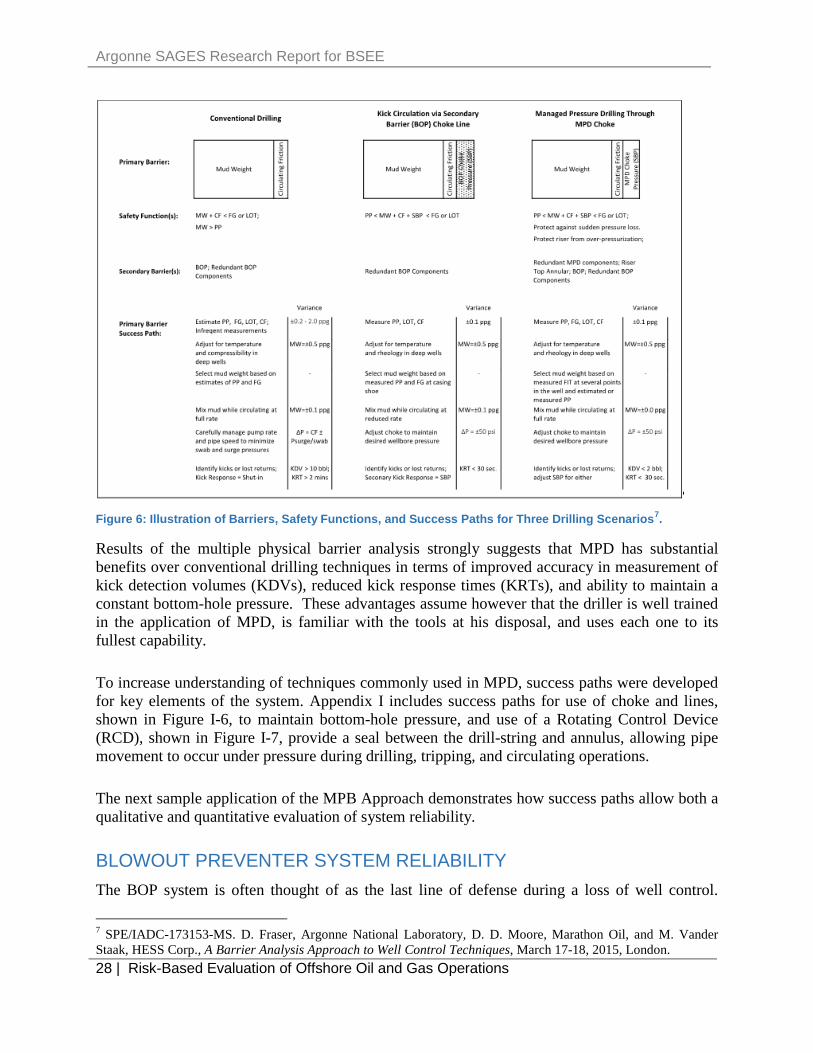
This research was extended by combining the pressure control success paths with estimated variances and kick performance indicators6 to aid in the evaluation of alternative drilling scenarios. Figure 6 displays the barriers, safety functions, and success paths for the three evaluated scenarios.
5 SPE-174995-MS. D. Fraser, J. Braun, M. Cunningham, Argonne National Laboratory, D. D. Moore, Marathon Oil, A. Sas-Jaworsky, SAS Industries Inc.; J. Wilson, Transocean, Operational Risk: Stepping Beyond Bow-Ties,September 28-30, 2015, Houston.6 SPE 170756-MS. D. Fraser, R. Lindley, Argonne National Laboratory, D. Moore, Marathon Oil, M. Vander Staak,Hess Corp., Early Kick Detection Methods and Technologies, October 27-29, 2014, Amsterdam.
Argonne SAGES Research Report for BSEE
28 | Risk-Based Evaluation of Offshore Oil and Gas Operations
Figure 6: Illustration of Barriers, Safety Functions, and Success Paths for Three Drilling Scenarios7.
Results of the multiple physical barrier analysis strongly suggests that MPD has substantial benefits over conventional drilling techniques in terms of improved accuracy in measurement of kick detection volumes (KDVs), reduced kick response times (KRTs), and ability to maintain a constant bottom-hole pressure. These advantages assume however that the driller is well trained in the application of MPD, is familiar with the tools at his disposal, and uses each one to its fullest capability.
To increase understanding of techniques commonly used in MPD, success paths were developed for key elements of the system. Appendix I includes success paths for use of choke and lines, shown in Figure I-6, to maintain bottom-hole pressure, and use of a Rotating Control Device (RCD), shown in Figure I-7, provide a seal between the drill-string and annulus, allowing pipe movement to occur under pressure during drilling, tripping, and circulating operations.
The next sample application of the MPB Approach demonstrates how success paths allow both a qualitative and quantitative evaluation of system reliability.
BLOWOUT PREVENTER SYSTEM RELIABILITY The BOP system is often thought of as the last line of defense during a loss of well control.
7 SPE/IADC-173153-MS. D. Fraser, Argonne National Laboratory, D. D. Moore, Marathon Oil, and M. Vander Staak, HESS Corp., A Barrier Analysis Approach to Well Control Techniques, March 17-18, 2015, London.
August 2017
Risk-Based Evaluation of Offshore Oil and Gas Operations | 29
However, as a complex electromechanical system subject to extreme environmental conditions, ensuring high-functional reliability of the BOP can be challenging. The Argonne MPB Approach was applied to evaluate the impact of BOP performance on operational risk. The focus of this study was on successful operation of the Blind Shear Ram (BSR), which is the only BOP element that can cut drill pipe and seal the wellbore. The BOP system reliability study report8 is summarized below.
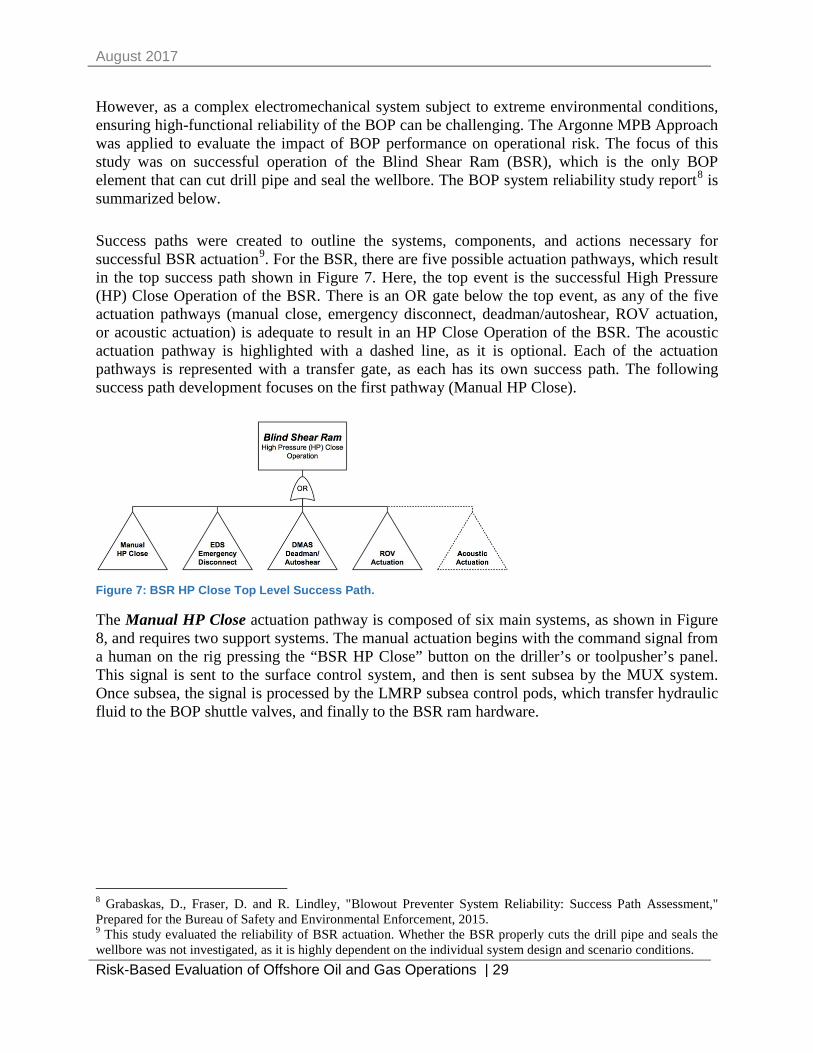
Success paths were created to outline the systems, components, and actions necessary for successful BSR actuation9. For the BSR, there are five possible actuation pathways, which result in the top success path shown in Figure 7. Here, the top event is the successful High Pressure (HP) Close Operation of the BSR. There is an OR gate below the top event, as any of the five actuation pathways (manual close, emergency disconnect, deadman/autoshear, ROV actuation, or acoustic actuation) is adequate to result in an HP Close Operation of the BSR. The acoustic actuation pathway is highlighted with a dashed line, as it is optional. Each of the actuation pathways is represented with a transfer gate, as each has its own success path. The following success path development focuses on the first pathway (Manual HP Close).
Figure 7: BSR HP Close Top Level Success Path.
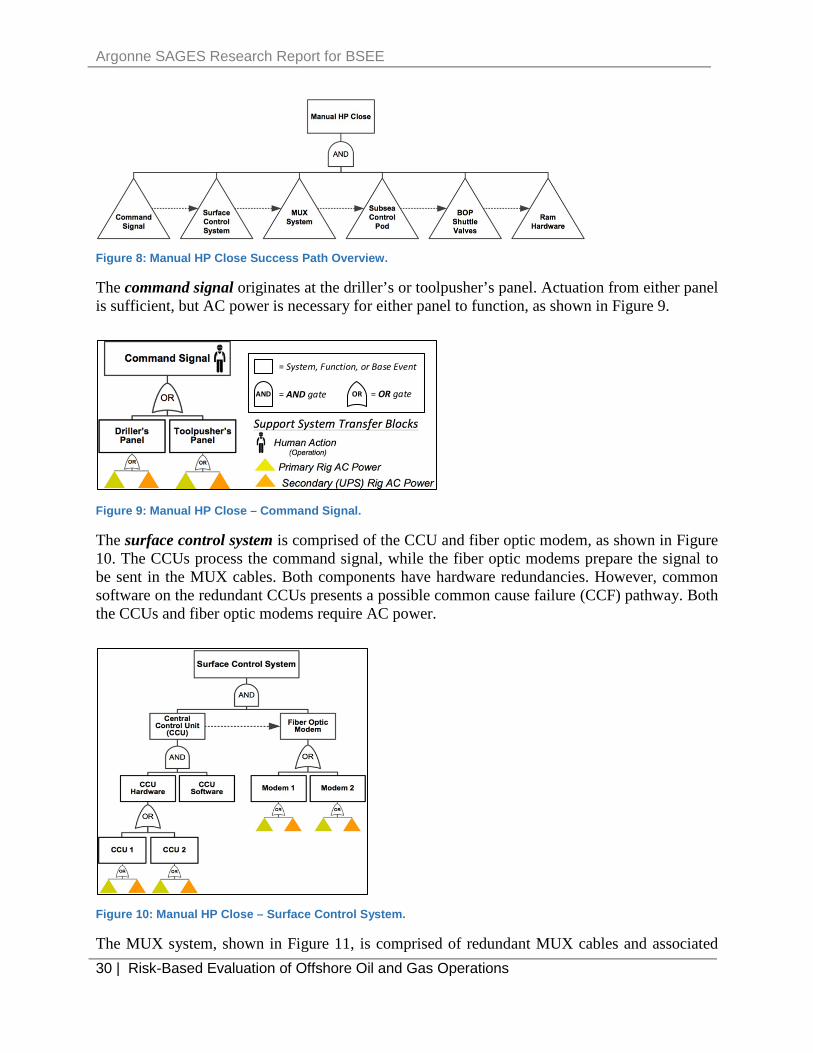
The Manual HP Close actuation pathway is composed of six main systems, as shown in Figure 8, and requires two support systems. The manual actuation begins with the command signal from a human on the rig pressing the “BSR HP Close” button on the driller’s or toolpusher’s panel. This signal is sent to the surface control system, and then is sent subsea by the MUX system. Once subsea, the signal is processed by the LMRP subsea control pods, which transfer hydraulic fluid to the BOP shuttle valves, and finally to the BSR ram hardware.
8 Grabaskas, D., Fraser, D. and R. Lindley, "Blowout Preventer System Reliability: Success Path Assessment," Prepared for the Bureau of Safety and Environmental Enforcement, 2015. 9 This study evaluated the reliability of BSR actuation. Whether the BSR properly cuts the drill pipe and seals the wellbore was not investigated, as it is highly dependent on the individual system design and scenario conditions.
Argonne SAGES Research Report for BSEE
30 | Risk-Based Evaluation of Offshore Oil and Gas Operations
Figure 8: Manual HP Close Success Path Overview.
The command signal originates at the driller’s or toolpusher’s panel. Actuation from either panel is sufficient, but AC power is necessary for either panel to function, as shown in Figure 9.
OR = OR gateAND = AND gate
= System, Function, or Base Event
Figure 9: Manual HP Close – Command Signal.
The surface control system is comprised of the CCU and fiber optic modem, as shown in Figure 10. The CCUs process the command signal, while the fiber optic modems prepare the signal tobe sent in the MUX cables. Both components have hardware redundancies. However, commonsoftware on the redundant CCUs presents a possible common cause failure (CCF) pathway. Boththe CCUs and fiber optic modems require AC power.
Figure 10: Manual HP Close – Surface Control System.
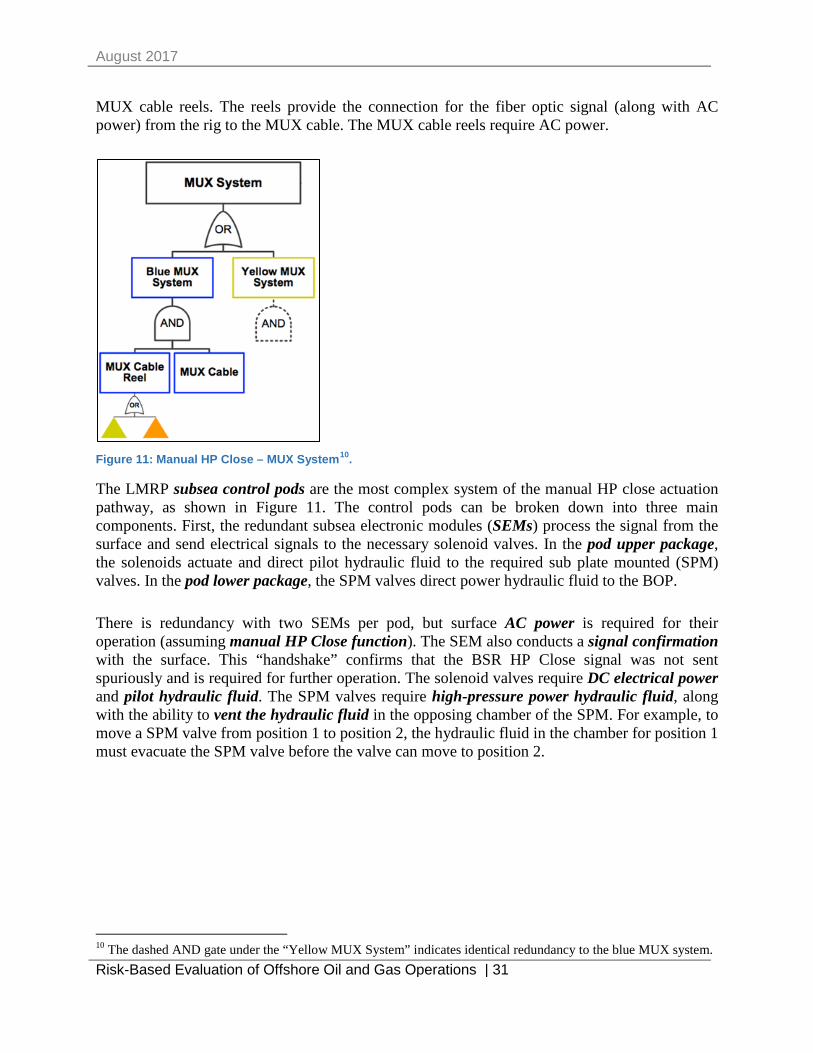
The MUX system, shown in Figure 11, is comprised of redundant MUX cables and associated
August 2017
Risk-Based Evaluation of Offshore Oil and Gas Operations | 31
MUX cable reels. The reels provide the connection for the fiber optic signal (along with AC power) from the rig to the MUX cable. The MUX cable reels require AC power.
Figure 11: Manual HP Close – MUX System10.
The LMRP subsea control pods are the most complex system of the manual HP close actuation pathway, as shown in Figure 11. The control pods can be broken down into three main components. First, the redundant subsea electronic modules (SEMs) process the signal from the surface and send electrical signals to the necessary solenoid valves. In the pod upper package, the solenoids actuate and direct pilot hydraulic fluid to the required sub plate mounted (SPM) valves. In the pod lower package, the SPM valves direct power hydraulic fluid to the BOP.
There is redundancy with two SEMs per pod, but surface AC power is required for their operation (assuming manual HP Close function). The SEM also conducts a signal confirmation with the surface. This “handshake” confirms that the BSR HP Close signal was not sent spuriously and is required for further operation. The solenoid valves require DC electrical power and pilot hydraulic fluid. The SPM valves require high-pressure power hydraulic fluid, along with the ability to vent the hydraulic fluid in the opposing chamber of the SPM. For example, to move a SPM valve from position 1 to position 2, the hydraulic fluid in the chamber for position 1 must evacuate the SPM valve before the valve can move to position 2.
10 The dashed AND gate under the “Yellow MUX System” indicates identical redundancy to the blue MUX system.
Argonne SAGES Research Report for BSEE
32 | Risk-Based Evaluation of Offshore Oil and Gas Operations
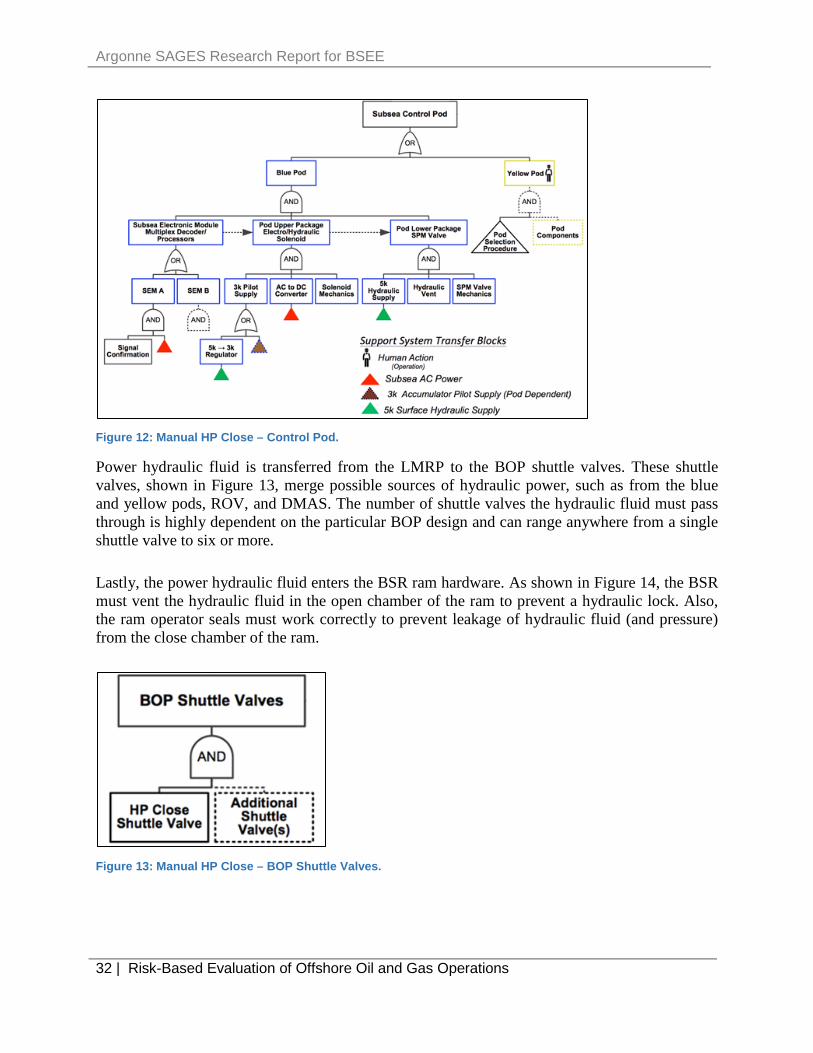
Figure 12: Manual HP Close – Control Pod.
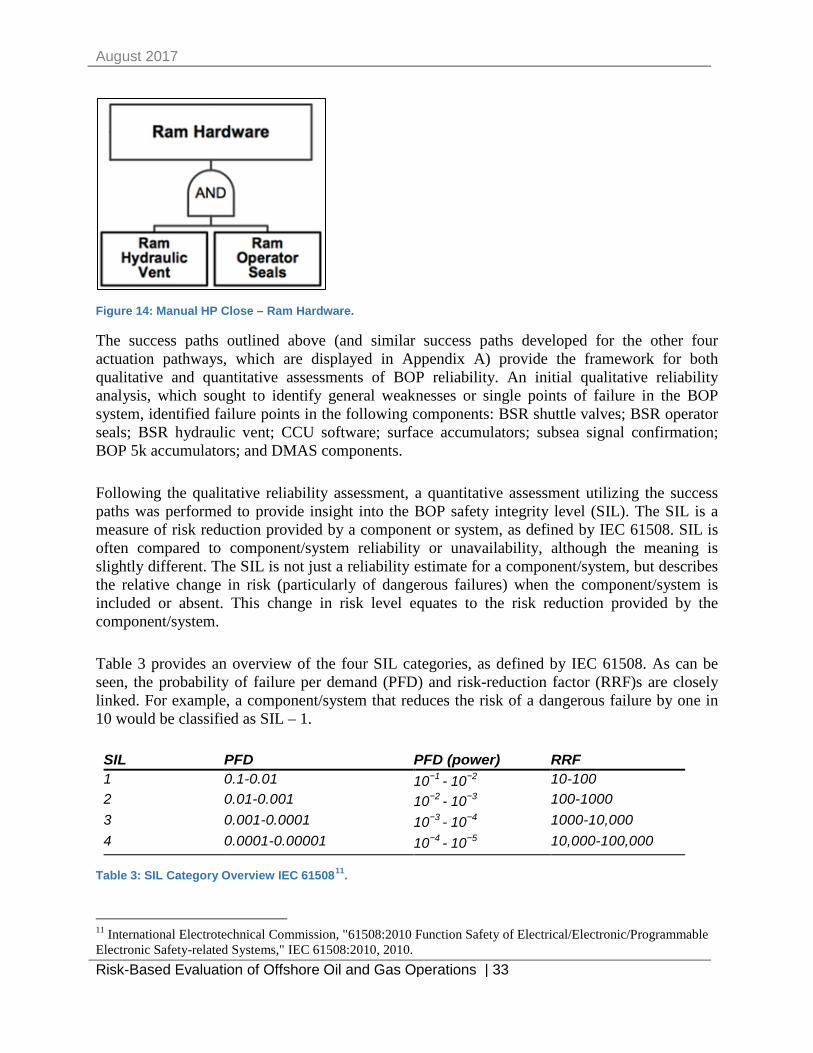
Power hydraulic fluid is transferred from the LMRP to the BOP shuttle valves. These shuttle valves, shown in Figure 13, merge possible sources of hydraulic power, such as from the blue and yellow pods, ROV, and DMAS. The number of shuttle valves the hydraulic fluid must pass through is highly dependent on the particular BOP design and can range anywhere from a single shuttle valve to six or more.
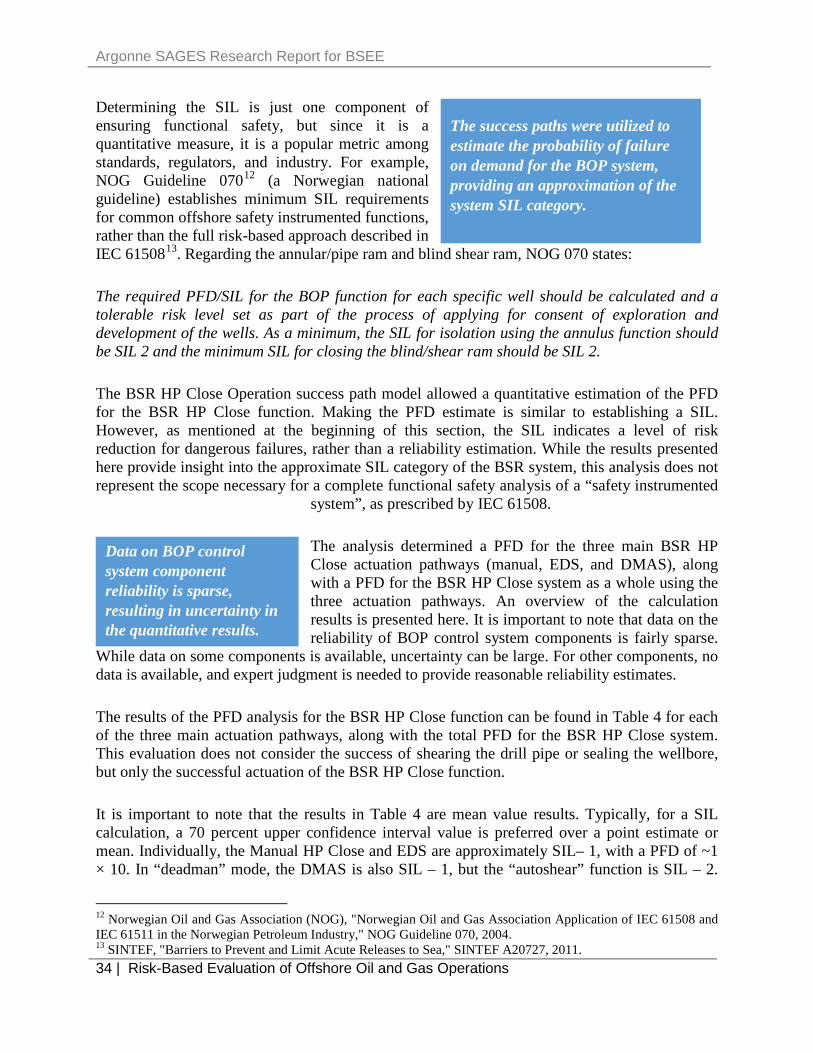
Lastly, the power hydraulic fluid enters the BSR ram hardware. As shown in Figure 14, the BSR must vent the hydraulic fluid in the open chamber of the ram to prevent a hydraulic lock. Also, the ram operator seals must work correctly to prevent leakage of hydraulic fluid (and pressure) from the close chamber of the ram.
Figure 13: Manual HP Close – BOP Shuttle Valves.
August 2017
Risk-Based Evaluation of Offshore Oil and Gas Operations | 33
Figure 14: Manual HP Close – Ram Hardware.
The success paths outlined above (and similar success paths developed for the other four actuation pathways, which are displayed in Appendix A) provide the framework for both qualitative and quantitative assessments of BOP reliability. An initial qualitative reliability analysis, which sought to identify general weaknesses or single points of failure in the BOP system, identified failure points in the following components: BSR shuttle valves; BSR operator seals; BSR hydraulic vent; CCU software; surface accumulators; subsea signal confirmation; BOP 5k accumulators; and DMAS components.
Following the qualitative reliability assessment, a quantitative assessment utilizing the success paths was performed to provide insight into the BOP safety integrity level (SIL). The SIL is a measure of risk reduction provided by a component or system, as defined by IEC 61508. SIL is often compared to component/system reliability or unavailability, although the meaning is slightly different. The SIL is not just a reliability estimate for a component/system, but describes the relative change in risk (particularly of dangerous failures) when the component/system is included or absent. This change in risk level equates to the risk reduction provided by the component/system.
Table 3 provides an overview of the four SIL categories, as defined by IEC 61508. As can be seen, the probability of failure per demand (PFD) and risk-reduction factor (RRF)s are closely linked. For example, a component/system that reduces the risk of a dangerous failure by one in 10 would be classified as SIL – 1.
SIL PFD PFD (power) RRF 1 0.1-0.01 10−1 - 10−2
10-1002 0.01-0.001 10−2 - 10−3
100-10003 0.001-0.0001 10−3 - 10−4
1000-10,0004 0.0001-0.00001 10−4 - 10−5
10,000-100,000
Table 3: SIL Category Overview IEC 6150811.
11 International Electrotechnical Commission, "61508:2010 Function Safety of Electrical/Electronic/Programmable Electronic Safety-related Systems," IEC 61508:2010, 2010.
Argonne SAGES Research Report for BSEE
34 | Risk-Based Evaluation of Offshore Oil and Gas Operations
Determining the SIL is just one component of ensuring functional safety, but since it is a quantitative measure, it is a popular metric among standards, regulators, and industry. For example, NOG Guideline 07012 (a Norwegian national guideline) establishes minimum SIL requirements for common offshore safety instrumented functions, rather than the full risk-based approach described in IEC 6150813. Regarding the annular/pipe ram and blind shear ram, NOG 070 states:
The required PFD/SIL for the BOP function for each specific well should be calculated and a tolerable risk level set as part of the process of applying for consent of exploration and development of the wells. As a minimum, the SIL for isolation using the annulus function should be SIL 2 and the minimum SIL for closing the blind/shear ram should be SIL 2.
The BSR HP Close Operation success path model allowed a quantitative estimation of the PFD for the BSR HP Close function. Making the PFD estimate is similar to establishing a SIL. However, as mentioned at the beginning of this section, the SIL indicates a level of risk reduction for dangerous failures, rather than a reliability estimation. While the results presented here provide insight into the approximate SIL category of the BSR system, this analysis does not represent the scope necessary for a complete functional safety analysis of a “safety instrumented
system”, as prescribed by IEC 61508.
The analysis determined a PFD for the three main BSR HP Close actuation pathways (manual, EDS, and DMAS), along with a PFD for the BSR HP Close system as a whole using the three actuation pathways. An overview of the calculation results is presented here. It is important to note that data on the reliability of BOP control system components is fairly sparse.
While data on some components is available, uncertainty can be large. For other components, no data is available, and expert judgment is needed to provide reasonable reliability estimates.
The results of the PFD analysis for the BSR HP Close function can be found in Table 4 for each of the three main actuation pathways, along with the total PFD for the BSR HP Close system. This evaluation does not consider the success of shearing the drill pipe or sealing the wellbore, but only the successful actuation of the BSR HP Close function.
It is important to note that the results in Table 4 are mean value results. Typically, for a SIL calculation, a 70 percent upper confidence interval value is preferred over a point estimate or mean. Individually, the Manual HP Close and EDS are approximately SIL– 1, with a PFD of ~1 × 10. In “deadman” mode, the DMAS is also SIL – 1, but the “autoshear” function is SIL – 2.
The success paths were utilized to estimate the probability of failure on demand for the BOP system, providing an approximation of the system SIL category.
Data on BOP control system component reliability is sparse, resulting in uncertainty in the quantitative results.
12 Norwegian Oil and Gas Association (NOG), "Norwegian Oil and Gas Association Application of IEC 61508 and IEC 61511 in the Norwegian Petroleum Industry," NOG Guideline 070, 2004. 13 SINTEF, "Barriers to Prevent and Limit Acute Releases to Sea," SINTEF A20727, 2011.
August 2017
Risk-Based Evaluation of Offshore Oil and Gas Operations | 35
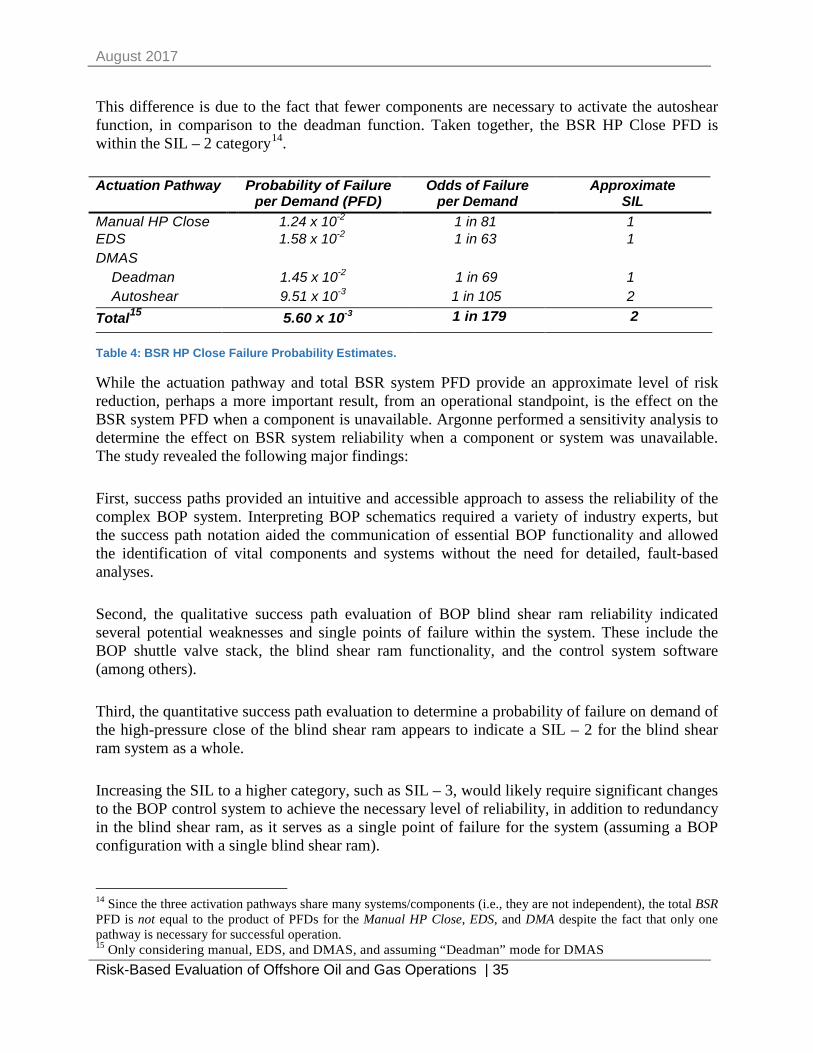
This difference is due to the fact that fewer components are necessary to activate the autoshear function, in comparison to the deadman function. Taken together, the BSR HP Close PFD is within the SIL – 2 category14.
Actuation Pathway Probability of Failure per Demand (PFD)
Odds of Failure per Demand
Approximate SIL
Manual HP Close 1.24 x 10⁻² 1 in 81 1 EDS 1.58 x 10⁻² 1 in 63 1 DMAS
Deadman 1.45 x 10⁻² 1 in 69 1 Autoshear 9.51 x 10⁻³ 1 in 105 2
Total15 5.60 x 10⁻³ 1 in 179 2
Table 4: BSR HP Close Failure Probability Estimates.
While the actuation pathway and total BSR system PFD provide an approximate level of risk reduction, perhaps a more important result, from an operational standpoint, is the effect on the BSR system PFD when a component is unavailable. Argonne performed a sensitivity analysis to determine the effect on BSR system reliability when a component or system was unavailable. The study revealed the following major findings:
First, success paths provided an intuitive and accessible approach to assess the reliability of the complex BOP system. Interpreting BOP schematics required a variety of industry experts, but the success path notation aided the communication of essential BOP functionality and allowed the identification of vital components and systems without the need for detailed, fault-based analyses.
Second, the qualitative success path evaluation of BOP blind shear ram reliability indicated several potential weaknesses and single points of failure within the system. These include the BOP shuttle valve stack, the blind shear ram functionality, and the control system software (among others).
Third, the quantitative success path evaluation to determine a probability of failure on demand of the high-pressure close of the blind shear ram appears to indicate a SIL – 2 for the blind shear ram system as a whole.
Increasing the SIL to a higher category, such as SIL – 3, would likely require significant changes to the BOP control system to achieve the necessary level of reliability, in addition to redundancy in the blind shear ram, as it serves as a single point of failure for the system (assuming a BOP configuration with a single blind shear ram).
14 Since the three activation pathways share many systems/components (i.e., they are not independent), the total BSR PFD is not equal to the product of PFDs for the Manual HP Close, EDS, and DMA despite the fact that only one pathway is necessary for successful operation. 15 Only considering manual, EDS, and DMAS, and assuming “Deadman” mode for DMAS
Argonne SAGES Research Report for BSEE
36 | Risk-Based Evaluation of Offshore Oil and Gas Operations
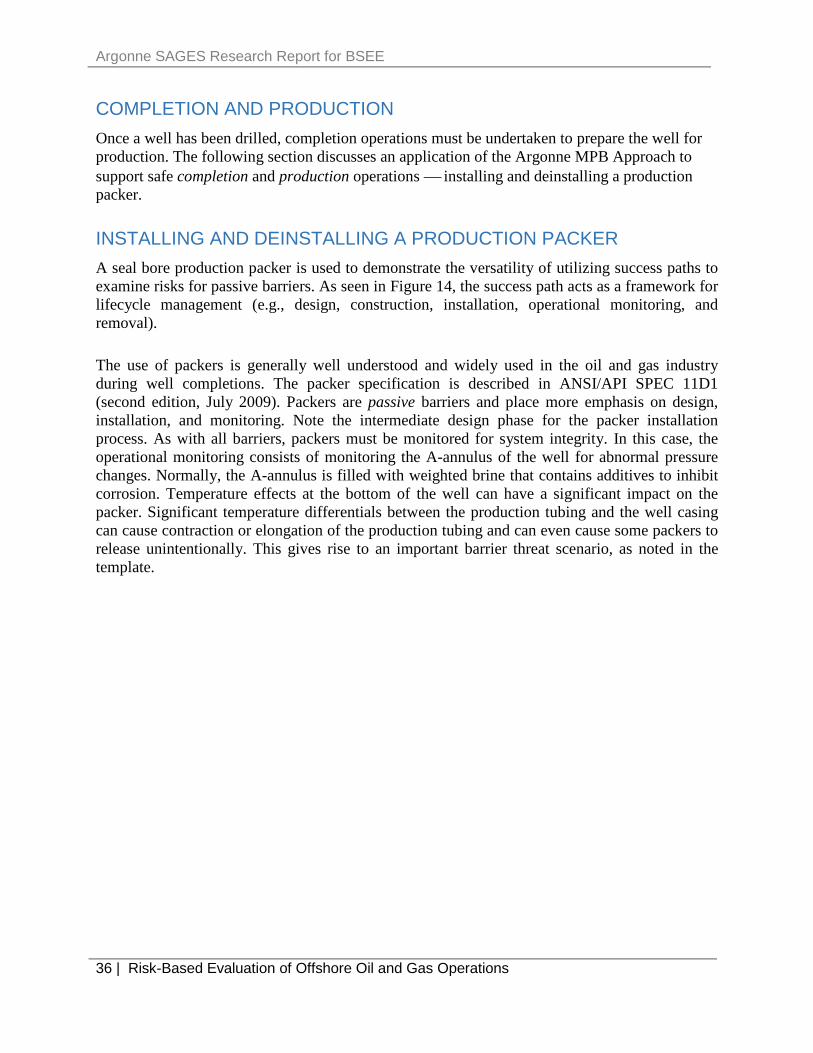
COMPLETION AND PRODUCTION Once a well has been drilled, completion operations must be undertaken to prepare the well for production. The following section discusses an application of the Argonne MPB Approach to support safe completion and production operations installing and deinstalling a production packer.
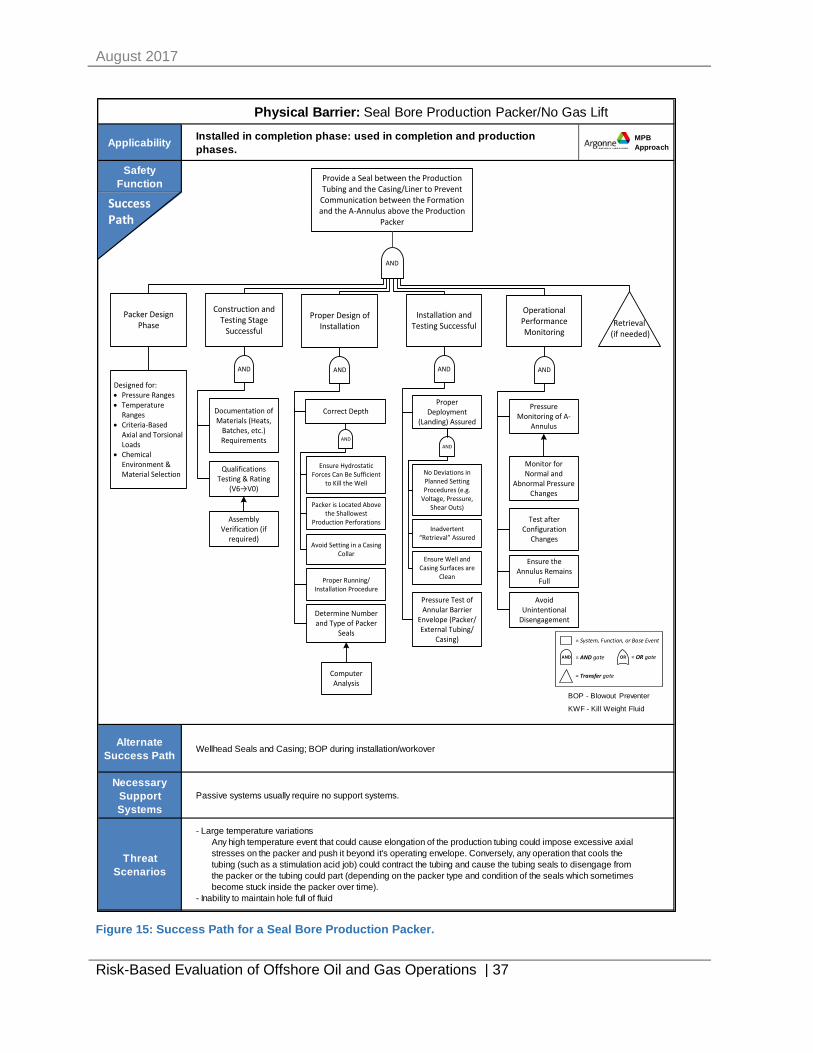
INSTALLING AND DEINSTALLING A PRODUCTION PACKER A seal bore production packer is used to demonstrate the versatility of utilizing success paths to examine risks for passive barriers. As seen in Figure 14, the success path acts as a framework for lifecycle management (e.g., design, construction, installation, operational monitoring, and removal).
The use of packers is generally well understood and widely used in the oil and gas industry during well completions. The packer specification is described in ANSI/API SPEC 11D1 (second edition, July 2009). Packers are passive barriers and place more emphasis on design, installation, and monitoring. Note the intermediate design phase for the packer installation process. As with all barriers, packers must be monitored for system integrity. In this case, the operational monitoring consists of monitoring the A-annulus of the well for abnormal pressure changes. Normally, the A-annulus is filled with weighted brine that contains additives to inhibit corrosion. Temperature effects at the bottom of the well can have a significant impact on the packer. Significant temperature differentials between the production tubing and the well casing can cause contraction or elongation of the production tubing and can even cause some packers to release unintentionally. This gives rise to an important barrier threat scenario, as noted in the template.
August 2017
Risk-Based Evaluation of Offshore Oil and Gas Operations | 37
Physical Barrier: Seal Bore Production Packer/No Gas Lift
Applicability MPB Approach
Safety Function
Alternate Success Path
Necessary Support Systems
Threat Scenarios
Installed in completion phase: used in completion and production phases.
- Large temperature variationsAny high temperature event that could cause elongation of the production tubing could impose excessive axial
stresses on the packer and push it beyond it's operating envelope. Conversely, any operation that cools the tubing (such as a stimulation acid job) could contract the tubing and cause the tubing seals to disengage from the packer or the tubing could part (depending on the packer type and condition of the seals which sometimes become stuck inside the packer over time).- Inability to maintain hole full of fluid
Wellhead Seals and Casing; BOP during installation/workover
Passive systems usually require no support systems.
Success Path
BOP - Blowout Preventer
KWF - Kill Weight Fluid
Provide a Seal between the Production Tubing and the Casing/Liner to Prevent
Communication between the Formation and the A-Annulus above the Production
Packer
Packer Design Phase
Construction and Testing Stage
Successful
Installation and Testing Successful
Operational Performance Monitoring
Designed for:• Pressure Ranges• Temperature
Ranges• Criteria-Based
Axial and Torsional Loads
• Chemical Environment & Material Selection
Documentation of Materials (Heats,
Batches, etc.) Requirements
Qualifications Testing & Rating
(V6→V0)
Assembly Verification (if
required)
Ensure Well and Casing Surfaces are
Clean
No Deviations in Planned Setting Procedures (e.g.
Voltage, Pressure, Shear Outs)
Proper Deployment
(Landing) Assured
Inadvertent “Retrieval” Assured
Pressure Test of Annular Barrier
Envelope (Packer/External Tubing/
Casing)
Pressure Monitoring of A-
Annulus
Monitor for Normal and
Abnormal Pressure Changes
Test after Configuration
Changes
AND
AND AND AND
AND
Ensure Hydrostatic Forces Can Be Sufficient
to Kill the Well
Packer is Located Above the Shallowest
Production Perforations
AND
Avoid Unintentional
Disengagement
Retrieval (if needed)
Ensure the Annulus Remains
Full
Avoid Setting in a Casing Collar
Proper Design of Installation
AND
Correct Depth
Determine Number and Type of Packer
Seals
Computer Analysis
Proper Running/Installation Procedure
OR = OR gateAND = AND gate
= Transfer gate
= System, Function, or Base Event
Figure 15: Success Path for a Seal Bore Production Packer.
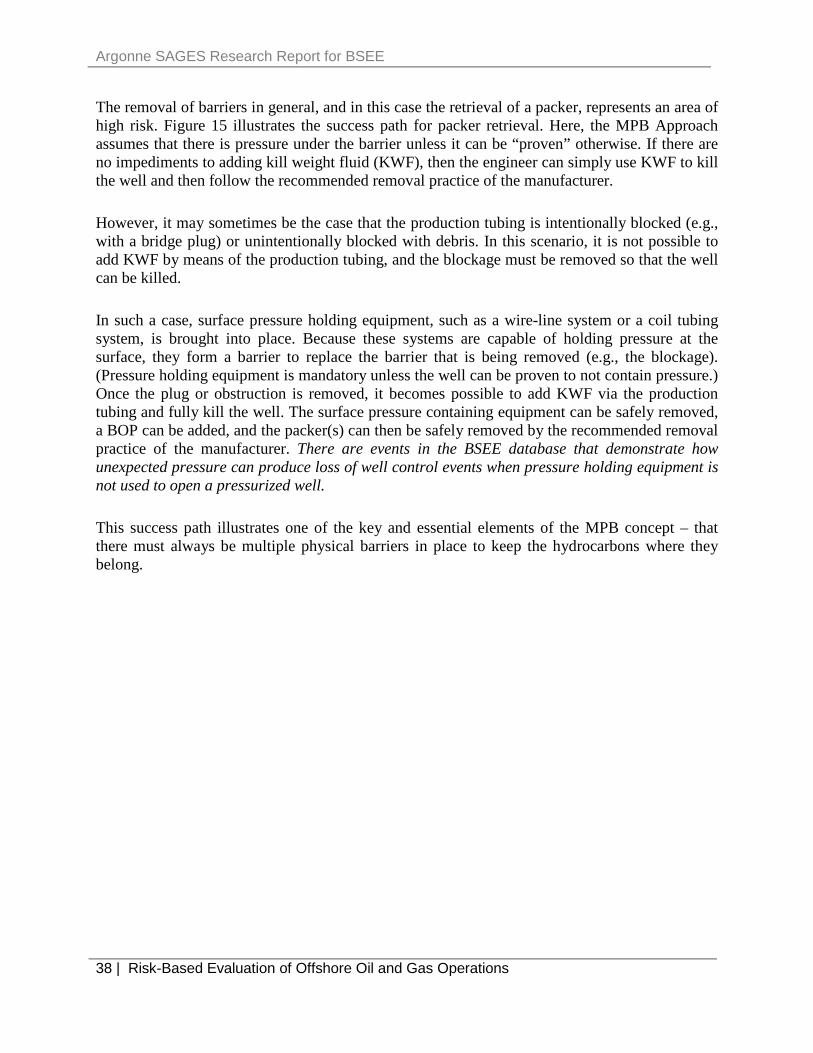
Argonne SAGES Research Report for BSEE
38 | Risk-Based Evaluation of Offshore Oil and Gas Operations
The removal of barriers in general, and in this case the retrieval of a packer, represents an area of high risk. Figure 15 illustrates the success path for packer retrieval. Here, the MPB Approach assumes that there is pressure under the barrier unless it can be “proven” otherwise. If there are no impediments to adding kill weight fluid (KWF), then the engineer can simply use KWF to kill the well and then follow the recommended removal practice of the manufacturer.
However, it may sometimes be the case that the production tubing is intentionally blocked (e.g., with a bridge plug) or unintentionally blocked with debris. In this scenario, it is not possible to add KWF by means of the production tubing, and the blockage must be removed so that the well can be killed.
In such a case, surface pressure holding equipment, such as a wire-line system or a coil tubing system, is brought into place. Because these systems are capable of holding pressure at the surface, they form a barrier to replace the barrier that is being removed (e.g., the blockage). (Pressure holding equipment is mandatory unless the well can be proven to not contain pressure.) Once the plug or obstruction is removed, it becomes possible to add KWF via the production tubing and fully kill the well. The surface pressure containing equipment can be safely removed, a BOP can be added, and the packer(s) can then be safely removed by the recommended removal practice of the manufacturer. There are events in the BSEE database that demonstrate how unexpected pressure can produce loss of well control events when pressure holding equipment is not used to open a pressurized well.
This success path illustrates one of the key and essential elements of the MPB concept – that there must always be multiple physical barriers in place to keep the hydrocarbons where they belong.
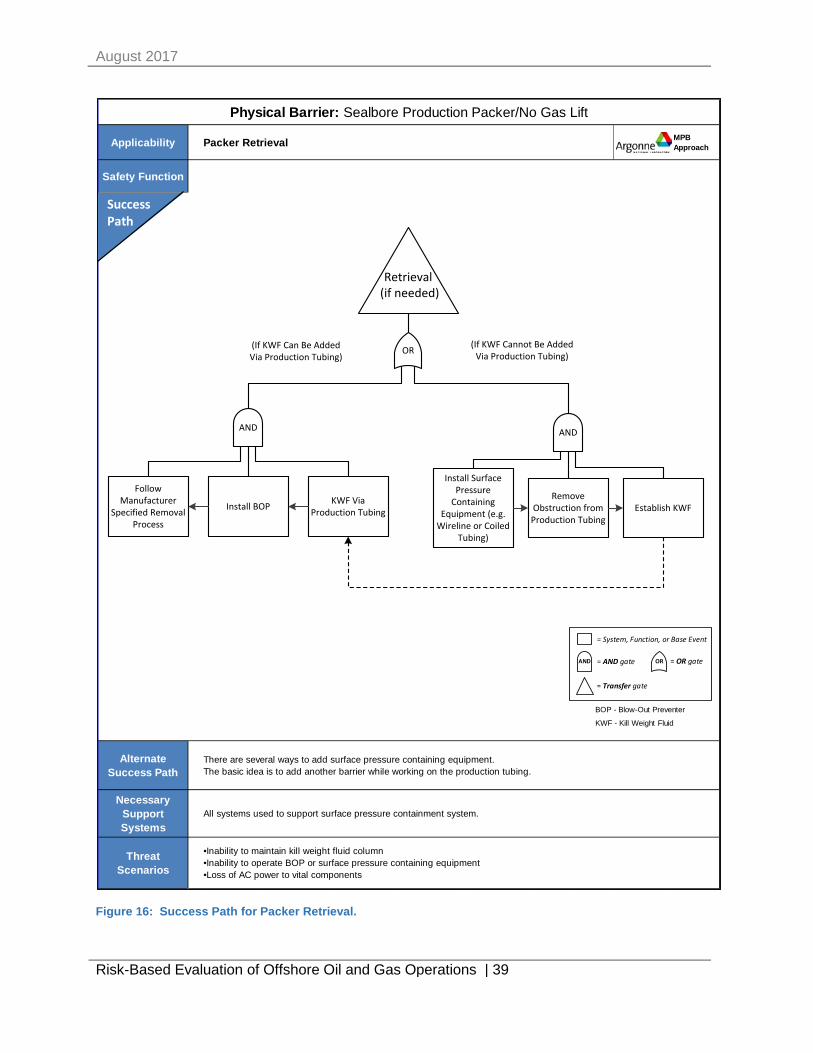
August 2017
Risk-Based Evaluation of Offshore Oil and Gas Operations | 39
Applicability Packer Retrieval MPB Approach
Safety Function
Alternate Success Path
Necessary Support Systems
Threat Scenarios
Physical Barrier: Sealbore Production Packer/No Gas Lift
There are several ways to add surface pressure containing equipment.The basic idea is to add another barrier while working on the production tubing.
All systems used to support surface pressure containment system.
•Inability to maintain kill weight fluid column•Inability to operate BOP or surface pressure containing equipment•Loss of AC power to vital components
Success Path
BOP - Blow-Out Preventer
KWF - Kill Weight Fluid
Retrieval (if needed)
OR
Follow Manufacturer
Specified Removal Process
AND AND
KWF Via Production Tubing
Install Surface Pressure
Containing Equipment (e.g.
Wireline or Coiled Tubing)
Remove Obstruction from Production Tubing
Establish KWFInstall BOP
(If KWF Can Be Added Via Production Tubing)
(If KWF Cannot Be Added Via Production Tubing)
OR = OR gateAND = AND gate
= Transfer gate
= System, Function, or Base Event
Figure 16: Success Path for Packer Retrieval.
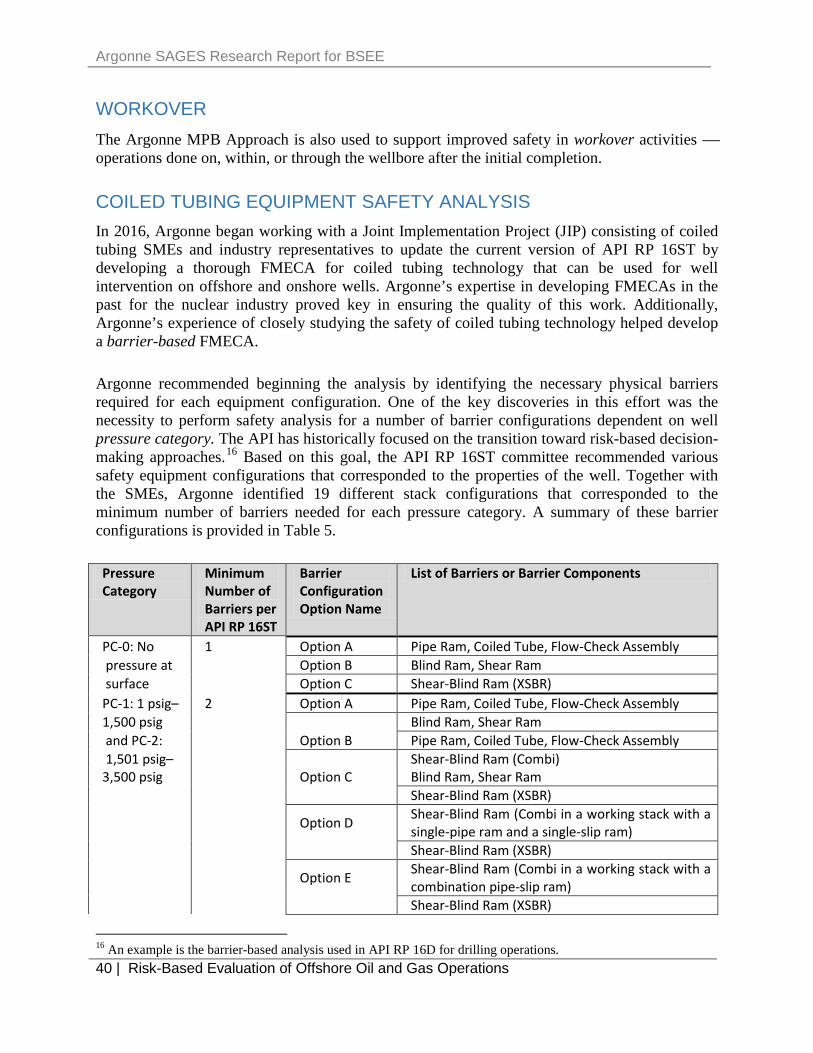
Argonne SAGES Research Report for BSEE
40 | Risk-Based Evaluation of Offshore Oil and Gas Operations
WORKOVER The Argonne MPB Approach is also used to support improved safety in workover activities operations done on, within, or through the wellbore after the initial completion.
COILED TUBING EQUIPMENT SAFETY ANALYSIS In 2016, Argonne began working with a Joint Implementation Project (JIP) consisting of coiled tubing SMEs and industry representatives to update the current version of API RP 16ST by developing a thorough FMECA for coiled tubing technology that can be used for well intervention on offshore and onshore wells. Argonne’s expertise in developing FMECAs in the past for the nuclear industry proved key in ensuring the quality of this work. Additionally, Argonne’s experience of closely studying the safety of coiled tubing technology helped develop a barrier-based FMECA.
Argonne recommended beginning the analysis by identifying the necessary physical barriers required for each equipment configuration. One of the key discoveries in this effort was the necessity to perform safety analysis for a number of barrier configurations dependent on well pressure category. The API has historically focused on the transition toward risk-based decision-making approaches.16 Based on this goal, the API RP 16ST committee recommended various safety equipment configurations that corresponded to the properties of the well. Together with the SMEs, Argonne identified 19 different stack configurations that corresponded to the minimum number of barriers needed for each pressure category. A summary of these barrier configurations is provided in Table 5.
Pressure Category
Minimum Number of Barriers per API RP 16ST
Barrier Configuration Option Name
List of Barriers or Barrier Components
PC-0: No 1 Option A Pipe Ram, Coiled Tube, Flow-Check Assembly pressure at Option B Blind Ram, Shear Ram surface Option C Shear-Blind Ram (XSBR) PC-1: 1 psig– 2 Option A Pipe Ram, Coiled Tube, Flow-Check Assembly 1,500 psig Blind Ram, Shear Ram and PC-2: Option B Pipe Ram, Coiled Tube, Flow-Check Assembly 1,501 psig– Shear-Blind Ram (Combi) 3,500 psig Option C Blind Ram, Shear Ram
Shear-Blind Ram (XSBR)
Option D Shear-Blind Ram (Combi in a working stack with a single-pipe ram and a single-slip ram) Shear-Blind Ram (XSBR)
Option E Shear-Blind Ram (Combi in a working stack with a combination pipe-slip ram) Shear-Blind Ram (XSBR)
16 An example is the barrier-based analysis used in API RP 16D for drilling operations.
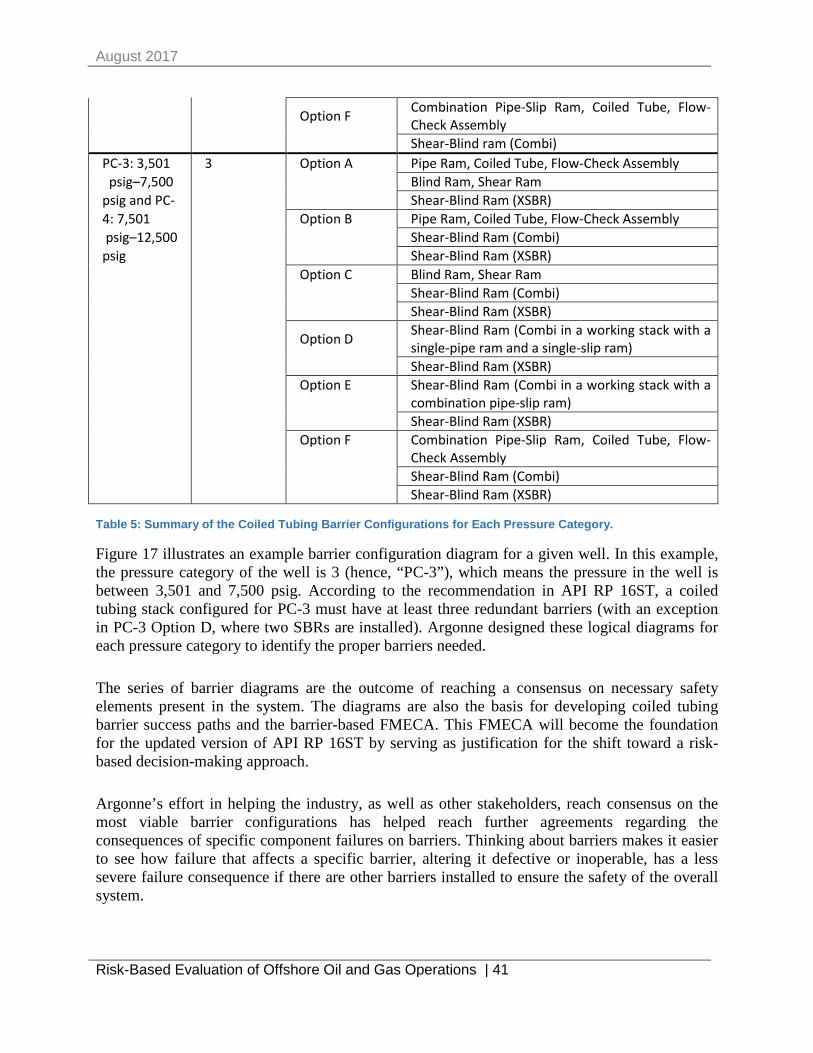
August 2017
Risk-Based Evaluation of Offshore Oil and Gas Operations | 41
Option F Combination Pipe-Slip Ram, Coiled Tube, Flow-Check Assembly Shear-Blind ram (Combi)
PC-3: 3,501 3 Option A Pipe Ram, Coiled Tube, Flow-Check Assembly psig–7,500 Blind Ram, Shear Ram psig and PC- Shear-Blind Ram (XSBR) 4: 7,501 Option B Pipe Ram, Coiled Tube, Flow-Check Assembly psig–12,500 Shear-Blind Ram (Combi) psig Shear-Blind Ram (XSBR)
Option C Blind Ram, Shear Ram Shear-Blind Ram (Combi) Shear-Blind Ram (XSBR)
Option D Shear-Blind Ram (Combi in a working stack with a single-pipe ram and a single-slip ram) Shear-Blind Ram (XSBR)
Option E Shear-Blind Ram (Combi in a working stack with a combination pipe-slip ram) Shear-Blind Ram (XSBR)
Option F Combination Pipe-Slip Ram, Coiled Tube, Flow-Check Assembly Shear-Blind Ram (Combi) Shear-Blind Ram (XSBR)
Table 5: Summary of the Coiled Tubing Barrier Configurations for Each Pressure Category.
Figure 17 illustrates an example barrier configuration diagram for a given well. In this example, the pressure category of the well is 3 (hence, “PC-3”), which means the pressure in the well is between 3,501 and 7,500 psig. According to the recommendation in API RP 16ST, a coiled tubing stack configured for PC-3 must have at least three redundant barriers (with an exception in PC-3 Option D, where two SBRs are installed). Argonne designed these logical diagrams for each pressure category to identify the proper barriers needed.
The series of barrier diagrams are the outcome of reaching a consensus on necessary safety elements present in the system. The diagrams are also the basis for developing coiled tubing barrier success paths and the barrier-based FMECA. This FMECA will become the foundation for the updated version of API RP 16ST by serving as justification for the shift toward a risk-based decision-making approach.
Argonne’s effort in helping the industry, as well as other stakeholders, reach consensus on the most viable barrier configurations has helped reach further agreements regarding the consequences of specific component failures on barriers. Thinking about barriers makes it easier to see how failure that affects a specific barrier, altering it defective or inoperable, has a less severe failure consequence if there are other barriers installed to ensure the safety of the overall system.

Argonne SAGES Research Report for BSEE
42 | Risk-Based Evaluation of Offshore Oil and Gas Operations
Figure 17: Example Barrier Configuration Diagram for a PC-3 Well.

August 2017
Risk-Based Evaluation of Offshore Oil and Gas Operations | 43
COILED TUBING INSPECTION WORKSHOP – A RISK-BASED APPROACH The development of the documents described in the previous section also helped Argonne work with BSEE on creating a risk-based coiled tubing inspection workshop. In this workshop, which will take place beginning in July 2017, Argonne will transfer the risk-based approach to BSEE participants. The modules of this workshop will be designed by Argonne together with BSEE to ensure that the goals of BSEE in facilitating risk-based coiled tubing inspection programs are met.
The goal of this workshop is to ensure safety and to protect the environment by helping stakeholders adopt a common approach to understanding and evaluating critical safety functions without the requirement for new regulations.
PLUG AND ABANDONMENT On September 15, 2016, a Joint Industry Project (JIP), organized by Argonne National Laboratory (ANL) in collaboration with DNV GL, assembled a team of 27 executives and subject matter experts from the oil and gas industry willing to perform a case study and test whether the barrier-success path approach could help improve performance and safety.
The JIP selected a deepwater operation case study to identify the barriers and success paths associated with it. The operation selected was the plugging and abandonment (P&A) process —both for temporary and for permanent well abandonment.
Typical P&A activities discussed and evaluated in this JIP included the cement barrier design, the placement and testing process, risk evaluation and management, and regulatory compliance.
The first P&A case study workshop was held in Katy, Texas, on October 10–11, 2016. It was attended by 27 subject matter experts with expertise in offshore operations, including P&A and cementing. Gulf of Mexico P&A regulations were proposed and discussed to assess their value to stakeholder-regulator communication.
The results of the phase 1 JIP provide evidence that the barrier-success path approach could provide significant benefits to the offshore oil and gas industry, in the following areas:
• well integrity, well control, and P&A• cross-industry communication for performance and compliance• human factors, decision making, and situation awareness• qualification and regulatory approval of new technologies• barrier monitoring and management• process safety and risk management
The second workshop was held October 31–November 1, 2016. Success paths and success
Argonne SAGES Research Report for BSEE
44 | Risk-Based Evaluation of Offshore Oil and Gas Operations
criteria developed in the first workshop were revised to identify alternative success paths and “showstoppers” based on feedback and comments from the participants.
A regulatory compliance success tree, based on the US Gulf of Mexico P&A regulations, was proposed and discussed to assess its value to stakeholder-regulator communication.
RESEARCH FINDINGS The applications of the Argonne MPB Approach described in this report and success paths in Appendix I demonstrate the value of this tool for enhanced management and oversight of high-risk activities and equipment. The approach provides a systematic process for applying process safety concepts and barrier management to understand, assess, and regulate drilling, completion, production, workover, and decommissioning activities.
The MPB Approach begins with a qualitative assessment focused on identifying the physical barriers, their critical functions, and the success paths that are needed to ensure full success and safety. This logical chain of cause and effect logic also forms the basis of a detailed operational risk analysis for a specific well, rig, or facility. When quantification is incorporated with quality data, the safety significance of any component, system or set of human actions can be numerically evaluated and compared. Similarly, the approach can be used to compare and evaluate the safety significance of existing or proposed regulations.
Through the use of success paths, the MPB Approach provides a common language for communicating barrier and risk management information within organizations and across the global industry and regulatory authorities. The combination of engineering and social science concepts in this approach allows systematic assessment of risk informed decision support on technology safety, human performance, process safety culture, and organizational performance.
A well-charted success path enables a wide variety of stakeholders to intuitively comprehend the key points required for success and then participate intelligently in the discussion about risks and safety. Further, it provides a consistent and rigorous basis for defending the decisions that have been made whether to senior executives or third parties. The foundations of this approach have been demonstrated to hold up in legal situations.
OBSERVATIONS While the Argonne MPB Approach helps identify physical barriers, their critical functions, and elements needed for the success of an operation, it is the management system that must incorporate these factors to add the greatest value.
At its core, the role of the management system is to ensure that equipment and personnel perform as expected. Every element of a success path can (and should) be incorporated into the management system. The MPB Approach can be applied to help systematically organize operational programs and demonstrate to management and rig crews that “all of the boxes are checked.” When problems occur, success paths can be used to help guide root-cause analyses
August 2017
Risk-Based Evaluation of Offshore Oil and Gas Operations | 45
and keep track of near-miss failures.
APPLICATION OF THE MPB APPROACH TO BSEE OPERATIONS AND GOVERNANCE As identified in the BSEE FY 2016 – FY 2019 Strategic Plan17, BSEE seeks to demonstrate operational excellence through the achievement of safety, environment, and conservation goals; and organizational excellence with a focus on people, information, and transparency. The following subsections describe how use of the Argonne MPB Approach in planned BSEE initiatives can markedly contribute to the successful implementation of identified strategies and achievement of goals for operational and organizational excellence.
STRATEGY 1: ENSURE A CONSISTENT, NATIONAL APPROACH TO DETECTION OF NONCOMPLIANCE AND INCIDENT INVESTIGATION By providing a consistent taxonomy and systematic process for getting at the root cause of operational safety risks, the Argonne MPB Approach is well suited for use in investigations to increase BSEE’s capacity to identify and reduce unsafe conditions offshore.
The MPB Approach provides a mechanism for rigorously demonstrating and evaluating the severity potential of violations, and offers a risk-informed communication framework for promoting common understanding and effective dialogue among inspectors, operators, and contractors pertaining to offshore performance.
STRATEGY 2: EXAMINE THE FULL LIFE CYCLE OF OFFSHORE OPERATIONS AND ADAPT TO CHANGING CONDITIONS One of the most important challenges BSEE faces today is the evaluation of Application for Permit to Drill (APD) permits and Deepwater Operation Plan (DWOP) permits. When evaluating various permitting requests, BSEE needs to know the operational risks involved. While APD and DWOP permit applications often include risk assessments, practitioners of this analysis do not have a consistent interpretation of barriers — nor do they utilize a common method for evaluating barrier safety. This leads to confusion both for the industry and for BSEE.
Process accidents only happen when a physical barrier is impacted. Hence, risk assessment must focus on physical barriers. Ultimately, the failure to recognize this concept means that risks are not appropriately understood or communicated. Training, meetings, and procedures are important, but should not be discussed on the same level as physical barriers. Instead, these elements are part of the success paths needed to set up or maintain these barriers. As noted above, accidents are the result of physical barriers that were breached, removed, or not properly installed or maintained.
BSEE is in the position, especially with its risk team, to address this fundamental area and
17 https://www.bsee.gov/who-we-are/history/strategic-plan

Argonne SAGES Research Report for BSEE
46 | Risk-Based Evaluation of Offshore Oil and Gas Operations
provide key guidance to industry. This would immediately reduce confusion and begin standardizing how risks are communicated and reported. The MPB Approach provides an ideal mechanism for use by BSEE and industry to evaluate an operator’s ability to perform operations on the OCS in a safe and environmentally sound manner.
Barrier success paths provide the means for safe permitting and justification of decisions using a risk-based approach. By considering success paths provided with every APD and DWOP, BSEE would know the exact types of questions to ask concerning the proposed approach and associated technologies. Based on early discussions and partial vetting with the industry, this approach is expected to be well received18. It does not introduce additional cost to the industry, and the benefits can be significant, primarily because of increased insights into operational safety.
STRATEGY 3: FURTHER INCORPORATE RISK-BASED DECISION MAKING INTO CORE SAFETY FUNCTIONS The BSEE risk team is currently implementing a risk-based inspections approach for platforms on the OCS. This approach utilizes a numerical analysis model developed by Argonne, coupled with an in-depth analysis of past performance and other company intelligence. This approach helps identify which platforms have the highest amounts of risk and thereby should be considered higher priority. The Argonne MPB Approach now takes this one step further by helping identify what specifically should be looked at once inspectors are aboard the platform.
As described in the comparison of conventional drilling and managed pressure drilling19, the Argonne MPB Approach can be applied to incorporate risk-based decision making into the evaluation of new technologies. By comparing success paths, new technologies can be readily evaluated once inspectors understand which dependencies have been eliminated and whether any new dependencies have been added.
STRATEGY 4: DEVELOP AND SUSTAIN A WELL-TRAINED, HIGH-PERFORMING AND DIVERSE WORKFORCE The Argonne MPB Approach serves as an optimal tool for technical training of BSEE personnel. Education on required barriers and the success paths needed to maintain those barriers, will enable students to quickly and intuitively grasp the key operational safety issues and prepare engineers and inspectors to effectively evaluate operators’ submissions and perform inspections on platforms and rigs.
By enabling both technical and nontechnical audiences to intuitively comprehend the key points required for success, the MPB Approach can also facilitate collaboration across the bureau on rulemaking and minimize barriers to productivity.
18 See for example SPE/IADC-173153-MS. D. Fraser, ANL, D. D. Moore, Marathon Oil, M. Vander Staak, Hess Corp., A Barrier Analysis to Well Control Techniques, March 17-19, 2015, London. 19 SPE/IADC-173153-MS. D. Fraser, Argonne National Laboratory, D. D. Moore, Marathon Oil, and M. Vander Staak, HESS Corp., A Barrier Analysis Approach to Well Control Techniques, March 17-18, 2015, London.
August 2017
Risk-Based Evaluation of Offshore Oil and Gas Operations | 47
STRATEGY 5: ENHANCE BSEE’S DECISION MAKING THROUGH THE COLLECTION, MANAGEMENT, AND ANALYSIS OF HIGH QUALITY INFORMATION One of the main benefits of the MPB Approach lies in the ability to integrate risk management and business intelligence into sound risk-informed input to BSEE decision making. Argonne used information and insights culled from interactions with operators and BSEE subject matter experts, as well as an analysis of BSEE data on facility construction and operation, to develop success paths and equip BSEE with tools to visually analyze critical barrier systems, related regulations, and industry standards all at once. This approach facilitates a quantitative risk assessment, when suitable industry data is available, and identifies where efforts to collect high quality information would have maximum benefit.
CONCLUSIONS AND RECOMMENDATIONS
CONCLUSIONS The MPB Approach provides a systematic, clear, and comprehensive approach for managing safety risks. Success paths are used to characterize, delineate, and illustrate the steps that must be taken to achieve success in the design, maintenance, and operation for each component of the system
This approach can help government agencies, energy companies, and other stakeholders in building consensus on key safety risks; identifying cost-effective risk mitigation measures; and establishing enhanced methods for testing, inspection, and data-driven decision making.
RECOMMENDATIONS In response to these research findings and conclusions, the Argonne research team has the following recommendations:
• Continue to apply the MPB Approach in cases where the advantages to stakeholders are bothevident and beneficial.
• Seek to build teams of regulators and stakeholders to jointly develop success paths andsuccess trees for specific industry applications. This will allow the concept to gradually gainacceptance in the industry and will stimulate the creativity of technical people in both theindustry and the regulatory agency.
• “Experiment” with different applications of the approach on to see how well it works indifferent areas with different types of people.
• Seek situations where quantification of risk can be used in applications where both risks andcosts are high – (e.g., BOPs). In other industries, this combination is where risk-informeddecision making (RIDM) has added the most value. In cases of this type, higher costs ofquantification are usually justified by quality of the ultimate quantitative decisions that result.
Argonne SAGES Research Report for BSEE
48 | Risk-Based Evaluation of Offshore Oil and Gas Operations
• Seek to expand risk-based thinking and RIDM to all parts of the BSEE organization. Thisnew technology promotes collaboration, common understanding, effective dialogue, andsound input to support the development and implementation of risk-based regulations.

August 2017
Success Path Diagrams | Appendix I
APPENDIX I
SUCCESS PATH DIAGRAMS FOR VARIETY OF OFFSHORE OIL AND GAS TECHNOLOGIES AND OPERATIONS
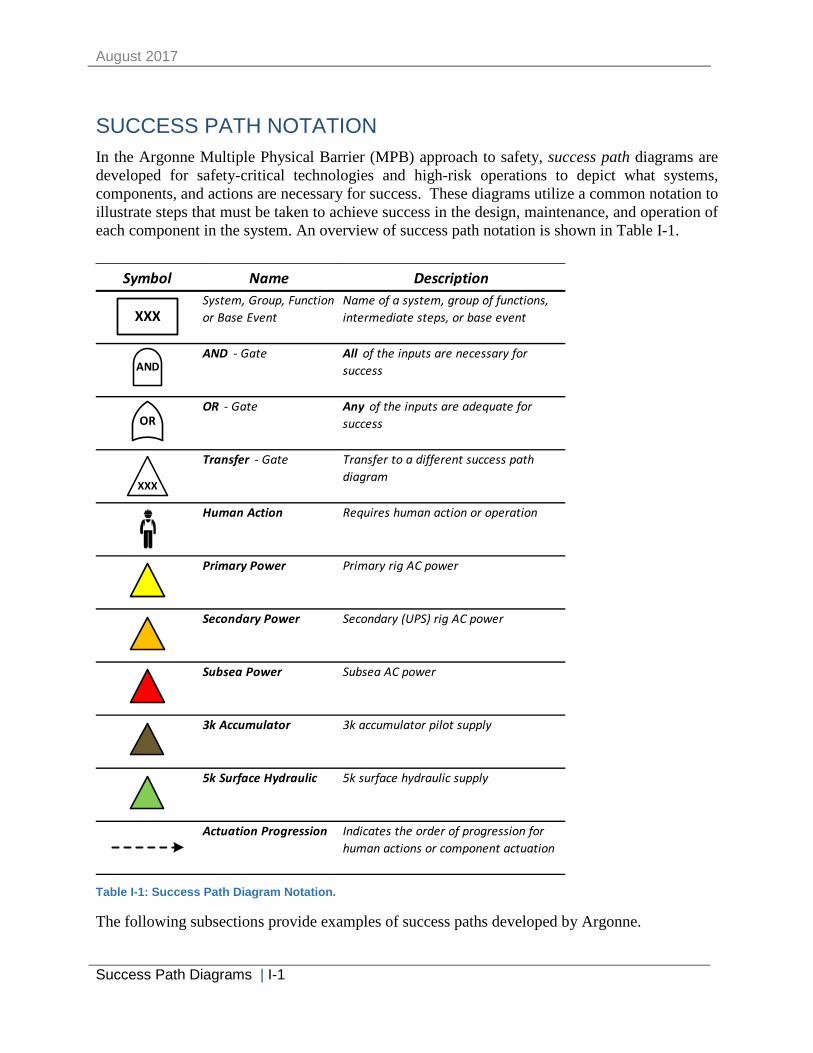
August 2017
Success Path Diagrams | I-1
SUCCESS PATH NOTATION In the Argonne Multiple Physical Barrier (MPB) approach to safety, success path diagrams are developed for safety-critical technologies and high-risk operations to depict what systems, components, and actions are necessary for success. These diagrams utilize a common notation to illustrate steps that must be taken to achieve success in the design, maintenance, and operation of each component in the system. An overview of success path notation is shown in Table I-1.
Symbol Name DescriptionSystem, Group, Function or Base Event
Name of a system, group of functions, intermediate steps, or base event
AND - Gate All of the inputs are necessary for success
OR - Gate Any of the inputs are adequate for success
Transfer - Gate Transfer to a different success path diagram
Human Action Requires human action or operation
Primary Power Primary rig AC power
Secondary Power Secondary (UPS) rig AC power
Subsea Power Subsea AC power
3k Accumulator 3k accumulator pilot supply
5k Surface Hydraulic 5k surface hydraulic supply
Actuation Progression Indicates the order of progression for human actions or component actuation
AND
OR
XXX
XXX
Table I-1: Success Path Diagram Notation.
The following subsections provide examples of success paths developed by Argonne.
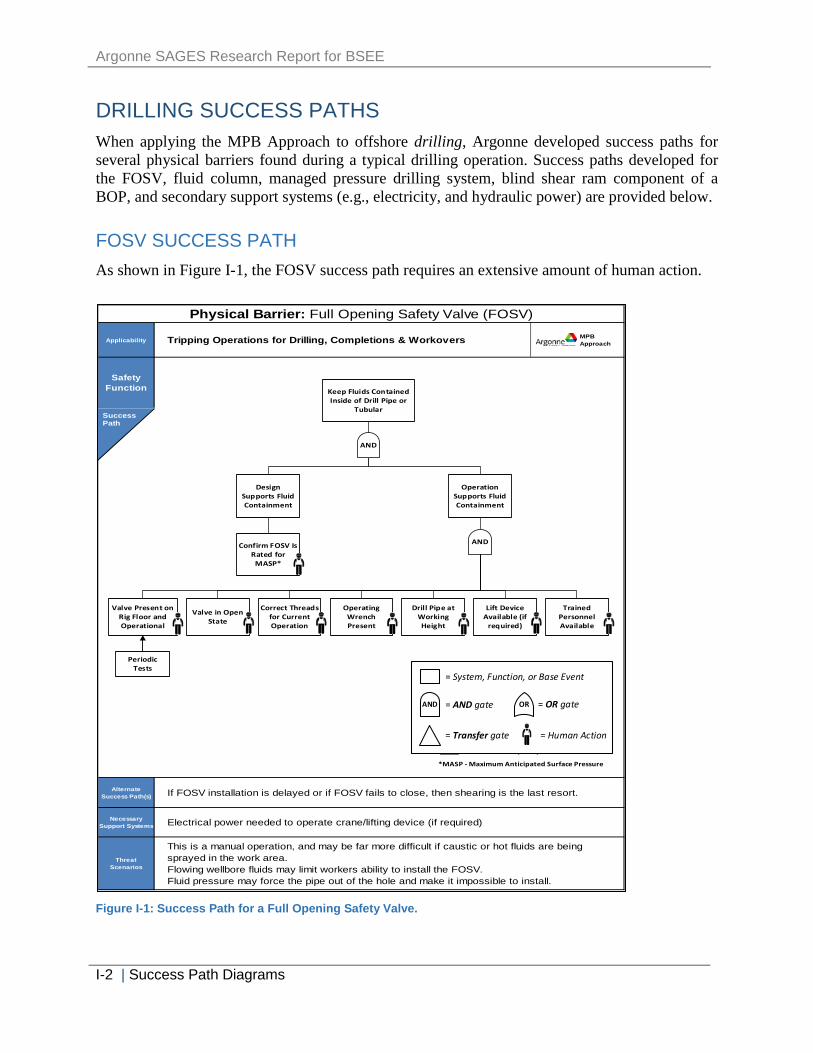
Argonne SAGES Research Report for BSEE
I-2 | Success Path Diagrams
DRILLING SUCCESS PATHS When applying the MPB Approach to offshore drilling, Argonne developed success paths for several physical barriers found during a typical drilling operation. Success paths developed for the FOSV, fluid column, managed pressure drilling system, blind shear ram component of a BOP, and secondary support systems (e.g., electricity, and hydraulic power) are provided below.
FOSV SUCCESS PATH As shown in Figure I-1, the FOSV success path requires an extensive amount of human action.
Applicability MPB Approach
Safety Function
Alternate Success Path(s)
Necessary Support Systems
Threat Scenarios
Physical Barrier: Full Opening Safety Valve (FOSV)
This is a manual operation, and may be far more difficult if caustic or hot fluids are being sprayed in the work area.Flowing wellbore fluids may limit workers ability to install the FOSV.Fluid pressure may force the pipe out of the hole and make it impossible to install.
If FOSV installation is delayed or if FOSV fails to close, then shearing is the last resort.
Tripping Operations for Drilling, Completions & Workovers
Electrical power needed to operate crane/lifting device (if required)
*MASP - Maximum Anticipated Surface Pressure
Success Path
= AND gate = OR gateAND OR
Keep Fluids Contained Inside of Drill Pipe or
Tubular
Design Supports Fluid Containment
Confirm FOSV Is Rated for
MASP*
Operation Supports Fluid Containment
AND
Valve Present on Rig Floor and Operational
Valve in Open State
Operating Wrench Present
Drill Pipe at Working Height
Lift Device Available (if
required)
Trained Personnel Available
Correct Threads for Current Operation
Periodic Tests
AND
OR = OR gate
= Human Action
AND = AND gate
= Transfer gate
= System, Function, or Base Event
Figure I-1: Success Path for a Full Opening Safety Valve.
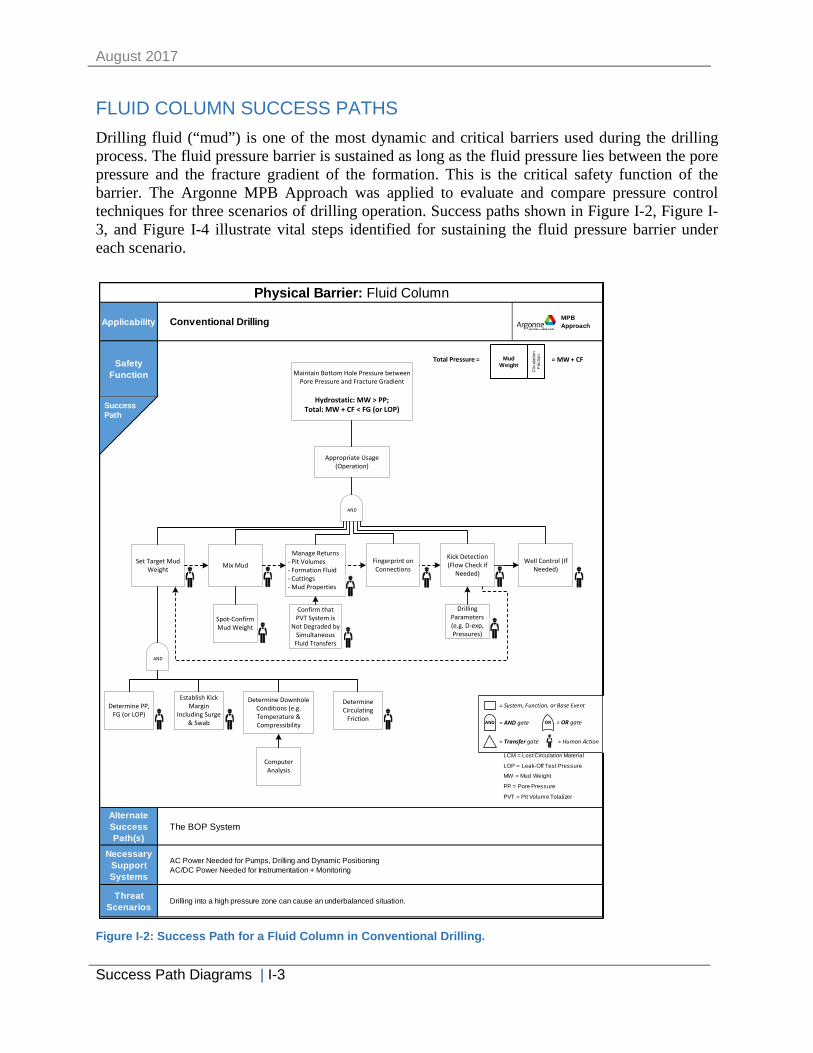
August 2017
Success Path Diagrams | I-3
FLUID COLUMN SUCCESS PATHS Drilling fluid (“mud”) is one of the most dynamic and critical barriers used during the drilling process. The fluid pressure barrier is sustained as long as the fluid pressure lies between the pore pressure and the fracture gradient of the formation. This is the critical safety function of the barrier. The Argonne MPB Approach was applied to evaluate and compare pressure control techniques for three scenarios of drilling operation. Success paths shown in Figure I-2, Figure I-3, and Figure I-4 illustrate vital steps identified for sustaining the fluid pressure barrier under each scenario.
Applicability MPB Approach
Safety Function
Alternate Success Path(s)
Necessary Support Systems
Threat Scenarios
Drilling into a high pressure zone can cause an underbalanced situation.
Physical Barrier: Fluid Column
Conventional Drilling
The BOP System
AC Power Needed for Pumps, Drilling and Dynamic PositioningAC/DC Power Needed for Instrumentation + Monitoring
Success Path
CF = Circulating Friction
FG = Fracture Gradient
LCM = Lost Circulation Material
LOP = Leak-Off Test Pressure
MW = Mud Weight
PP = Pore Pressure
PVT = Pit Volume Totalizer
Total Pressure = Mud Weight
Circ
ulat
ion
Fric
tion
= MW + CF
Maintain Bottom Hole Pressure between Pore Pressure and Fracture Gradient
Hydrostatic: MW > PP;Total: MW + CF < FG (or LOP)
Appropriate Usage (Operation)
AND
Manage Returns- Pit Volumes- Formation Fluid- Cuttings- Mud Properties
Kick Detection (Flow Check if
Needed)
Well Control (If Needed)Mix MudSet Target Mud
Weight
AND
Spot-Confirm Mud Weight
Confirm that PVT System is
Not Degraded by Simultaneous Fluid Transfers
Drilling Parameters (e.g. D-exp, Pressures)
Determine PP, FG (or LOP)
Establish Kick Margin
Including Surge & Swab
Determine Downhole Conditions (e.g. Temperature & Compressibility
Determine Circulating
Friction
Computer Analysis
Fingerprint on Connections
OR = OR gate
= Human Action
AND = AND gate
= Transfer gate
= System, Function, or Base Event
Figure I-2: Success Path for a Fluid Column in Conventional Drilling.

Argonne SAGES Research Report for BSEE
I-4 | Success Path Diagrams
Applicability MPB Approach
Safety Function
Alternate Success Path(s)
Threat Scenarios
- Coriolis meters can produce spurious results when gas is encountered.- If not monitored properly the riser joint and/or riser could become overpressured.- Wear/leak/failure of pressure control equipment.
Physical Barrier: Fluid Column (MPD)Managed Pressure Drilling (MPD) - Constant Bottom Hole Pressure Method
If components fail or barrier degradation occurs the BOP system remains fully available.
- Pressure Control Equipment (e.g. RCD, MPD Choke)- AC Power Needed for Pumps, Drilling, Dynamic Positioning- AC/DC Power Needed for Instrumentation + Control
Necessary Support Systems
Success Path
CBP = Choke Back Pressure
CF = Circulating Friction
FG = Fracture Gradient
LCM = Lost Circulation Material
LOP = Leak-Off Test Pressure
MPD = Managed Pressure Drilling
MW = Mud Weight
PP = Pore Pressure
PVT = Pit Volume Totalizer
RCD = Rotating Control Device
SBP = Surface Back Pressure
= Differences from Conventional Drilling
Total Pressure = Mud Weight
Circ
ulat
ion
Fric
tion
Surfa
ceBa
ck
Pres
sure = MW + CF
+ SBPMaintain Bottom Hole Pressure between Pore
Pressure and Fracture Gradient
Total: PP < MW + CF + SBP < FG (or LOP)
Appropriate Usage (Operation)
AND
Set Wellbore Pressure Directly
AND
Set Target Mud Weight
Set Surface Back Pressure
AND
Measure: PP, FG (or LOP) even while drilling
Determine Downhole Conditions (e.g. Temperatures & Compressibility)
Determine Circulating
Friction
Mix Mud
Manage Returns- Pit Volumes- Formation Fluid- Cuttings- Mud Properties
Identify Kicks or Lost Returns
(Flow Check if Needed)
Well Control (If Needed)
Confirm that PVT System is
Not Degraded by Simultaneous Fluid Transfers
Drilling Parameters (e.g. D-exp, Pressures)
Computer Analysis
Real-Time Fluid Pressure
Monitoring
Fingerprint on Connections
OR = OR gate
= Human Action
AND = AND gate
= Transfer gate
= System, Function, or Base Event
= Difference from Conventional Drilling
Figure I-3: Success Path for a Fluid Column in Managed Pressure Drilling.
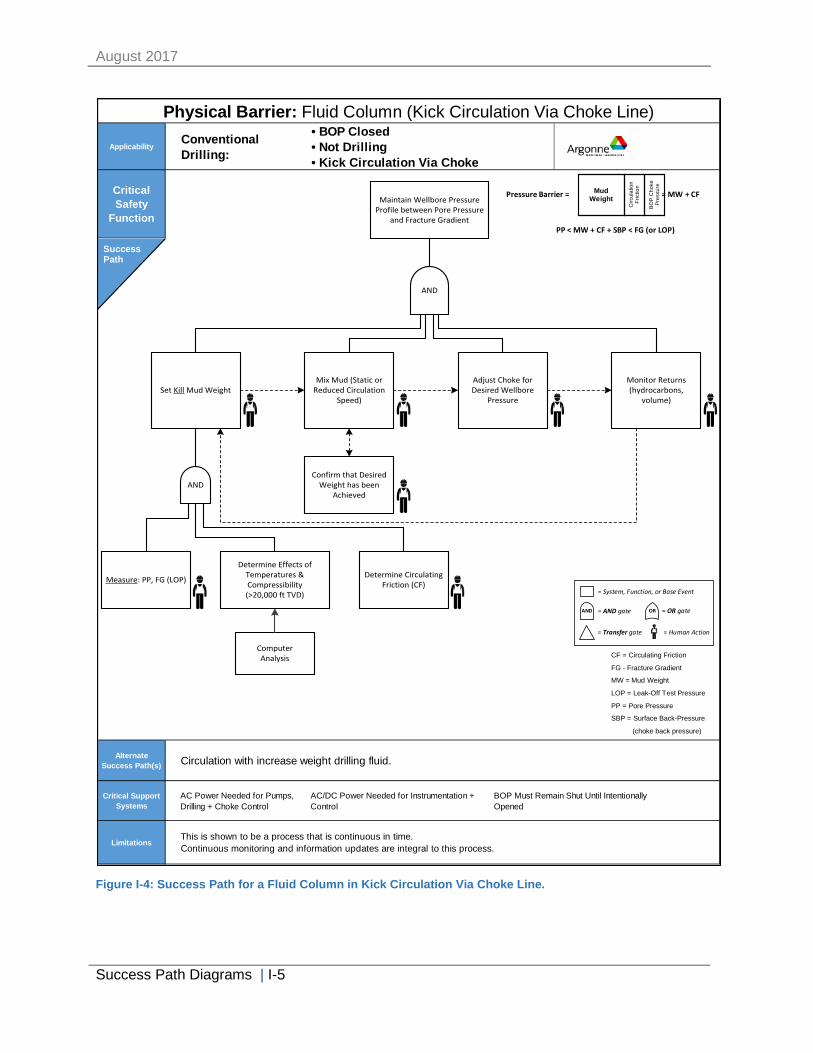
August 2017
Success Path Diagrams | I-5
Applicability
Critical Safety
Function
Alternate Success Path(s)
Critical Support Systems
Limitations
AC Power Needed for Pumps, Drilling + Choke Control
AC/DC Power Needed for Instrumentation + Control
BOP Must Remain Shut Until Intentionally Opened
This is shown to be a process that is continuous in time. Continuous monitoring and information updates are integral to this process.
Physical Barrier: Fluid Column (Kick Circulation Via Choke Line)Conventional Drilling:
• BOP Closed• Not Drilling• Kick Circulation Via Choke
Circulation with increase weight drilling fluid.
Success Path
CF = Circulating Friction
FG - Fracture Gradient
MW = Mud Weight
LOP = Leak-Off Test Pressure
PP = Pore Pressure
SBP = Surface Back-Pressure
(choke back pressure)
Pressure Barrier = = MW + CF
PP < MW + CF + SBP < FG (or LOP)
Mud Weight
Circ
ulat
ion
Fric
tion
BOP
Cho
ke
Pres
sure
Maintain Wellbore Pressure Profile between Pore Pressure
and Fracture Gradient
Set Kill Mud WeightMix Mud (Static or
Reduced Circulation Speed)
Adjust Choke for Desired Wellbore
Pressure
Monitor Returns (hydrocarbons,
volume)
Confirm that Desired Weight has been
Achieved
Measure: PP, FG (LOP)
Determine Effects of Temperatures & Compressibility (>20,000 ft TVD)
Determine Circulating Friction (CF)
Computer Analysis
AND
AND
OR = OR gate
= Human Action
AND = AND gate
= Transfer gate
= System, Function, or Base Event
Figure I-4: Success Path for a Fluid Column in Kick Circulation Via Choke Line.
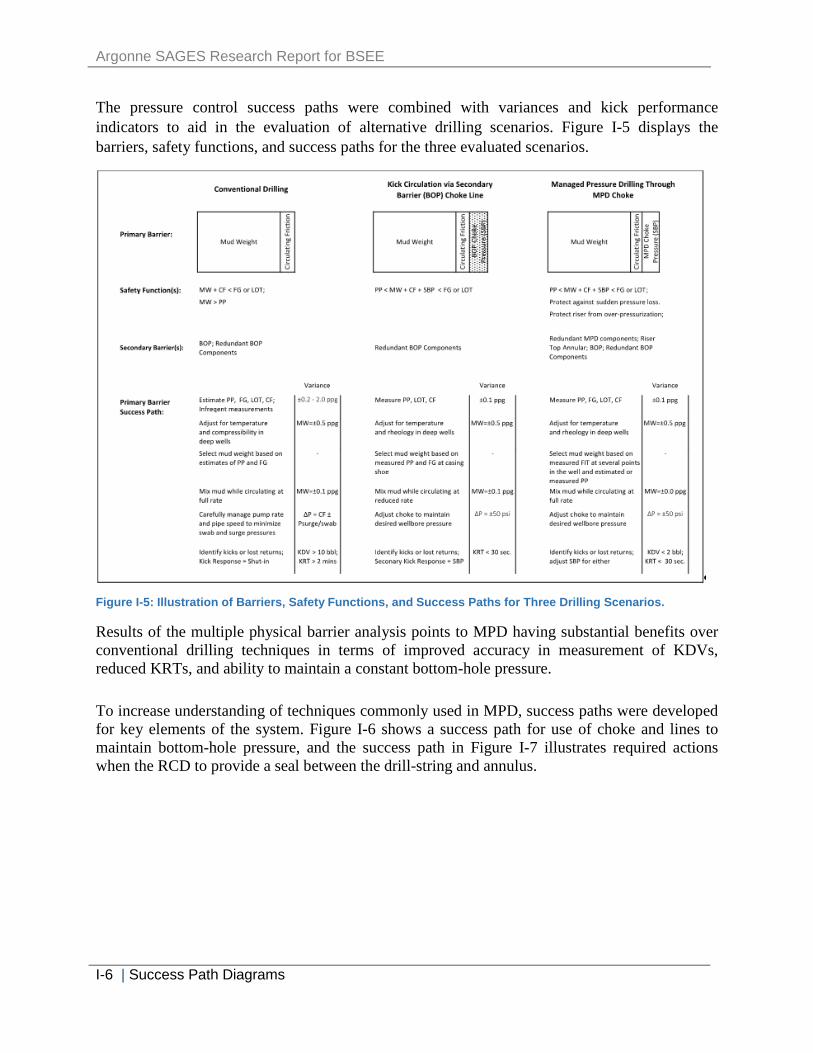
Argonne SAGES Research Report for BSEE
I-6 | Success Path Diagrams
The pressure control success paths were combined with variances and kick performance indicators to aid in the evaluation of alternative drilling scenarios. Figure I-5 displays the barriers, safety functions, and success paths for the three evaluated scenarios.
Figure I-5: Illustration of Barriers, Safety Functions, and Success Paths for Three Drilling Scenarios.
Results of the multiple physical barrier analysis points to MPD having substantial benefits over conventional drilling techniques in terms of improved accuracy in measurement of KDVs, reduced KRTs, and ability to maintain a constant bottom-hole pressure.
To increase understanding of techniques commonly used in MPD, success paths were developed for key elements of the system. Figure I-6 shows a success path for use of choke and lines to maintain bottom-hole pressure, and the success path in Figure I-7 illustrates required actions when the RCD to provide a seal between the drill-string and annulus.
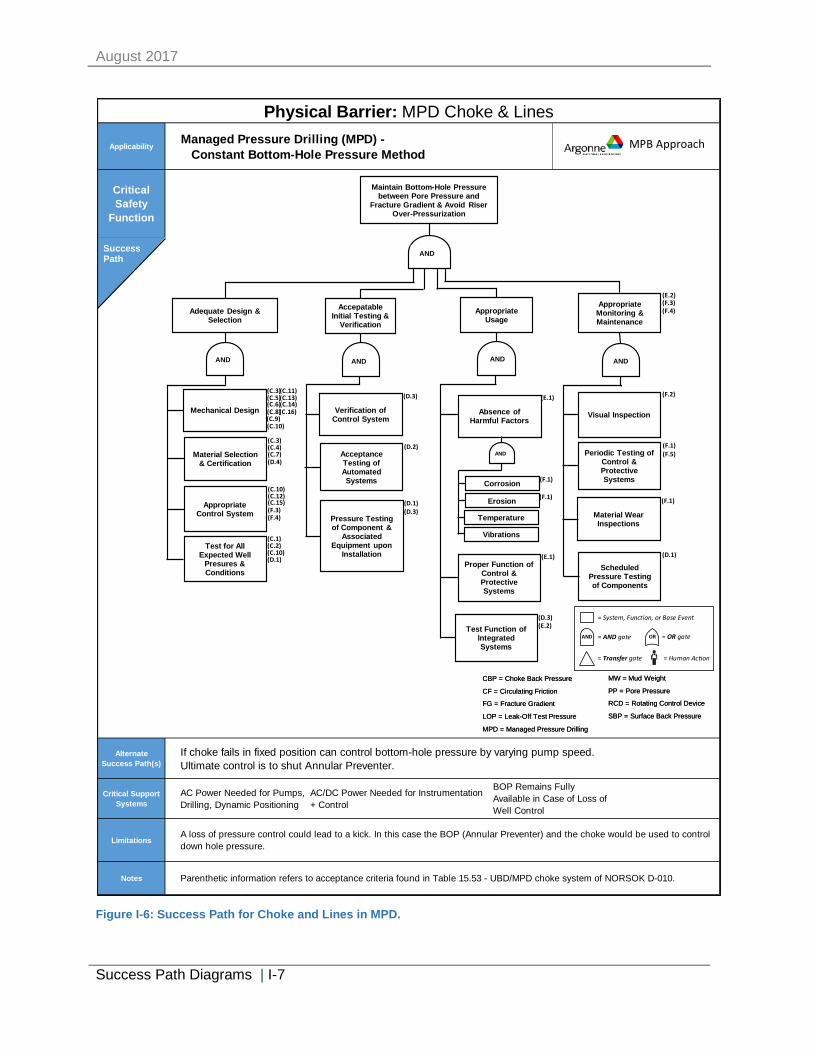
August 2017
Success Path Diagrams | I-7
Applicability
Critical Safety
Function
Alternate Success Path(s)
Critical Support Systems
Limitations
Notes
A loss of pressure control could lead to a kick. In this case the BOP (Annular Preventer) and the choke would be used to control down hole pressure.
Parenthetic information refers to acceptance criteria found in Table 15.53 - UBD/MPD choke system of NORSOK D-010.
Physical Barrier: MPD Choke & LinesManaged Pressure Drilling (MPD) - Constant Bottom-Hole Pressure Method
If choke fails in fixed position can control bottom-hole pressure by varying pump speed.Ultimate control is to shut Annular Preventer.
AC Power Needed for Pumps, Drilling, Dynamic Positioning
AC/DC Power Needed for Instrumentation + Control
BOP Remains Fully Available in Case of Loss of Well Control
Success Path
CBP = Choke Back Pressure
CF = Circulating Friction
FG = Fracture Gradient
LOP = Leak-Off Test Pressure
MPD = Managed Pressure Drilling
MW = Mud Weight
PP = Pore Pressure
RCD = Rotating Control Device
SBP = Surface Back Pressure
Maintain Bottom-Hole Pressure between Pore Pressure and
Fracture Gradient & Avoid Riser Over-Pressurization
Mechanical Design
Adequate Design & Selection
Verification of Control System
Test Function of IntegratedSystems
Visual Inspection
AccepatableInitial Testing &
Verification
Appropriate Usage
AppropriateMonitoring & Maintenance
Material Selection & Certification
Appropriate Control System
Test for All Expected Well
Presures & Conditions
AcceptanceTesting of Automated Systems
Pressure Testing of Component &
AssociatedEquipment upon
InstallationProper Function of
Control & Protective Systems
Periodic Testing of Control & Protective Systems
Material Wear Inspections
Absence of Harmful Factors
Corrosion
Erosion
Temperature
Vibrations
Scheduled Pressure Testing of Components
(C.1)(C.2)(C.10)(D.1)
(D.1)
(D.2)
(D.3)
(D.1)(D.3)
(C.3)(C.4)(C.7)(D.4)
(E.1)
(E.1)
(F.1)
(F.1) (F.1)
(F.2)
(F.1)(F.5)
(C.11)(C.3)(C.5)(C.6)(C.8)(C.9)
(C.13)(C.14)(C.16)
(C.10)
(D.3)(E.2)
(C.10)(C.12)(C.15)(F.3)(F.4)
(F.3)(F.4)
(E.2)
CBP = Choke Back Pressure
CF = Circulating Friction
FG = Fracture Gradient
LOP = Leak-Off Test Pressure
MPD = Managed Pressure Drilling
MW = Mud Weight
PP = Pore Pressure
RCD = Rotating Control Device
SBP = Surface Back Pressure
AND
AND AND AND AND
AND
MPB Approach
OR = OR gate
= Human Action
AND = AND gate
= Transfer gate
= System, Function, or Base Event
Figure I-6: Success Path for Choke and Lines in MPD.
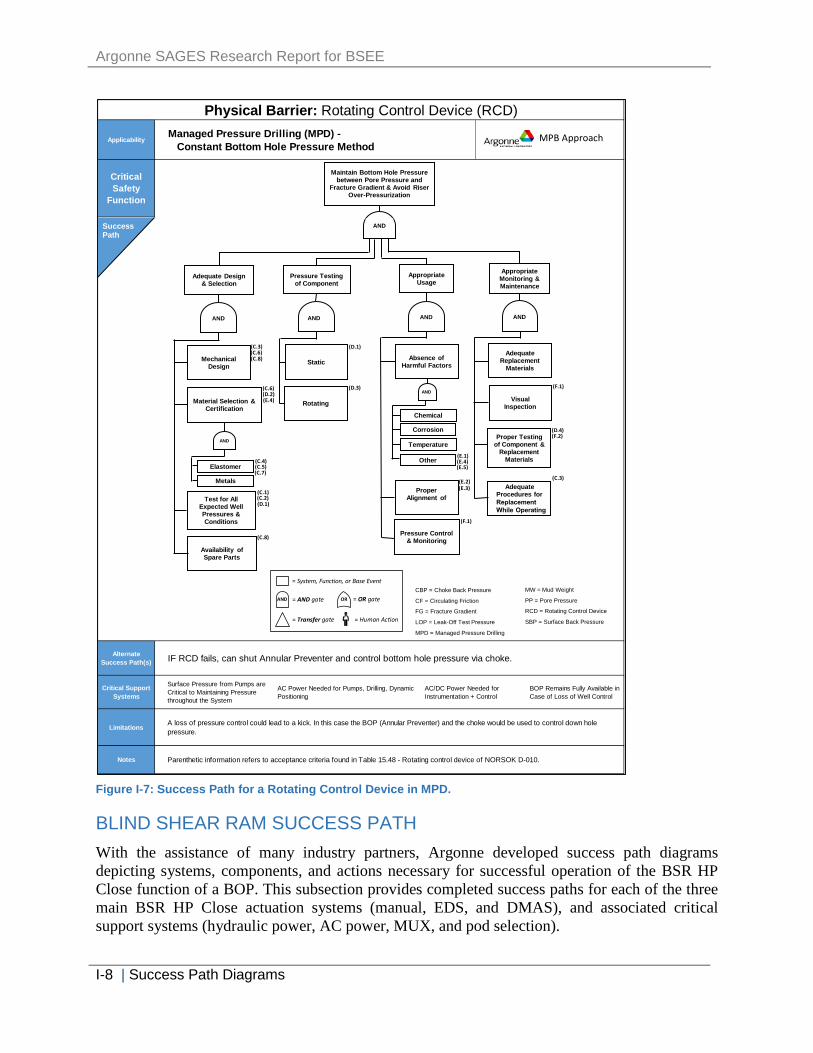
Argonne SAGES Research Report for BSEE
I-8 | Success Path Diagrams
Applicability
Critical Safety
Function
Alternate Success Path(s)
Critical Support Systems
Limitations
Notes
A loss of pressure control could lead to a kick. In this case the BOP (Annular Preventer) and the choke would be used to control down hole pressure.
Parenthetic information refers to acceptance criteria found in Table 15.48 - Rotating control device of NORSOK D-010.
Physical Barrier: Rotating Control Device (RCD)Managed Pressure Drilling (MPD) - Constant Bottom Hole Pressure Method
IF RCD fails, can shut Annular Preventer and control bottom hole pressure via choke.
Surface Pressure from Pumps are Critical to Maintaining Pressure throughout the System
AC Power Needed for Pumps, Drilling, Dynamic Positioning
AC/DC Power Needed for Instrumentation + Control
BOP Remains Fully Available in Case of Loss of Well Control
CBP = Choke Back Pressure
CF = Circulating Friction
FG = Fracture Gradient
LOP = Leak-Off Test Pressure
MPD = Managed Pressure Drilling
MW = Mud Weight
PP = Pore Pressure
RCD = Rotating Control Device
SBP = Surface Back Pressure
Components
Pressure Control & Monitoring)
)
(F.1)
OR = OR gate
= Human Action
AND = AND gate
= Transfer gate
= System, Function, or Base Event
Success Path
Elastomer
Metals
Pressure Testing of Component
Static
Maintain Bottom Hole Pressure between Pore Pressure and
Fracture Gradient & Avoid Riser Over-Pressurization
MechanicalDesign
Adequate Design & Selection
Absence of Harmful Factors
AdequateReplacement
Materials
Appropriate Usage
Appropriate Monitoring & Maintenance
Test for All Expected Well Pressures & Conditions
Material Selection & Certification
Availability of Spare Parts
Proper Alignment of
Visual Inspection
Proper Testing of Component &
Replacement Materials
Rotating
Chemical
Corrosion
Temperature
Other
Adequate Procedures forReplacementWhile Operating
(C.1)(C.2)
(C.3)
(C.3)
(C.4)(C.5)
(C.6)
(C.6)
(C.7)
(C.8
(D.1)
(D.2)
(D.1
(D.3)
(D.4)
(E.1)
(E.2)(E.3)
(E.4)(E.5)
(F.1)
(F.2)
(C.8)
(E.4)
AND
AND AND AND AND
AND
AND
MPB Approach
Figure I-7: Success Path for a Rotating Control Device in MPD.
BLIND SHEAR RAM SUCCESS PATH With the assistance of many industry partners, Argonne developed success path diagrams depicting systems, components, and actions necessary for successful operation of the BSR HP Close function of a BOP. This subsection provides completed success paths for each of the three main BSR HP Close actuation systems (manual, EDS, and DMAS), and associated critical support systems (hydraulic power, AC power, MUX, and pod selection).
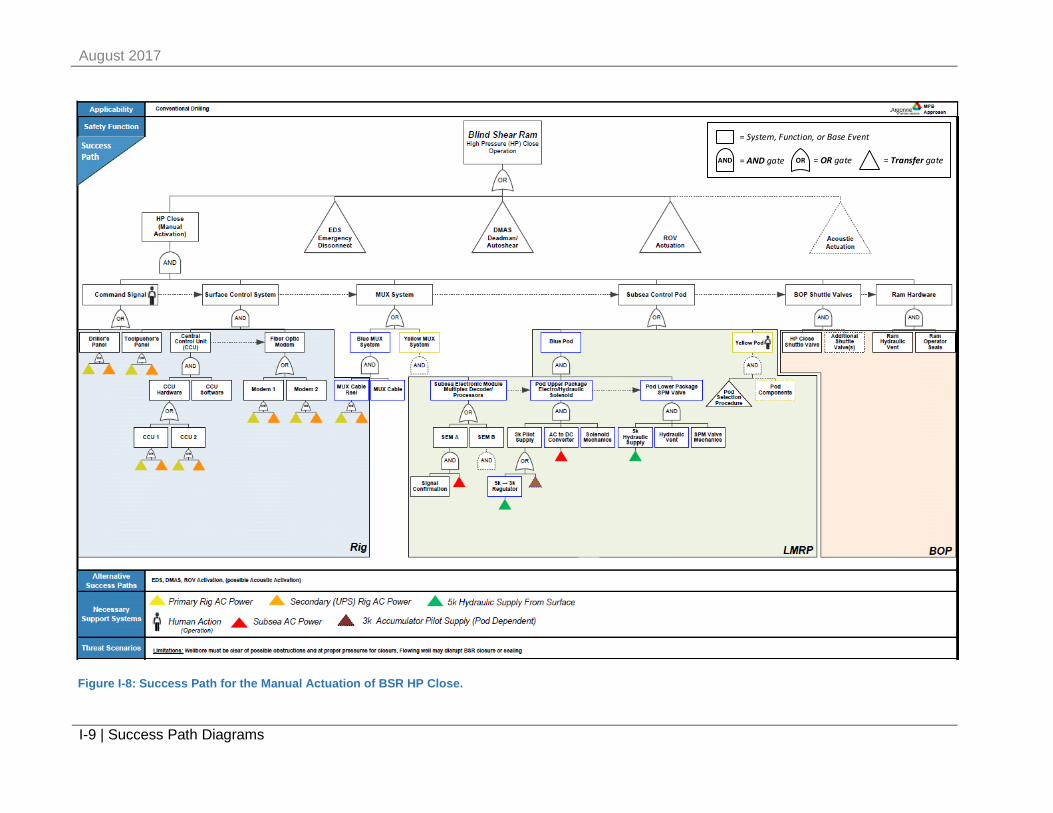
August 2017
I-9 | Success Path Diagrams
= Transfer gate
= System, Function, or Base Event
OR = OR gateAND = AND gate
Figure I-8: Success Path for the Manual Actuation of BSR HP Close.
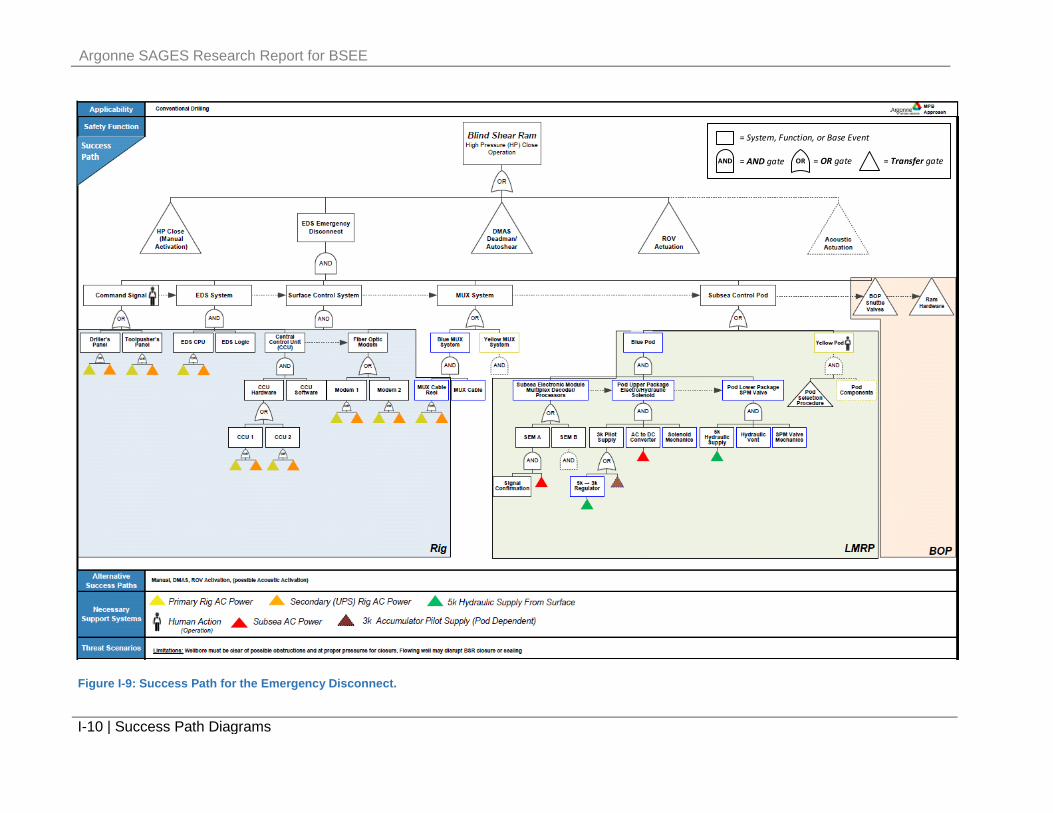
Argonne SAGES Research Report for BSEE
I-10 | Success Path Diagrams
= Transfer gate
= System, Function, or Base Event
OR = OR gateAND = AND gate
Figure I-9: Success Path for the Emergency Disconnect.
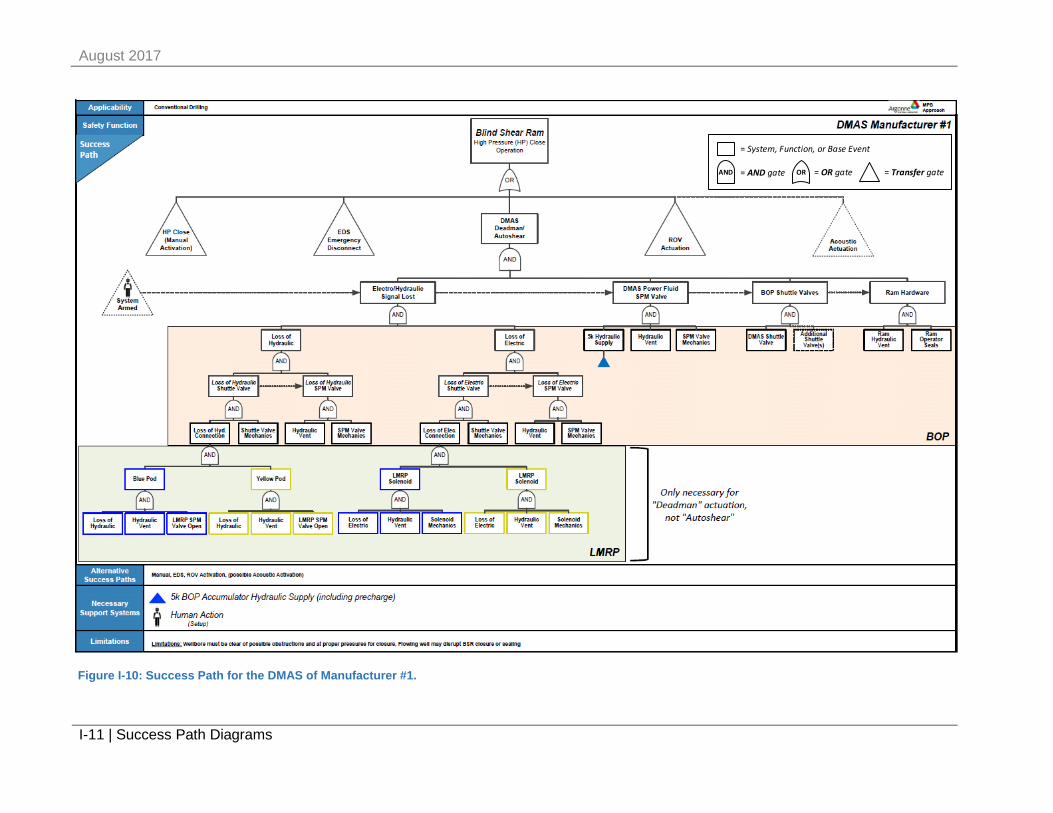
August 2017
I-11 | Success Path Diagrams
= Transfer gate
= System, Function, or Base Event
OR = OR gateAND = AND gate
Figure I-10: Success Path for the DMAS of Manufacturer #1.

Argonne SAGES Research Report for BSEE
I-12 | Success Path Diagrams
= Transfer gate
= System, Function, or Base Event
OR = OR gateAND = AND gate
Figure I-11: Success Path for the DMAS of Manufacturer #2.
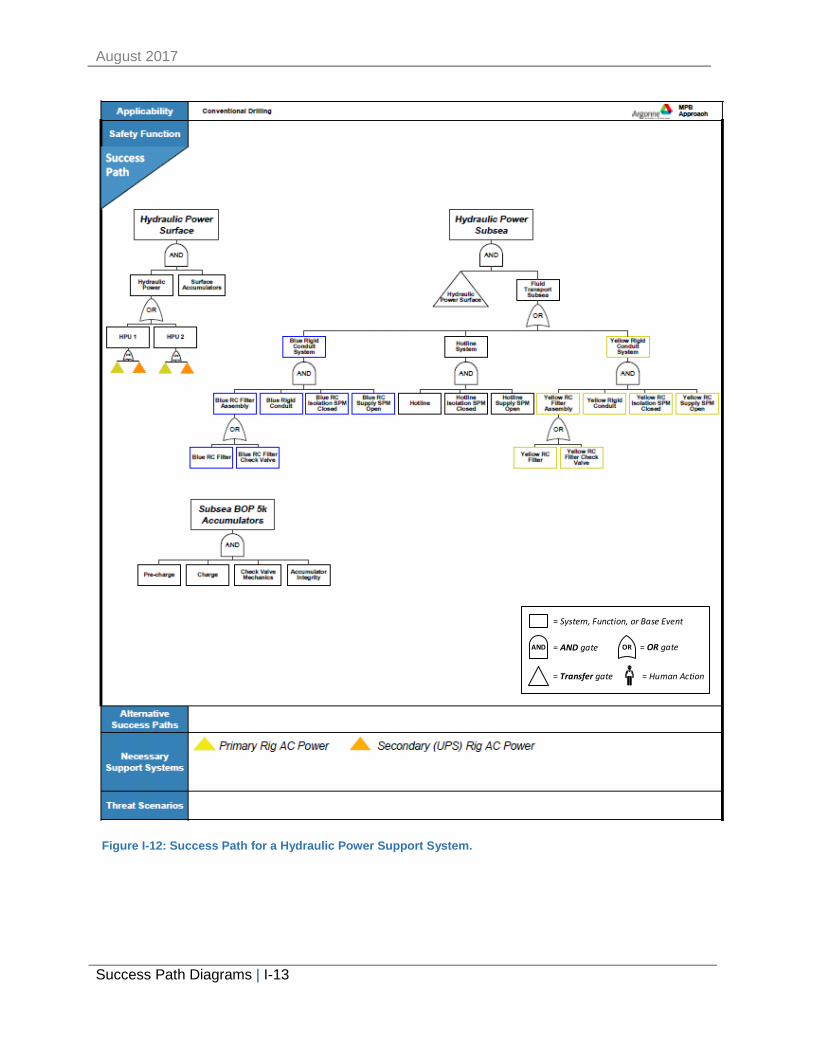
August 2017
Success Path Diagrams | I-13
OR = OR gate
= Human Action
AND = AND gate
= Transfer gate
= System, Function, or Base Event
Figure I-12: Success Path for a Hydraulic Power Support System.
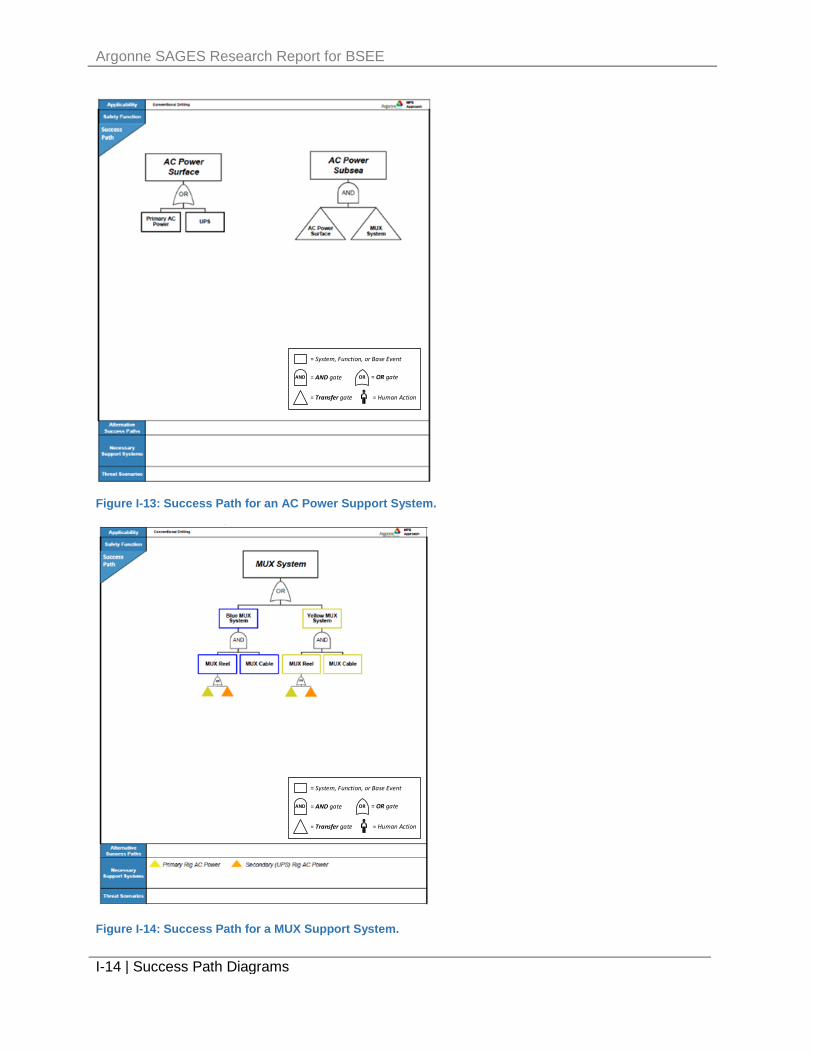
Argonne SAGES Research Report for BSEE
I-14 | Success Path Diagrams
OR = OR gate
= Human Action
AND = AND gate
= Transfer gate
= System, Function, or Base Event
Figure I-13: Success Path for an AC Power Support System.
OR = OR gate
= Human Action
AND = AND gate
= Transfer gate
= System, Function, or Base Event
Figure I-14: Success Path for a MUX Support System.
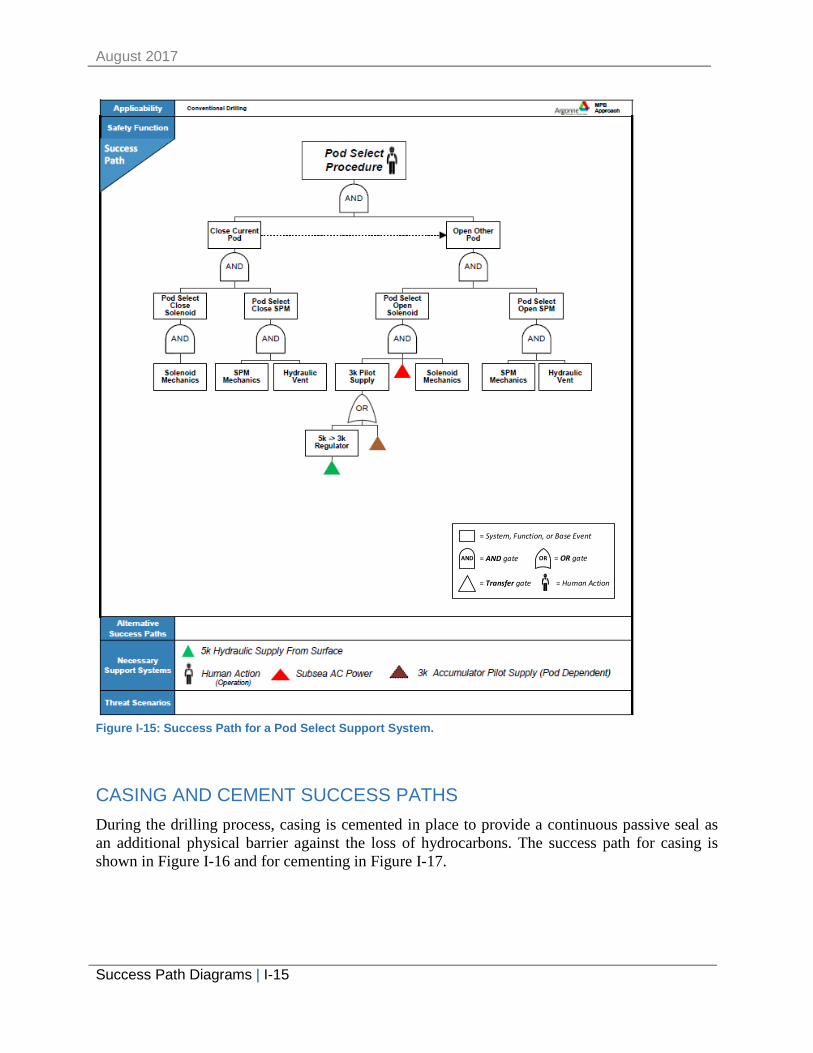
August 2017
Success Path Diagrams | I-15
OR = OR gate
= Human Action
AND = AND gate
= Transfer gate
= System, Function, or Base Event
Figure I-15: Success Path for a Pod Select Support System.
CASING AND CEMENT SUCCESS PATHS During the drilling process, casing is cemented in place to provide a continuous passive seal as an additional physical barrier against the loss of hydrocarbons. The success path for casing is shown in Figure I-16 and for cementing in Figure I-17.
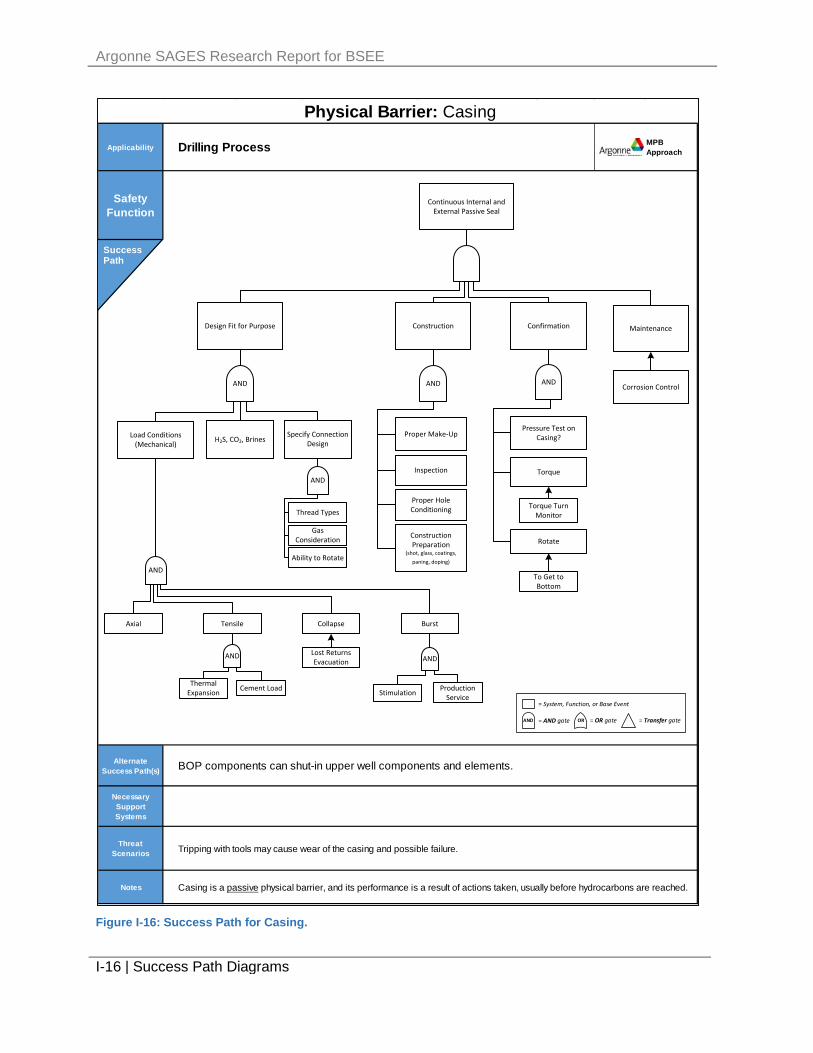
Argonne SAGES Research Report for BSEE
I-16 | Success Path Diagrams
Applicability MPB Approach
Safety Function
Alternate Success Path(s)
Necessary Support Systems
Threat Scenarios
Notes Casing is a passive physical barrier, and its performance is a result of actions taken, usually before hydrocarbons are reached.
Physical Barrier: Casing
Drilling Process
BOP components can shut-in upper well components and elements.
Tripping with tools may cause wear of the casing and possible failure.
Success Path
Continuous Internal and External Passive Seal
Design Fit for Purpose MaintenanceConfirmationConstruction
Rotate
Torque
Proper Hole Conditioning
H2S, CO2, Brines
Axial
Load Conditions (Mechanical)
AND
Inspection
Proper Make-Up
AND
Pressure Test on Casing?
AND
Construction Preparation
(shot, glass, coatings, paning, doping)
Tensile BurstCollapse
Thermal Expansion Cement Load Stimulation Production
Service
Lost Returns Evacuation
Specify Connection Design
Thread Types
Gas Consideration
Ability to Rotate
Torque Turn Monitor
To Get to Bottom
Corrosion Control
AND
AND
AND AND
= Transfer gate
= System, Function, or Base Event
OR = OR gateAND = AND gate
Figure I-16: Success Path for Casing.

August 2017
Success Path Diagrams | I-17
Applicability MPB Approach
Safety Function
Alternate Success Path(s)
Necessary Support Systems
Threat Scenarios
Notes Cement is a passive physical barrier, and its performance is a result of actions taken, usually before hydrocarbons are reached.
Physical Barrier: Cement
Drilling Process
BOP components can shut-in upper well components and elements.
Success Path
Keep Hydrocarbons where They Belong
AND
Design Fit for Purpose ConfirmationGood Cement Bond
to Casing & Formation
Properly Placed
Hold in Place
Quiet Time to Stabilize
Centralizing
Pressure Test
Temperature Survey
Properly Mixed
Right Cement
AND
Move Pipe when Possible
AND
Returns
AND
Bond Logs
Pump Fast when Possible
Maintenance
Problems with Degradation, H2S, Temperature, etc..
Clean Cement Sheet in Place
Displacement Efficiency
PP < MW + CF < FG
MW, CF, Back Pressure
= Transfer gate
= System, Function, or Base Event
OR = OR gateAND = AND gate
Figure I-17:Success Path for Cement.
Argonne SAGES Research Report for BSEE
I-18 | Success Path Diagrams
COMPLETION AND PRODUCTION SUCCESS PATHS When applying the MPB Approach to support safe completion and production operations, Argonne developed success paths for several physical barriers found during a typical operation. The running in and cementing of casing, as described above, is sometimes performed in well-completion operations. Additional success paths developed for a seal bore production packer, and production pipeline are provided below.
SEAL BORE PRODUCTION PACKER SUCCESS PATHS Packers are passive barriers and, as illustrated in the success path shown in Figure I-18, place emphasis on design, installation, and monitoring.
The removal of barriers in general, and in this case the retrieval of a packer, represents an area of high risk. Figure I-19 illustrates the success path for packer retrieval.
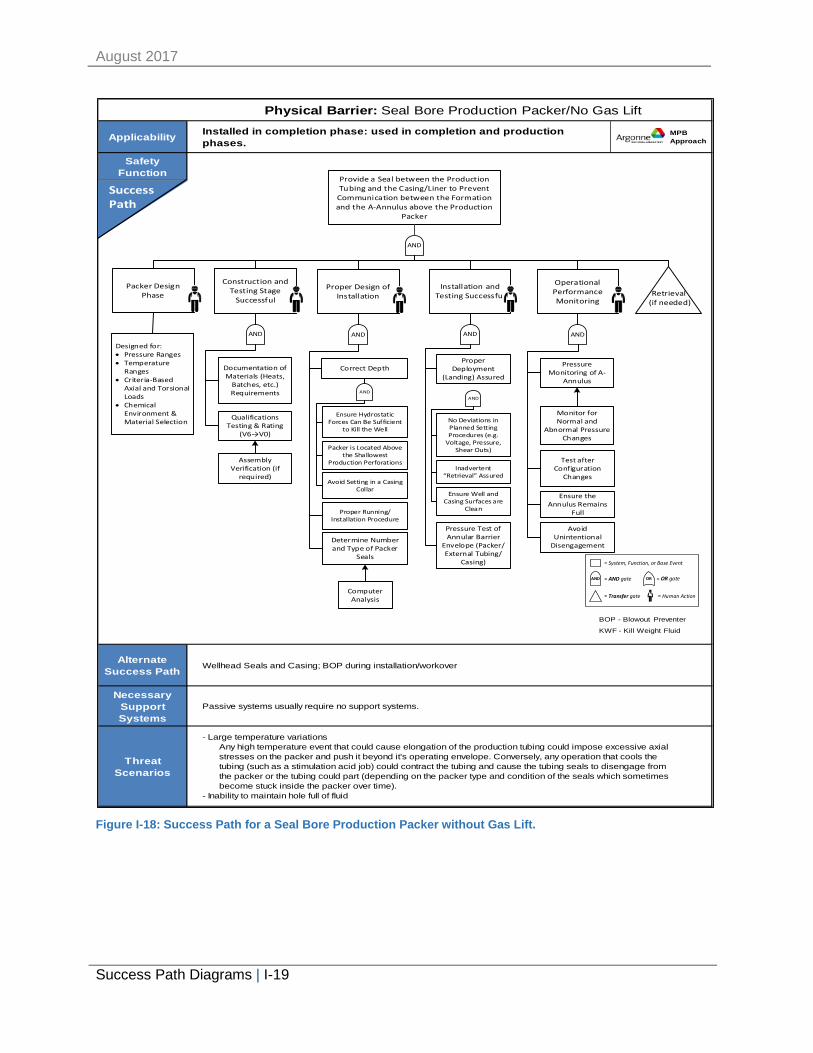
August 2017
Success Path Diagrams | I-19
Physical Barrier: Seal Bore Production Packer/No Gas Lift
Applicability MPB Approach
Safety Function
Alternate Success Path
Necessary Support Systems
Threat Scenarios
Installed in completion phase: used in completion and production phases.
- Large temperature variationsAny high temperature event that could cause elongation of the production tubing could impose excessive axial
stresses on the packer and push it beyond it's operating envelope. Conversely, any operation that cools the tubing (such as a stimulation acid job) could contract the tubing and cause the tubing seals to disengage from the packer or the tubing could part (depending on the packer type and condition of the seals which sometimes become stuck inside the packer over time).- Inability to maintain hole full of fluid
Wellhead Seals and Casing; BOP during installation/workover
Passive systems usually require no support systems.
Success Path
BOP - Blowout Preventer
KWF - Kill Weight Fluid
Provide a Seal between the Production Tubing and the Casing/Liner to Prevent
Communication between the Formation and the A-Annulus above the Production
Packer
Packer Design Phase
Construction and Testing Stage
Successful
Installation and Testing Successful
Operational Performance Monitoring
Designed for:• Pressure Ranges• Temperature
Ranges• Criteria-Based
Axial and Torsional Loads
• Chemical Environment & Material Selection
Documentation of Materials (Heats,
Batches, etc.) Requirements
Qualifications Testing & Rating
(V6→V0)
Assembly Verification (if
required)
Ensure Well and Casing Surfaces are
Clean
No Deviations in Planned Setting Procedures (e.g.
Voltage, Pressure, Shear Outs)
Proper Deployment
(Landing) Assured
Inadvertent “Retrieval” Assured
Pressure Test of Annular Barrier
Envelope (Packer/External Tubing/
Casing)
Pressure Monitoring of A-
Annulus
Monitor for Normal and
Abnormal Pressure Changes
Test after Configuration
Changes
AND
AND AND AND
AND
Ensure Hydrostatic Forces Can Be Sufficient
to Kill the Well
Packer is Located Above the Shallowest
Production Perforations
AND
Avoid Unintentional
Disengagement
Retrieval (if needed)
Ensure the Annulus Remains
Full
Avoid Setting in a Casing Collar
Proper Design of Installation
AND
Correct Depth
Determine Number and Type of Packer
Seals
Computer Analysis
Proper Running/Installation Procedure
OR = OR gate
= Human Action
AND = AND gate
= Transfer gate
= System, Function, or Base Event
Figure I-18: Success Path for a Seal Bore Production Packer without Gas Lift.
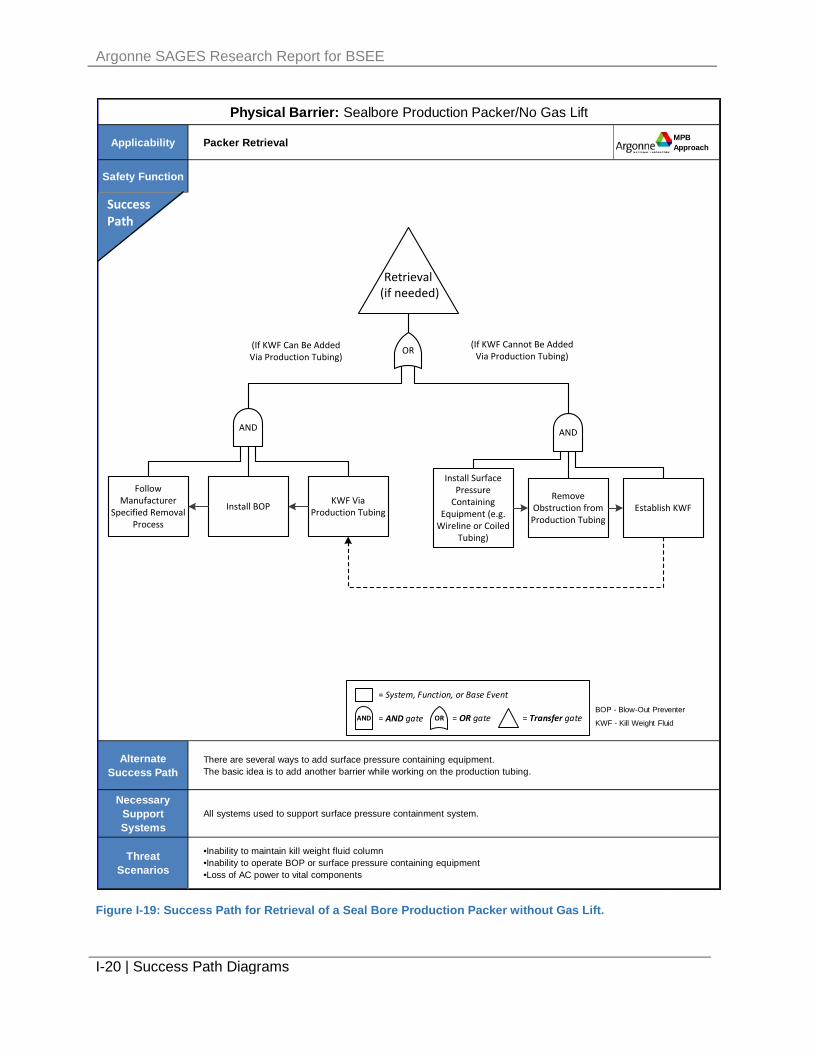
Argonne SAGES Research Report for BSEE
I-20 | Success Path Diagrams
Applicability Packer Retrieval MPB Approach
Safety Function
Alternate Success Path
Necessary Support Systems
Threat Scenarios
Physical Barrier: Sealbore Production Packer/No Gas Lift
There are several ways to add surface pressure containing equipment.The basic idea is to add another barrier while working on the production tubing.
All systems used to support surface pressure containment system.
•Inability to maintain kill weight fluid column•Inability to operate BOP or surface pressure containing equipment•Loss of AC power to vital components
Success Path
BOP - Blow-Out Preventer
KWF - Kill Weight Fluid
Retrieval (if needed)
OR
Follow Manufacturer
Specified Removal Process
AND AND
KWF Via Production Tubing
Install Surface Pressure
Containing Equipment (e.g.
Wireline or Coiled Tubing)
Remove Obstruction from Production Tubing
Establish KWFInstall BOP
(If KWF Can Be Added Via Production Tubing)
(If KWF Cannot Be Added Via Production Tubing)
= Transfer gate
= System, Function, or Base Event
OR = OR gateAND = AND gate
Figure I-19: Success Path for Retrieval of a Seal Bore Production Packer without Gas Lift.
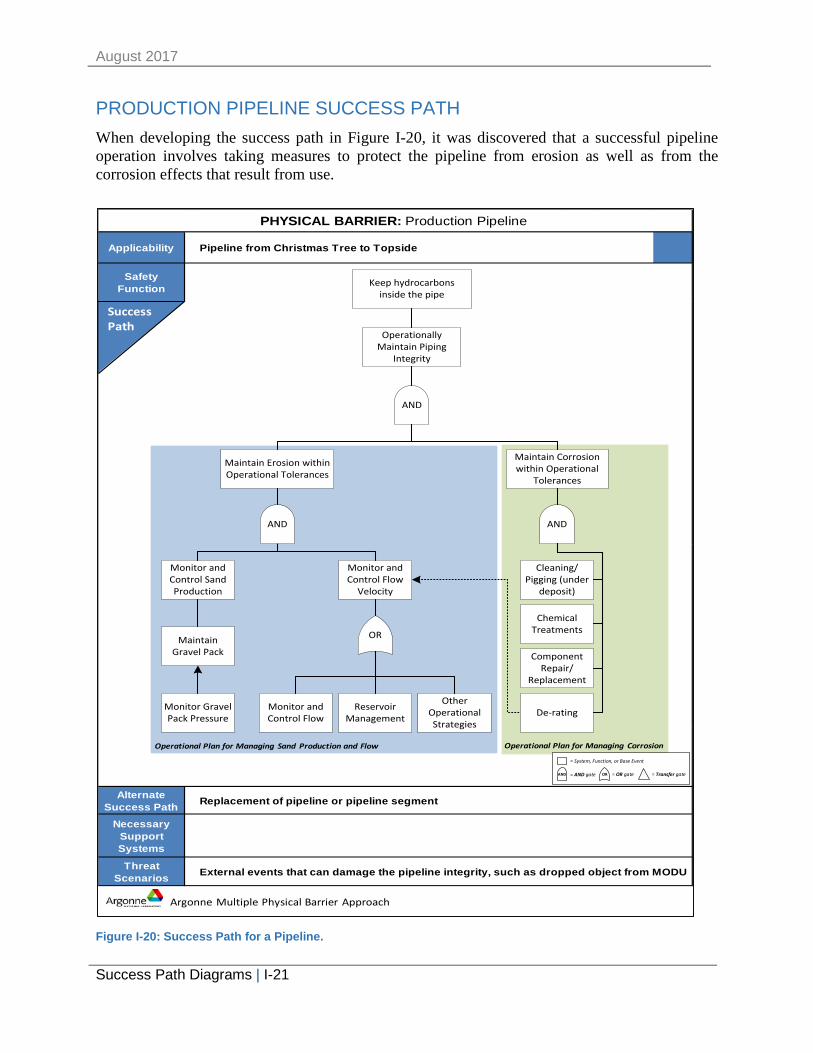
August 2017
Success Path Diagrams | I-21
PRODUCTION PIPELINE SUCCESS PATH When developing the success path in Figure I-20, it was discovered that a successful pipeline operation involves taking measures to protect the pipeline from erosion as well as from the corrosion effects that result from use.
PHYSICAL BARRIER: Production Pipeline
Applicability Pipeline from Christmas Tree to Topside
Safety Function
Alternate Success Path Replacement of pipeline or pipeline segment
Necessary Support SystemsThreat
Scenarios External events that can damage the pipeline integrity, such as dropped object from MODU
Operational Plan for Managing CorrosionOperational Plan for Managing Sand Production and Flow
Argonne Multiple Physical Barrier Approach
Success Path
Keep hydrocarbons inside the pipe
Operationally Maintain Piping
Integrity
AND
Maintain Corrosion within Operational
Tolerances
Maintain Erosion within Operational Tolerances
Monitor and Control Sand Production
Monitor and Control Flow
Velocity
Maintain Gravel Pack
Monitor Gravel Pack Pressure
AND
Cleaning/Pigging (under
deposit)
AND
OR
Monitor and Control Flow
Reservoir Management
Other Operational Strategies
Chemical Treatments
Component Repair/
Replacement
De-rating
= Transfer gate
= System, Function, or Base Event
OR = OR gateAND = AND gate
Figure I-20: Success Path for a Pipeline.
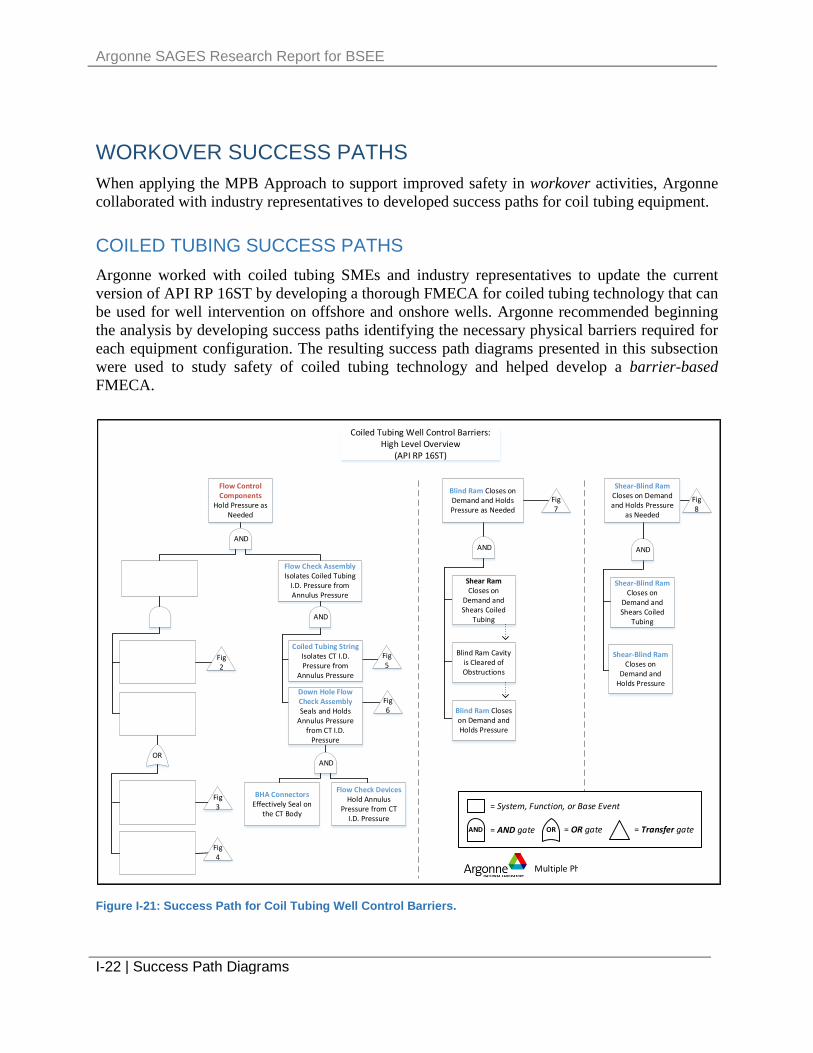
Argonne SAGES Research Report for BSEE
I-22 | Success Path Diagrams
WORKOVER SUCCESS PATHS When applying the MPB Approach to support improved safety in workover activities, Argonne collaborated with industry representatives to developed success paths for coil tubing equipment.
COILED TUBING SUCCESS PATHS Argonne worked with coiled tubing SMEs and industry representatives to update the current version of API RP 16ST by developing a thorough FMECA for coiled tubing technology that can be used for well intervention on offshore and onshore wells. Argonne recommended beginning the analysis by developing success paths identifying the necessary physical barriers required for each equipment configuration. The resulting success path diagrams presented in this subsection were used to study safety of coiled tubing technology and helped develop a barrier-based FMECA.
Flow Control Components
Hold Pressure as Needed
Blind Ram Closes on Demand and Holds Pressure as Needed
Shear-Blind Ram Closes on Demand and Holds Pressure
as Needed
Flow Check Assembly Isolates Coiled Tubing
I.D. Pressure from Annulus Pressure
AND
Fig5
Fig3
Fig4
Coiled Tubing String Isolates CT I.D. Pressure from
Annulus Pressure
Down Hole Flow Check Assembly Seals and Holds
Annulus Pressure from CT I.D.
Pressure
Fig2
Fig6
Fig7
Fig8
OR
AND
Coiled Tubing Well Control Barriers: High Level Overview
(API RP 16ST)
AND
Blind Ram Closes on Demand and Holds Pressure
Shear Ram Closes on
Demand and Shears Coiled
Tubing
Blind Ram Cavity is Cleared of Obstructions
AND
Shear-Blind Ram Closes on
Demand and Shears Coiled
Tubing
Shear-Blind Ram Closes on
Demand and Holds Pressure
AND
BHA Connectors Effectively Seal on
the CT Body
Flow Check Devices Hold Annulus
Pressure from CT I.D. Pressure
Multiple Ph
= Transfer gate
= System, Function, or Base Event
OR = OR gateAND = AND gate
Figure I-21: Success Path for Coil Tubing Well Control Barriers.
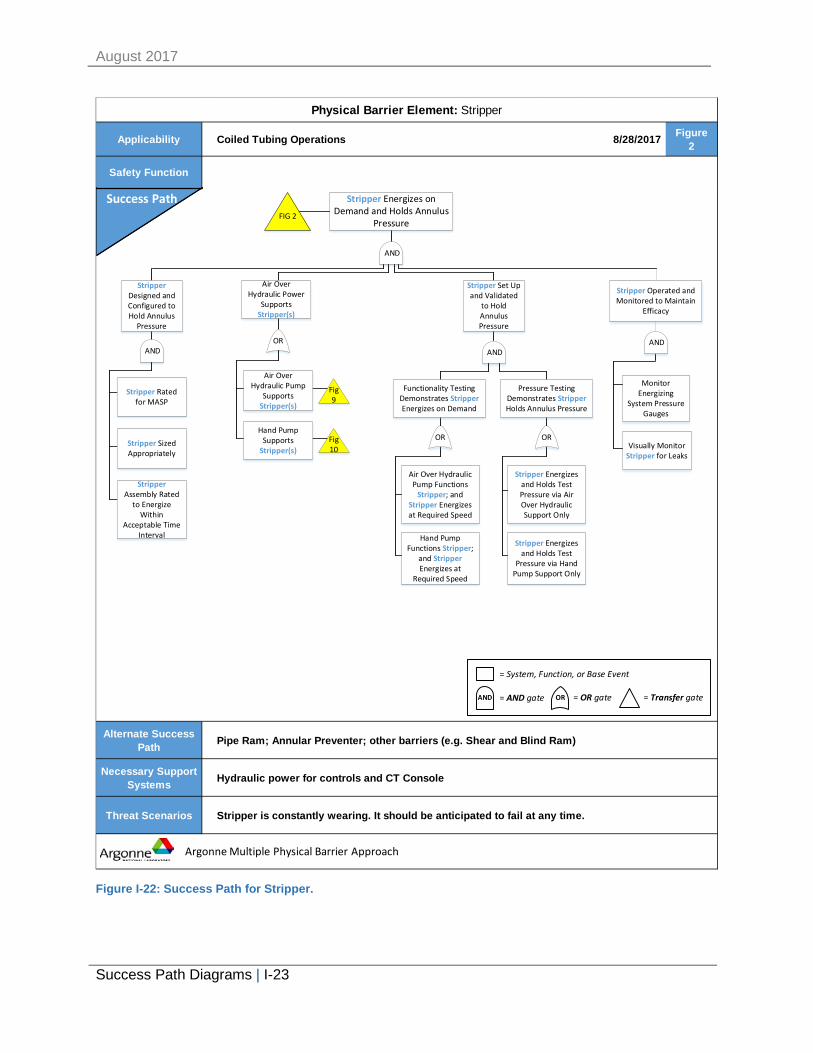
August 2017
Success Path Diagrams | I-23
Applicability Coiled Tubing Operations 8/28/2017 Figure2
Safety Function
Alternate Success Path Pipe Ram; Annular Preventer; other barriers (e.g. Shear and Blind Ram)
Necessary Support Systems Hydraulic power for controls and CT Console
Threat Scenarios Stripper is constantly wearing. It should be anticipated to fail at any time.
Physical Barrier Element: Stripper
Stripper Energizes on Demand and Holds Annulus
Pressure
Functionality Testing Demonstrates Stripper Energizes on Demand
Pressure Testing Demonstrates Stripper Holds Annulus Pressure
Air Over Hydraulic Pump Functions
Stripper; and Stripper Energizes at Required Speed
Hand Pump Functions Stripper;
and Stripper Energizes at
Required Speed
AND
FIG 2
Monitor Energizing
System Pressure Gauges
AND
Stripper Designed and Configured to Hold Annulus
Pressure
Stripper Set Up and Validated
to Hold Annulus Pressure
Stripper Operated and Monitored to Maintain
Efficacy
AND
Stripper Rated for MASP
Stripper Sized Appropriately
Stripper Assembly Rated
to Energize Within
Acceptable Time Interval
AND
Air Over Hydraulic Power
Supports Stripper(s)
Air Over Hydraulic Pump
Supports Stripper(s)
Hand Pump Supports
Stripper(s)
OR
Fig9
Visually Monitor Stripper for Leaks
Stripper Energizes and Holds Test Pressure via Air Over Hydraulic Support Only
Fig10
Stripper Energizes and Holds Test
Pressure via Hand Pump Support Only
OR OR
Success PathSuccess Path
Argonne Multiple Physical Barrier Approach
= Transfer gate
= System, Function, or Base Event
OR = OR gateAND = AND gate
Figure I-22: Success Path for Stripper.
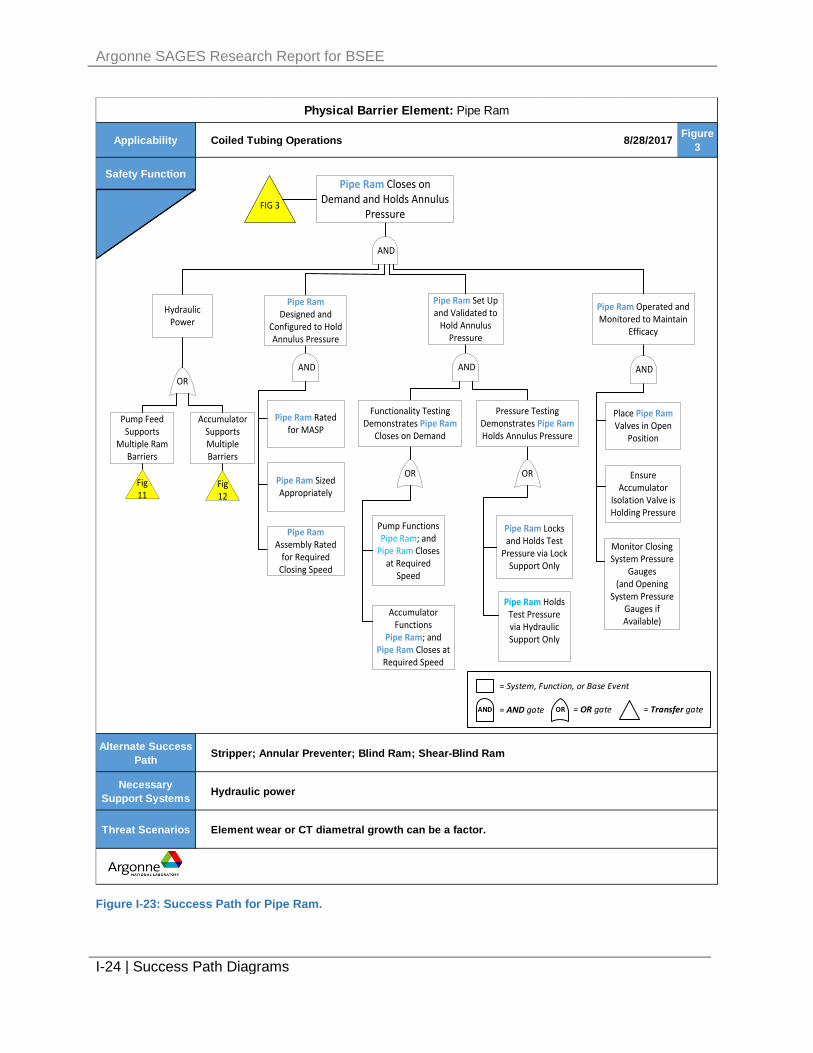
Argonne SAGES Research Report for BSEE
I-24 | Success Path Diagrams
Applicability Coiled Tubing Operations 8/28/2017 Figure3
Safety Function
Alternate Success Path Stripper; Annular Preventer; Blind Ram; Shear-Blind Ram
Necessary Support Systems Hydraulic power
Threat Scenarios Element wear or CT diametral growth can be a factor.
Physical Barrier Element: Pipe Ram
Success Path
Pipe Ram Closes on Demand and Holds Annulus
Pressure
Accumulator Functions
Pipe Ram; and Pipe Ram Closes at
Required Speed
Pipe Ram Locks and Holds Test
Pressure via Lock Support Only
AND
FIG 3
Place Pipe Ram Valves in Open
Position
Ensure Accumulator
Isolation Valve is Holding Pressure
Monitor Closing System Pressure
Gauges(and Opening
System Pressure Gauges if Available)
AND
Pipe Ram Designed and
Configured to Hold Annulus Pressure
Pipe Ram Set Up and Validated to
Hold Annulus Pressure
AND
Pipe Ram Rated for MASP
Pipe Ram Sized Appropriately
Pipe Ram Assembly Rated
for Required Closing Speed
AND
Fig11
Fig12
OR OR
OR
Hydraulic Power
Pump Feed Supports
Multiple Ram Barriers
Accumulator Supports Multiple Barriers
Pump Functions Pipe Ram; and
Pipe Ram Closes at Required
Speed
Pipe Ram Holds Test Pressure via Hydraulic Support Only
Functionality Testing Demonstrates Pipe Ram
Closes on Demand
Pressure Testing Demonstrates Pipe Ram Holds Annulus Pressure
Pipe Ram Operated and Monitored to Maintain
Efficacy
= Transfer gate
= System, Function, or Base Event
OR = OR gateAND = AND gate
Figure I-23: Success Path for Pipe Ram.

August 2017
Success Path Diagrams | I-25
Applicability Coiled Tubing Operations 8/28/2017 Figure4
Safety Function
Alternate Success Path Stripper; Pipe Rams; Blind Ram System; Shear-Blind Ram
Necessary Support Systems
Hydraulic power
Threat Scenarios Wear and distortion of rubber elements is a concern.
Physical Barrier Element: Annular Preventer
Success Path
Annular Preventer Closes on Demand and Holds
Annulus Pressure
Functionality Testing Demonstrates Annular
Preventer Closes on Demand
Pressure Testing Demonstrates Annular
Preventer Holds Annulus Pressure
Pump Functions Annular
Preventer; and Annular
Preventer Closes at Required
Speed
Accumulator Functions Annular
Preventer; and Annular
Preventer Closes at Required
Speed
Annular Preventer Closes
and Holds Test Pressure via
Hydraulic Support Only
AND
FIG 4
Place Annular Preventer Valves in Open Position
Ensure Accumulator
Isolation Valve is Holding Pressure
AND
Annular Preventer Designed and
Configured to Hold Annulus Pressure
Annular Preventer Set Up and Validated to
Hold Annulus Pressure
Annular Preventer Operated and
Monitored to Maintain Efficacy
AND
Annular Preventer Rated
for MASP
Annular Preventer Sized Appropriately
Annular Preventer
Assembly Rated for Required
Closing Speed
AND
Pump Feed Supports
Multiple Ram Barriers
Accumulator Supports Multiple Barriers
Fig11
Fig12
OR
Monitor Closing System Pressure
Gauges(and Opening
System Pressure Gauges if Available)
Hydraulic Power
OR
= Transfer gate
= System, Function, or Base Event
OR = OR gateAND = AND gate
Figure I-24: Success Path for Annular Preventer.

Argonne SAGES Research Report for BSEE
I-26 | Success Path Diagrams
Applicability Coiled Tubing Operations 8/28/2017 Figure5
Safety Function
Alternate Success Path Surface Shear and Blind Ram or Shear-Blind Ram
Necessary Support Systems CT Injector and support systems
Threat Scenarios Surface defects, bend cycle fatigue, and mechanical damage are major factors.
Physical Barrier Element: Coiled Tubing String
Coiled Tubing String Isolates CT I.D. Pressure from
Annulus Pressure
Coiled Tubing String Rated to Withstand
Internal and External Pressures for the
Prescribed Job
Coiled Tubing String Operated and
Monitored to Ensure Continued Coiled Tubing
Body Integrity
Coiled Tubing String Designed and
Configured to Isolate CT I.D. Pressure fromAnnulus Pressure
Coiled Tubing String Set Up and Validated to
Withstand External and Internal Pressure
Ensure Bend Cycle Fatigue History, String
History, or Service History Do Not Degrade
Pressure Rating.
Utilize Bend Cycle Fatigue History to Anticipate Crack
Initiation
Monitor and Record Bend Cycles and Internal Pressure
Monitor and Record String Repairs and
Maintenence
Monitor and Record Service History
AND
AND
Inspect O.D. Surface of Coiled Tubing String
Body
Confirm Coiled Tubing String Wall Thickness is
Within Design Parameters
AND
Pressure Testing Demonstrates Coiled Tubing String Holds
Internal Pressure
FIG 5Success PathSuccess Path
Argonne Multiple Physical Barrier Approach
= Transfer gate
= System, Function, or Base Event
OR = OR gateAND = AND gate
Figure I-25: Success Path for Coiled Tubing String.
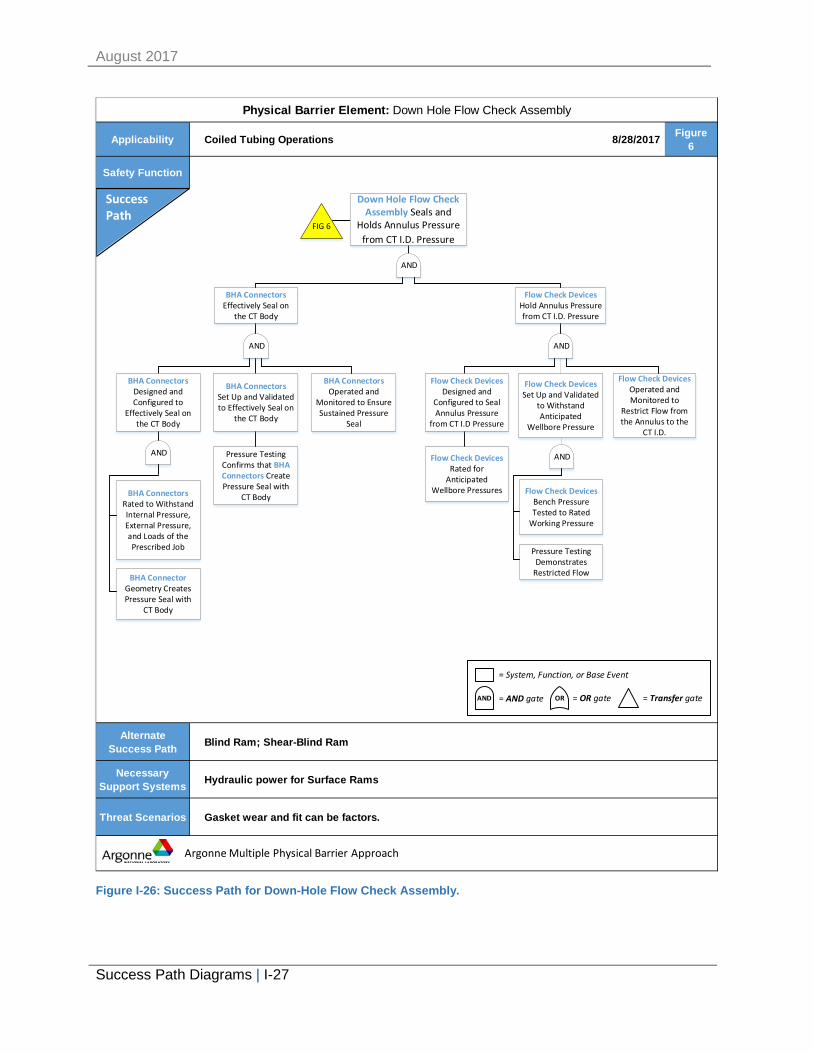
August 2017
Success Path Diagrams | I-27
Applicability Coiled Tubing Operations 8/28/2017 Figure6
Safety Function
Alternate Success Path Blind Ram; Shear-Blind Ram
Necessary Support Systems Hydraulic power for Surface Rams
Threat Scenarios Gasket wear and fit can be factors.
Physical Barrier Element: Down Hole Flow Check Assembly
Down Hole Flow Check Assembly Seals and
Holds Annulus Pressure from CT I.D. Pressure
AND
BHA Connectors Effectively Seal on
the CT Body
Flow Check Devices Hold Annulus Pressure from CT I.D. Pressure
BHA Connectors Rated to Withstand Internal Pressure, External Pressure, and Loads of the Prescribed Job
Flow Check Devices Designed and
Configured to Seal Annulus Pressure
from CT I.D Pressure
Flow Check Devices Operated and Monitored to
Restrict Flow from the Annulus to the
CT I.D.
AND AND
FIG 6
Flow Check Devices Rated for
Anticipated Wellbore Pressures Flow Check Devices
Bench Pressure Tested to Rated
Working Pressure
BHA Connectors Designed and Configured to
Effectively Seal on the CT Body
BHA Connectors Set Up and Validated to Effectively Seal on
the CT Body
BHA Connectors Operated and
Monitored to Ensure Sustained Pressure
Seal
BHA Connector Geometry Creates Pressure Seal with
CT Body
Pressure Testing Confirms that BHA Connectors Create Pressure Seal with
CT Body
AND
Flow Check Devices Set Up and Validated
to Withstand Anticipated
Wellbore Pressure
Pressure Testing Demonstrates
Restricted Flow
AND
Success Path
Argonne Multiple Physical Barrier Approach
= Transfer gate
= System, Function, or Base Event
OR = OR gateAND = AND gate
Figure I-26: Success Path for Down-Hole Flow Check Assembly.

Argonne SAGES Research Report for BSEE
I-28 | Success Path Diagrams
Applicability Coiled Tubing Operations 8/28/2017 Figure7
Safety Function
Alternate Success Path Shear-Blind Ram; Annular Preventer; Pipe Ram(s); Stripper
The shear ram must be used prior to closing the blind ram.Hydraulic power to rams and Injector (required for movement of pipe).Blind ram cavity must be cleared by injector action.Power Pack shutdown restricts Injector movement of pipe.
Necessary Support Systems
Threat Scenarios
Physical Barrier Element: Blind Ram
Success Path Blind Ram Closes on Demand
and Holds Pressure as Needed
Blind Ram Closes on Demand and Holds Pressure
as Needed
Shear Ram Closes on
Demand and Shears Coiled
Tubing
Blind Ram Cavity is Cleared of Obstructions
AND
FIG 7
Fig7a Fig
7b
(THEN) (THEN)
Pump Feed Supports
Multiple Ram Barriers
Accumulator Supports Multiple Barriers
Fig11
Fig12
Hydraulic Power
OR
= Transfer gate
= System, Function, or Base Event
OR = OR gateAND = AND gate
Figure I-27: Success Path for Blind Ram.
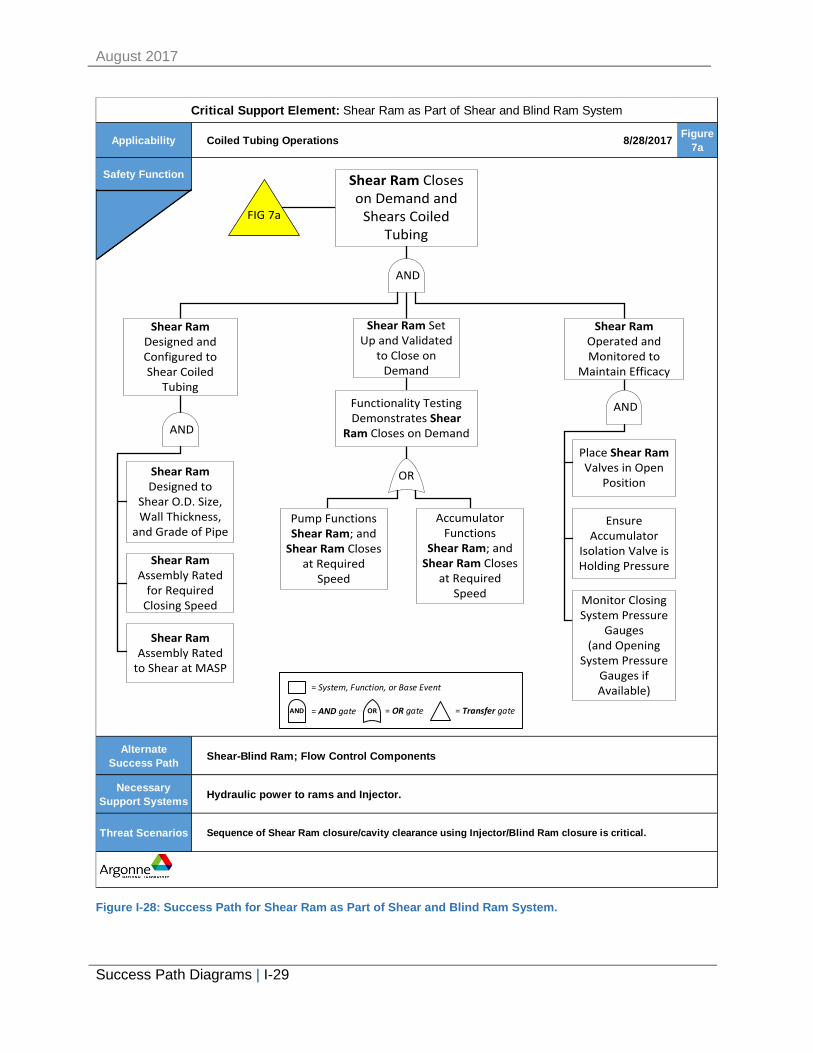
August 2017
Success Path Diagrams | I-29
Applicability Coiled Tubing Operations 8/28/2017 Figure7a
Safety Function
Alternate Success Path Shear-Blind Ram; Flow Control Components
Necessary Support Systems Hydraulic power to rams and Injector.
Threat Scenarios Sequence of Shear Ram closure/cavity clearance using Injector/Blind Ram closure is critical.
Critical Support Element: Shear Ram as Part of Shear and Blind Ram System
Success Path
Shear Ram Closes on Demand and
Shears Coiled Tubing
Shear Ram Designed and Configured to Shear Coiled
Tubing
Shear Ram Operated and Monitored to
Maintain Efficacy
Shear Ram Designed to
Shear O.D. Size, Wall Thickness,
and Grade of Pipe
Place Shear Ram Valves in Open
Position
Ensure Accumulator
Isolation Valve is Holding Pressure
Shear Ram Set Up and Validated
to Close on Demand
Functionality Testing Demonstrates Shear
Ram Closes on Demand
Pump Functions Shear Ram; and
Shear Ram Closes at Required
Speed
Accumulator Functions
Shear Ram; and Shear Ram Closes
at Required Speed
AND
AND
Shear Ram Assembly Rated
for Required Closing Speed
AND
Shear Ram Assembly Rated
to Shear at MASP
OR
Monitor Closing System Pressure
Gauges(and Opening
System Pressure Gauges if Available)
FIG 7a
= Transfer gate
= System, Function, or Base Event
OR = OR gateAND = AND gate
Figure I-28: Success Path for Shear Ram as Part of Shear and Blind Ram System.
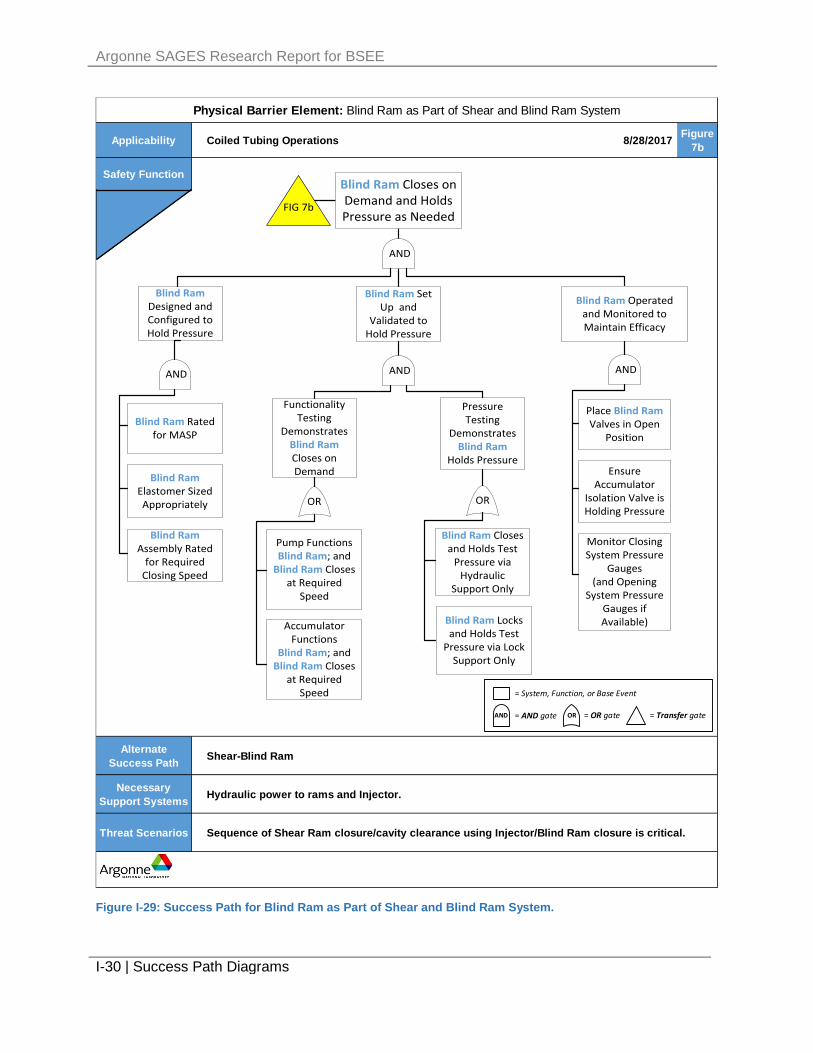
Argonne SAGES Research Report for BSEE
I-30 | Success Path Diagrams
Applicability Coiled Tubing Operations 8/28/2017 Figure7b
Safety Function
Alternate Success Path Shear-Blind Ram
Necessary Support Systems Hydraulic power to rams and Injector.
Threat Scenarios Sequence of Shear Ram closure/cavity clearance using Injector/Blind Ram closure is critical.
Physical Barrier Element: Blind Ram as Part of Shear and Blind Ram System
Success Path
Blind Ram Closes on Demand and Holds Pressure as Needed
Blind Ram Set Up and
Validated to Hold Pressure
Blind Ram Operated and Monitored to Maintain Efficacy
Blind Ram Designed and Configured to Hold Pressure
Blind Ram Rated for MASP
Blind Ram Elastomer Sized Appropriately
Blind Ram Assembly Rated
for Required Closing Speed
AND
Functionality Testing
Demonstrates Blind Ram Closes on Demand
Pressure Testing
Demonstrates Blind Ram
Holds Pressure
AND AND
Pump Functions Blind Ram; and
Blind Ram Closes at Required
Speed
Accumulator Functions
Blind Ram; and Blind Ram Closes
at Required Speed
Blind Ram Closes and Holds Test
Pressure via Hydraulic
Support Only
Blind Ram Locks and Holds Test
Pressure via Lock Support Only
Place Blind Ram Valves in Open
Position
Ensure Accumulator
Isolation Valve is Holding Pressure
AND
Monitor Closing System Pressure
Gauges(and Opening
System Pressure Gauges if Available)
OR
FIG 7b
OR
= Transfer gate
= System, Function, or Base Event
OR = OR gateAND = AND gate
Figure I-29: Success Path for Blind Ram as Part of Shear and Blind Ram System.

August 2017
Success Path Diagrams | I-31
Applicability Coiled Tubing Operations 8/28/2017 Figure8
Safety Function
Alternate Success Path Blind Ram; Flow Control Components
Necessary Support Systems Hydraulic power to rams
Threat Scenarios Shear blade sizing and sufficient hydraulic pressure must be confirmed.
Physical Barrier Element: Shear-Blind Ram
Success Path
Shear-Blind Ram Closes on Demand, Shears Coiled
Tubing, and Holds Pressure as Needed
Shear-Blind Ram Designed and
Configured to Shear Coiled Tubing and
Hold Pressure
Shear-Blind Ram Set Up and Validated to
Hold Pressure
Shear-Blind Ram Operated and Monitored to
Maintain Efficacy
Shear-Blind Ram Designed to
Shear O.D. Size, Wall Thickness,
and Grade of Pipe
Shear-Blind Ram Assembly Rated
for Required Closing Speed
Shear-Blind Ram Rated for MASP
Functionality Testing Demonstrates Shear-Blind Ram Closes on
Demand
Pressure Testing Demonstrates Shear-
Blind Ram Holds Pressure
Pump Functions Shear-Blind Ram; and Shear-Blind Ram Closes at
Required Speed
Accumulator Functions
Shear-Blind Ram; and Shear-Blind Ram Closes at
Required Speed
Shear-Blind Ram Closes and Holds Test Pressure via
Hydraulic Support Only
Shear-Blind Ram Locks and Holds Test Pressure via
Lock Support Only
Place Shear-Blind Ram Valves in Open Position
Ensure Accumulator
Isolation Valve is Holding Pressure
AND
AND AND AND
FIG 8
Shear-Blind Ram Assembly Rated
to Shear and Seal at MASP
Monitor Closing System Pressure
Gauges(and Opening
System Pressure Gauges if Available)
OR OR
Pump Feed Supports
Multiple Ram Barriers
Accumulator Supports Multiple Barriers
Fig11
Fig12
Hydraulic Power
OR
= Transfer gate
= System, Function, or Base Event
OR = OR gateAND = AND gate
Figure I-30: Success Path for Shear-Blind Ram.
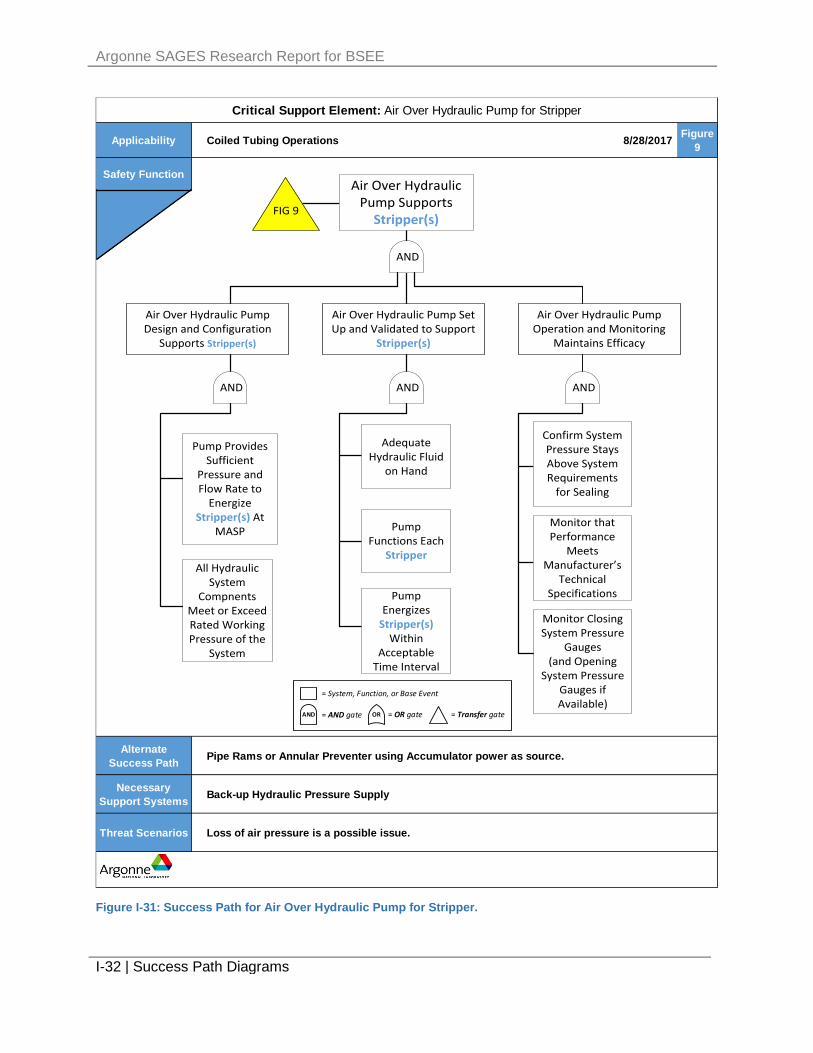
Argonne SAGES Research Report for BSEE
I-32 | Success Path Diagrams
Applicability Coiled Tubing Operations 8/28/2017 Figure9
Safety Function
Alternate Success Path Pipe Rams or Annular Preventer using Accumulator power as source.
Necessary Support Systems Back-up Hydraulic Pressure Supply
Threat Scenarios Loss of air pressure is a possible issue.
Critical Support Element: Air Over Hydraulic Pump for Stripper
Success Path
Air Over Hydraulic Pump Design and Configuration
Supports Stripper(s)
AND
Pump Provides Sufficient
Pressure and Flow Rate to
Energize Stripper(s) At
MASP
All Hydraulic System
Compnents Meet or Exceed Rated Working Pressure of the
System
AND
FIG 9
Adequate Hydraulic Fluid
on Hand
Pump Energizes
Stripper(s) Within
Acceptable Time Interval
Pump Functions Each
Stripper
Confirm System Pressure Stays Above System Requirements
for Sealing
Monitor that Performance
Meets Manufacturer’s
Technical Specifications
AND AND
Air Over Hydraulic Pump Set Up and Validated to Support
Stripper(s)
Air Over Hydraulic Pump Operation and Monitoring
Maintains Efficacy
Air Over Hydraulic Pump Supports
Stripper(s)
Monitor Closing System Pressure
Gauges(and Opening
System Pressure Gauges if Available)
= Transfer gate
= System, Function, or Base Event
OR = OR gateAND = AND gate
Figure I-31: Success Path for Air Over Hydraulic Pump for Stripper.
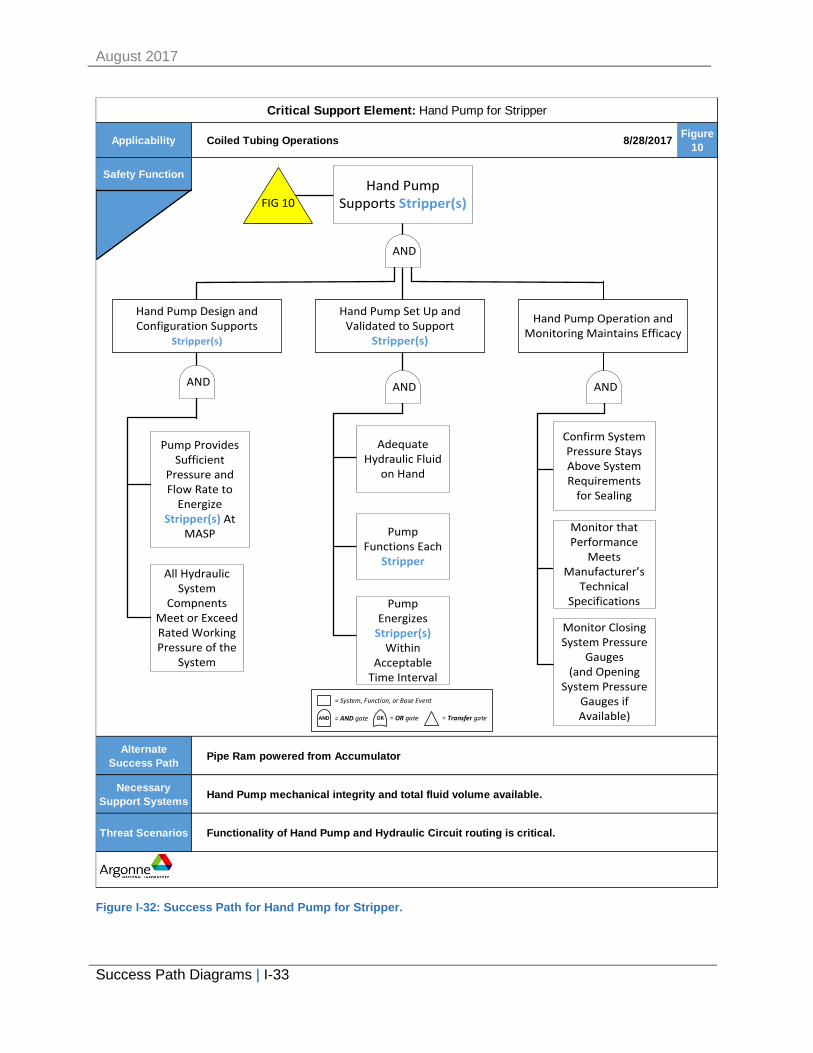
August 2017
Success Path Diagrams | I-33
Applicability Coiled Tubing Operations 8/28/2017 Figure10
Safety Function
Alternate Success Path Pipe Ram powered from Accumulator
Necessary Support Systems Hand Pump mechanical integrity and total fluid volume available.
Threat Scenarios Functionality of Hand Pump and Hydraulic Circuit routing is critical.
Critical Support Element: Hand Pump for Stripper
Success Path
Hand Pump Design and Configuration Supports
Stripper(s)
AND
Pump Provides Sufficient
Pressure and Flow Rate to
Energize Stripper(s) At
MASP
All Hydraulic System
Compnents Meet or Exceed Rated Working Pressure of the
System
AND
FIG 10
Adequate Hydraulic Fluid
on Hand
Pump Energizes
Stripper(s) Within
Acceptable Time Interval
Pump Functions Each
Stripper
Confirm System Pressure Stays Above System Requirements
for Sealing
Monitor that Performance
Meets Manufacturer’s
Technical Specifications
AND AND
Hand Pump Set Up and Validated to Support
Stripper(s)
Hand Pump Operation and Monitoring Maintains Efficacy
Hand Pump Supports Stripper(s)
Monitor Closing System Pressure
Gauges(and Opening
System Pressure Gauges if Available) = Transfer gate
= System, Function, or Base Event
OR = OR gateAND = AND gate
Figure I-32: Success Path for Hand Pump for Stripper.
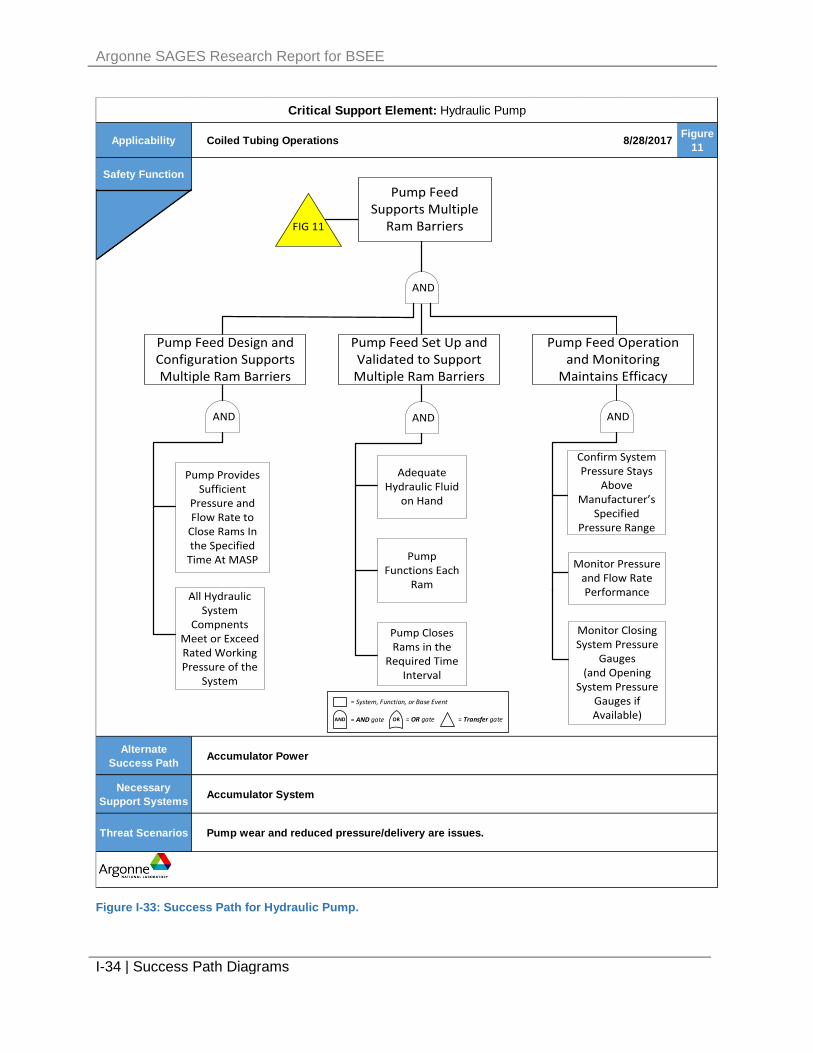
Argonne SAGES Research Report for BSEE
I-34 | Success Path Diagrams
Applicability Coiled Tubing Operations 8/28/2017 Figure11
Safety Function
Alternate Success Path Accumulator Power
Necessary Support Systems Accumulator System
Threat Scenarios Pump wear and reduced pressure/delivery are issues.
Critical Support Element: Hydraulic Pump
Success Path
Pump Feed Supports Multiple
Ram Barriers
Pump Feed Design and Configuration Supports Multiple Ram Barriers
AND
Pump Provides Sufficient
Pressure and Flow Rate to
Close Rams In the Specified
Time At MASP
All Hydraulic System
Compnents Meet or Exceed Rated Working Pressure of the
System
AND
FIG 11
Adequate Hydraulic Fluid
on Hand
Pump Closes Rams in the
Required Time Interval
Pump Functions Each
Ram
Confirm System Pressure Stays
Above Manufacturer’s
Specified Pressure Range
Monitor Pressure and Flow Rate Performance
AND AND
Pump Feed Set Up and Validated to Support
Multiple Ram Barriers
Pump Feed Operation and Monitoring
Maintains Efficacy
Monitor Closing System Pressure
Gauges(and Opening
System Pressure Gauges if Available) = Transfer gate
= System, Function, or Base Event
OR = OR gateAND = AND gate
Figure I-33: Success Path for Hydraulic Pump.
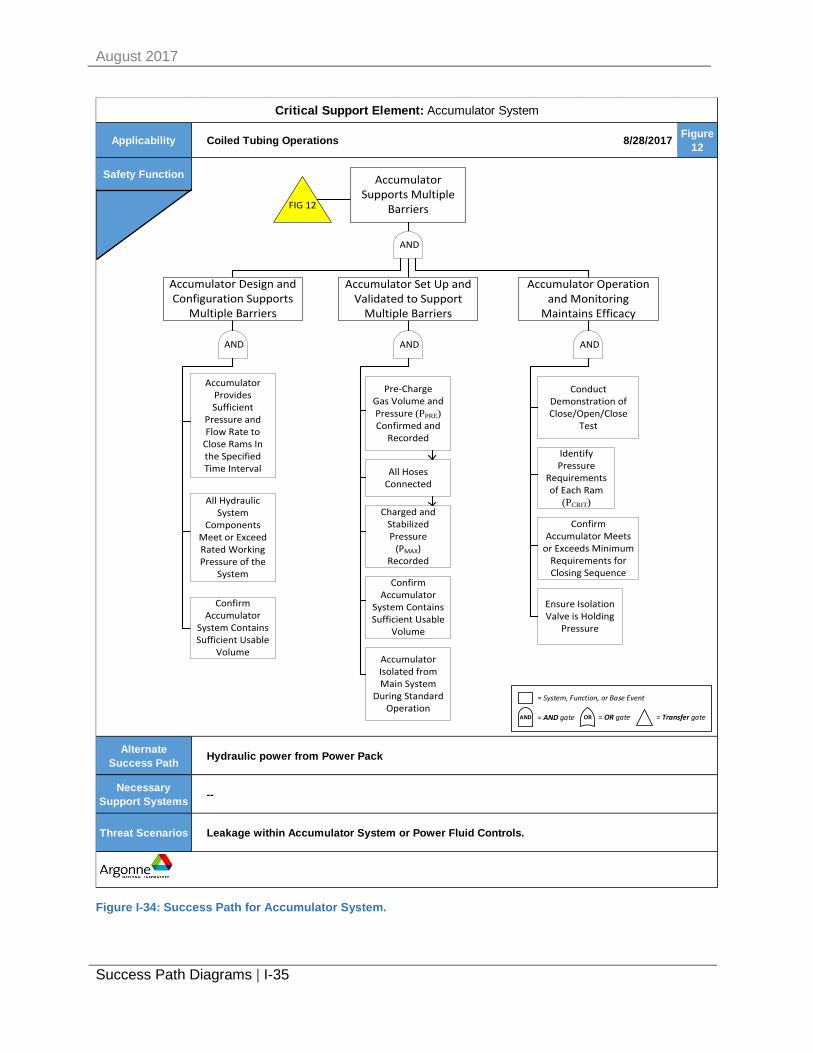
August 2017
Success Path Diagrams | I-35
Applicability Coiled Tubing Operations 8/28/2017 Figure12
Safety Function
Alternate Success Path Hydraulic power from Power Pack
Necessary Support Systems --
Threat Scenarios Leakage within Accumulator System or Power Fluid Controls.
Critical Support Element: Accumulator System
Success Path
AND
Accumulator Provides Sufficient
Pressure and Flow Rate to
Close Rams In the Specified Time Interval
Pre-Charge Gas Volume and Pressure (PPRE) Confirmed and
Recorded
Charged and Stabilized Pressure
(PMAX)Recorded
All Hoses Connected
Accumulator Isolated from Main System
During Standard Operation
AND AND
FIG 12
Confirm Accumulator
System Contains Sufficient Usable
Volume
All Hydraulic System
Components Meet or Exceed Rated Working Pressure of the
System
Identify Pressure
Requirements of Each Ram
(PCRIT)
Confirm Accumulator Meets
or Exceeds Minimum Requirements for Closing Sequence
Conduct Demonstration of Close/Open/Close
Test
Confirm Accumulator
System Contains Sufficient Usable
Volume
AND
Ensure Isolation Valve is Holding
Pressure
Accumulator Supports Multiple
Barriers
Accumulator Design and Configuration Supports
Multiple Barriers
Accumulator Set Up and Validated to Support
Multiple Barriers
Accumulator Operation and Monitoring
Maintains Efficacy
= Transfer gate
= System, Function, or Base Event
OR = OR gateAND = AND gate
Figure I-34: Success Path for Accumulator System.
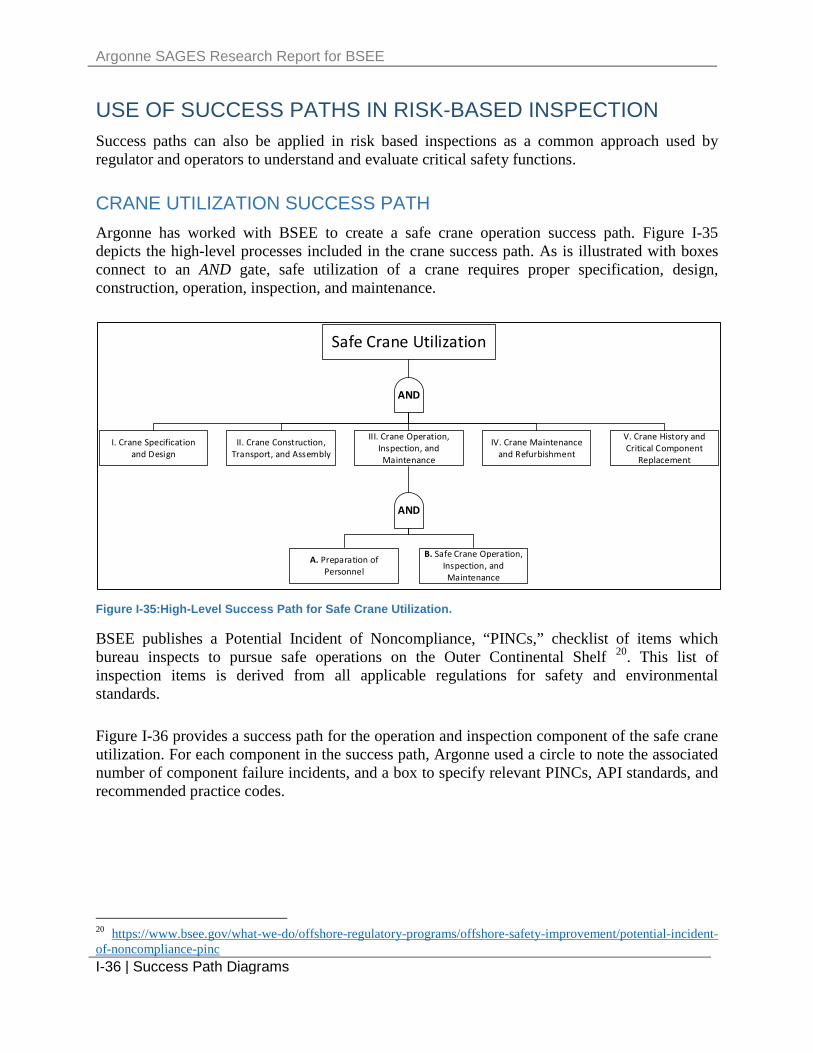
Argonne SAGES Research Report for BSEE
I-36 | Success Path Diagrams
USE OF SUCCESS PATHS IN RISK-BASED INSPECTION Success paths can also be applied in risk based inspections as a common approach used by regulator and operators to understand and evaluate critical safety functions.
CRANE UTILIZATION SUCCESS PATH Argonne has worked with BSEE to create a safe crane operation success path. Figure I-35 depicts the high-level processes included in the crane success path. As is illustrated with boxes connect to an AND gate, safe utilization of a crane requires proper specification, design, construction, operation, inspection, and maintenance.
Safe Crane Utilization
I. Crane Specificationand Design
II. Crane Construction, Transport, and Assembly
III. Crane Operation, Inspection, and Maintenance
IV. Crane Maintenance and Refurbishment
AND
AND
A. Preparation ofPersonnel
B. Safe Crane Operation, Inspection, and Maintenance
V. Crane History and Critical Component
Replacement
Figure I-35:High-Level Success Path for Safe Crane Utilization.
BSEE publishes a Potential Incident of Noncompliance, “PINCs,” checklist of items which bureau inspects to pursue safe operations on the Outer Continental Shelf 20. This list of inspection items is derived from all applicable regulations for safety and environmental standards.
Figure I-36 provides a success path for the operation and inspection component of the safe crane utilization. For each component in the success path, Argonne used a circle to note the associated number of component failure incidents, and a box to specify relevant PINCs, API standards, and recommended practice codes.
20 https://www.bsee.gov/what-we-do/offshore-regulatory-programs/offshore-safety-improvement/potential-incident-of-noncompliance-pinc
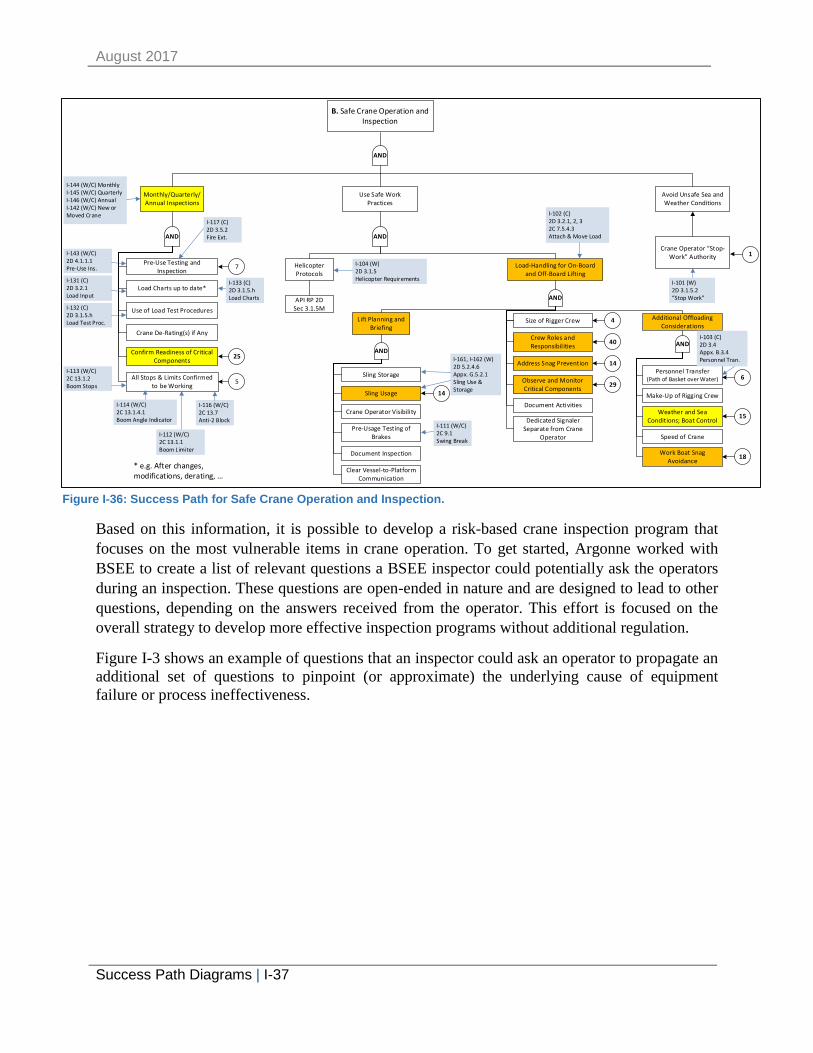
August 2017
Success Path Diagrams | I-37
B. Safe Crane Operation and Inspection
Monthly/Quarterly/Annual Inspections
Use Safe Work Practices
Avoid Unsafe Sea and Weather Conditions
AND
AND
Load Charts up to date*
Use of Load Test Procedures
Pre-Use Testing and Inspection
Crane Operator “Stop-Work” Authority
Helicopter Protocols
Load-Handling for On-Board and Off-Board Lifting
AND
Size of Rigger Crew
Crew Roles and Responsibil ities
Address Snag Prevention
Observe and Monitor Critical Components
Document Activities
Additional Offloading Considerations
AND
Personnel Transfer (Path of Basket over Water)
Make-Up of Rigging Crew
Weather and Sea Conditions; Boat Control
Speed of Crane
Work Boat Snag Avoidance
API RP 2D Sec 3.1.5M
AND
All Stops & Limits Confirmed to be Working
* e.g. After changes, modifications, derating, …
5
40
14
29
15
18
I-114 (W/C)2C 13.1.4.1 Boom Angle Indicator
I-112 (W/C)2C 13.1.1 Boom Limiter
I-116 (W/C)2C 13.7 Anti-2 Block
I-113 (W/C)2C 13.1.2 Boom Stops
I-104 (W)2D 3.1.5 Helicopter Requirements
I-102 (C)2D 3.2.1, 2, 32C 7.5.4.3 Attach & Move Load
I-101 (W)2D 3.1.5.2 “Stop Work”
I-103 (C)2D 3.4Appx. B.3.4 Personnel Tran.
4
1
6
Dedicated Signaler Separate from Crane
Operator
Crane De-Rating(s) if Any
I-133 (C)2D 3.1.5.h Load Charts
I-131 (C)2D 3.2.1 Load Input
I-132 (C)2D 3.1.5.h Load Test Proc.
7
I-143 (W/C)2D 4.1.1.1 Pre-Use Ins.
I-117 (C)2D 3.5.2 Fire Ext.
Confirm Readiness of Critical Components 25
Lift Planning and Briefing
AND
Sling Storage
Sling Usage
Crane Operator Visibility
Pre-Usage Testing of Brakes
Document Inspection
I-111 (W/C)2C 9.1 Swing Break
Clear Vessel-to-Platform Communication
14
I-161, I-162 (W)2D 5.2.4.6Appx. G.5.2.1 Sling Use & Storage
I-144 (W/C) MonthlyI-145 (W/C) QuarterlyI-146 (W/C) AnnualI-142 (W/C) New orMoved Crane
Figure I-36: Success Path for Safe Crane Operation and Inspection.
Based on this information, it is possible to develop a risk-based crane inspection program that focuses on the most vulnerable items in crane operation. To get started, Argonne worked with BSEE to create a list of relevant questions a BSEE inspector could potentially ask the operators during an inspection. These questions are open-ended in nature and are designed to lead to other questions, depending on the answers received from the operator. This effort is focused on the overall strategy to develop more effective inspection programs without additional regulation.
Figure I-3 shows an example of questions that an inspector could ask an operator to propagate an additional set of questions to pinpoint (or approximate) the underlying cause of equipment failure or process ineffectiveness.
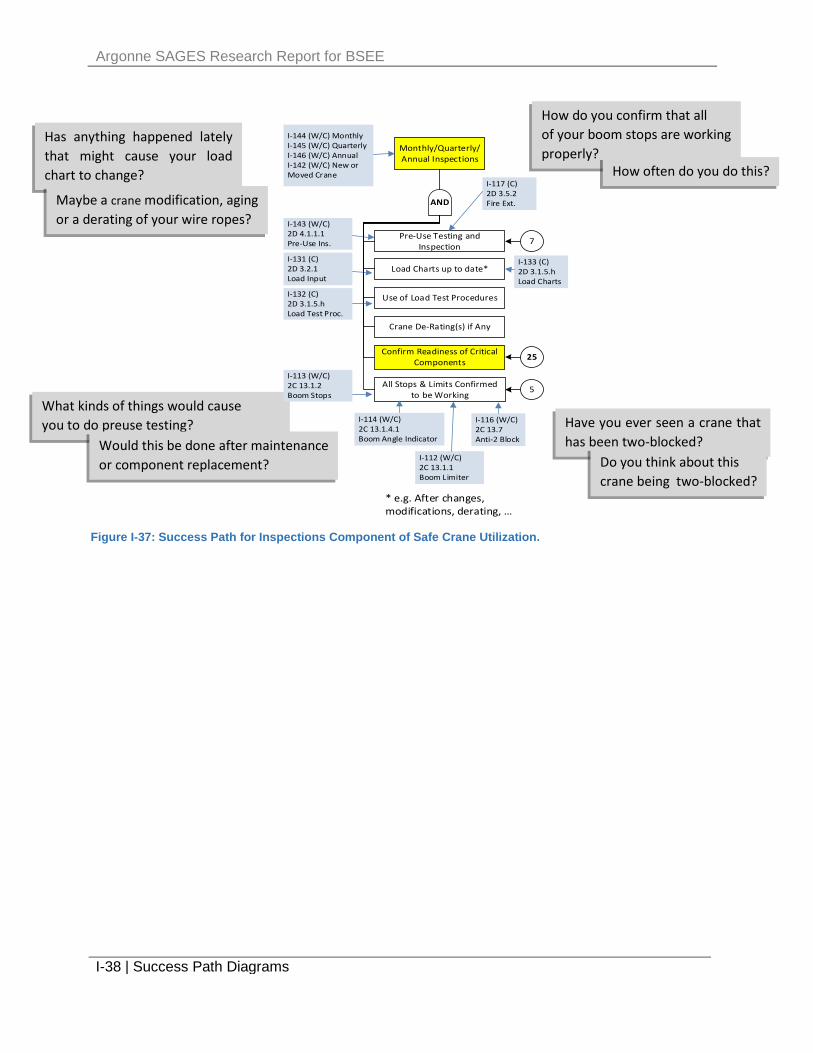
Argonne SAGES Research Report for BSEE
I-38 | Success Path Diagrams
Has anything happened lately that might cause your load chart to change?
What kinds of things would cause you to do preuse testing?
How do you confirm that all of your boom stops are working properly?
How often do you do this?
Have you ever seen a crane that has been two-blocked?
Do you think about this crane being two-blocked?
Would this be done after maintenance or component replacement?
Maybe a crane modification, aging or a derating of your wire ropes?
Monthly/Quarterly/Annual Inspections
AND
Load Charts up to date*
Use of Load Test Procedures
Pre-Use Testing and Inspection
All Stops & Limits Confirmed to be Working
* e.g. After changes,modifications, derating, …
5
I-114 (W/C)2C 13.1.4.1 Boom Angle Indicator
I-112 (W/C)2C 13.1.1 Boom Limiter
I-116 (W/C)2C 13.7 Anti-2 Block
I-113 (W/C)2C 13.1.2 Boom Stops
Crane De-Rating(s) if Any
I-133 (C)2D 3.1.5.h Load Charts
I-131 (C)2D 3.2.1 Load Input
I-132 (C)2D 3.1.5.h Load Test Proc.
7
I-143 (W/C)2D 4.1.1.1 Pre-Use Ins.
I-117 (C)2D 3.5.2 Fire Ext.
Confirm Readiness of Critical Components 25
I-144 (W/C) MonthlyI-145 (W/C) QuarterlyI-146 (W/C) AnnualI-142 (W/C) New orMoved Crane
Figure I-37: Success Path for Inspections Component of Safe Crane Utilization.
August 2017
Risk-Based Evaluation of Offshore Oil and Gas Operations | 39
About Argonne National Laboratory
Argonne is a U. S. Department of Energy laboratory managed by UChicago Argonne, LLC under contract DE-AC02-06CH11357. The Laboratory’s main facility is outside Chicago, at 9700 South Cass Avenue, Argonne, Illinois 60439. For information about Argonne and its pioneering science and technology programs, see www.anl.gov.
Disclaimer
This report was prepared as an account of work sponsored by an agency of the United States Government. Neither the United States Government nor any agency thereof, nor UChicago Argonne, LLC, nor any of their employees or officers, makes any warranty, express or implied, or assumes any legal liability or responsibility for the accuracy, completeness, or usefulness of any information, apparatus, product, or process disclosed, or represents that its use would not infringe privately owned rights. Reference herein to any specific commercial product, process, or service by trade name, trademark, manufacturer, or otherwise, does not necessarily constitute or imply its endorsement, recommendation, or favoring by the United States Government or any agency thereof. The views and opinions of document authors expressed herein do not necessarily state or reflect those of the United States Government or any agency thereof, Argonne National Laboratory, or UChicago Argonne, LLC.
Bureau of Safety and Environmental Enforcement and Argonne National Laboratory logos used with permission.

10/2/2017 Acrobat Accessibility Report
file:///Users/egevondyan/Desktop/170830_MPB_Report-Final-Correct-BSEE-logo%20(1).pdf.accreport.html 1/2
Filename:
Report created by:Organization:
Accessibility Report170830_MPB_ReportFinalCorrectBSEElogo (1).pdf
Gevondyan, ErnaArgonne National Laboratory
[Personal and organization information from the Preferences > Identity dialog.]
Summary
The checker found no problems in this document.
Needs manual check: 0Passed manually: 2Failed manually: 0Skipped: 1Passed: 29Failed: 0
Detailed Report
DocumentRule Name Status Description
Accessibility permissionflag Passed Accessibility permission flag must be set
Imageonly PDF Passed Document is not imageonly PDFTagged PDF Passed Document is tagged PDF
Logical Reading Order Passedmanually Document structure provides a logical reading order
Primary language Passed Text language is specifiedTitle Passed Document title is showing in title barBookmarks Passed Bookmarks are present in large documents
Color contrast Passedmanually Document has appropriate color contrast
Page ContentRule Name Status Description
Tagged content Passed All page content is taggedTagged annotations Passed All annotations are taggedTab order Passed Tab order is consistent with structure orderCharacter encoding Passed Reliable character encoding is providedTagged multimedia Passed All multimedia objects are taggedScreen flicker Passed Page will not cause screen flickerScripts Passed No inaccessible scriptsTimed responses Passed Page does not require timed responsesNavigation links Passed Navigation links are not repetitive
FormsRule Name Status Description
Tagged form fields Passed All form fields are taggedField descriptions Passed All form fields have description
Alternate TextRule Name Status Description
Figures alternate text Passed Figures require alternate textNested alternate text Passed Alternate text that will never be readAssociated with content Passed Alternate text must be associated with some contentHides annotation Passed Alternate text should not hide annotationOther elements alternatetext Passed Other elements that require alternate text

10/2/2017 Acrobat Accessibility Report
file:///Users/egevondyan/Desktop/170830_MPB_Report-Final-Correct-BSEE-logo%20(1).pdf.accreport.html 2/2
TablesRule Name Status Description
Rows Passed TR must be a child of Table, THead, TBody, or TFootTH and TD Passed TH and TD must be children of TRHeaders Passed Tables should have headers
Regularity Passed Tables must contain the same number of columns in each row and rows in eachcolumn
Summary Skipped Tables must have a summary
ListsRule Name Status Description
List items Passed LI must be a child of LLbl and LBody Passed Lbl and LBody must be children of LI
HeadingsRule Name Status Description
Appropriate nesting Passed Appropriate nesting
Back to Top

Annotations: Page 13: Modified reading order for in-text figure. Page 21: Modified reading order for in-text figure. Pages 28–33: Modified reading order for in-text figures. Page 35: Modified reading order for in-text figure. Page I-1: Modified reading order for in-text figure. Page I-6: Modified reading order for in-text figure. Page I-8: Modified reading order for in-text figure. Page I-15: Modified reading order for in-text figure. Pages I-21–I-22: Modified reading order for in-text figures. Pages I-36–I-37: Modified reading order for in-text figures.