risk assessment and validation in frozen food...
TRANSCRIPT

www.newfoodmagazine.com Issue 1 · 2014
Reducingthe total andsaturated fat of bakedgoods Charles Speirs, Bakery ScienceManager, Campden BRI
Why ISO 21469 is on the rise Ashlee Breitner, Business Unit Manager, NSF International
Riskassessment
and validationin frozen foodmanufacturing
Lilia M. Santiago-Connolly & RaghuRamaswamy, Heinz North America

Your Final Touch
Putting the cherry on your cake? That’s what Chocolate MastersTM
does best. Bring unique creations to life with our diverse and colorful
assortment of chocolate and marzipan decorations.
Discover how we add texture, taste and color to your masterpiece,
all with the finest Belgian chocolate!
Chocolate MastersTM is a brand of
Aalstersestraat 122 - 9280 Lebbeke-Wieze - Belgium De Ambachten 35 - 4881XZ Zundert - The Netherlands
[email protected] - www.chocolate-masters.com

Extra appealing touchBarry Callebaut introduces new andinnovative decoration products in answerto the latest market trends in food, byexpanding its product range with CakeCollars, Brazilian Pencils, Shiny Cocoa Nibsand Crispy Mignature™ range, enabling itscustomers to give their end products anextra finishing touch in the mostconvenient and easiest way.
Cake Collars – morepersonalization with the new marzipan bandsWith its recently launched Cake Collars,Barry Callebaut is responding to thepersonalisation trend: Today’s consumersare looking for products that are unique in
texture, colour and flavour. Cake Collars are flexible and adaptable marzipan bands.These smart, cost-effective and easy-to-use, decorative ribbons have both a newfresh looking design and can bepersonalized or tailor made.
Brazilian Pencils – bringing the2014 FIFA World Cup™ Brazil tothe chocolate worldThe market desire for unique, customised products while also taking intoconsideration customer’s limited time andbudget resources are also being answeredwith the launch of the limited editionBrazilian Pencils. These smart chocolatedecorations in the colours of the Brazilianflag are introduced on the occasion of Brazil hosting the 2014 FIFA World Cup™Brazil. The can be used to convenientlydecorate bakery, ice cream and desserts. In order to decorate smaller pastries suchas cupcakes, the pencils can be broken into smaller pieces.
Shiny cocoa nibs – adding aspecial indulgence momentBarry Callebaut also unmasks ‘VirtuousSimplicity’ as a clear consumer trend. This means that consumers, struck with a multitude of food choices, in the end like to choose natural, simple and healthy products. The shiny cocoa nibs,crunchy pieces of pure roasted and cocoakernels that are broken into smaller pieces,are a perfect example of such a product.Moreover, the shiny cocoa nibs have arefined and intense roasted taste and offer a pleasant, mild crunch. Their deepchocolate colour, and appealing shinychocolate gloss are most attractive. Cocoa nibs add a delicate taste and hand-made look to confectionery, desserts,pastries, ice cream coatings, breakfastcereals, cereal bars and can be baked into biscuits, rolls and breads.
Crispy Mignature™ – the perfecttool for “My Daily Luxury”The new Crispy Mignature™ range arecaramelised mini pieces of hazelnut,almond or nibs with a natural, roastedflavour and pleasant caramelly sweetness. In the spirit of the so called ‘My DailyLuxury’ consumer trend, Barry Callebautsucceeds to offer its customers a unique
multi-sensory experience tool they arelooking for. Indeed, there is an increasingdemand for top-notch quality, but also forpure enjoyment at the same time. TheCrispy Mignature™ range offers a 100%natural crunch in an appealing mini-size.They are ideal as one shot -inclusions inconfectionery and bakery applications as to add crunchiness in a filling or a dough in one go. On the other hand, they can alsoserve as a decoration, sprinkled onto softglazing, jelly or on chocolate. “By continuously looking for innovativeconvenient product solutions to serve
our customers’ needs, Barry Callebaut is keeping up to date with the latestconsumer market trends in food. The novelty chocolate decorations of Barry Callebaut are a great example of how market research is translated into convenient and smart customerproducts,” Sofie De Lathouwer, MarketingDirector FM Western Europe at BarryCallebaut concludes.
For more information: www.barry-callebaut.com
SURPRISING DECORATIONS:small extras for a BIG impactAl
l im
ages
© B
arry
Cal
leba
ut

Dairy madesimple.Life is complicated enough. So make
it simpler — with the new solutions for
process automation from Bürkert —
designed with the needs of the dairy
industry in mind, featuring a hygienic
design, easy cleaning and simple
operation. A complex automation task
can therefore become simplicity
itself in a matter of seconds.
Perfect for high process yields
and your peace of mind.
8681 control head:
A star in our system. It simply
keeps everything under control.
We make ideas flow.
www.burkert.com

As we look towards important issues for the food and beverage industry in 2014, we start with ourregular supplements on food safety and food grade lubricants. Francois Bourdichon, New FoodEditorial Board Member and Corporate Food Safety, Microbiology and Hygiene Manager at BarryCallebaut, looks at Listeria monocytogenes, questioning what we’ve learned about the pathogenand its effects over the past 30 years. While Listeria is responsible for fewer infections thanSalmonella or Campylobacter, its high mortality rates and higher hospitalisation rates ensure thatfood and beverage manufacturers have to be on alert to ensure that all foods are analysed toensure complete safety from the disease. In our other article, Lilia Santiago-Connolly and RaghuRamaswamy from Heinz North America look at the need for risk assessment and validation infrozen food manufacturing. While freezing slows down the growth of microorganisms in food, itdoes not necessarily inactivate them. The authors discuss the need for food manufacturers toensure that foods are safe from microorganisms that can prove dangerous to consumers prior to freezing. Please turn to page 17 for our in-depth look at food safety.
Ashlee Breitner, Business Unit Manager at NSF looks at ISO 21469 and how the recent uptakeof global food safety standards has prompted the food safety supply chain to implement morerigorous product safety measures and how ISO 21469: 2006 (E) affects food grade lubricantmanufacturers and users. Please turn to page 39 for our in-depth look at food grade lubricants.
As always, if you have any comments or would like to contribute an end-user article or submitnews, please contact me directly at [email protected]. In addition, don’t forget to joinour groups on LinkedIn and Twitter, details are opposite.
I N T R O D U C T I O N
www.newfoodmagazine.com 3 New Food, Volume 17, Issue 1, 2014
Join us on LinkedIn:http://linkd.in/NewFoodMag
Follow us on Twitter:http://twitter.com/NewFoodMag
Independent auditwatchdog service forprinted publications
Ian RussellFounder
Vivien Cotterill-LeeManaging Director
Helen BahiaEditor
Annie McKennaDeputy Editor
Karen HutchinsonSenior Publications Assistant
Tim DeanGroup Sales Director
Claire SingletonPublication Manager
Brian ClokeProduction Manager
Steve CrispFront Cover Artwork
Schedule
New Food is published bi-monthly (six times per annum) and is available bysubscription at £90.00 for a year which includeson-line membership access. Back issue copiescan be requested at £15.00 per copy.
Subscriptions
Subscription enquiries [email protected] or telephone +44 (0) 1959 563311
Publishers
New Food is published by: Russell Publishing Ltd, Court Lodge, Hogtrough Hill, Brasted, Kent, TN16 1NU, UKTelephone: +44 (0) 1959 563311 Fax: +44 (0) 1959 563123Email: [email protected]
Copyright
ISSN 1461 - 4642Copyright rests with the publishers.All rights reserved©2014 Russell Publishing LimitedRegistered Office as above.Russell Publishing Ltd, is registered as a Limited Company in England, Number 2709148 VAT Number GB 577 8978 47
Circulation
New Food can guarantee its circulationis 13,594 (for the six issues distributed between1 July 2012 to 30 June 2013). The publication isABC audited. This is an independent verificationthat our circulation is genuine.
Social Media
Printing by
Important issues in 2014■ Helen Bahia
Editor
No responsibility can be accepted by Russell Publishing Limited, the editor,staff or any contributors for action taken as a result of the information andother materials contained in our publications. Readers should take specificadvice when dealing with specific situations. In addition, the viewsexpressed in our publications by any contributor are not necessarily thoseof the editor, staff or Russell Publishing Ltd. As such, our publications arenot intended to amount to advice on which reliance should be placed. We therefore disclaim all liability and responsibility arising from anyreliance placed on such materials by any reader, or by anyone who may beinformed of any of its contents. Published March 2014
New Food is proud to be affiliated with EFFoST, The European Federation of Food Science & Technology, a non-profit association that federates food science and technology organisations in Europe. *Half price subscriptions to New Food are available to all EFFoST members. Contact Karen [email protected] for further details
Dr. John HolahHead, Food Hygiene Department, Campden BRI
Yasmine MotarjemiFood Safety Advisor
David AchesonPresident and CEO, The Acheson Group
Kata GalicFood Technology and Biotechnology, University of Zagreb
Karina BadalyanYerevan State University
Brian McKennaEmeritus Professor of Food Science, UCD
Huub LelieveldExecutive Committee, Global Harmonisation Initiative
Supriya VarmaScientist, Frito-Lay (PepsiCo)
François BourdichonCorporate Food Safety, Microbiologyand Hygiene Manager, Barry Callebaut
Dirk NikoleiskiProduction Protection & HygienicDesign KFE, Mondelez International
Lilia AhrnéDirector of Process and Technology Development, SIK
Huug de VriesDirector, IATE
The New Food Editorial Board
Supported by


3 INTRODUCTIONImportant issues in 2014Helen Bahia, Editor
6 EVENTS
7 NEWS
8 PACKAGINGNew research gives further insightson O2-ingress in food packagingPeter Ragaert & An Vermeulen, Pack4Food, Mieke Buntinx & Roos Peeters, Research group PackagingTechnology & VerpakkingsCentrum, University Hasselt
13 DAIRY PROCESSINGAdvanced microbial modellingtechniques and risk-basedmanagement applied to aseptic-UHT processLaure Pujol & Jeanne-Marie Membré, INRA, UMR1014 Secalim and LUNAM Université, Oniris
17 FOOD SAFETY SUPPLEMENTListeria monocytogenes: what havewe learned from the last 30 years?François Bourdichon, Corporate Food Safety, Microbiology and Hygiene Manager, Barry Callebaut
The need for risk assessment and validation in frozen food manufacturingLilia M. Santiago-Connolly, Group Leader of Food Safety & Raghu Ramaswamy, Thermal Process Authority, Heinz North America
28 FATS & OILSA novel approach to reducing the total and saturated fat content of baked goodsCharles Speirs, Bakery Science Manager, Campden BRI
31 SHOW PREVIEWFood Safety Summit
33 SUGAR REDUCTIONThe relevance of reducing sugar and sweetness in products intendedfor infants and young children Martine Alles, Director Developmental Physiology & Nutrition andSimone Eussen, Nutrition Scientist, Nutricia Research
36 ENROBINGEnrobing in the confectionery industryRamana Sundara, Ángel Máñez and Josélio Vieira, Nestlé Product Technology Centre
39 FOOD GRADE LUBRICANTSSUPPLEMENTISO 21469: Why this InternationalStandard is on the riseAshlee Breitner, Business Unit Manager, NSF International
Ensuring productivity: how foodgrade lubrication certificationprovides best practice
53 NEAR INFRAREDFood fraud and NIRSRob Frankhuizen, Scientist, State Institute for Quality Control ofAgricultural Products, RIKILT Wageningen University and ResearchCentre and Saskia van Ruth, Head of Authenticity & Novel FoodsBusiness Unit and Professor of Food Authenticity and Integrity,RIKILT Wageningen University and Research Centre
58 MASS SPECTROMETRYUnderstanding the dark side of food:the analysis of processed food bymodern mass spectrometryNikolai Kuhnert, School of Engineering and Science JacobsUniversity Bremen
64 SHOW PREVIEWanalytica
C o n t e n t s
www.newfoodmagazine.com 5 New Food, Volume 17, Issue 1, 2014

MARCH
World Food Technology & Innovation ForumDate: 3 – 4 March 2014Location: St. Paul’s, London, UKe: [email protected]: www.foodinnovate.com
Contamination Control SeminarDate: 4 March 2014Location: Chipping Campden, Gloucestershire, UKe: [email protected]: www.campdenbri.co.uk/contamination-control-seminar.php
4th Annual Food Manufacturing & Safety ForumDate: 10 – 11 March 2014Location: Dallas, Texas, USAe: [email protected] w: www.foodmanufacturingsummit.com
Foodex 2014Date: 24 – 26 March 2014Location: NEC Birmingham, UKe: [email protected]: http://www.foodex.co.uk
Food Structure andFunctionality ForumSymposium from Molecules to FunctionalityDate: 30 March – 2 April 2014Location: NH Grand Krasnapolsky,Amsterdam, The Netherlandsw: www.foodstructuresymposium.com
RME2014 – 9th conference onfood, feed & water analysisDate: 31 March – 2 April 2014Location: Noordwijkerhout, The Netherlandse: [email protected]: www.bastiaanse-communication.com/RME2014
APRIL
Food Technology andInnovation Forum 2014Date: 7 – 9 April 2014Location: Chicago, Il, USAe: [email protected]: www.thefoodsummit.com
15th Food Colloids ConferenceDate: 13 – 16 April 2014Location: AkademieHotel Am RüppurrerSchloß 40 76199 Karlsruhe, Germanye: [email protected]: www.ift.org
MAY
Seafood Expo GlobalDate: 6 – 8 May 2014Location: Brussels, Belgiume: [email protected]: www.seafoodexpo.com
Vitafoods Europe 2014Date: 6 – 8 May 2014Location: Geneva, Switzerlande: [email protected]: www.vitafoods.eu.com/lsnewfood
IAFP’s European Symposium on Food Safety 2014Date: 7 – 9 May 2014Location: Budapest, Hungarye: [email protected]: www.foodprotection.org/europeansymposium
XII International Conference on the Applications of MagneticResonance in Food Science:Defining Food by MagneticResonanceDate: 20 – 23 May 2014Location: Cesena, Italye: [email protected]: www.foodmr.org
3rd International ISEKI-Food ConferenceDate: 21 – 23 May 2014Location: Athens, Greecee: [email protected]: www.isekiconferences.com/athens2014
JUNE
15th Joint Fera/JIFSAN Annual Symposium: EmergingIssues in Food SafetyDate: 9 – 11 June 2014Location: The Food And EnvironmentResearch Agency, Sand Hutton, York, UKe: [email protected]: www.fera.co.uk/events/jifsan2014
Salt-Sugar-Lipids ReductionDate: 17 – 18 June 2014Location: Nantes, Francew: www.pleasure-fp7.com/conference/index.html
IFT Annual Meeting 2014Date: 21 – 24 June 2014Location: New Orleans, Lousianna, USAe: [email protected]: www.am-fe.ift.org/cms
10th EPRW – EuropeanPesticide Residue WorkshopDate: 30 June – 3 July 2014Location: Convention Centre, Dublin, Irelande: [email protected]: www.eprw2014.com
AUGUST
IAFP 2014Date: 3 – 6 August 2014Location: Indianapolis, Indianna, USAe: [email protected]: www.foodprotection.org/annualmeeting
IUFoST 17th World CongressDate: 17 – 21 August 2014Location: Montreal, Canadae: [email protected]: http://iufost2014.org
7th International Congress onBiocatalysis – biocat2014Date: 31 August – 4 September 2014Location: Hamburg, Germanyw: http://biocatconference.de
SEPTEMBER
Food Micro 2014Date: 1 – 4 September 2014Location: Nantes, Francew: www.foodmicro2014.org
7th International Whey ConferenceDate: 7 – 9 September 2014Location: Rotterdam, the Netherlandsw: http://www.iwc2014.com
E v e n t s
New Food, Volume 17, Issue 1, 2014 6 www.newfoodmagazine.com
If you have a diary event you wish to publicise, send details to
Martine Shirtcliff at:[email protected]

At-line NIR – DA 7250 SDThe DA 7250 SD NIR is designed for use in food production. Its stainless steel IP65
certified casing allows it to be placed anywhere, and the open analysis area and smooth
corners make it very easy to clean. Advanced diode array NIR technology provides
accurate analysis of moisture, protein, fat and more in only six seconds. All types of food
products are analysed with little or no sample preparation – meats, butter, cream, powders
and baked products are a few examples. Optional disposable cups completely remove the
need for cleaning between samples.
USDA Approved In-line NIR – DA 7300 SDThe DA 7300 continuously measures moisture, fat, protein and more in your process, in for
example pipes or chutes. It is officially approved by the USDA for measurement of meat
and dairy products, and has many additional food applications.
The analysis results are sent to a plant’s process control system for automatic plant
optimisation or are read out to a display screen for manual adjustment. The DA 7300
incorporates a real-time video camera with separate illumination for a unique view directly
into the process. The video can be viewed on a computer attached to the system’s network
– be it in the same building or thousands of miles away.
www.perten.com
Sanitary design NIR for food analysis
Designed specifically to provide validated,
performance qualified (PQ) and chemical-free UV
treatment of water in the food and beverage industries,
Hanovia’s PureLine PQ UV system takes disinfection
to another level.
The PureLine PQ has not only been designed to
exacting industry standards using the latest design
techniques to maximise performance, but its
disinfection performance has also been independently
tested and validated by Carollo Engineers in the USA
to the 2006 USEPA protocol following the UV
Disinfection Guidance Manual (UVDGM) guidelines.
It is approved to most international standards
and material certificates are available for all the
FDA-compliant wetted parts.
A revolutionary feature of the PureLine PQ is its
optimised, absolute intensity UV monitor. Located
within the chamber, it allows the controller to
automatically correct the dose calculation as UV
transmittance varies without the need for an external
UV transmittance monitor. In addition, the factory-
calibrated dry UV sensor provides absolute UV
intensity monitoring in real-time and, because it
remains outside the water flow, it can be removed and
inspected without interrupting the process. Its patented
shutter port means there is no risk of UV exposure and
no need for the operator to wear safety equipment while
performing the field verification. Watch our PureLine
PQ video on our YouTube Channel.
www.hanovia.com
PureLine PQ UVsystem fromHanovia specificallydesigned for foodand beverageapplications
Newsbites
HOW IMPORTANT ISWATER QUALITY FOR YOURPRODUCT? PROCESS?
REAL TIME UV DOSE DISPLAY ENSURESABSOLUTE PROCESS SECURITY:
> Independently validated – Performance Qualified (PQ)> Real time dose monitoring and control> Features that deliver on industry requirements> Security and consistency for your product> Non-chemical treatment of water or sugar syrup> Global service and spares support
MAINTAIN TASTE WITH COMPLETE UVDISINFECTION FROM THE WATER TO THE BOTTLE
T: +44 (0) 1753 515 300 E: [email protected] www.hanovia.com
UURRRRRRRRURPureLine PQ

A frequently used process in the food packaging industry isthermoforming. During thermoforming, an (inline) extruded sheet is heated to its softening temperature and subsequently deformedthrough application of mechanical stretching and/or pressure into a tray.This process directly impacts several properties of the sheet. One of theseproperties, especially in the case of food packaging under modified
atmosphere (MAP – Modified Atmosphere Packaging), is the oxygenpermeability. As a result of the increased surface area and thinning of thesheet, the OTR (Oxygen Transmission Rate) of the tray will be increased.However, various studies have shown that OTR values of the virginmaterial cannot easily be extrapolated to thermoformed packaging1-3.One of the reasons might be a poor control of the material thickness
Diversity in food packaging has become increasingly important in the last few decades due to different trends such asglobalisation and convenience. This has resulted in an increased need for certain barrier properties in order toguarantee the desired shelf-life of the packaged food product. In the case of gas barrier properties, many food productsneed to be protected from oxygen, on the one hand making this parameter very important in evaluating new materials(e.g. bioplastics) for food packaging applications and on the other hand, there is an increased attention forinvestigating the influence of different processing techniques on the barrier properties of packaging materials.
New research gives furtherinsights on O2-ingress infood packaging
New Food, Volume 17, Issue 1, 2014 8 www.newfoodmagazine.com
P A C K A G I N G
■ Peter Ragaert and An Vermeulen ■ Mieke Buntinx and Roos PeetersPack4Food Research Group Packaging Technology & VerpakkingsCentrum, University Hasselt
© K
ondo
r83
/ Shu
tter
stoc
k.co
m

HAS ITS
EVERYSTARTING
INNOVATION
POINT
PROCESSES AND PACKAGINGLEADING TRADE FAIR
DÜSSELDORF, GERMANY 08 –14 MAY 2014 INTERPACK.COM
Messe Düsseldorf GmbH
Postfach 101006 _ 40001 Düsseldorf _ Germany
Tel. +49(0)211/45 60-01 _ Fax +49(0)211/45 60-6 68
www.messe-duesseldorf.de
distribution in the walls, the corners and/or the bottom, which is a majordrawback of thermoforming. On the other hand, the effect of physicalthinning on the OTR can sometimes be counteracted by reorientation,closer chain packaging and restriction of chain mobility of amorphouspolymer chains during deep drawing or stretching of the material.Reorientation and crystallisation is known to be related to alteredsorption and diffusion of oxygen in polymer materials, and might cause adecrease of the OTR4.
Recently, the research groups Packaging Technology &VerpakkingsCentrum and Applied Analytical Chemistry of the Universityof Hasselt have conducted the Flanders’ FOOD MaProDe_Ox project incollaboration with companies from the Belgian food and packagingindustry. The aim was to evaluate and quantify the impact of thethermoforming process on the OTR of several selected commercialpackaging materials.
In this project, commercial sheet materials of monolayerpolypropylene (PP); PP/ethylene-vinyl alcohol co-polymer/PP(PP/EVOH/PP); polystyrene/EVOH/polyethylene (PS/EVOH/PE);amorphous polyethylene terephtalate/PE (APET/PE); and APET/PE/EVOH/PE were thermoformed into three trays with the same topdimension of 190x132 millimetres and variable depths of 25 and 50 millimetres (radius one millimetre), and a variable radius of fivemillimetres for the corners of the 50 millimetre tray (Figure 1). Thethickness of the sheets ranged between 350 and 400 µm. The EVOHcontent in the three multilayers was determined to be on average three
New Food, Volume 17, Issue 1, 2014
P A C K A G I N G
Figure 1: Each packaging material was deep drawn into 3 trays with topdimensions of 190x132 millimetres and variable depths of 25 millimetres, 50 millimetres and 50 m millimetres/r5 (round corners) (top to bottom)
Table 1: OTR of thermoformed trays expressed in [cc/package • day • atm] (n=2-3)
OTR Tray 25 mm Tray 50 mm Tray 50 mm
[cc/package • day • atm] radius 1 mm radius 5 mm radius 1 mm
PP 6.5 ± 0.4 9.3 ± 0.2 11.0 ± 0.5
APET/PE 0.52 ± 0.06 0.87 ± 0.01 0.97 ± 0.07
PP/EVOH/PP 0.067 ± 0.001 0.161 ± 0.002 0.152 ± 0.007
APET/PE/EVOH/PE 0.088 ± 0.019 not done 0.120 ± 0.005
PS/EVOH/PE 0.053 ± 0.007 not done 0.095 ± 0.010

per cent (the EVOH type used contained 32 mol% ethylene). Thethickness distribution after thermoforming into three different trays wasmeasured in detail and visualised showing the regions that were mostaffected by the deep drawn process for all test materials. Figure 2 showsan example of the 50 millimetre PP tray.
The oxygen transmission rate (OTR) of the sheets and the trays wasmeasured using a Mocon Ox-Tran 2/21 in accordance with ASTM F-1927and ASTM F-1307 respectively. The OTR of the trays increased with thedrawing depth (Table 1, page 9). Increasing the radius of the corners inthe 50 millimetres tray showed a beneficial effect on the OTR of PP andAPET/PE. This study also confirms the excellent oxygen barrier propertiesof EVOH. The results show that around three per cent EVOH in thedifferent multilayer materials is sufficient for deep drawing to depths of25 and 50 millimetres. The OTR of the PP/EVOH/PP, APET/PE/EVOH/PE
and PS/EVOH/PE sheets were in the same range (0.9-3.2 cc/m2.day.atm).The OTR of a 25 millimetre and 50 millimetre PP tray can be improvedwith a factor of 96 and 73 by the presence of an EVOH layer (around threeper cent) respectively. The OTR of the 25 millimetre and 50 millimetreAPET/PE/EVOH/PE trays was six and eight times better than therespective trays without an EVOH layer (Table 1, page 9).
More detailed results of this study indicate that the calculated OTRbased on a homogenous material distribution, can be used as a roughapproximation of the real OTR. However, detailed analysis of unequalthinning, orientation and crystallisation remains necessary to explain thedeviation of the measured OTR as compared to the predicted one.Certainly in the case of monolayer PP, there is potential for improvementof the OTR as compared to the predicted value, due to reorientation ofPP polymers during deep drawing.
The significance of the OTR values obtained in this study requires atranslation in terms of the oxygen level in the package that will finallydetermine the shelf-life of the product in a modified atmospherepackaging. The O2-concentration in the packaging is thereby determinedby (i) the residual O2 after packaging which is dependent on the filling-system and (ii) the O2 ingress during the shelf-life (OTR). On technicalsheets the OTRs are often mentioned at 20-25°C while a lot of packed
food products are stored in the cold chain. Therefore it is difficult toestimate the permeability of the packaging configuration under realisticstorage conditions. To fill these gaps the software PredOxyPack®(www.predoxypack.com) has been developed in collaboration withFood2Know based on previous results of a Flanders’ FOOD project. Thevalidation of this model was performed for monolayer and multilayerfilms and for the combination of bottles and caps, taking into accountdifferent temperatures. This validation is thoroughly discussed in Van Bree et al5.
PredOxyPack® allows the user to predict the oxygen ingress fordifferent packaging configuration, materials and time-temperatureprofiles. In this way, realistic estimations can be made for thecircumstances to which the food is exposed during its preservationincluding cold chain conditions. For the development of PredOxyPack®, a lot of attention is paid to the user-friendliness by among others (i) the incorporation of predefined packaging configuration for which theexchange surfaces and volumes are automatically calculated, (ii) the automatic unit conversions and (iii) a build-in permeabilitydatabase of different packaging materials with minimum, maximum anddefault values of OTRs. Besides, users can also choose a custompackaging (e.g. pouch).
Once the user has chosen the packaging configuration, thecomposition of the packaging material can be inserted for eachpackaging component separately. The software easily permits insertingor deleting an extra layer. Next to the polymer type, the user has toindicate the OTR, test thickness and test temperature of the polymer.These data can be either filled in by the user based on technical sheets orautomatically appear in the software based on a build-in database withdefault values for each polymer type. Finally the user has to fill in theactual layer thickness of the polymer in the multilayer. Based on thisinformation, the residual oxygen level after filling and the timetemperature profile to which the packed product is exposed duringfilling, transport and storage, the oxygen evolution in the package can be calculated.
The output screen of the software (Figure 3 and Figure 4, page 11)represents a graphical output of the simulations (% or ppm O2 in theheadspace as a function of time) together with the followed temperature
New Food, Volume 17, Issue 1, 2014 10 www.newfoodmagazine.com
P A C K A G I N G
Figure 2: Percentual thinning in bottom, walls and corners as a consequence of plug-assisted deep drawing the PP sheet into a tray with 50 millimetre depth (radius one millimetre)
Figure 3: PredOxyPack® output: % O2 as a function of time in the headspace of aPP or PET tray with PE/EVOH/PE top film stored for three days at 2°C followed byseven days at 4°C

profile. Next to this graph, a table with the summary of the input values ismentioned. This is important when a user wants to reopen previousperformed simulations.
PredOxyPack® is used by among others food business operators(FBO), converters, packaging designers. It can help FBO to make thetranslation from the oxygen permeability which is mentioned on atechnical sheet towards their specific packagedproduct during the reasonable foreseenconditions of storage e.g. within the cold chain.PredOxyPack® can give the FBO also a quickoutcome on the com parison of differentmaterials (based on the technical sheets)provided by one or different suppliers for the realistic conditions of theown packed product. With the software tool, the FBO can quicklycompare new, innovative packaging materials and make sure that therequired oxygen barrier can be achieved. Because of the various optionsregarding material choices, packaging design, time and temperaturecombinations, it is possible to explore in a first phase of the developmenta wide range of packaging options through the software tool withoutadditional costs of testing all the materials. Based on these outcomes,
the most promising concept could be analysed in a second phase withoxygen permeability measurements.
Regarding new upcoming materials, the build-in permeabilitydatabase of PredOxyPack® will be updated regularly. Recently, an IWT-funded research project at Ghent University in collaboration with different research institutes (University College Ghent,Verpakkingscentrum, Belgian Packaging Institute and the technologycentre of Flanders’ Plastic Vision) and 22 companies has been performedon the applicability of bioplastics for food packaging, including modifiedatmosphere packaging (MAP). Different packaging materials fromrenewable biobased resources were investigated for different propertiessuch as O2- and H2O-permeability (Table 2), mechanical properties andseal properties6. Table 2 shows a high diversity in properties between theinvestigated materials, indicating that different types of food productscan be packed, including those products that require a good O2- and/orH2O barrier. Furthermore, the obtained data in Table 2 are in the samerange of different conventional food packaging materials such as OPP,PET/PE, OPA/PE, from a technical point of view making the investigatedbioplastics valuable alternatives to those conventional materials.
The different materials have been subsequently tested in elaboratedstorage experiments with short (e.g. fresh red meat), middle-long (e.g.sliced meat products, grated cheese) and long shelf life food product(e.g. rice cakes). Tests with MAP-packaging of short and middle-long
shelf-life food products showed amongst others that the barrier properties of differentbioplastics were sufficient in order to maintainthe desired gas mixture during the completeshelf-life period inside the packaging. This shows that MAP-applications by using
bioplastics are possible. Therefore, these type of materials could also beconsidered as packaging materials for MAP-applications. It should be mentioned that the future use of bioplastics will depend, next to thetechnical performance, on the price evolution of these materials as wellas transparent waste management options.
P A C K A G I N G
www.newfoodmagazine.com 11 New Food, Volume 17, Issue 1, 2014
1. Crippa, A., Sydenstricker, T. H. D., Amico, S. C. (2008). Evaluation of Multilayer ThermoformedFilms for Food Packaging. Polymer-Plastics Technology and Engineering, 47 (10), 991-995
2. Pettersen M.K., Gällstedt M., Eie T. (2004a). Oxygen barrier properties of thermoformed traysmanufactured with different drawing methods and drawing depths. Packaging Technologyand Science, 17 (1), 43-52
3. Pettersen M.D., Nilsson A., Espedal A., Kohler A. (2004b). Prediction of oxygen transmission ratefor thermoformed trays. Packaging Technology and Science, 17(6), 321-332
4. Robertson, G.L., Orientation. In Food Packaging: Principles and Practice, 3th edition.Robertson, G.L. Food Packaging Environment, Hope Island, Australia, CRC press, 2012, 152-155.
5. Van Bree, I., De Meulenaer, B., Samapundo, S. Vermeulen, A., Ragaert, P., Maes, K.C., De Baets,B., Devlieghere, F. (2010). Innovative Food Science & Emerging Technologies, 11 (3), 511-519
6. Peelman, N., Ragaert, P., De Meulenaer, B., Adons, D., Peeters, R., Cardon, L., Van Impe, F.,Devlieghere, F. (2013). Review: Application of bioplastics for food packaging. DOI:10.1016/j.tifs.2013.06.003
References
• Flanders’ Food, Belgium. MaProDe_Ox project: Impact of Material, Process and Design on theOxygen Permeability of Thermoformed Packaging
• IWT (Institute for the Promotion of Innovation by Science and Technology in Flanders,Belgium) and 22 companies. IWT-CO 095062 Application of bioplastics for food packaging
• UGent. IOF10/StarTT/025. Development and commercialisation of a software package topredict the O2 ingress in packages for food products
Research described in this publication was supportedby grants from:
Figure 4: PredOxyPack® output: Summary of all input variables for theperformed simulations
Table 2: O2- and H2O-permeability of different bioplastics-packaging materials,measured on the actual thickness of the film/tray (from Peelman et al., 2013)
O2 H2O
(cc/m2.d) (g/m2.d) Thickness
Material (Tradename) 23°C – 75% RH 38°C – 90% RH (µm)
Natureflex™ type 1 9.9 10.1 55
Natureflex™ type 2 3.4 5.0 44
Ecoflex+Ecovio/Ecovio/Ecoflex+Ecovio 815.0 216.4 55
Metallised PLA 25.4 2.3 20
Cellophane™ /Metal/PLA 9.1 9.7 46
Paper/AlOx/PLA 45.7 6.0 91
Bioska (multilayer PLA) 617.6 275.1 34
Natureflex™ type 1/PLA 11.01 11.3 60
PHB/Ecoflex 142.1 80.6 87
Xylophane A (coated on paper) 3.7 24.3 100
PLA tray (Ingeo) 46.8* 3.8 200-300
* 50% RH inside; 0% RH outside; measured at 23°C
The future use of bioplastics will depend,next to the technical performance, on the
price evolution of these materials as well astransparent waste management options

GEA Process Engineering
GEA Process Engineering unites deep-rooted insight in food and dairy processing with technological edge to supply complete state-of-the-art process lines. A GEA Niro powder plant fulfills the strictest demands for food safety, product quality, plant efficiency and sustainable production.
That is how we have become the leading supplier of process technology to the dairy industry worldwide.
GEA Process Engineering A/SGladsaxevej 305, DK-2860 Soeborg, DenmarkTel: +45 39 54 54 54, Fax: +45 39 54 58 [email protected], www.gea.com
engineering for a better world
Complete Powder Plants for the Dairy Industry

Traditionally, this complex process has been run using deterministic orempirical process settings. To move towards science-based processsettings, risk of microbial contamination along the whole aseptic-UHTprocess must be quantified. That is now feasible due to modellingtechniques dedicated to the microbial contamination variationsencountered in the process, and also to the advanced probabilistictechniques enabling to take the inherent variability and uncertainty ofbiological processes into account. Such techniques offer the possibilityof improving on the currently tolerable commercial sterility failure rate(less than one defect per 10,000 units produced). In addition, benefits ofapplying a risk-based management system are: i) to implement processsettings in a transparent and scientific manner instead of empirically; ii) to develop a uniform common structure whatever the production line,leading to a harmonisation of these process settings, and; iii) to quantifythe impact of various management measures and weigh them againsttheir implementation cost.
The aseptic-UHT process is relatively complex but can be defined in three main phases based on the material and process flow (Figure 1, page 14)2. The first one is a ‘non-sterile’ phase, in which productingredients and packaging raw materials are received and sterilised. A UHT treatment is applied to the product, and thermal and / or chemicalsterilisation treatments are applied to the packaging. The second one isa phase where the product and packaging have to be ‘sterile’ andaseptically filled and sealed. This phase includes the most challengingsteps in terms of controlling contamination risk to the product sincebiofilm formation, air recontamination and defective sealing can occurand cause a significant number of product sterility failures. The lastphase encompasses the end product storage up to the consumer place.
Risk analysis is a systematic and comprehensive methodology toestimate the risk associated with a complex process3 and is split intothree pillars: microbial risk assessment (MRA), risk management, and risk
communication. For an aseptic-UHT food process with a commercialsterility target, the four steps of MRA can be defined as can be seen inFigure 12 on page 14. The hazard identification consists of identifyingmicrobiological agents capable of causing adverse health effects (for pathogens) or significant sensory deterioration of the product (for spoilage agents). The hazard characterisation is the evaluation of thenature of the adverse effect of pathogens (i.e. public health concern) and spoilage agents (i.e. spoilt product). The exposure assessmentconsists of the quantification of contamination along different pathwaysthrough the whole process up to consumption. Finally, the riskcharacterisation is the quantification of the risk in terms of public health(for pathogens) and the probability (‘risk’) to get a commercial sterilityfailure (for spoilage agents).
Modelling microbial variationsMathematical models enable the quantification of microbial variationsat each aseptic-UHT key process step – from raw materials reception upto end-product storage as illustrated in Figure 1 (page 14). The microbialvariations include reduction at the sterilisation step (for both productand packaging lines) and increase (due to growth or recontamination). In aseptic-UHT process, all contamination variations need to beconsidered due to the respect of the commercial sterility of the product,even if the probability of occurrence is very low.
The microbial reduction is due to the UHT treatment of the product, the sterilisation of the packaging or the cleaning procedures.The most commonly applied models in thermal treatment are the log-linear reduction, using the D and z concepts4. For packaging sterilisation,there are two processes which can be either coupled or separated5. Thefirst one consists of heat treating the packaging with saturated steam orwith a combination of super-heated steam and hot air; alternatively thepackaging can be heated by extrusion using a form-fill-seal packaging
Ultra High Temperature (UHT)-type products are ambient stable products, with a long shelf life (three to six months).Since they do not require any cold chain storage and can be consumed immediately, they are consumed extensivelyeverywhere on the globe. They are defined as commercially sterile meaning that the product “must be free ofmicroorganisms capable of growing under normal non-refrigerated conditions of storage1.” Basically, the challengein a UHT process is to fill a ‘sterile’ product in a ‘sterile’ container in order to achieve commercial sterility.
Advanced microbial modellingtechniques and risk-basedmanagement applied toaseptic-UHT process
www.newfoodmagazine.com 13 New Food, Volume 17, Issue 1, 2014
D A I R Y P R O C E S S I N G
■ Laure Pujol and Jeanne-Marie Membré INRA, UMR1014 Secalim and LUNAM Université, Oniris

system. The second process consists of applying a chemical treatment,either hydrogen peroxide or peracetic acid. Generally, the mathematicalmodels developed to predict the probability of surviving packagingsterilisation are based on a log-linear reduction pattern2,5. In aseptic-UHTlines, the cleaning procedures are generally split into three sequentialphases: i) Cleaning-In-Place (CIP), which is an application of a chemicalagent, either acid or alkaline; ii) Hot water rinsing applied to equipment
surfaces; or iii) Sterilisation-In-Place (SIP),which is the re-sterilisation of the line6. A fewmathematical models describe cleaningoperation exits7, but their implementation inMRA models is still at an early stage.
Concerning the microbial growth, inpredictive microbiology, primary modelsdescribe the log count variation over the timeand secondary models the effect of storagetemperature and product formulation (e.g. pH) on the lag and maximum growthrate8. In the case of growth after the heat-treatment process (e.g. storage in aseptictank), it is sensible to consider that only one,or a few, species of microorganism havesurvived or have been reintroduced and have the ability to grow in the product; in such a case, microbial interactions can beneglected. A simple primary model whichincludes the lag (relevant response whenconsidering thermally injured bacterialspores9) is the three phase linear model ofBuchanan et al.10. A large variety of secondarymodels have been developed over the years8.
However, for implementation in MRA models, often gamma-type modelsare preferred to polynomial models.
Recontamination is defined as the introduction of any micro -organism into the product after an inactivation step, namely post-process recontamination. Recontamination events in aseptic-UHT processes are a primary cause of product sterility failure, andtherefore processes modelling these events form a key part of any
New Food, Volume 17, Issue 1, 2014 14 www.newfoodmagazine.com
D A I R Y P R O C E S S I N G
Table 1: Examples of management options applied to an aseptic-UHT-type process in a risk-based framework. See Figure 3 for location in the process.
Contamination variation Management Option Labels Examples of management option
MC1 Sealing component specifications
Raw material: initial contamination MC2 Product container specifications
MC3 Product ingredient specifications
PC1 and PC2 log reduction with Peracetic acidlog reduction with H2O2
PrC3, PrC4 Choice of the packaging sterilisation agent
Microbial reduction PC3 log reduction targeted during the UHT treatment
PrC5 Sterilisation value, F0, targeted during the UHT treatment
PdC2 pH of the product
PC4, PC5 and PC6 log reduction after the cleaning procedure
PrC1 Time during which the packaging is left open on the line, empty, before sterilisation
PrC2, PrC10 Time of intermediate storage
PdC1, PrC3 pH of the product
Microbial increase
PrC6, PrC10 Number of valves
PrC7, PrC11, PrC14 Number of batches before running the cleaning procedure
PC7, PC8, PC9 Targeted filter efficiency expressed in log reduction
PrC8, PrC9, PrC12 Number of line sterilisations before changing the filters
PrC14 Time during which the container, filled with the product, is left open,i.e. time between filling and sealing
MC4 <1 in 10,000 defective after sterility test: Final product ✓ 6 ± 1 day at 55°C for thermophilic bacteria
✓ 10 ± 3 days at 30°C for mesophilic bacteria
Figure 1: Aseptic-UHT food process from the raw materials to the final end product storage and their possibleassociated microbial variations. Blue squares correspond to the initial contamination, green squares representthe microbial reduction and the red squares symbolise the possible microbial increase

aseptic-UHT MRA model11. An overview ofrecontamination models has been given inReij et al.12. Moreover, Den Aantrekker et al.13
have built a general recontamination modelframework, based upon a mass-balanceequation system: a contaminated source(liquid, equipment or floor) releases cells tothe intermediate phase (surface, hands or air)and then cells can be transferred to theproduct causing recontamination.
Advanced probabilistic techniquesThe aim of advanced probabilistic techniquesis to deal with the variability and uncertaintyinherent to biological processes14. Parameteruncertainty means uncertainty about thevalues of input variables, reflecting the lack ofinformation available to estimate these values(e.g. the transfer rate parameters in the massbalance equation for recontamination). Modeluncertainty also means uncertainty due to theapproximation by a functional form of a realphenomenon (e.g. the recontamination by thebiofilm formation). Variability differs fromuncertainty: variability refers to natural or non-controlled heterogeneitybetween individuals within a population addressed by risk assessment(e.g. D and z values among strains of thermotolerant B. cereus). It is notalways possible to separate entirely uncertainty and variability, althoughit is recommended to try as much as possible15. Increasingly often,probabilistic approaches (whole range of values and their probability ofoccurrence) are preferred to deterministic ones (single point estimate)and a large number of applications are available in the literature.However, a MRA model applied to a UHT-process line is complex;consequently it cannot be run analytically when a probabilistic approachis chosen. Therefore, numerical alternatives such as Monte Carlosimulation techniques are generally deployed. Bayesian inference isanother technique used in MRA: combined to a Markov Chain technique,it enables running / solving numerically a complex model. In Bayesianinference, the natural variability is often modelled by a parametricdistribution characterised by uncertain hyperparameters16.
Sensitivity analysis is widely used in MRA to: i) identify the mostinfluential variables on the model output; ii) provide a betterunderstanding and interpretation of the analysis; and iii) identify datagaps and then prioritise future research. Sensitivity analysis might alsobe seen as a prerequisite for model building, to test the robustness andthe relevance of the model17. The added value of sensitivity analysis ishighlighted in case of large and complex models. As mentioned by Pujolet al.2, with a MRA model applied to aseptic-UHT products, it might bedifficult to identify which model modules, and inside each of these, whichvariables, have the greatest impact on the commercial sterility failurerate. In addition, sensitivity analysis helps in identifying and eliminatingparticular inputs or components of the model which are not essential, i.e. in simplifying complex models on a rational basis15.
Risk-based frameworkThe food safety management is now shifting from a hazard-basedapproach to a risk-based approach. For pathogens, the new concepts ofAppropriate Level Of Protection (ALOP) and Food Safety Objective (FSO)have emerged18. FSO is defined as the maximum frequency and/orconcentration of a microbiological hazard in a food at the time ofconsumption that provides the appropriate level of health protection.Anderson et al.19 reported the historical approaches to establishingcommercial sterility and presented a perspective on the establishment ofa FSO for proteolytic Clostridium botulinum19. Other examples from theliterature are available in Pujol et al.2.
On the contrary, the link between the equivalent FSO and ALOP for aspoilage hazard has not been elaborated in the literature. As pointed outby Pujol et al.2, the task of building such a ‘link’ is greatly aggravated bythe almost infinite number of potential spoilage hazard agents capableof contaminating and growing within aseptic-UHT products.Nevertheless, the dose-response relationship which links ALOPs to FSOs
D A I R Y P R O C E S S I N G
www.newfoodmagazine.com 15 New Food, Volume 17, Issue 1, 2014
Figure 2: From the Food Safety Objective (FSO) and Performance Objective (PO)to the management options (Performance Criteria (PC), Product criteria (PdC),Process criteria (PrC) and Microbial Criteria (MC)), application to an schematicaseptic-UHT process. (Adapted from Pujol et al2)
Figure 3: Aseptic-UHT food process and its possible management options (the corresponding managementoptions are detailed in Table 1 opposite)

for pathogen hazards has a counterpart in the consumer complaint andsterility failure rate targeted for spoilage hazards: a targeted sterilityfailure rate theoretically can be related by a food company through a measure of consumer satisfaction (e.g. consumer complaint rates).
Within the risk-based food safety management metrics, thePerformance Objective (PO) is directly related to the FSO but is set at astep before the time of consumption (e.g. at the point of product releaseat the end of the manufacture) (Figure 2, page 15). Modelling the effect ofa heat treatment step on food product post-processed contaminationand making a link with the compliance to a PO or FSO has beendescribed in the literature19-24. However, often, to be operational FSOsand POs must be translated into criteria that can be controlled andmeasured in the food supply chain such as Performance Criteria (PC),Process Criteria (PrC) or Product Criteria (PdC) (Figure 3, page 15). A PC isthe effect required of one or more control measure(s) working in concertto meet a PO. In an aseptic-UHT process line, the air filter efficiency couldbe translated to a PC25. Likewise, the efficiency of the complete cleaningprocedure could be set as a PC to control and reduce when necessary thecontamination risk. More examples of PCs are provided in Table 1(page 14) and illustrated in Figure 3 (page 15). PrC and PdC are thecontrol parameters at a step or combination of steps that can be appliedto achieve a targeted reduction or the desired limitation on growth andcontamination, i.e. to achieve a PC. The type of the packagingsterilisation agent in a UHT-line could be set as a PrC. The complexity ofthe line (pipe length, number of valves, etc.) could be expressed inquantitative terms and then translated into PrCs; the pH of the product set as a PdC; the temperature and the time of storage set as PrCs(Table 1, page 14 and Figure 3, page 15). Once defined, PrC and PdC canbe translated as Critical Control Points or Operational Pre-requisite Plans in a HACCP plan26.
Beside control measures, Microbial Criteria (MC) are commonly used in food industry. In the near future, as food safety managementmoves towards risk-based food management, food producers will need to provide evidence that their foods at the moment they are eaten, comply with an FSO27. For C. botulinum, an example of an FSO might be less than one product unit contaminated per 106 or 109 units19. Setting MC to assess such low occurrences is not realistic.However, MC might be valuable tools to assess the microbial quality(food spoilage) along the entire aseptic-UHT product process, i.e. to assess the compliance with POs set at various critical processsteps: raw materials, mix blends pre-UHT, product units after filling, etc.(Table 1, page 14).
New Food, Volume 17, Issue 1, 2014 16 www.newfoodmagazine.com
D A I R Y P R O C E S S I N G
1. Codex Alimentarius Commission. (1993). Recommended international code of hygienic practicefor low and acidified low acid canned food. CAC/RCP 23-1979
2. Pujol, L., I. Albert, N. B. Johnson, and J.-M. Membré. (2013). Potential application of quantitativemicrobiological risk assessment techniques to an aseptic-UHT process in the food industry.International Journal of Food Microbiology. 162:283-296.
3. World Health Organisation and Food Agricultural Organisation. (1995). Application of riskanalysis to food standards issues, Report of the joint FAO/WHO Expert Consultation. Available at:http://www.who.int/foodsafety/publications/micro/en/march1995.pdf. Date last accessed: 26thof November 2013
4. Bean, D., F. Bourdichon, D. Bresnahan, A. Davies, A. Geeraerd, T. Jackson, J.-M. Membré, B.Pourkomailian, P. Richardson, M. Stringer, M. Uyttendaele, and M. Zwietering (2012). Riskassesment approaches to setting thermal processes in food manufacture, ILSI Europe (Ed.), 1sted., Brussels, Belgium
5. Ansari, I. A., and A. K. Datta. (2003). An overview of sterilization methods for packaging materialsused in aseptic packaging systems. Food and Bioproducts Processing. 81:57-65
6. Davey, K. R., S. Chandrakash, and B. K. O'Neill. (2013). A new risk analysis of Clean-In-Place milkprocessing. Food Control. 29:248-253
7. Lelièvre, C., G. Antonini, C. Faille, and T. Bénézech. (2002). Cleaning-in-place: modelling ofcleaning kinetics of pipes soiled by Bacillus spores assuming a process combining removal anddeposition. Food and Bioproducts Processing. 80:305-311
8. McKellar, R. C., and X. Lu (2004). Modeling microbial responses in food, R. C. McKellar and X. Lu(Ed.), 1st ed. CRC Press, New York
9. Daelman, J., A. Sharma, A. Vermeulen, M. Uyttendaele, F. Devlieghere, and J.-M. Membré. (2013).Development of a time-to-detect growth model for heat-treated Bacillus cereus spores.International Journal of Food Microbiology. 165:231-240
10. Buchanan, R. L., R. C. Whiting, and W. C. Damert. (1997). When is simple good enough: acomparison of the Gompertz, Baranyi, and three-phase linear models for fitting bacterial growthcurves. Food Microbiology. 14:313-326
11. Agalloco, J., J. Akers, and R. Madsen. (2004). Aseptic processing: a review of current industrypractice. Pharmaceutical Technology. 126-150
12. Reij, M. W., E. D. Den Aantrekker, and ILSI Europe Risk Analysis in Microbiology Task Force. (2004).Recontamination as a source of pathogens in processed foods. International Journal of FoodMicrobiology. 91:1-11
13. Den Aantrekker, E. D., R. M. Boom, M. H. Zwietering, and M. van Schothorst. (2003). Quantifyingrecontamination through factory environments – a review. International Journal of FoodMicrobiology. 80:117-130
14. Thompson, K. M. (2002). Variability and uncertainty meet risk management and riskcommunication. Risk Analysis. 22:647-654
15. Mokhtari, A., and H. C. Frey. (2005). Recommended practice regarding selection of sensitivityanalysis methods applied to microbial food safety process risk models. Human and EcologicalRisk Assessment: An International Journal. 11:591-605
16. Delignette-Muller, M. L., M. Cornu, R. Pouillot, and J. B. Denis. (2006). Use of Bayesian modelling inrisk assessment: application to growth of Listeria monocytogenes and food flora in cold-smokedsalmon. International Journal of Food Microbiology. 106:195-208
17. Saltelli, A. (2002). Sensitivity analysis for importance assessment. Risk Analysis. 22:579-590.18. International Commission on Microbial Specification for Foods (2002). Microorganism in foods 7:
Microbial testing in food safety management, ICMSF (Ed.), 1st ed. Kluwer Academic and PlenumPublishers, New York
19. Anderson, N. M., J. W. Larkin, M. B. Cole, G. E. Skinner, R. C. Whiting, L. G. Gorris, A. Rodriguez, R.Buchanan, C. M. Stewart, J. H. Hanlin, L. Keener, and P. A. Hall. (2011). Food Safety Objectiveapproach for controlling Clostridium botulinum growth and toxin production in commerciallysterile foods. Journal of Food Protection. 74:1956-1989
20. Membré, J.-M., (2012). Setting of thermal processes in a context of food safety objectives (FSOs)and related concepts. In: V. Valdramidis and J. F. M. Van Impe (Ed.), Progress on QuantitativeApproaches of Thermal Food Processing, 1st ed. Nova Science Publishers, New York, 297-326.
21. Cerf, O., and K. R. Davey. (2001). An explanation of non-sterile (leaky) milk packs in well-operatedUHT plant. Food and Bioproducts Processing. 79:219-222
22. Malakar, P. K., G. C. Barker, and M. W. Peck. (2011). Quantitative risk assessment for hazards thatarise from non-proteolytic Clostridium botulinum in minimally processed chilled dairy-basedfoods. Food Microbiology. 28:321-330
23. Membré, J. M., J. Bassett, and L. G. M. Gorris. (2007). Applying the Food Safety Objective andrelated standards to thermal inactivation of Salmonella in poultry meat. Journal of FoodProtection. 70:2036-2044
24. Sosa Mejia, Z., R. R. Beumer, and M. H. Zwietering. (2011). Risk evaluation and management toreaching a suggsted FSO in a steam meal. Food Microbiology. 28:631-638
25. Anonymous (2005). Guidelines on air quality standards for the food industry (2nd edition), K. L.Brown (Ed.), 1st ed. Campden & Chorleywood Food Research Association Group, ChippingCampden, UK
26. Membré, J.-M., (2014). HAZARD APPRAISAL (HACCP) | Establishment of performance criteria. In: C.Batt and M.-L. Tortorello (Ed.), Encyclopedia of Food Microbiology, 2nd ed. Elsevier, Amsterdam
27. van Schothorst, M., M. H. Zwietering, T. Ross, R. L. Buchanan, and M. B. Cole. (2009). Relatingmicrobiological criteria to Food Safety Objectives and Performance Objectives. Food Control.20:967-979
References
Jeanne-Marie Membré has a diploma in Food Engineering anda PhD in Food Microbiology and has worked in both academiaand industry. In 1989, she joined the French National Institutefor Agricultural Research (INRA) of Villeneuve d’Ascq, France,where she was in charge of the predictive microbiologyresearch programme. From 2003 to 2009, she worked at theSafety & Environmental Assurance Centre of Unilever, inBedford, UK, where she developed predictive models and exposure assessmentmodels for a wide range of food applications. Since 2010, she has been workingin INRA of Nantes, France. Jeanne-Marie is currently the leader of theMicrobiological Risk Assessment in Food Group at the UMR1014 Secalim. She isinvolved in a large number of research projects but also in educationalprogramme such as the Erasmus Intensive Programme Predictive Modelling andRisk Assessment. Her experience encompasses predictive microbiology,microbial risk assessment, applied statistics and food safety. Jeanne-Marie haspublished more than 50 articles in peer-reviewed journals, is a member of theInternational Association of Food Protection, belongs to the scientific board ofJournal of Food Protection and is expert at ILSI-Europe.
About the Author

SUPPLEMENT
Food Safety
SPONSORS
www.newfoodmagazine.com 17 New Food, Volume 17, Issue 1, 2014
19 Listeriamonocytogenes: what have we learnedfrom the last 30 years?François Bourdichon, Corporate Food Safety,Microbiology and Hygiene Manager, Barry Callebaut
24 The need for riskassessment andvalidation in frozenfood manufacturingLilia M. Santiago-Connolly, Group Leader of Food Safety & Raghu Ramaswamy, Thermal Process Authority, Heinz North America
© v
illor
ejo
/ Shu
tter
stoc
k.co
m

Calculate your exposure with the NOVISM Product Recall Cost Estimator. Only from AIG.A single contaminated ingredient can cost you millions of dollars in product withdrawal and replacement, business interruption, loss of reputation, and loss of earnings. But understanding your risk ahead of time can help you minimize the impact. Our NOVI Product Recall Cost Estimator boils down your potential risk exposure to a single number. So that you can make informed decisions to protect your customers, your supply chain, and your bottom line. To ask for a free and confidential cost estimator, go to www.AIG.com/us/novi
One of these could cost you $20 million.
Services provided by member companies of American International Group, Inc. For additional information, please visit our website at www.AIG.com.

© D
TKU
TOO
/ Sh
utte
rsto
ck.c
om
In the past 30 years, L. monocytogenes has been recognised as a majorfoodborne pathogen, responsible for fewer infections than Salmonellaspp. or Campylobacter spp., but with the highest hospitalisation rate (90 per cent), as well as high mortality rate. Approximately 2,500 illnessesand 500 deaths are attributed to listeriosis in the United States annually.In Europe, the rate of listeriosis ranges from two to six cases per million,depending on the reporting countries and it is still increasing mainly with the elderly and immunocompromised people. Although many tests are done by the food industry to search for the bacteria in foodsamples, a significant increase has been observed in developingcountries since 2003.
Since the coleslaw outbreak of 1981, L. monocytogenes is consideredto be one of the major foodborne pathogens, not because of a high
prevalence in foods, but due to the high morbidity / mortality of thedisease listeriosis that it can cause7.
Following the risk assessment performed by The Joint FAO/WHOExpert Meetings on Microbiological Risk Assessment (JEMRA) on L. monocytogenes9, guidelines were published by the Codex Committeeon Food Hygiene and defining microbiological criteria in Ready to Eat(RTE) foods depending on the growth potential of L. monocytogenes2.
Following the publication of these guidelines, Codex member states have updated their regulations accordingly4,12. Health Canada’srecently published guidelines6 are aligned on the proposed rationale,while the USDA-FDA published another approach of ‘zero tolerance’ of L. monocytogenes in RTE foods14, although the classification versusgrowth potential was considered in their prior risk assessment13.
Listeriosis is a foodborne disease caused by the facultative intracellular pathogen Listeria monocytogenes. The bacterium was first described in 1926 in laboratory rabbit zoonosis by Everitt G.D. Murray, and remainedunderreported for almost 60 years. It used to be considered as a scientific laboratory tool for cellular motilitymechanisms, until 1981 when it was reported for the first time in a foodborne outbreak in coleslaw (Nova Scotia,Canada, 1981).
Listeria monocytogenes:what have we learned from the last 30 years?
F O O D S A F E T YS U P P L E M E N T
www.newfoodmagazine.com 19 New Food, Volume 17, Issue 1, 2014
■ François Bourdichon Corporate Food Safety, Microbiology and Hygiene Manager, Barry Callebaut

The rise of a pathogenAs listeriosis is now recognised to be almost exclusively foodborne, asstated by the risk assessment approach proposed by ILSI7 and the WorldHealth Organization9, industrial food manufacturers must exhibit: “goodmanufacturing practices, sanitation standard operating procedures, andhazard analysis critical control point programs to minimiseenvironmental L. monocytogenes contamination and to prevent crosscontamination in processing plants and at retail.”
Listeria being a ubiquitous microorganism, safety of the end-productcannot be guaranteed solely by the analysis of food samples, but also
requires a specific assessment of environmental contamination. Resultsof environmental samplings of Listeria spp. and L. monocytogenes overthe last 25 years have taught two main lessons to the food industry:firstly, the prevalence of the Listeria genus is higher than themonocytogenes species alone, L. innocua having the highest occurrence.And secondly, that L. monocytogenes exhibits a high interspeciesvariability, with persistent strains which can stay in a plant for years, andtransient strains which do not colonise the environment.
Molecular typing is a very good tool for tracking the contaminationpathways of L. monocytogenes at a plant. But not all food industrymanufacturers can go through this costly inspection3.
Searching for the whole genus gives higher efficiency at a lower cost,or even a gain of time depending on the method chosen. L. innocua,considered to be the genetic ancestor of the genus, is a better ecologicalcompetitor than L. monocytogenes ½ (a, b or c) and 4b. During theanalytical enrichment procedure, the growth of L. innocua can overcome
the growth of L. monocytogenes, leading to a false negative if one is onlysearching for the monocytogenes species. Depending to the type of food industry, the innocua versus monocytogenes ratio can vary from one to the third to one to the tenth. Searching for Listeria spp. can better confirmthe relevance of zoning and the critical points identified by HACCP plan,in order to prevent contamination with L. monocytogenes, thereforegiving better food safety assurance to the food business operator.
TaxonomyThe genus Listeria currently comprises 10 species: L. fleischmannii, L. grayi, L. innocua, L. ivanovii, L. marthii, L. monocytogenes, L. rocourtiae,L. seeligeri, L. weihenstephanensis and L. welshimeri.
Cases of human listeriosis are almost exclusively caused by thespecies L. monocytogenes. Although some rare cases in patients withunderlying diseases have been reported, L. ivanovii and L. seeligeri arenot considered to be a foodborne hazard.
Ecology of Listeria spp.L. monocytogenes tolerates harsh conditions and may therefore surviveor grow in different types of foods. The organism can grow in lowtemperatures (-1.5 to 45°C) and in a wide pH range (4.3 to 9.1). It can alsogrow in salt concentrations of up to 10 to 14 per cent and tolerates lowwater activity (Table 1).
L. monocytogenes can be found in a large variety of habitatsincluding soil, vegetation, silage, sewage, water and faeces of healthyanimals and humans. It is frequently present in foods of animal and plantorigin and can become endemic in food processing environments. It mayalso be present in cooked foods as a result of post-processcontamination or inadequate heat treatment8,10.
Pathogenesis of L. monocytogenesListeria invasive diseases have been described in more than 40 animalspecies. The mechanism is very conservative and generally leads to abortion, septicaemia, meningitis and encephalitis, as well as some reported cases of diarrhoea, skin infections and endocarditis.Thirteen serotypes have been identified for L. monocytogenes. All of thesemay be associated with human listeriosis; however, most humaninfection is associated with the serotypes 1/2a, 1/2b or 4b, with ahospitalisation rate of over 90 per cent and a death rate of 20 – 30 per cent of those infected5,11.
Two types of disease are associated with L. monocytogenes: non-invasive or invasive listeriosis. Non-invasive listeriosis (referred to asfebrile listerial gastroenteritis) is the milder form of the disease.Symptoms include diarrhoea, fever, headache and myalgia (musclepain). Symptoms occur after a short incubation period. Outbreaks of this
New Food, Volume 17, Issue 1, 2014 20 www.newfoodmagazine.com
F O O D S A F E T YS U P P L E M E N T
Table 1: Commonly accepted cardinal values of growth characteristic of L. monocytogenes
Min. Opt. Max.
Temperature (°C) - 0.4 30-37 45
pH 4.0 7.1 9.6
0.90 (glycerol) / /
aw 0.92 (NaCl) / /
0.93 (Saccharose) / /
© v
illor
ejo
/ Shu
tter
stoc
k.co
m

waters.com
©2014 Waters Corporation. Waters and The Science of What’s Possible are registered trademarks of Waters Corporation.
Pharmaceutical & Life Sciences | Food | Environmental | Clinical | Chemical Materials
Laboratories that make Waters an essential part of their food and
beverage testing process always know what they’re getting. Innovative
technologies that deliver safe, quality products more efficiently
and cost effectively. Attribute it to a 50-year focus on innovation
and a commitment to helping laboratories in every way.
Analytically, scientifically, operationally. In the end, it’s
all about stocking shelves around the globe with food and
beverages that taste great every time. To discover what’s
possible in your world, visit waters.com/food.
All the ingredients for the safest, highest quality food and beverages.
disease have generally involved the ingestion of high doses of L. monocytogenes by otherwise healthy individuals.
Immunocompromised persons, the elderly, pregnant women andneonates have the highest risk of infection because of their weakenedimmune system. This disease is characterised not only by the severity ofthe symptoms but also by a high mortality rate.
Healthy adults and children occasionally get infected with L. monocytogenes, but they rarely become seriously ill. Individuals whosecell-mediated immunity is suppressed are more susceptible to thedevastating effects of listeriosis. Pregnant women naturally have adepressed cell-mediated immune system and in addition, the systems offoeti and newborns are very immature and are extremely susceptible tothese types of infections. Other adults, especially transplant recipientsand lymphoma patients, are given necessary therapies with the specificintent of depressing T-cells, and these individuals become especiallysusceptible to L. monocytogenes as well.
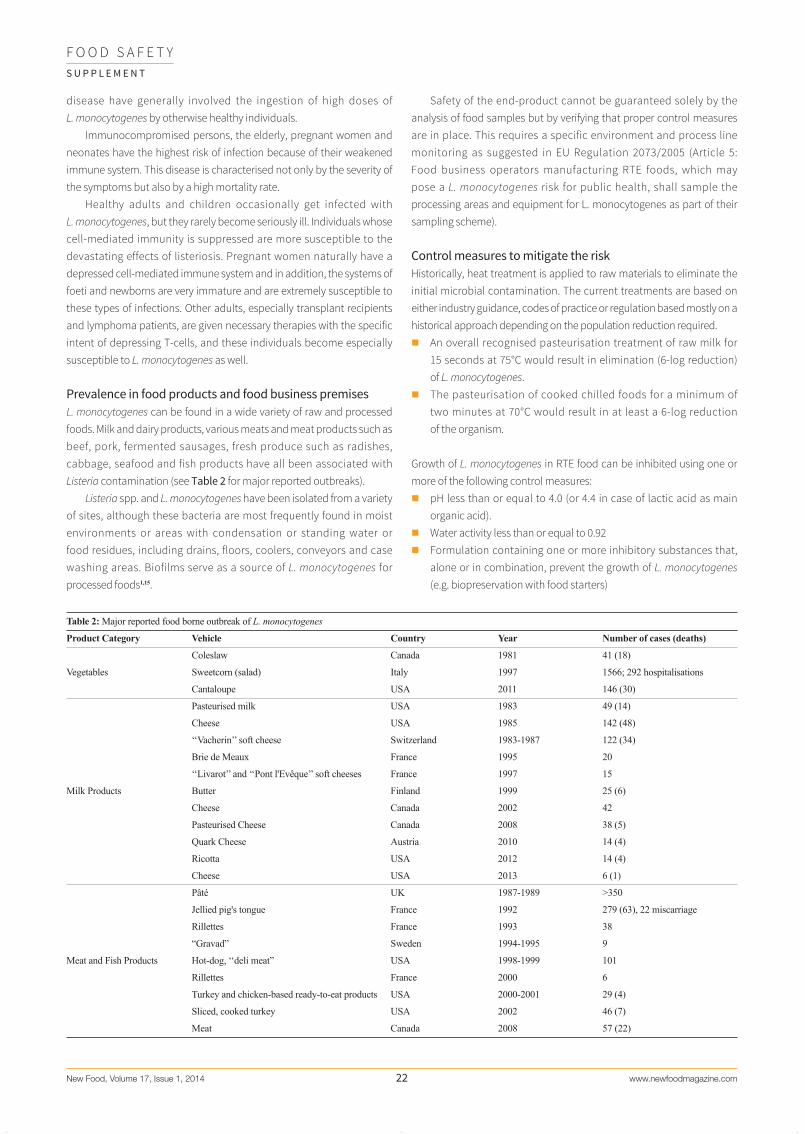
Prevalence in food products and food business premisesL. monocytogenes can be found in a wide variety of raw and processedfoods. Milk and dairy products, various meats and meat products such asbeef, pork, fermented sausages, fresh produce such as radishes,cabbage, seafood and fish products have all been associated withListeria contamination (see Table 2 for major reported outbreaks).
Listeria spp. and L. monocytogenes have been isolated from a varietyof sites, although these bacteria are most frequently found in moistenvironments or areas with condensation or standing water or food residues, including drains, floors, coolers, conveyors and casewashing areas. Biofilms serve as a source of L. monocytogenes forprocessed foods1,15.
Safety of the end-product cannot be guaranteed solely by theanalysis of food samples but by verifying that proper control measuresare in place. This requires a specific environment and process linemonitoring as suggested in EU Regulation 2073/2005 (Article 5: Food business operators manufacturing RTE foods, which may pose a L. monocytogenes risk for public health, shall sample theprocessing areas and equipment for L. monocytogenes as part of theirsampling scheme).
Control measures to mitigate the riskHistorically, heat treatment is applied to raw materials to eliminate theinitial microbial contamination. The current treatments are based oneither industry guidance, codes of practice or regulation based mostly on ahistorical approach depending on the population reduction required.� An overall recognised pasteurisation treatment of raw milk for
15 seconds at 75°C would result in elimination (6-log reduction) of L. monocytogenes.
� The pasteurisation of cooked chilled foods for a minimum of two minutes at 70°C would result in at least a 6-log reduction of the organism.
Growth of L. monocytogenes in RTE food can be inhibited using one ormore of the following control measures:� pH less than or equal to 4.0 (or 4.4 in case of lactic acid as main
organic acid).� Water activity less than or equal to 0.92� Formulation containing one or more inhibitory substances that,
alone or in combination, prevent the growth of L. monocytogenes(e.g. biopreservation with food starters)
New Food, Volume 17, Issue 1, 2014 22 www.newfoodmagazine.com
F O O D S A F E T YS U P P L E M E N T
Table 2: Major reported food borne outbreak of L. monocytogenes
Product Category Vehicle Country Year Number of cases (deaths)
Coleslaw Canada 1981 41 (18)
Vegetables Sweetcorn (salad) Italy 1997 1566; 292 hospitalisations
Cantaloupe USA 2011 146 (30)
Pasteurised milk USA 1983 49 (14)
Cheese USA 1985 142 (48)
‘‘Vacherin’’ soft cheese Switzerland 1983-1987 122 (34)
Brie de Meaux France 1995 20
‘‘Livarot’’ and ‘‘Pont l'Evêque’’ soft cheeses France 1997 15
Milk Products Butter Finland 1999 25 (6)
Cheese Canada 2002 42
Pasteurised Cheese Canada 2008 38 (5)
Quark Cheese Austria 2010 14 (4)
Ricotta USA 2012 14 (4)
Cheese USA 2013 6 (1)
Pâté UK 1987-1989 >350
Jellied pig's tongue France 1992 279 (63), 22 miscarriage
Rillettes France 1993 38
“Gravad” Sweden 1994-1995 9
Meat and Fish Products Hot-dog, ‘‘deli meat” USA 1998-1999 101
Rillettes France 2000 6
Turkey and chicken-based ready-to-eat products USA 2000-2001 29 (4)
Sliced, cooked turkey USA 2002 46 (7)
Meat Canada 2008 57 (22)

� Strict maintenance of cold chain� Prevention of cross-contamination (GMP) and re-contamination
(GHP) of heat treated food products.
Non-food contact surfaces (FCS) contamination with Listeria spp.,including L. monocytogenes, usually precedes FCS contamination.
Testing for Listeria spp. and reacting to positive results as if they wereL. monocytogenes provides for a more sensitive and broader verificationand control program, than would testing for L. monocytogenes alone,most particularly considering the expected very low prevalence of thispathogen in the food processing environment.
While the environmental monitoring program in dry area is focusedon Salmonella spp. with Enterobacteriaceae as hygiene indicators, themonitoring of Listeria spp. should be focused on the wet zones of the environment, e.g. the cleaning station, water condensates, anddrains if any1,15.
Regulatory statusDifferent microbiological criteria apply considering the categories of food products:� RTE foods in which growth of L. monocytogenes will not occur� RTE foods in which growth of L. monocytogenes can occur.
For RTE foods in which growth will not occur, rejection level is set at 100 colony-forming units per gram of the products in five samples. In RTE foods in which growth can occur, absence in 5x25-grams productsamples is required.
Countries differ in their regulatory approach to the presence of L. monocytogenes in RTE food. In the European Union, CommissionRegulation (EC) No 2073/2005 sets limits similar to Codex Alimentariusguidelines, with complementary introduction of criterion (absence in10x25-grams product samples) for infant products and RTE foods forspecial medical purposes. In the United States, the United StatesDepartment for Agriculture maintains a policy of ‘zero-tolerance’ for L. monocytogenes in RTE foods14. In Canada, an update of the ‘Policyon L. monocytogenes in RTE foods’ has been completed in 2011 and isaligned on the European approach6.
ConclusionDespite its very low occurrence in food products and limited number ofinfection reported, L. monocytogenes remains a key pathogen of concernfor the food industry, due to its high mortality rate and the targetpopulations (infants, pregnant women, elderly and the immuno -compromised). Due to its ubiquity in the environment and its high abilityof colonisation of food industry premises, the strict application of GMPs /GHPs and continuous surveillance through the environmentalmonitoring program are the most efficient hurdles to ensure a safe foodsupply vesus this microbial hazard.
More generally, considering L. monocytogenes or other relevantfoodborne pathogen, the quality and safety of foods is most efficientlyassured by the design and implementation of appropriate controlmeasures, i.e. GMP/GHP and HACCP as applied during production andthroughout the food chain.
This is a much better approach than sole microbiological testing of finished products or ingredients, which is of limited value to assess
their safety, yet necessary at least for regulatory purposes and to prove the proper implementation of the food safety managementcontrol measures.
www.newfoodmagazine.com 23 New Food, Volume 17, Issue 1, 2014
F O O D S A F E T YS U P P L E M E N T
1. Carpentier, B., Cerf, O., 2011. Review – Persistence of Listeria monocytogenes in food industryequipment and premises. Int J Food Microbiol. 145 (1), 1-8
2. Codex Alimentarius, 2007. Guidelines on the application of general principles of food hygiene to the control of Listeria monocytogenes in foods. Available at:http://www.codexalimentarius.org/download/standards/10740/CXG_061e.pdf
3. EFSA BIOHAZ Panel (EFSA Panel on Biological Hazards), 2013. Scientific Opinion on theevaluation of molecular typing methods for major food-borne microbiological hazards andtheir use for attribution modelling, outbreak investigation and scanning surveillance: Part 1 (evaluation of methods and applications). EFSA Journal 2013;11(12):3502, 84 pp. doi:10.2903/j.efsa.2013.3502
4. FSANZ, 2011. Draft Guidance for the Control of Listeria monocytogenes in Ready-To-EatFoods. Available at: http://www.foodsafety.govt.nz/elibrary/industry/control-listeria-foods
5. Gandhi, M., Chikindas, M.L., 2007. Listeria: A foodborne pathogen that knows how to survive.Int J Food Microbiol 113 (1) 1-15
6. Health Canada, 2011. Policy on Listeria monocytogenes in Ready-to-Eat Foods. Available at:http://www.hc-sc.gc.ca/fn-an/legislation/pol/policy_listeria_monocytogenes_2011-eng.php
7. ILSI Research Foundation, 2005. Achieving continuous improvement in reductions infoodborne listeriosis--a risk-based approach. J Food Prot. 68(9):1932-94
8. Jemmi, T., Stephan, R., 2006. Listeria monocytogenes: food-borne pathogen and hygieneindicator. Rev sci tech Off int Epiz 25 (2) 571-580
9. JEMRA, 2004. Risk assessment of Listeria monocytogenes in ready-to-eat foods, MRA Series 4 & 5. Available at: http://www.who.int/foodsafety/publications/micro/mra_listeria/en/index.html
10. Kathariou, S., 2002. Listeria monocytogenes virulence and pathogenicity, a food safetyperspective. Int J Food Microbiol 65 (11) 1811-29
11. McLauchlin, J., Mitchell, R.T., Smerdon, W.J., Jewell, K., 2004. Listeria monocytogenes andlisteriosis: a review of hazard characterisation for use in microbiological risk assessment offoods. Int J Food Microbiol 92 (1) 15-33
12. Todd et al., 2011. Food Control Special Issue: Listeria regulation – Volume 22, Issue 9, Pages1477-1550. Available at: http://www.sciencedirect.com/science/journal/09567135/22/9
13. USDA – FDA, 2003. Quantitative Assessment of Relative Risk to Public Health from FoodborneListeria monocytogenes Among Selected Categories of Ready-to-Eat Foods. Available at:http://www.fda.gov/Food/FoodScienceResearch/RiskSafetyAssessment/ucm183966.htm
14. USDA – FDA, 2008. Draft Guidance for Industry: Control of Listeria monocytogenes inRefrigerated or Frozen Ready-To-Eat Foods. Available at: http://www.fda.gov/Food/GuidanceRegulation/GuidanceDocumentsRegulatoryInformation/FoodProcessingHACCP/ucm073110.htm
15. Valderrama, W.B., Cutter, C.N., 2013. An Ecological Perspective of Listeria monocytogenesBiofilms in Food Processing Facilities. Critical Reviews in Food Science and Nutrition,53:801–817 (2013)
References
• WHO Listeria monocytogenes risk assessment (MRA Series 4 & 5) http://www.who.int/foodsafety/micro/jemra/assessment/listeria/en/
• Codex Guidelines on the Application of General Principles of Food Hygiene to the Control of Listeria monocytogenes in Ready-to-Eat Foods (CAC/GL 61-2007)http://www.codexalimentarius.net/download/standards/10740/CXG_061e.pdf
• Achieving Continuous Improvement in Reductions in Foodborne Listeriosis—A Risk-BasedApproach. ILSI research foundation / risk science institute, expert panel on Listeriamonocytogenes in foods. Journal of Food Protection, Vol. 68, No. 9, 2005, Pages 1932–1994
• http://www.ncbi.nlm.nih.gov/pubmed/16161698
• Center for Disease Control and Prevention – United States. Listeria (Listeriosis)http://www.cdc.gov/listeria/
• European Food Safety Authority. Listeria http://www.efsa.europa.eu/en/topics/topic/listeria.htm
Further reading
François Bourdichon is Corporate Food Safety, Microbiologyand Hygiene Manager for Barry Callebaut. He has been working‘with’ Listeria monocytogenes since his early years as a microbiologist at Pasteur’s Institute within Pascale Cossart’s Research Unit and the next following decade withinthe dairy industry.
About the Author

© O
leks
il Kh
myz
/ Sh
utte
rsto
ck.c
om
Outbreaks through frozen foods have been reported occasionally though not to the extent of outbreaks reported from other foodcategories. Microbial growth at temperatures below 0°C is more likely to be that of yeast and moulds rather than bacteria. While frozen foods typically have fewer food safety concerns, manufacturers and foodprocessors still need to make sure the products are manufactured withfood safety in mind. This becomes even more important today as
consumers look for foods with minimally processed, natural foods withless or no preservatives.
Food safety professionals cannot remain complacent as publichealth can never be compromised and evaluated based on outbreaklevels. This is especially important for food manufacturers as they putmany of their interests in line including regulatory compliance, brandintegrity, and costs associated with product recalls. From the regulatory
Frozen foods are relatively fresher and safer than produce which comes out of the farm directly or those that weresubjected to extreme processing to make shelf-stable and safe. However, freezing does not inactivatemicroorganisms in food, it only slows down growth. The freezing process is used mainly to preserve foods for a longerperiod of time. Frozen products still can harbour microorganisms which may become a food safety concern if notproperly handled by manufacturers, retailers and consumers. Prepared frozen foods must be safe prior to freezing inorder to be safe after freezing.
The need for risk assessmentand validation in frozen food manufacturing
New Food, Volume 17, Issue 1, 2014 24 www.newfoodmagazine.com
F O O D S A F E T YS U P P L E M E N T
■ Lilia M. Santiago-Connolly Group Leader of Food Safety,Heinz North America
■ Raghu Ramaswamy Thermal Process Authority,Heinz North America

F O O D S A F E T YS U P P L E M E N T
www.newfoodmagazine.com 25 New Food, Volume 17, Issue 1, 2014
perspective, little emphasis was placed on frozen foods because of theirpositive historical record. However, with so many products flooding the market from manufacturers ranging from big corporations to fresh entrants, it is becoming increasing challenging for regulatoryagencies to enforce their safety standards. Changing consumerbehaviour complicates this further as they look for products that areminimally processed, processed using novel technologies, ethniccuisines, different cooking methods, and all sort of innovative productsat no additional cost to them. Thanks to advances in temperaturemeasurement, refrigeration and freezing, food manufacturers are mostlyable to cope with public demand with innovations in productdevelopment and packaging. However, there are still many challengesthat remain unresolved due to the complexity involved in the frozen foodbusiness. There are many areas in the product lifecycle that can gowrong, resulting in risk to public health.
This article focuses on areas of concern related to frozen food safetyand the need for risk assessment and challenges in validation processesin some frozen foods manufacturing. For the sake of simplicity, risk areasassociated with frozen food manufacturing can be classified into:� Ingredient procurement� Product preparation� Process control� Packaging� Storage, transport and distribution.
Ingredient procurementThe final quality of the frozen foods is greatly influenced by the quality of ingredients. Almost all of the food manufacturers count on theguarantee of the ingredient suppliers for the safety of their ingredi-ents. The certificate of analysis (COA) furnished by the ingredientmanufacturers represents only a snapshot of an incoming lot and itshould not be considered sufficient. Many food manufacturers lack theresources, money and time to evaluate the incoming raw ingredients toensure safety levels. In lieu of this, food manufacturers need to placestringent controls for qualifying vendors by conducting periodic audits oftheir food safety processes and systems.
Cost reduction measures involvechanging the ingredients and vendorsmore frequently than before, resultingin less time for quality control.Temperature abuse during variousstages of frozen ingredients manu -facturing and shipping is a big causeof concern as very little control ispossible, especially with products like
meat protein and egg products. An option of having more than onesupplier with enough control limits on each of the product parameterswill help ensure a constant supply with no compromise on quality andsafety. Ensuring the safety of ingredients procured across borders is adaunting task for both food manufacturers and regulatory agencies.Global Harmonization of food safety regulations has a long way to go tomake this process easier for the benefit of everyone.
Product preparationMost ingredients used in the manufacture of frozen products will be usedin a refrigerated or cold state prior to assembly and the freezing process.Biological hazards of concern for frozen products will be based on theinitial microbial load that could be introduced either from other rawingredients and/or processing environment such as equipment,personnel, or even the water itself.
The effect of freezing on microorganisms depends on the type offood, the rate of freezing, the kind of microorganisms, and freezingtemperature1. Potential sources of contamination need to be identifiedvery carefully and measures need to be taken with appropriate limits andcontrol procedures.
Quality parameters like pH, acidity, salt and water activity whichhave a profound influence on safety need to be clearly set andmaintained. While controlling all these factors could be achieved with adiligently developed food safety program, training of employees withGMPs, allergen control, and food safety issues is essential to effectivelyimplement it. Clear accountability and rewarding of responsiblebehaviour should be encouraged.
Processing lineThe use of pre-cooling process for some ingredients used in frozenproducts is to lower the heat from one temperature to another andfacilitate the freezing process. Products that are pre-cooled prior tofreezing must be monitored under a restricted time frame and stricthygiene conditions to avoid any potential microbial outgrowth. All ingredients are recommended to be used or further processed asquickly as possible prior to freezing, to avoid the temperature danger
zone between 135°F (57°C) to 70°F (21.1°C) for potential microbialoutgrowth (FDA Food Code, 2009).
It is recommended that once frozen products achieve thefrozen state, they are kept frozen. The practice of holding
and thawing frozen products for too long may provide theright environment for microorganisms to grow. For this
reason, monitoring of the frozenprocess and equipment is critical
to ensure the control of
© M
otov
olka
/ Sh
utte
rsto
ck.c
om

biological hazards. The monitoring controls will depend on the type ofproduct, equipment, freezing process and complexity of manufacturingoperations. Some examples of monitoring controls during the freezingprocess include: freezer controls and settings with temperature limits;load for each cycle, formula / recipe to ensure no changes on ingredientsor set limits that can affect the freezing process; storage temperature offinished product temperature (recommended -18°C); and freezermaintenance and capabilities. Frozen products shall be released fordistribution only when they had been frozen to -18°C.
Another two key steps during process control include properrecordkeeping and calibration which must be carefully reviewed toensure the freezing process was followed as designed. The use ofcalibrated equipment such as thermometers is a critical step duringfreezing and it is recommended to verify calibration equipment at leastonce at the beginning of each production shift.
Process control plays a major role in risk alleviation. Most of the contamination issues in the previous steps can be controlled with a carefully controlled process line. However, unclean processequipment and inadequate thermal processing step may pose a biggersafety threat and was implicated in a number of outbreaks. Quality of airand environment in the manufacturing plant needs to be carefullymonitored with swap testing as frequently as possible. Unattendedminor repairs and unhygienic design of product flow (e.g. slope of pipes)will escape many of the auditors’ watchful eyes. Inadequate cleaning andsterilising of the fillers and filler area is a risk area acknowledged by everyone. The freezing equipment and medium must not act as asource of re-contamination and must be included in a master sanitation
plan. All corrective actions should be documented, and investigated toprevent reoccurrence of deviation.
PackagingPackaging is a very risky food safety area which is often neglected or paidlittle attention in the risk management process. Post-process recontami -nation mostly results in spoilage and the possibility of pathogenicinfection cannot be ignored. Packaging material of the final container(films, trays, lids) and intermediate storage totes, drums, etc. are sourcesof recontamination of the processed products. All types of packagingmust be properly inspected, stored and managed by the factory toensure safety and quality.
Other issues such as improperly ventilated package designs andaseptic wrapping of foods may lead to anaerobic conditions and pose abigger threat. Intentional sabotage and tampering with the finished foodproduct is a big concern in this new world and need to be avoided withtamper evident packaging designs. Physical contamination withchipped glasses, delaminated films, and broken plastics can result inextensive recalls and damage the brand of the manufacturer apart fromhurting the consumer psyche. Installation and periodic validation ofmetal detectors and visual inspection systems like x-rays that will detectforeign objects to the level of required specifications and safety hasbecome mandatory in many food processing plants. Some of thepackage designs that may not be a food safety concern but may be ofconsumer safety concern include, steam venting valves, deshaping andfraying of trays, insufficient flanges, temperature masking, etc.
Storage, transport and distributionThe dangerous zone for keeping the products and ingredients is 40-140°Fand this needs to be completely avoided. Coolers and freezers shouldhave enough capacity and be efficient enough to cool the product belowthis dangerous threshold level rapidly. Even holding the product at ahigher temperature for a longer time (due to a failed subsequentoperation) is a risk for thermophilic spoilage. A clear case of cross-contamination is the reported incidence of contamination in pasteurisedice cream mix that was shipped in the same container that was used fortransporting unpasteurised egg. This resulted in Salmonella Enteritidisinfection in thousands of people2.
There is a need for public education and stringent permit approvalsfor transportation of refrigerated and frozen foods. Temperature abuse,insufficient sanitation of transport vehicles, improper handling ofproduct packages can bring economic and brand loss to the foodmanufacturer3. Controls must exist to inspect any truck delivering frozeningredients. These trucks should be inspected in the receiving dock areasprior to receiving any frozen materials and the units must be capable ofholding food below 0°C.
Ice used for distribution could be a source of recontamination if thepackaging seals are not intact (FDA Food Code, 2009). Temperaturecontrol at distribution centres and grocery display cabinets areconsidered inefficient by various study reports. Not properly maintainingthe storage temperature will help microorganisms to grow exponentiallyespecially when there is little or no competition for available nutrients inthe processed products.
Risk assessment is not limited to these major areas of foodmanufacturing. Personnel with expertise in various stages of
New Food, Volume 17, Issue 1, 2014 26 www.newfoodmagazine.com
F O O D S A F E T YS U P P L E M E N T

food manufacturing (farm to fork) should be involved in making a sound judgment on the potential risk areas and the control measure to eliminate them.
Validation needsParameters to be considered when validating the freezing processinclude the type of freezing equipment, amount of product, and if the product is pre-packed, the type of packaging. The efficiency of thefreezing process will be dependent upon the initial product temperature,product size, shape and free water content4.
There is much equipment used in the food production processwhich will have a profound effect on the safety of the finished products.There are a number of heating and cooling devices that are used for avariety of reasons. Accurate calibration and effective use of them bytrained personnel are necessary to avoid any insufficiency in the appliedlethality. Even with calibrations, which are spaced over a period of time,it should be mandated that this equipment is validated for the delivery ofintended heating or cooling.
With a recent survey indicating that a majority of consumers stronglybelieving that food manufacturers areresponsible for the safety of the products theybuy, the onus is now solely on the food businessentities. Hence the need for food industries toconduct food safety risk assessment for each oftheir products and validate each of their controlmeasures scientifically. Generating relevantscientific data by professionals with food safety expertise increases the comfort of publicand government regulatory agencies. In the US,the implementation of the Food SafetyModernization Act (FSMA) demands propermaintenance of evidences by food manu -facturers on their validation process along withtheir GMP and HACCP plans. As the frozen foodsindustry continues to grow, the focus on riskassessment and potential hazard vehicles willincrease among the scientific community.Major industrial challenges like businesssustainability and continued growth, minimi -sing product recall, brand maintenance canvery well be accomplished with greateremphasis on food safety risk assessment. There is also a need for the industry to work together with regulatory agencies andacademia to effectively implement food safetycontrol measures.
100+applications covered
with flexible, time- saving and simplemodularity.
MAKING MODERN LIVING POSSIBLE
www.danfoss.com/IR
Precise Temperature Controland easy serviceDanfoss Flexline™ products are the ideal choice if you are looking for precise temperature control in your refrigeration system. System safety and reliability is important in ensuring food safety. And service is easily carried out thanks to drop-in service modules reducing down-time.
For industries where hygiene is a high priority or where harsh environments are present stainless steel products are available.
Backed by more than 60 years of experience producing valves and controllers for industrial refrigeration applications Danfoss is a solid partner to turn to when you are looking for quality solutions and components.
Our global know-how combined with local support offers you the best possible solutions and service.
F O O D S A F E T YS U P P L E M E N T
New Food, Volume 17, Issue 1, 2014
Lilia M. Santiago-Connolly, PhD works as Group Leader of Food Safety at HeinzNorth America, based in Pittsburgh, USA. She is responsible for microbiology,analytical, thermal processing, and sanitation programmes for all HNA factories.She has a degree in Animal and Dairy Science and a Master’s degree in MeatScience from Iowa State University, and Doctoral degree in Food Science andTechnology from the University of Tennessee. She has been working for over 18 years in the field of quality assurance and food safety and previous industrialexperience includes ConAgra, Cargill, and Smithfield Meats. She is an activemember of the International Association of Food Protection (IAFP) and Instituteof Food Technologist (IFT).
Raghu Ramaswamy, PhD works as Thermal Process Authorityat Heinz North America and is part of the food safety team thatconducts risk assessment for various products manufacturedby Heinz and its affiliates. Raghu’s specialisation is Food SafetyEngineering and he has authored many research and reviewpapers, factsheets and presentations. He has held positions inacademia and industry and has experience in HACCP, product and processdevelopment, novel (thermal and non-thermal) technologies, process validationand auditing. He is a professional member of IFT, IMPI, IAFP and IFTPS.
About the Authors
1. Frazier, W.C and Westhoff, D.C. 1988. Food Microbiology(4th ed). McGraw-Hill Book Co. New York, p130-131
2. Bell, C and Hyriakides, A. 2008. Salmonella: A practicalapproach to the organism and its control in foods. John Wiley & Sons, Iowa, p75-76
3. Keener, L and Roberts, J. 2013. The squeaky wheel: Is transportation the watershed for food safety and fooddefense. Food Safety Magazine
4. Jay, J. M., Loessner, M. J. and Golden, D. A. 2005. ModernFood Microbiology (7th ed). Springer publishers.
References

Fat, in either saturated or unsaturated form, is the most calorie dense nutrient available to us. The public health responsibility deal, which the UK Food Industry has signed up for, was put in placefollowing the Call to Action on Obesity in England2, which set out the importance of action on obesity, and issued a challenge to thepopulation to reduce its total calorie consumption by five millioncalories (kcal) a day. One route to do this is to reduce total fat content. Additionally, the public health responsibility deal saturated
fat reduction pledge3 recognises the need to reduce saturated fatconsumption to less than 11 per cent of food energy compared to currentlevels of 12.7 per cent.
Subsequently, there are drivers to reduce the total fat and also thesaturated fat content of our diet. Bakery products such as cakes andbiscuits contain significant amounts of fat. For example, the short dough biscuit recipe used in this study has a total fat content of about 22 per cent, 41 per cent of which is saturated fat, and the standard yellow
In 2008, the Food and Agricultural Organisation and the World Health Organisation reviewed their recommendationson dietary fat and fatty acids in view of the growing evidence on dietary fatty acids and health outcomes1. The keyrecommendation was that our diet type should change to limit the saturated fatty acid content to 10 per cent of thedietary energy intake. The saturated fatty acids should be replaced with polyunsaturated fatty acids. By adjusting the ratio of saturated to unsaturated fatty acids in the diet, the level of low density lipoprotein cholesterol in bloodserum is reduced, which correlates with a decrease in the risk of coronary heart disease.
A novel approach toreducing the total andsaturated fat content of baked goods
New Food, Volume 17, Issue 1, 2014 28 www.newfoodmagazine.com
F A T S & O I L S
■ Charles Speirs Bakery Science Manager, Campden BRI
© H
andm
adeP
ictu
res /
Shu
tter
stoc
k.co
m

or high ratio cake recipe has a total fat content of about 16 per cent, 35 per cent of which is saturated fat.
Fat has a range of technical roles in both cake and biscuitmanufacture and any fat reduction or replacement with an alternativematerial must ensure that these roles are still met.
The key role of fat in biscuit dough has been described asshortening4, which gives biscuits their characteristic ‘melt in the mouth’crumbly texture. The mechanism by which fat contributes this propertyto biscuits is by coating flour particles during the mixing of biscuit dough.This fat coating prevents gluten from absorbing water during mixing andbecoming elastic and extensible5. Gluten development is essential inbread dough but is to be avoided in biscuit dough; otherwise the biscuitsproduced can be undesirably tough and chewy.
A secondary role of fat is to coat any air bubbles present in order toenhance their stability during baking. This role is similar to the stabilisingeffects of fats on bubbles in bread dough and cake batter6,7 and preventsthe bubbles rupturing and coalescing into larger bubbles.
While both liquid and solid fat can be used to coat wheat particles torestrict gluten development, the firmness, and therefore the machine-ability of dough, is directly related to the solid fat index (SFI) of the doughfat8. Dough which contains liquid oil at the point of handling is difficult towork and develop9. The ability to coat bubbles to retain integrity duringdough handling and baking is also best found in a fat with a developedcrystalline structure rather than in a liquid oil10. Hard fats, rather than oils,are used to provide the required functionality in biscuit dough, with the
naturally produced ingredients of choice being either palm oil, which hasa melting point of around 36°C, or butter, which melts in the temperaturerange 32 – 35°C.
The use of saturated fats is therefore central to biscuit technologybut also has a major role in cakes. By interfering with glutendevelopment, fat contributes to a shorter texture with a softer eatingcrumb. Fat also acts to improve the shelf life of cakes since it acts as a moisture barrier, preventing significant increases or decreases inmoisture content over typical storage conditions. Fat provides intrinsicflavour and lubricates the bolus of cake and biscuit during chewing andswallowing. Fat is also a reservoir for fat-soluble flavour componentsgenerated during baking.
Replacement or reduction of fat in both biscuit and cake thereforerequires any alternative material to perform a range of technicalfunctions associated with the development of structure and texturetogether with eating quality considerations. Having reviewed theliterature on fat reduction, it was decided to pursue an approach basedon modified water-in-oil emulsions.
The approach adapted was based on the teaching of patent WO 93/1961311, which relates to the use of a gelling system to replacewater in margarine or reduced fat spreads. A liquid system containing all the necessary elements to form a thermally stable gel is prepared. The liquid system is then emulsified in oil to produce a water-in-oilemulsion. The liquid-to-solid transition is triggered once the emulsion isformed to give a gelled aqueous phase. The gelled aqueous phase is thermally irreversible, which means that the aqueous phase of themargarine or reduced fat spread produced has rheological propertieswhich are largely independent of temperature. In practice, the liquidsystem can be a sequestered sodium alginate or sodium pectatesolution containing a dispersed sparingly soluble calcium salt. Alginate and pectate form gels in the presence of calcium. The level and
F A T S & O I L S
www.newfoodmagazine.com 29 New Food, Volume 17, Issue 1, 2014
Figure 1: Schematic of alginate gel-in-oil emulsion
Figure 2: Biscuits containing 100% fat and 50% fat
Figure 3: Control cakes compared to cakes where 50 and 25 per cent of the fathas been substituted with a 50:50 alginate gel-in-oil emulsion
Figure 4: ERH changes over 21 days for cakes (measured at 21°C)

type of sequestrant can be used to control the rate of release of calciumsuch that gelation happens after the emulsion is formed. This is shownschematically in Figure 1 (page 29).
Figure 2 (page 29) shows examples of control and test biscuits wherethe reduced fat biscuits had 50 per cent of the shortening replaced by a50:50 alginate gel-in-oil emulsion prepared using this technology. The corresponding dimensional measurements, hardness values andmoisture contents are shown in Table 1.
The reduced fat biscuits had lower moisture contents than thecontrol and were shorter in length than the control biscuits. The stackheight and the width of the sets of biscuits were similar. The controlbiscuits were harder than the reduced fat biscuits; however, thisdifference was not significant.
The control biscuits had a total fat content of 21.6 per cent and asaturated fat content of 10 per cent. The test biscuits showed a decreaseof 21 per cent in total fat and a significant decrease of 41 per cent insaturated fat compared to the control, enabling a claim of ‘a reduction in saturated fat content’ or ‘reduced saturated fat’ to be made.
This approach was also evaluated in high ratio cakes. Figure 3(page 29) shows examples of control (full fat) cakes compared to cakes
where 50 per cent and 25 per cent of the fat has been substituted with a 50:50 alginate gel-in-oil emulsion.
It can be seen that the appearance and volume of test and controlcakes are similar.
Water activity (ERH) and moisture content were measured over 21 days. The ERH values are shown in Figure 4 (page 29) with thecorresponding moisture contents shown in Figure 5.
It can be seen that both moisture content and ERH of cakesdecreased over storage. There is some evidence to suggest that the ERHof cakes made with the alginate gel was lower than comparable controlcakes, despite having higher moisture contents. This suggested that
the encapsulated water added through the alginate gel was less mobilethan the water added to the conventional recipe. This means that amoist eating cake with a reduced fat content can be made with noreduction of mould-free shelf life. The fat composition of the cakes isshown in Table 2.
Figures in brackets are negative values showing a fat reduction. The cake containing alginate gel-in-oil emulsion with a 50 per centshortening reduction has a saturated fat reduction of 32.8 per cent, againenabling a claim of ‘a reduction in saturated fat content’ or ‘reducedsaturated fat’ to be made.
In conclusion, the use of alginate gel-in-oil emulsions offers foodmanufacturers a means of achieving total fat reduction and alsosignificant saturated fat reduction in both short dough biscuits and highratio cakes with no compromise on product quality. This novel approachto reformulation can help manufacturers work towards the targets of the public health responsibility deal, and the saturated fat reductionpledge in particular.
New Food, Volume 17, Issue 1, 2014 30 www.newfoodmagazine.com
F A T S & O I L S
1. Schenker, S. (2012) ‘UK recommendations for dietary fat: should they be reassessed in light ofthe recent joint FAO/WHO recommendations?’ Nutrition Bulletin. 37 (1), 37-46
2. Department of Health UK (2011) ‘Healthy Lives, Healthy People: A call to Action on Obesity inEngland’. UK Government. Accessed through responsibilitydeal.dh.gov.uk
3. Department of Health UK. (2013) ‘Saturated Fat Reduction Pledge’. UK Government. UK Government. Accessed through responsibilitydeal.dh.gov.uk
4. Atkinson, G. (2011) ‘Fats and oils as biscuit ingredients’. In: Manley, D. (eds.) Manley'stechnology of biscuits, crackers and cookies. Fourth Edition. Woodhead Publishing Limited,pp.160-180
5. Lawson, R., Millar, A.R., and Thacker, D. (1981) ‘Rotary moulded short dough biscuits: Part II. The effects of the level of ingredients on the properties of Lincoln biscuits’. Flour Millingand Baking Research Association. Report number: 93
6. Brooker, B. E. (1993) ‘The stabilisation of air in foods containing fat – a review’. Food Structure12 (1), 115-122
7. Brooker, B. E. (1996) ‘The role of fat in the stabilization of gas cells in bread dough’. Journal ofCereal Science. 24 (3), 187-198
8. Sai Manohar, R. and Haridas Rao, P. (1999) ‘Effect of emulsifiers, fat level and type on therheological characteristics of biscuit dough and quality of biscuits’. Journal of the Science ofFood and Agriculture. 79 (10), 1223-1231
9. Atkinson, G. (2011) Saturated fat reduction in biscuits. In: Talbot, G. (eds.) Reducing saturatedfats in foods. Woodhead Publishing Limited, pp.283-300
10. Sahi, S., Gates, F., and Maher, N. (2013) ‘Determination of bulk and interfacial properties ofwheat flour/water systems’. Campden BRI report number: 339
11. Izzo, M.T., Jerome, R.A., Nace, J.A., and Speirs, C.I. (1993) ‘Gelling system as a fat substitute’,Patent WO 93/19613. Mars Inc
References
Table 1: Biscuit measurements for reduced fat biscuits compared to control
Stack Moisture
Height Length Width Content Hardness
Sample (mm) (mm) (mm) (%) (g)
Control 100 6.7 4.1 3.4 ± 0.0 2910 ± 407
50% fat, 50% 102 6.6 4.1 3.2 ± 0.0 2698 ± 90950/50 alginate gel-in-oil
Table 2: Cake fat content
50% 25%
Control shortening Change shortening Change
Fat Type (g/100g) reduction (%) reduction (%)
Total fat 16.4 13.8 (15.8) 15.2 (7.3)
Saturated fat 5.8 3.9 (32.8) 4.8 (17.2)
Mono-unsaturated 7.1 5.2 (26.8) 6.2 (12.7)
Poly-unsaturated 2.8 4.1 46.4 3.5 25.0
Trans fatty acids <0.1 <0.1 0 <0.1 0
Charles Speirs graduated from The University of Strathclyde with First ClassHonours in Food Science and also has a PhD in the field of food ingredients fromThe University of Nottingham. In his roles as Baking Science Manager atCampden BRI, Charles manages a bakery-focused research programme,organises technical training programmes, conferences and seminars, andtranslates clients’ needs into confidential contract research projects.
About the Author
Figure 5: Moisture changes over 21 days for cakes (measured at 21°C)

Held from 8 – 10 April 2014 at the Baltimore, Maryland ConventionCenter, this year’s event will feature a line-up of extensive educationalseminars, high level industry and government speakers, workshops,networking events and a large exhibition floor. Through hands-onworkshops, specialised certification courses, in-depth educationalsessions and a resource-rich Exhibit Hall, attendees will find practical,real-world solutions to their food safety challenges.
“The Food Safety Summit provides solutions for today, planning fortomorrow, with a carefully developed education programme designedto address the critical issues facing food producers, processors, retailers,distributors, and regulators,” said Scott Wolters, Event Director for theFood Safety Summit. “Our goal is to advance food safety by providingrelevant food safety information and solutions across the entire foodsupply chain, while keeping the industry, businesses and consumerssafe. This year the Educational Advisory Board has developed a stellarprogramme addressing some of the most pressing concerns whileproviding the most relevant solutions.”
The event will kick-off on Tuesday 8 April with three half-day morningworkshops featuring: A One-Health Approach to Improving Food Safety;Pre-Requisite Programs: The Building Blocks for a Successful Safety &Quality Management Strategy; and Traceability: Taking a Mock Recall tothe Next Level. In the afternoon there will be a half-day workshopspecifically focused on Meeting Consumer and Food SafetyModernization Act (FSMA) Food Safety Expectations.
The Food Safety Summit 2014 keynote session, which will take placeon Wednesday 9 April, will feature Ed Lonergan, CEO of Chiquita Brands,and Don Zietlow, CEO of Kwik Trip, Inc. During this unique presentation,Lonergan and Zietlow will share their passion and commitment to foodsafety and provide insights on how they work with their food safetyprofessionals to ensure the safest, highest quality products are reachingtheir customers and consumers.
“Our Educational Advisory Board was instrumental in developing the
concept for this keynote presentation as a way to educate our audienceof food safety and quality control professionals on how best to work withthe C-Suite within their organisation,” commented Wolters. “We are alsoexcited to be offering a follow-up session which will feature the leaders offood safety for Chiquita Brands and Kwik Trip as well as several othercompanies who will share their success in obtaining senior managementcommitment to food safety.”
Following the keynote, attendees who heard from CEOs during themorning presentation will have the opportunity to join Dr. Jay L.E.Ellingson, Corporate Director of Food Safety and Quality, Kwik Trip, Inc.and Courtney Parker, Vice President Quality & Food Safety at ChiquitaBrands as well as the heads of food safety for other companies and learnhow to work more effectively with the C-Suite/Senior Management at aFood Company. This panel of leading food safety professionals will sharetheir top five strategies on how they earned and maintained a strongrelationship with their CEOs and others in the C-Suite.
In addition, the Food Safety Summit will also offer 20 in-deptheducation sessions on new and noteworthy topics including: Food Fraud/ Economically Motivated Adulteration; Food Safety Hazards; Storageand Distribution; Preparing for and Responding to Natural Disasters;Management Commitment to Food Safety; Hot Topic and LeadingIssues; Food Safety for Foodservice Operators and Retailers; and more.
After the success of last year’s Town Hall discussion, the FDA’sMichael Taylor has once again been invited to the Summit and joininghim will be USDA’s Brian Ronholm, and AFDO’s Joseph Corby toparticipate in an open forum, where they will address the most pressingissues for today and tomorrow in regards to regulatory agencies and the private sector. Questions and answers with the audience will be encouraged.
The 16th Annual Food Safety Summit Conference and Expo; the largest solutions-based conference and expo for thefood industry in North America, explores the most critical food safety issues facing the entire food industry.
Solutions for today,planning for tomorrow
■ 8 – 10 April 2014Baltimore, Maryland, USA
For fururther information: www.foodsafetysummit.com
S h o w P r e v i e w
www.newfoodmagazine.com 31 New Food, Volume 17, Issue 1, 2014

Date: Thursday 10 April 2014Time: 15:00 BST / 16:00 CET / 10:00 EDT
New Food, Volume 17, Issue 1, 2014 32 www.newfoodmagazine.com
© M
athi
as R
osen
thal
/ Sh
utte
rsto
ck.c
om
Food contamination anissue? – Discover solutionsfor your everyday samplepreparation needs
Register now at: www.newfoodmagazine.com/foodcontamination
Synopsis: As food quality and food integrity has become a major topic for the consumer, thepenetration path of contaminants in our food chain deriving from the food productionand/or the food packaging and storage conditions is gaining attention. Fast andreliable ways of sample preparation and analysis are discussed showing up-to-dateexamples and how the regulations are applied.
This webinar focuses on new methods and applications in food contaminationanalysis, bringing together some of the leading experts in food contact materials (FCM)and provides an interactive learning environment for scientists working in this field.
What will you gain from this webinar?� You will be provided with tangible ways to streamline your sample preparation to
detect mineral oil hydrocarbons in cardboard and food as well as Bisphenol A incanned food
� BUCHI´s solutions for these applications are presented using examples from industry
� Furthermore, you will learn about health and safety risks in the field of foodpackaging and storage. This will be linked to up-to-date information from theleading regulatory authorities.
Speakers:
Organised by: Supported by:
Sabrina MoretAssociate Professor, Department ofFood Science, University of Udine
Duncan GoodwinDirector of Technical Services,Supply Chain Assurance, NSF
Susanne FeifelProduct Group Manager forKjeldahl, Elemental Analysis andExtraction, BÜCHI Labortechnik AG
It is thought that the maturation of organs is adapted to the nutritionalenvironment in this critical period of development. An excess of energy,unbalances in macronutrient quality or nutritional deficiencies areinappropriate nutritional signals, which may lead to e.g. metabolicdisturbances or the development of obesity4-7. Early life is also a crucial
phase for the development of healthy eating habits. There is a window ofopportunity to form food preferences, and by repeated exposure andoffering variety, children learn to accept many different tastes8-10
and these preferences subsequently track into childhood and beyond11-14. In this review, we summarise the possible negative effects of
The early years of life are a period of very rapid growth and development. Many organs including the gastrointestinaltract, pancreas, adipose tissue and the brain are still under development in infancy and toddlerhood. Body sizedoubles and body weight increases five-fold in this period of time. Two grams of brain are added every day1. In thiscritical phase of childhood, the foundation is laid for a healthy life. The risk of becoming overweight in childhoodstarts in the first year of life. Subsequent rapid increases in Body Mass Index (BMI) further aggravate the risk ofbecoming obese2,3.
The relevance of reducingsugar and sweetness inproducts intended forinfants and young children
S U G A R R E D U C T I O N
www.newfoodmagazine.com 33 New Food, Volume 17, Issue 1, 2014
■ Martine Alles Director DevelopmentalPhysiology & Nutrition andSimone Eussen, NutritionScientist, Nutricia Research
© S
tiggy
Pho
to /
Shut
ters
tock
.com

excess sugar and sweetness in products forinfants and young children. At the end of thepaper we share the commitment and approachof Danone Nutricia Early Life Nutrition inimproving its portfolio.
Increased risk of childhood obesity There has been a dramatic increase in theprevalence of childhood overweight and obesityin the last three decades in developed countries,and the problem is emerging in low-incomecountries15. Excess weight is associated with ahigher prevalence of cardiovascular andmetabolic diseases, including Type 2 diabetes,dyslipidemia, hypertension, atherosclerosis andnon-alcoholic fatty liver disease later in life16. The number of studies investigating therelationship between total sugar intake inchildren and obesity risk is small, partly becauseof the small number of countries that have goodsugar intake data. Studies conducted inpopulations of children demonstrate positive associations betweenintake of sugar and BMI17-19.
In recent years there has been growing interest in the role of fructosein obesity and metabolic disease. After its introduction into foods, therehas been a concomitant increase in obesity over the same period. To date however, no compelling evidence for a specific effect of fructoseon obesity or metabolic disease has been shown20,21.
A more strongly established relationship is between the intake ofsugar coming from sweetened beverages and body weightdevelopment, possibly because liquid sugars do not give the right senseof satiety. Several observational studies indicate that a greaterconsumption of sugar-sweetened beverages, including sugared fruitjuices and drinks and carbonated beverages, is associated with weightgain and obesity22,23. In an intervention study by de Ruyter et al24, sugar-containing beverages were replaced by non-caloric beverages in normalweight children. A reduction of weight gain and fat accumulation wasobserved. There seems to be sufficient evidence for public healthstrategies which discourage overconsumption of sugary drinks25.
Negative impact on the development of healthy eating habits Human infants are born with an innate preference for sweet, shown bytypical facial expressions indicating relaxation when they are exposed tosweetness26,27. Sweet foods are often energy-rich, which may explain thepreference for sweetness, as energy is needed for optimal growth anddevelopment28,29. Most infants and toddlers prefer a sweet solution overwater30 and breast milk also has a sweet taste31. During the first year of life,inter-individual differences in sweet taste acceptance become bigger11,12.Experience with sweet foods and beverages may modulate a child’ssweetness preference and their consumption pattern. Early exposure tosugar increases the preference and consumption of sugared andsweetened products later in childhood11-14.
Interference with the intake of other nutrients Another suggested adverse consequence of excess sugars is its effect onthe intake of other nutrients. Most studies do not find an association ofsugar intake with total energy intake. As fruit juices may replace milk
drinks when infants get older, a shift inmicronutrient intake may occur32. Intakes ofspecific micronutrients such as calcium,zinc, thiamin, riboflavin, niacin and folatehave shown to be reduced with increasingsugar intakes, but generally stay well aboverecommended intakes for children17,33.
Increased risk of dental caries Dental caries is a bacterial infection thatcauses demineralisation and destruction ofthe hard tissue of the teeth. It is a result of the production of acids by bacterialfermentation of foods that are present inthe mouth. The form of caries seen in youngchildren is called Early Childhood Caries,
New Food, Volume 17, Issue 1, 2014 34 www.newfoodmagazine.com
S U G A R R E D U C T I O N
Figure 1: The results of a sugar reduction program launched by ELN in 2010
© Is
antil
li / S
hutt
erst
ock.
com

which can affect both the front teeth as well as molars. Sucrose is highlycariogenic and a study by Karjaleinen et al shows that sucrose intakes atthree years of age is higher in those who developed caries by the age ofsix34. Similar results were shown in the British National Diet and NutritionSurvey (NDNS) of pre-school children aged 1.5 to 4.5 years in which theconsumption of non-milk extrinsic sugars was related to cariesincidence35. The relationship between sugars and dental caries iscomplex as oral hygiene is a confounding factor. Reducing frequency ofconsumption of sugar containing foods and improving oral hygiene mayhave a large impact on incidence of dental caries.
Reducing sugar and sweetness in products for infants and young children Danone Nutricia Early Life Nutrition (ELN) has a strong commitment tolimit the amount of sugar in products intended for infants and youngchildren. Specific minimum and optimum nutritional standards havebeen developed per category as reference values for productdevelopment. All categories are included, such as milk-based formulae,growing-up milks, cereal-based foods, savoury dishes, fruit-drinks anddairy based dishes. Minimum standards are mandatory for all productsin the ELN product portfolio. They are there to help us continuously pushfor improvement, while at the same time taking into consideration thevariations in eating habits and cultural practices in our markets aroundthe world. Optimum standards represent our final ambition and will
drive the nutritional quality of our products in the long run. Optimumstandards are based on the latest science and are set to deliver the mostsignificant benefits to infants and toddlers. The optimum standard forsugar content for all these categories is ‘no sugar added’. ELN aims tomeet optimum standards in as many products as possible. A sugarreduction program was launched in 2010, with the aim to reduce 20 percent of sugar in products by 2015. Figure 1 (page 34) shows that theactual reduction was almost 14 per cent by 2012 and the first estimatesfor 2013 are 15 per cent reduction.
Several challenges can be identified when reducing sugar inproducts intended for infants and young children. Although it is relativelyeasy to get young infants to adapt to a non-sweet taste36, the mothers’taste is often the reference. She will try the food and may reject productsthat are not sweet enough. Cultural determinants in a preference forsweet foods may be strong. The risk is to lose consumers to non baby-specific foods or competitor products with high sweetness. In addition,parents are not always interested or aware of the long-term healthconsequences of excess sugar intake.
Successful launches of reformulated products within ELN were oftendone without any specific communication to parents or health careprofessionals. A stepwise reduction of sugar was shown to avoid losingconsumers after launch.
In summary, reduction of sugar and sweetness is relevant andrealistic in products intended for infants and young children.
S U G A R R E D U C T I O N
www.newfoodmagazine.com 35 New Food, Volume 17, Issue 1, 2014
1. Lampl, M., J.D. Veldhuis, and M.L. Johnson, Saltation and stasis: a model of human growth.Science, 1992. 258(5083): p. 801-3.
2. Scholtens, S., et al., Breastfeeding, weight gain in infancy, and overweight at seven years of age:the prevention and incidence of asthma and mite allergy birth cohort study. Am J Epidemiol,2007. 165(8): p. 919-26
3. Willers, S.M., et al., BMI development of normal weight and overweight children in the PIAMAstudy. PLoS One, 2012. 7(6): p. e39517
4. Wyrwoll, C.S., et al., Prevention of programmed hyperleptinemia and hypertension by postnataldietary omega-3 fatty acids. Endocrinology, 2006. 147(1): . 599-606
5. Erhuma, A., et al., Prenatal exposure to undernutrition and programming of responses to high-fatfeeding in the rat. Br J Nutr, 2007. 98(3): p. 517-24
6. Singhal, A., et al., Nutrition in infancy and long-term risk of obesity: evidence from 2 randomizedcontrolled trials. Am J Clin Nutr, 2010. 92(5): p. 1133-44
7. Velkoska, E., T.J. Cole, and M.J. Morris, Early dietary intervention: long-term effects on bloodpressure, brain neuropeptide Y, and adiposity markers. Am J Physiol Endocrinol Metab, 2005.288(6): p. E1236-43
8. Mennella, J.A., C.E. Griffin, and G.K. Beauchamp, Flavor programming during infancy. Pediatrics,2004. 113(4): p. 840-5
9. Beauchamp, G.K. and J.A. Mennella, Early flavor learning and its impact on later feeding behavior.J Pediatr Gastroenterol Nutr, 2009. 48 Suppl 1: p. S25-30.
10. Liem, D.G. and C. de Graaf, Sweet and sour preferences in young children and adults: role ofrepeated exposure. Physiol Behav, 2004. 83(3): p. 421-9
11. Beauchamp, G.K. and M. Moran, Dietary experience and sweet taste preference in human infants.Appetite, 1982. 3(2): p. 139-52
12. Beauchamp, G.K. and M. Moran, Acceptance of sweet and salty tastes in 2-year-old children.Appetite, 1984. 5(4): p. 291-305
13. Liem, D.G. and J.A. Mennella, Sweet and sour preferences during childhood: role of earlyexperiences. Dev Psychobiol, 2002. 41(4): p. 388-95
14. Pepino, M.Y. and J.A. Mennella, Factors contributing to individual differences in sucrosepreference. Chem Senses, 2005. 30 Suppl 1: p. i319-20.
15. Wang, Y. and T. Lobstein, Worldwide trends in childhood overweight and obesity. Int J PediatrObes, 2006. 1(1): p. 11-25
16. Kelly, A.S., et al., Severe obesity in children and adolescents: identification, associated healthrisks, and treatment approaches: a scientific statement from the American Heart Association.Circulation, 2013. 128(15): p. 1689-712
17. Overby, N.C., et al., High intake of added sugar among Norwegian children and adolescents.Public Health Nutr, 2004. 7(2): p. 285-93
18. Gibson, S. and D. Neate, Sugar intake, soft drink consumption and body weight among British
children: further analysis of National Diet and Nutrition Survey data with adjustment for under-reporting and physical activity. Int J Food Sci Nutr, 2007. 58(6): p. 445-60
19. Parnell, W., et al., Exploring the relationship between sugars and obesity. Public Health Nutr,2008. 11(8): p. 860-6
20. Forshee, R.A., et al., A critical examination of the evidence relating high fructose corn syrup andweight gain. Crit Rev Food Sci Nutr, 2007. 47(6): p. 561-82
21. Murphy, S.P., The state of the science on dietary sweeteners containing fructose: summary andissues to be resolved. J Nutr, 2009. 139(6): p. 1269S-1270S
22. Mattes, R.D., et al., Nutritively sweetened beverage consumption and body weight: a systematicreview and meta-analysis of randomized experiments. Obes Rev, 2011. 12(5): p. 346-65
23. Gibson, S., Sugar-sweetened soft drinks and obesity: a systematic review of the evidence fromobservational studies and interventions. Nutr Res Rev, 2008. 21(2): p. 134-47
24. de Ruyter, J.C., et al., A trial of sugar-free or sugar-sweetened beverages and body weight inchildren. N Engl J Med, 2012. 367(15): p. 1397-406
25. Malik, V.S., M.B. Schulze, and F.B. Hu, Intake of sugar-sweetened beverages and weight gain: asystematic review. Am J Clin Nutr, 2006. 84(2): p. 274-88
26. Rosenstein, D. and H. Oster, Differential facial responses to four basic tastes in newborns. ChildDev, 1988. 59(6): p. 1555-68
27. Steiner, J.E., The gustofacial response: observation on normal and anencephalic newborninfants. Symp Oral Sens Percept, 1973(4): p. 254-78
28. Birch, L.L., Development of food preferences. Annu Rev Nutr, 1999. 19: p. 41-62.
29. Rozin, P. and T.A. Vollmecke, Food likes and dislikes. Annu Rev Nutr, 1986. 6: p. 433-56
30. Schwartz, C., S. Issanchou, and S. Nicklaus, Developmental changes in the acceptance of the fivebasic tastes in the first year of life. Br J Nutr, 2009. 102(9): p. 1375-85
31. McDaniel, M.R., E. Barker, and C.L. Lederer, Sensory characterization of human milk. J Dairy Sci,1989. 72(5): p. 1149-58
32. Emmett, P., K. North, and S. Noble, Types of drinks consumed by infants at 4 and 8 months of age:a descriptive study. The ALSPAC Study Team. Public Health Nutr, 2000. 3(2): p. 211-7
33. Erkkola, M., et al., Sucrose in the diet of 3-year-old Finnish children: sources, determinants andimpact on food and nutrient intake. Br J Nutr, 2009. 101(8): p. 1209-17
34. Karjalainen, S., et al., A prospective study on sucrose consumption, visible plaque and caries inchildren from 3 to 6 years of age. Community Dent Oral Epidemiol, 2001. 29(2): p. 136-42
35. Stephen, A., et al., The role and requirements of digestible dietary carbohydrates in infants andtoddlers. Eur J Clin Nutr, 2012. 66(7): p. 765-79
36. Mennella, J.A. and S.M. Castor, Sensitive period in flavor learning: effects of duration of exposureto formula flavors on food likes during infancy. Clin Nutr, 2012. 31(6): p. 1022-5
References

Through covering the centre with chocolate or compound coatings, theshelf-life of the product may be extended. This is primarily applicable tocentres that, if not covered, could be prone to moisture uptake/loss,oxidation, or microbial spoilage. Enrobing has some advantages over moulding (which is another method of getting a chocolate covered centre) such as greater production rates, lower capital costs.Enrobing often allow for greater production rates with lower capital costs than moulding2.
Enrobing process Enrobers are available in different sizes, suitable for large and small scaleproduction and there is a wide variety of different designs to meet allrequirements. Belt widths from 125 millimetres to 2600 millimetres are
available. Although the basic elements of an enrober have largelyremained unchanged over the years, the methods of operation anddegree of precision possible have changed significantly. This has beenaccompanied by a modest increase in throughput. The biggest change inthe manufacturing of chocolate enrobed sweets can be credited to theefficiency of the coolers. The basic layout of an enrober is shown inFigure 2 (page 37).
Processing a real chocolate always requires a tempering unit.Whether fitted with a temperer internally or externally, enrobers have thesame basic components (Figure 2, page 37). It is important that the centres entering the enrober are maintained at 21-24°C, and that theenrobing chocolate has the desired viscosity and rheological properties.Warmer centres may lead to possible bloom problems due to the
Enrobing is a process that involves covering a confection or snack with chocolate or chocolate coatings. Traditionally,this process was slow and involved manually dipping the pieces into melted chocolate by hand. As demand forchocolate-coated sweets increased, it became impractical or impossible to employ enough people to dip sweets intomelted chocolate to keep up with production demand. Enrobing can be carried out with chocolate or compoundcoatings (compound coating is a replacement product made from a combination of cocoa, vegetable fat, andsweeteners). An advantage of compound coatings is that they may set faster and no tempering (the process in whichchocolate masses are thermally treated to produce a small fraction of homogeneously dispersed, highly stable fatcrystals of the correct type and size) is needed1. Some typical examples of enrobed products are shown in Figure 1(page 37). They include wafer bars, fondant centres, jellies, nuts, biscuits and ice cream.
Enrobing in theconfectionery industry
New Food, Volume 17, Issue 1, 2014 36 www.newfoodmagazine.com
E N R O B I N G
■ Ramana Sundara, Ángel Máñez and Josélio Vieira Nestlé Product Technology Centre

residual heat increasing the chocolate temperature of the enrobedsweets. Cold centres can lead to blooming and cracking of the coatingshell due to expansion of the centre mass as it warms. Fat bloomdevelops in different ways. Automatic crystal conversion on the one handcaused by incorrect and/or insufficient tempering; on the other, it may be caused by fat migration from the filling where this fat pene-trates the chocolate coat and causes the cocoa butter crystals to rise through the surface. Loss of temper can also be due to heat damage.
The centres are fed on to a feed band and transferred to a wire belt,which passes through the enrober. The coating medium is maintained ata constant temperature and in a controlled condition in an agitated tank;it is then pumped to a flow pan. The flow pan aids the process by creatinga continuous curtain of coating and feeding a bottoming device. This
leads to the formation of a bed of coating, which floods the mesh band.The centres are passed through this curtain and bed and are covered onall surfaces. After the curtain, excess chocolate is forced off the productby an air blower and a licking roller is used to control the amount of massleft on underside of the sweet. There is normally a vibrator after theblower to remove excess chocolate and to improve the appearance of the sweet. Finally, there should be a detailing rod between and end of the wire belt and the start of the cooler belt. Following the curtain, usingan air blower, the excess chocolate is removed and a licking rollercontrols the amount of mass left on the underside of the sweets3.
The excess mass from the curtain falls through the wire mesh beltinto a sump, and is recirculated. Part of the mass is diverted through a de-temperer and is then re-tempered; blending of the freshly temperedand recirculated streams controls the overall level of chocolate in theenrober. Vibrating the centres removes ripples left by the fan, smoothensthe coating and removes any surplus chocolate returning it to the tank.
The centres are discharged from the enrober on to a cooling conveyorpassing over a de-tailer which is a rapidly spinning rod across the end ofthe wire band. This results in the removal of the tail that forms as thecentre leaves the wire band.
Cooling After enrobing, the product enters a cooling tunnel to allow the coatingto harden. To avoid blooming problems, temperature changes in thetunnel should be gradual, and the relative humidity properly controlled.If the dew point is lower than room temperature, moisture couldcondense on the product and cause sugar bloom during storage4. The chocolate coating and the filling are cooled down to approximately18°C to ensure trouble-free packaging. A good cooling tunnel should bedivided into three zones (Figure 3).
Convection chocolate cooling is a time-dependent but not energy-dependent process. A higher temperature and longer cooling time aremore favourable than a lower temperature and shorter cooling time. The recommended cooling times for pure dark chocolate, milkchocolate and milk chocolate with CBE portions are approximately six,eight and 12 minutes respectively. Milk chocolate requires a longercooling time than dark chocolate due to the higher milk fat content andconsequent lower solidification temperatures. Compound coatings may
E N R O B I N G
www.newfoodmagazine.com 37 New Food, Volume 17, Issue 1, 2014
Figure 1: Some examples of enrobed confectionery
Figure 2: Basic layout of enrobing line and components of an enrober2
(1) Sump; (2) Bottomer; (3) Flow pan; (4) Riser tank; (5) Blower (6) Wire belt; (7) Licking roller; (8) De-tailing rod; (9) Shaker; and (10) Heated extension trough
Figure 3: Temperature profile in the cooling tunnel5

require different cooling profiles i.e. adjusted to suit the settingproperties of the vegetable fat used. After cooling, a product which isshiny and resistant to handling should be available for packaging.
Product attributesPhysico-chemical properties of enrobed products are important for tworeasons. Firstly, if the crystallisation or flow properties are incorrect thisresults in a poor quality product being made, which may have to be soldcheaply as a misshapen product or perhaps has to be reworked.Secondly, sensory attributes are critical to the consumer’s appreciation.
An enrobed product is unlikely to be purchased of if it does not lookglossy, or worse still, if the fat has bloomed. One important visualcharacteristic of enrobed products is gloss. This is determined by thereflected light. If the surface is flat with a lot of small crystals, whichhappens with correct tempering and cooling, the product appears shiny6.Cocoa butter can solidify in different forms of crystals, where only thehigh melting forms βv and βvi are stable. A tempering machine can onlyeffect formation of the crystal form βv. This crystal form provides goodgloss, long shelf life and good mouldability. The βvi form is a super stablecrystal, which forms only after a longer period of storage6.
Chocolate or compound flow properties are decisive factors in termsof processing possibilities. The flow properties of a coating are verycomplicated because the viscosity is not a single value but is dependenton the speed of flow (technically as non-Newtonian fluid). Yield value (YV) is the shear stress required to initiate the flow of a coating. YV isrecorded in Pascal (or dynes/cm2). Plastic viscosity is then the forceneeded to maintain this flow once it is moving, which is recorded inPascal seconds7.
Enrobing of high-quality confectionery items nearly always requiresa low-viscosity coating with some reasonable yield value present. Theviscosity depends on the level of fat, emulsifier content, temper profile,particle size distribution and temperature. Low viscosity is required forquality lines, giving precise control of coverage to the enrober operators8.Without some yield value present, the chocolate would continue to flowdown the side of an enrobed piece before setting in the tunnel, resultingin 'skirts' or 'feet' on the bottom edge of pieces, and decorative markingswould be lost (Figure 4).
Generally, bubbles are not a major problem on enrobed items as thecoating is fluid enough for them to be displaced or burst by the blower.However, with thicker masses or some more difficult products, bubblescan be problem and action may be needed to minimise them. Each feedpipe to the curtain trough should have its outlet under the chocolatesurface to avoid incorporating air.
ConclusionsEnrobing creates opportunities for manufacturers to create varied,decorative (for example through the use of irregularly shaped inclusions)
confections to the ever-demanding consumer. Enrobing also presentssome advantages over moulding, by often allowing for greaterproduction rates with lower capital costs. With compound coatings, onecan increase speed even more due to quicker setting times.
The basic requirements to enrobe confectionery products haveremained unchanged for decades, however the methods used to controltheir operation and the degree of precision possible have changedsignificantly, accompanied by a modest increase in throughput.Products such as wafers, soft centres or cookies can be coated fully orpartially with chocolate or compound coatings. Special attention is paidto ensure reproducible and accurate product weights and a uniformbubble-free appearance. Perhaps the biggest change in the manufactureof chocolate enrobed confections has been in the efficiency of thecoolers. After cooling, a shiny and uniformly coated product should beavailable for packaging.
New Food, Volume 17, Issue 1, 2014 38 www.newfoodmagazine.com
E N R O B I N G
1. Hofberger, R. (2009). Chocolate enrobing fundamentals, The Manufacturing Confectioner, p. 59
2. Gray, M.P. (2009). Moulding, enrobing and cooling chocolate products: In “Industrial chocolatemanufacture and use”, ed. S.T. Beckett, Blackwell Publishing Ltd, p. 346-347.
3. Stansell, D. (1993). Sugar and chocolate confectionery: In “Food Industries Manual”, ed. M.D.Ranken and R.C. Kill, Springer, p. 361-397
4. Hofberger, R. and Tanabe, N.A. (2007). Chocolate and Cocoa: In “Handbook of food productsand manufacturing”, ed. Y.H. Hui and R.C. Chandan, Wiley-Interscience, p. 675-694
5. Richter, K. (2013). Chocolate process technology, Sollich KG, Germany, p. 4-19.
6. Voltz, M. and Beckett, S.T. (1997). Sensory of chocolate, The Manufacturing Confectioner, p. 49
7. Stauffer, M. (1998). Chocolate behaviour – what influences your selection, The ManufacturingConfectioner, p. 76-77
8. Huggins, C. and Seguine, E. (1997). Tempered chocolate handling – Piping and pumping oftempered mass, The Manufacturing Confectioner, p. 91-92
References
Dr. Ramana Sundara is a Fellow and Chartered Scientist of theInstitute of Food Science and Technology (UK). Currently, he isthe Manager of External Research Collaborations at NestléProduct Technology Centre, York, UK. He has published over 34 scientific papers / presentations and five patents, with anemphasis on fruits, vegetables, chocolate, dairy chemistry andprocessing technology.
Ángel Máñez is a Principal Product Technologist at NestléProduct Technology Centre for confectionery products in York,UK. Ángel joined Nestlé as a post graduate student and firstworked on research projects on the chemistry of cocoafermentation. Subsequent to that he gained experience duringtwo to three years in the area of cocoa processing. For the last
15 years with Nestlé, his main area of expertise has been closely related tochocolate manufacture and usage and in particular chocolate recipeformulation. As part of his present role he provides technical assistance tofactories, participates in projects to develop new products and processes andalso participates in the commissioning of new lines in factories.
Dr. Josélio Vieira is a Principal Research Scientist at the NestléProduct Technology Centre for confectionery products in York,UK. Josélio is a Chemist by training and holds a PhD degree inPhysical Chemistry from the University of Oxford. Aftergraduating, he worked for 11 years at Dow AgroSciences in the development of crop protection formulations in theFormulation Science & Technology group in Brazil and the UK. He then joinedNestlé at the Product Technology Centre in Beauvais, France, dedicated to icecream product technology development. After five years in France, Josélio was relocated to York where he now works in the Chocolate Department. His interests include colloidal and formulation sciences. Josélio has co-authoredand published a number of research papers and patents on chocolate and icecream technologies.
About the Authors
Figure 4: Effect of Yield Value on enrobing

SUPPLEMENT
Food GradeLubricants
SPONSORS
www.newfoodmagazine.com 39 New Food, Volume 17, Issue 1, 2014
41 ISO 21469: Why this InternationalStandard is on the rise Ashlee Breitner, Business Unit Manager, NSF International
47 Ensuring productivity: how food grade lubricationcertification provides best practice
© if
ong
/ Shu
tter
stoc
k.co
m
Specialty Lubricants

PURITY™ FG Sprays – Food Grade solutions for all your hard to reach places.
Our newest PURITY FG aerosol sprays now hit the mark right side up and upside down.
Use them for just about any NSF H1 spray application that requires Plant tough, Food safe
lubrication. Trust the one name that covers all your food grade needs – PURITY FG. Now
available in three new convenient sprays: PURITY FG2 with Microl MAX Spray, PURITY FG
Silicone Spray and PURITY FG Penetrating Oil Spray.
For the full story on PURITY FG
visit PurityFG.com | call: 1-866-335-3369 | email: [email protected]
Petro-Canada is a Suncor Energy businessTMTrademark of Suncor Energy Inc. Used under licence.
PURITY FG FITSWELL INTO YOUR GMP AND HACCP
PROGRAMS.
SRP .
EVEN IF YOUR WORLD
TURNS DOWN
there’s still a PURITYTM FG way to keep it going.
UPSIDE

© J
asen
ka L
uksa
/ Sh
utte
rsto
ck.c
om
The scope of this international standard goes beyond lubricants used infood applications to also cover lubricants used for processing high riskproducts including cosmetics, pharmaceuticals and animal feed. The intention behind the broadened scope of ISO 21469 is to provide
additional risk mitigation solutions for other product categories wherehygiene standards in manufacturing are of particular concern.
You may be asking why an article about a standard published in 2006 is so relevant now. In the past two to three years, certification to
The uptake of global food safety standards in recent years has prompted sectors throughout the food safety supplychain to implement more rigorous product safety measures, and the lubricants industry is no exception. In 2006, theneed for an internationally recognised set of requirements was made apparent to the International Organisation forStandardisation (ISO). This need was to establish a new, voluntary ISO standard for lubricants used in themanufacturing and processing of food and similar products. The document was titled ‘ISO 21469: 2006(E) – Safety ofmachinery – Lubricants with Incidental Product Contact’, by the Technical Committee ISO/TC 199, Safety of Machinery,and it specifies the hygiene requirements for the formulation, manufacture and use of lubricants which may comeinto contact with food products during processing.
ISO 21469: Why this InternationalStandard is on the rise
www.newfoodmagazine.com 41 New Food, Volume 17, Issue 1, 2014
F O O D G R A D E L U B R I C A N T S S U P P L E M E N T
■ Ashlee Breitner Business Unit Manager, NSF International

ISO 21469 has gained traction and now making an impact on the foodgrade lubricant industry and food safety proponents are taking notice. As more lubricant companies and production locations achieve ISO 21469 certification, and increasing audience of stakeholders – endusers, regulators, and lubricant manufacturers alike – are feeling the benefits.
“ISO 21469 goes beyond the requirements of H1 and covers thewhole lifecycle of the lubricant. The lubricant manufacturer is required toanalyse the hygiene aspects that arise fromhandling a lubrication product, and to advisethe user accordingly. So a food and beverageproducer can be assured that every effort hasbeen made to take their safe usage and hygienerequirements into account; all this whilstdelivering long-term lubricant performance and equipment protection,”stated Jesus Diaz, Market Manager at Klüber Lubrication München Se & Co. Kg.
What does international recognition mean?The development of this standard like many others was intended toensure uniformity of product safety and quality with a particular industry.The ISO 21469 standard appeals to lubricant manufacturers seekingcompliance to a single, internationally accepted standard that iscomprehensive enough to address lubricants used across multiple
industries and product sectors. International acceptance of this standard helps companies to gain access to new markets andcommunicate the safety and compliance of their products to end users,regardless of geography.
While international standards facilitate harmonisation of productrequirements, they also serve to facilitate more effective industrycoordination and eliminate barriers to international commerce. For countries where the food grade lubricants industry is less developed,
having an international standard levels the playing field for companies seeking to export their products into regions with higherlubricant demand. For example, the EmiratesStandardisation & Meteorology Authority(ESMA), the official federal body in the United
Arab Emirates, announced adoption of ISO 21469 as the mandatoryrequirement for incidental contact lubricants. This adoption in itselfexemplifies significant progress in minimising lubricant trade barriers forthe Middle Eastern market.
In addition to facilitating trade, certifications to ISO 21469 arestrategic tools that assist companies in tackling the most demandingchallenges facing businesses today. Efficiencies, cost savings,streamlined processes, and risk mitigation are key issues as companieswork to operate effective businesses and increase productivity.Achieving certification to an internationally accepted standard can
New Food, Volume 17, Issue 1, 2014 42 www.newfoodmagazine.com
F O O D G R A D E L U B R I C A N T S S U P P L E M E N T
© A
laet
tin Y
ILDI
RIM
/ Sh
utte
rsto
ck.c
om
certifications to ISO 21469 are strategic tools that assist companies in
tackling the most demanding challengesfacing businesses today

F L E X Y O U R O P E R A T I O N
If you want to squeeze every drop of performance out of your production
line, it begins with what you put into them. Bel-Ray high-performance
industrial lubricants are engineered to get the most out of your equipment.
Plus, they come packaged in an industry first, global compliant, multi-lingual label
system. So if your production line needs a little pick-me-up, that just means it’s
thirsty for Bel-Ray.
S E E T H E E N T I R E L I N E O F B E L- R AY P R O D U C T S AT B E L R AY. C O M .
C O N TA C T U S F O R A F R E E O N S I T E L U B R I C A N T S U R V E Y
© 2
013
Bel-R
ay C
ompa
ny, I
nc

translate to cost savings from optimised operations, enhanced customersatisfaction based on improved product quality, and increased market share resulting from a competitive marketing advantage. Further, certified companies may also reap environmental benefits byreducing the negative impacts from disposing of contaminated oradulterated products.
As one of the leading producers of food grade lubricating oil andgreases, Mrs. Zhaoying Yu-Zhu, Sales – Asia Area & Food Grade GroupProduct Manager of Axel Christiernsson has stated that they “are veryproud that our manufacturing facility dedicated to food grade products,has been certified NSF ISO 21469 since 2009. ‘NSF H1 certified’ is a goodway to guarantee our products meet the food grade lubricantrequirements. In addition, certification by NSF to ISO 21469 provides us astronger safety insurance regarding manufacturing process towards ourcustomers. With ISO 21469 certification, it allows us to differentiatecompared to other non-certificated manufacturers. This also gives us acompetitive advantage to expand our distribution internationally.”
How is ISO 21469 raising the bar?Companies seeking to demonstrate their commitment to quality byapplying for ISO 21469 certification are thoroughly evaluated to ensurethat their products meet particular hygiene requirements for theformulation, manufacture, and use and handling processes of lubricantsthat may have incidental product contact. ISO 21469 certificationrequires lubricant manufacturers to develop a hygiene strategy and toconsider chemical, physical and biological hazards in the context of thelubricant end use.
ISO 21469 certification covers four key assessment elements for achieving and maintaining annual certification. These include: 1) an initial formulary and label review of the ingredients in thelubricants; 2) annual testing of certified product; 3) a completed risk assessment for all products certified; and 4) annual productionfacility audit.
Formulary and label reviewThe company or its suppliers shall submit complete formulationinformation for all components of a product submitted for evaluation
F O O D G R A D E L U B R I C A N T S S U P P L E M E N T
Figure 1: Once all assessment elements have been completed satisfactorily,products can then be marked as ISO 21469 certified

and certification. Ingredients used in certified lubricants with incidentalproduct contact shall meet specific regulatory and safety requirements,for the appropriate end use of the product.
The label review for certification ensures that language specified on the label of a certified product clearly and correctly identifies thefollowing: product shelf-life, storage conditions, product size / volume,suitability of the product for use as an incidentalfood contact lubricant, and any productlimitations and / or restrictions. The label reviewalso verifies that products requiring registrationunder the US Environ mental ProtectionAgency’s (EPA) Federal Insecticide, Fungicide,and Rodenticide Act (FIFRA), are appropriately registered.
TestingProduct samples are to be analysed by Fourier Transform InfraredSpectroscopy (FTIR). FTIR analysis provides a highly specific measure ofmaterial identification by comparison of a test sample spectrum with areference spectrum. This annual testing serves as a quality control checkin the ISO 21469 certification to again verify the formulations of thecertified product are consistent in their qualitative composition.
Risk assessmentCertification to ISO 21469 requires that the lubricant manufacturercomplete a risk assessment addressing the potential sources ofcontamination during production of the lubricant. The risk assessment isdesigned to ensure that all potential risk factors in the possiblecontamination of a certified lubricant have been defined, measured andquality controls have been set in place to ensure that those risks aremitigated on an ongoing basis.
AuditIn order to gain and then maintain certification, an annual productionfacility audit must be conducted and corrective actions resolved. Audits are a critical piece to aide in ensuring that the products originallycertified are those that are being produced each and every timeproduction is run. Audits include actual production facility walk-throughto inspect maintenance of equipment in accordance with GoodManufacturing Practices, verification of risk management pro-cedures, review of supplier qualification records, verification of rawmaterials, review of labeling of certified product and any additionalcontrol measures necessary to guarantee quality product. Additionally, the audit scope may be influenced by corrective or preventative actions or other necessary measures for minimising hazards identified inthe risk assessment.
At the point in which all of the elements have been completedsatisfactorily, products can then be marked as ISO 21469 certified (see Figure 1, page 44).
As stated by Rocol Lubricants: “The positive effects of ISO 21469 arefelt by many stakeholders: Lubricant manufacturers seek ISO 21469accreditation as the highest accolade that can prove their suitability forfood grade applications. Auditors are reassured by the presence of accreditation as it allows full traceability of the lubricant manu facturingprocess. Food manufacturers prevent contamination of their productsand reduce waste whilst supplying safe products to major super-
markets and other distributors. Consumers are protected against thepossibility of eating a product which is tainted with hazardous material.Once ISO 21469 certification is achieved it proves that a lubricant ismanufactured in a hygienic environment, using both best practices and the safest ingredients.” The impact that ISO 21469 certified products have on all stakeholders of the lubricant industry is significant.
Effectively managing risks in their supply chain ispriority number one for today’s food andbeverage companies.
ISO 21469 is a voluntary standard but thefood industry has already recognised the valueand benefits of it as they are proactively
adopting ISO 21469 into their lubricant purchasing specifications. Thevalue of ISO 21469 certification for end-users is that it provides addedassurance that the lubricant formula meets food safety requirements,label information is accurate and traceable and lubricant manufacturingand packaging conditions are hygienic.
Food adulteration due to contamination by traditional lubricantscan result in product recalls and be costly, both to the bottom line and acompany’s reputation. The benchmarks the lubricants industry is strivingtowards – increased efficiency, cost reduction, streamlined processes,and risk mitigation – can be synonymous with making a safer lubricantproduct. For companies focused on protecting and improving theintegrity of the food supply chain, ISO 21469 is the standard that helpsbrings both worlds together.
To access the most current list of ISO 21469 certified products, please visit: www.nsf.org
When faced with managing chemical risks, the choice is clear.Only the NSF Mark provides you with the assurance that a product’s safety has been independently verified by the leading experts in public health and food safety. Look for the NSF Mark on all lubricants, cleaners and other products used in food and beverage processing.
Visit the NSF WhiteBook™, the industry sourcebook for food processing chemicals today.
www.newfoodmagazine.com 45 New Food, Volume 17, Issue 1, 2014
F O O D G R A D E L U B R I C A N T S S U P P L E M E N T
Food adulteration due to contamination bytraditional lubricants can result in product
recalls and be costly, both to the bottomline and a company’s reputation

Improving Efficiency, Performance and Quality –Safer food with CASSIDA food grade lubricants
The CASSIDA portfolio for the Food and Beverage Industry covers a full range of food grade lubricants, including speciality oils and greases. Our products fulfil the highest safety and quality standards and are registered by NSF International in category H1 and certified according to ISO 21469 standard as well as Kosher and Halal regulation.
The performance of CASSIDA food grade lubricants, coupled with FUCHS LUBRITECH‘s expert knowledge and service support, allows plant efficiency to be increased, maintenance costs to be reduced and the level of food safety to be improved.
Get to know the CASSIDA food grade lubricants for the Food and Beverage Industry at:
www.cassida-lubricants.com
HIGHEST SAFETY FOR THE FOOD AND BEVERAGE INDUSTRY

Eduard Stempfel, Global Product Manager and Application Specialist atFUCHS LUBRITECH, explains that although the same production facilitiescan be used for food grade lubricants as well as for standard products,more stringent rules are applied in order to achieve the highest purity
levels and avoid the possibility of cross-contamination. “Productionfacilities must be certified to ISO 9001/14001 as a minimum for the manufacture of lubricants for the food/feed and beverage processing industry. Since 2006, the ISO 21469 standard specifies
Effective lubrication of food processing equipment is increasingly important, with manufacturing operations beingexpected to run continuously and equipment having to endure conditions such as extreme temperature swings andcontamination-prone environments. Frequent water washouts can contaminate and wash away lubricant, and all ofthese factors can affect the productivity of machinery; making it more important to choose the right food gradelubricant. There are also rigorous certifications that need to be achieved to ensure equipment lubricants aremanufactured in a hygienic environment, using both best practices and the safest ingredients.
Ensuring productivity: how food grade lubricationcertification provides best practice
F O O D G R A D E L U B R I C A N T SS U P P L E M E N T
www.newfoodmagazine.com 47 New Food, Volume 17, Issue 1, 2014
© T
ina
Renc
elj /
Shu
tter
stoc
k.co
m

the hygienic requirements for lubricants with incidental productcontact,” he explains.
There is, however, a significant difference between productregistration only (e.g. H1) and ISO 21469 certification. The ISO 21469consists of a full risk assessment for the entire lubricant manufacturingplant and a physical yearly audit including formulation review, processreview and sample taking and testing. ISO 21469 currently represents thehighest standard for food safety, specifically dedicated to manufacturingand handling of food grade lubricants. “Including FUCHS, there are onlyseven companies (11 legal entities) with 11 different lubricantmanufacturing plants currently certified against this standard by NSF International,” reveals Stempfel.
According to Stempfel, there have been an increasing number oflubricant suppliers who have incorrectly claimed their products are ISO 21469 compliant over the years just because compliance does notnecessarily mean certified. NSF International’s ISO 21469 certificaitonprogramme is accredited by the American National Standards Institute(ANSI) and provides independent, third party assessment of a lubricant’scompliance with the hygiene requirements established by the standard.NSF International is the only organisation currently carrying out fullphysical audits following an accredited scheme, which includes full risk assessment, sample testing and formulation and paperworkreview. “Food and beverage manufacturers should investigate theinformation they have been told by their lubricant supplier,” suggestsStempfel. “It’s just a case of visiting the NSF ISO 21469 certificationwebsite which is a transparent and verifiable approach that ensuresthere are no questions as to whether a company or manufacturing plant is ISO 21469 certified.
“NSF ISO 21469 certification combined with NSF H1 registrationassures the food manufacturer that the product is the safest food gradelubricant. This, in turn, means that when the food manufacturing plant isaudited for food safety according to IFS ISO 22000 or other standards, theauditors will recognise that the lubricants in useare of the highest safety standards and can beeliminated as potential chemical or physicalhazard sources in the plant’s HACCP audit. NSFISO 21469 certification is a very importantcontribution of a lubricant manufacturer to theGlobal Food Safety Initiative (GFSI). FUCHS iscommitted to the GFSI and the FUCHS group of companies currentlyoffer more than 160 NSF ISO 21469 products from three different ISO 21469 certified manufacturing plants.”
UK food grade lubricants specialist ROCOL® is working more closelythan ever with food and beverage processors to help eliminate plant andmachinery safety risks. “A year on from the horsemeat scandal, and in anera of even greater food chain traceability, we are working to eliminatesafety risks and restore consumer confidence,” says Joanne Ferguson,Marketing Manager at ROCOL®. “Since that scandal, total supply chainintegrity has become vital to give retailers and consumers credibleassurances about product safety – and for processors this includes beingcareful about lubrication choices. Making the right choice meansinsisting on the use of independently-certified NSF H1 registeredlubricants only.”
NSF H1 registration demonstrates that a product has been reviewed by NSF to ensure it complies with the latest safety standards. Once
checked and certified, the lubricant is deemed safe for use in factoriesproducing food, drink, cosmetics and animal feeds, and is guaranteed to be manufactured only of 21 CFR compliant ingredients. Accord-ing to Ferguson, for more comprehensive assurance, processors shouldalso look for lubricant manufacturers who are ISO 21469:2006 certified:“Like NSF H1, this certification is globally recognised and ticks
an important box for EFSIS/BRC auditors as it provides highly credible, independentassurance that products are formulated,manufactured and supplied hygienically andsafety. So important is ISO 21469:2006, that in2010 ROCOL® took the decision to invest in becoming the first UK lubricants manu -
facturer to achieve certification; enabling processors to take advantageof this additional layer of safety assurance.”
ROCOL® has developed smart solutions for ever more specificapplications, which keep machinery at peak performance withoutcompromising on safety. And thanks to the company’s in-house researchand development team, its FOODLUBE® range of food grade lubricantscontinues to grow. Ferguson explains: “Typifying ROCOL®’s continuousinnovation over the past 12 months is the company’s new FOODLUBE®Auto SF – a food grade NSF H1 registered semi-fluid grease which deliversefficient and effective lubrication in even the smallest bore pipework,and was specifically developed to overcome the potentially costly issueof pipe blockages and splitting in automated lubrication systems withclear processing environments.
“Another recent development enables bakeries and other industryconveyor operators to minimise the problem of messy black depositsbuilding up in high temperature applications. FOODLUBE® XT Chain
New Food, Volume 17, Issue 1, 2014 48 www.newfoodmagazine.com
F O O D G R A D E L U B R I C A N T SS U P P L E M E N T
UK food grade lubricants specialist ROCOL® is working more closely than
ever with food and beverage processors to help eliminate plant and
machinery safety risks
© Robert Sprig
gs / Shutte
rstock.com


Fluid™ combines easy application and maximumpenetration of moving parts with a formulation thatreduces friction and wear whilst improving plancleanliness and hygiene.”
Lubricant manufacturer Lubriplate Lubricants hasa complete line of high-performance NSF H1 registeredfood machinery grade lubricants that are designed toprovide total food processing and bottling plantlubrication capability. “Manufactured incompliance with strict ISO 21469 and ISO 9001 registered quality assurancestandards, these lubricants are formulated fromthe highest quality base stocks combined with state-of-the-art anti-wear additives. They deliver a number of significant, costeffective advantages, which include extended lube and fluid changeintervals, multiple application capability, lubricant inventoryconsolidation and improved performance,” explains Jim Girard, VicePresident and Chief Marketing Officer at Lubriplate Lubricants Company.
“All Lubriplate H1 lubricants are manufactured with ingredients thatcomply with FDA regulation 21 CFR 178.3570 for lubricants withincidental food contact. They meet NSF H1 safety standards and are
authorised for use in federally inspected meatand poultry plants. Clean, safe and non-toxic,their use can eliminate lubricants andlubrication as potential chemical hazards inHACCP programmes.”
Lubriplate NSF H1 lubricants include:Synthetic fluid lubricants and greases; USPwhite mineral oil-based oils and greases; ovenchain lubricants; refrigeration compressor fluids; cleaning and flushing fluid; and H1aerosol spray lubricants. Many LubriplateNSF/H1 registered greases are formulated with aUSA Environ mental Protection Agency-regis -tered anti-microbial additive. “Our products alsocome with the exclusive, complimentary,Lubriplate ESP Extra Services Package, whichincludes a plant lubrication survey by a factorydirect representative, lubrication schedulingsoftware, machinery lubrication tags and follow-up lubricant analysis,” says Girard. “The lubricants are available through masterdistributor FINKE Mineralolwerk GmbH.”
Finding a lubricant that meets stringentfood safety standards, provides lubrication even
Lubriplate Lubricants CompanyNewark, NJ 07105 USA / +01-973-465-5700 / [email protected] / www.lubriplate.com
Finke Mineralölwerk GmbHRudolf-Diesel-Straße 1 / 27374 Visselhövede Deutschland www.finke-oil.de / E-mail: [email protected] Finke-Lubriplate Hotline +49 (0) 4262 79 95 28
Food Safety Is Job One!Lubriplate NSF H-1 Registered Lubricants do more than keep your machinery
running in optimum condition. These safe, non-toxic lubricants free you from
the potential chemical hazard risks posed by conventional lubricants.
In fact, using 100% Lubriplate H-1 Lubricants throughout your plant can
significantly simplify your HACCP program by completely
eliminating lubrication as a potential chemical hazard.
High Performance Synthetic & USP White Mineral Oil-Based Lubricants
NSF H-1 Registered Food Grade for Safe, Non-Toxic Lubrication
FDA Compliance
Lubriplate® H-1 Lubricants
Authorized Lubriplate Master Distributor For Europe:
With Regulations 21.CFR 178.3570, 21.CFR 178-3620
21.CFR 172-878, 21. CFR 172.882 & 21.CFR 182
F O O D G R A D E L U B R I C A N T SS U P P L E M E N T
New Food, Volume 17, Issue 1, 2014
© if
ong
/ Shu
tter
stoc
k.co
m

your global specialist
Maximum food safety, maximum production output, minimal costs: Klüber Lubrication helps you achieve all these goals more easily. Our high-performance NSF H1-lubricants are ISO
They are available for all branches of the food-processing industry, for all components and tricky special cases. Our experts will provide you with support, from consulting to optimum lubrication management, ensuring more safety
Klüber Lubrication: 80 years of experience and professional services for your success.
[email protected]/newfood
Certifi ed speciality lubricants for the best possible taste.
under tough conditions helps to reduce downtime and saves time andmoney, is a challenging task for even the most experienced plantmanager. “Without regular maintenance and proper lubrication, foodcontamination of the lubrication system can also cause harm to a plant’svital equipment,” explains Michael Colquhoun, Category PortfolioManager – Food Grade Lubricants at Petro-Canada Lubricants.
Confectionery processing is one area in which cost savings andincreased equipment performance can be achieved. Chocolate inparticular is an exceptionally fine and abrasive product which makesquality lubrication essential to manufacturing processes. For example,Cadbury Limited’s production facility, located in North Wales, facesunique maintenance challenges due to the nature of its product. “TheCadbury site produces over 7,000 tonnes of finished product (drink-ing chocolate) and around 4,000 tonnes of bulk material (cocoa liquor,cocoa butter, cocoa powder) per year, for use at other Cadburymanufacturing sites,” says Colquhoun. To help manage this, Cadbury enlisted the help of Paul Needham of AV Technology at CadburyLimited, to monitor and handle their equipment maintenance. In providing the Reliability Engineering consultation for Cadbury, AT Technology switched the lubricant used in Cadbury’s Duyvis CocoaPresses to Petro-Canada’s PURITY™ FG AW 46 Hydraulic Fluid.
Needham explains: “Switching to Petro-Canada Lubricants’ PURITY™FG has reduced costs, increased our up-time and improved theperformance of our equipment. We have over 10 years of experience with Petro-Canada and are pleased with the performance that their fluid has provided.”
The hydraulic system in the cocoa press has a capacity of 1,015 litresand works at a system pressure of 510 bar. With this pressure systemalong with the product’s fine, abrasive powders, a strong lubricant isneeded to protect the equipment. “Using premium products like Petro-Canada Lubricants’ PURITY™ FG food grade line, in combinationwith proper maintenance procedures, can help extend service life, lowerfluid consumption and reduce operating costs,” explains Colquhoun.
With more than 30 years of experience in manufacturing, formulatingand blending Group II and III base oils, Petro-Canada Lubricants deliversa diverse line of high quality, innovative lubricants to meet an ever-increasing range of international specifications. Colquhoun concludes:“PURITY™ FG lubricants are NSF registered, acceptable for use in Canadian food processing facilities and have Kosher, Pareve and Halal certifications. PURITY™ FG lubricants are a perfect fit forHazard Analysis and Critical Control Points (HACCP) and good manu -facturing practice.”
New Food, Volume 17, Issue 1, 2014
F O O D G R A D E L U B R I C A N T SS U P P L E M E N T
© w
acom
ka /
Shut
ters
tock
.com

Consumers have become distrustful of meat and meat containing food productsbecause of the ever increasing cases of meat adulteration during recent years. A few examples include the dyed andchemically treated pork, and horsemeat soldand misrepresented as beef. Detection ofspecies adulteration in meat products isimportant for consumer protection. Properfood labelling is essential in order to preventmisleading consumers. Importantly, as thereare religious limitations of certain foodproducts such as pork meat and some peopleare allergic to certain meat proteins, amethod that enables rapid discriminatoryanalysis of meats is urgently needed.
Species identification in meat has proved to be difficult, costly and time consuming. A range of variables influences raw meat, for example breed, age, feeding, storing time and conditions. Fresh, raw meats also requirefast and careful handling and thus its analysismust be rapid. Here, we present a method for the detection of raw beef and pork meatusing Hyperspectral Image Analysis.
Results and discussion
All meat observations were converted intoobjects and subjected to a PLS-DA analysis.The result reveals three distinct clusters(Figure 2). Pork and beef were clearlyseparated along the x-axes (t1) and beeftenderloin and beef rib eye were separated
along the y-axes (t2) indicating a trend fordifferent fat content along t2.
Interestingly, the pork tenderloin and themarinated pork tenderloin were groupedtogether (Figure 2). This indicates that themarinade and the difference in colour do not influence the detection of pork meat in dimension t1 and t2.
The hyperspectral image also indicates three groups (Figure 3). This is shown asdifferent colour schemes. Both types of pork tenderloins have an orange colourcompared with the beef steaks that are more turquoise / yellow. The beef rib eye has a greener colour shade than the beeftenderloins. Fat is coloured in blue (Figure 3).Hyperspectral Imaging makes detection,discrimination, classifica¬tion of meat andmeat products easier. This can be applied inroutine quality control for the food industry.
Experimental set-up
Vacuum packaged raw meats (beeftenderloin, beef rib eye, pork tenderloin and marinated pork tenderloin) were sliced and placed on disposable paper platesand analysed with the UmBio Inspector(Figure 1). The hyperspectral image cubeswere generated in diffuse reflectance with a line scanning (push-broom) short waveinfrared (SWIR) camera in the spectral range
of 1000 – 2500 nm. The data was convertedautomatically to pseudo-absorbance andprocessed with the hyperspectral imageanalysis software Evince (UmBio AB, Umeå, Sweden).
Conclusion■ The UmBio approach offers rapid
and non-destructive analysis on all types of meat
■ This technique permits analysis ofmultiple individual meat productssimultaneously
■ Characterisation of meats can beperformed in real time
■ Deviating products are detected in seconds
■ Fresh meats may be returned to coldstorage within seconds
■ No sample pre-preparation, no solvents,and no wet-chemistry laboratory wereneeded in this analysis and no hazardouswaste was generated in this study.
For further information please contact UmBio:UmBio AB, Norra Obbolavägen 131A, 904 22 Umeå, Sweden, Tel: +46 (0)90 – 171170 www.umbio.com
APPLICATION NOTE/FOOD
NIR HYPERSPECTRAL IMAGING:
Beef or pork? Real or fake? Near real-timecharacterisation of meats
Do you know what’s on your dinner plate?
Figure 1: Analysis set-up: raw meat on a paper platewas removed from cold storage for analysis with theUmBio Inspector. The meat was returned to coldstorage seconds later.
Figure 2: PLS-DA score plot revealing three distinctclusters. Beef and pork are separated along t1.
Figure 3: A Hyperspectral Image generated from the analysis. Variations between the different types of meat are depicted as different colors which enable fast and easy detection.

Food fraud may relate to compositional issues, e.g. certain constituentshave been removed, added or substituted. Examples are product-foreignproteins or nitrogen-replacers in milk powders or hazelnut oil substitutingolive oil, water addition to meat, husks to coffee, etc. Another category infood fraud concerns the product’s history, i.e. geographical origin,production practice (organic, animal welfare considering, sustainable,halal, etc.), and processing.
Food fraud risk: prevention and detectionAlthough negligence of rules and agreements plays a role, premeditationis the main issue in food fraud. Food fraud differs from most safety issuesin that fraudsters intentionally aim at deceiving targets by foodadulteration or counterfeiting for their own economic gain. Food fraud isa crime of calculation, not of passion. Although the primary intention of
the fraudster is not to harm people, it may still result in serious foodsafety issues. Examples include the melamine case in China in whichseveral infants died, dioxin problems in oils of unknown provenance, andanti-freeze in wine.
Rather than looking at specific incidents, a system analysis approachwould be the preferred approach to prevent fraud in the future. Forinstance, by studying why putting melamine in products was perceivedas a good fraud opportunity and how it could have been prevented.Generally, three things must be present for a fraudster to set to work: theopportunity to commit fraud, the incentive to commit fraud and the fraudster’s ability to rationalise their own actions2.
Although risk assessments exist for food safety and defence issues,fraud temptation has never been taken into account. A science-basedassessment of fraud risks requires an interdisciplinary, inter-sectoral
Nowadays foods and ingredients are sourced from many different parts of the globe. Since the 1960s, global foodtransport has been increasing at an exponential rate, faster than food production itself. For certain countries, thisnetwork ensures access to any food item regardless of season or origin. The number of countries relying oninternational food trade has increased and traded food changed from raw materials towards processed and brandedproducts. As a consequence, trade fluxes between countries to form a complex, extensive, intersecting network1.Optimised for rapid, low-cost production from all sources, it has consequently resulted in fragile networks that arevulnerable to food fraud that reaches every table in the world.
Food fraud and NIRS
N E A R I N F R A R E D
www.newfoodmagazine.com 53 New Food, Volume 17, Issue 1, 2014
■ Rob Frankhuizen ■ Saskia van RuthScientist, State Institute for Quality Control of Agricultural Products, Head of Authenticity & Novel Foods Business Unit RIKILT Wageningen University and Research Centre and Professor of Food Authenticity and Integrity,
RIKILT Wageningen University and Research Centre
© Mila Atkovska / Shutterstock.com

approach, i.e. an integrated analysis of technically feasible fraudopenings, complexity of supply network structures, fraudster behaviour,safety management systems, as well as analytical detection methods.Since no one – producers, traders, importers,retailers and consumers – likes to be swindled,fraud prevention and detection is an importantissue. Nowadays, authenticity of ingredients orproducts is mainly warranted by certificationprocesses. Analytical tests which can help toconfirm the authenticity of ingredients / products compose a very usefulcomplementary approach to paper trailing.
Analytical methodsTraditional strategies for food auth -entication rely on the determinationof a marker compound or com -pounds and the comparison of the obtained values with thoseestablished for genuine material.Examples include macro-componentcontents such as protein, fat,moisture and ash. The presence of anundesired adulterant in the situa-tion of compositional fraud can beuncovered by checking for itspresence in the food material, e.g.melamine in milk powders. However,an adulteration can be detected onlyif the adulterant is known beforehandand explicitly searched for by theanalyst based on this conventionaltarget analyses. Although with multi-methods several potential adulter -ants could be detected, it is notpractically feasible and financiallyimpossible to analyse foods for all
potential adulterants. Furthermore,some aspects of food authenticitysuch as the geographical origin, thefarming management systems(organic, free range, etc.), or theapplication of some specific pro -cesses cannot be dealt with thosetraditional approaches. For instance,no single markers exist for theunequivocal authentication oforganic eggs or sustainable palm oil.
For these issues, a more holisticapproach is needed based on themeasurement and the evaluation of a pattern of compositionalproperties of the product at once, i.e.a fingerprinting approach comparinganalytical properties of groups ofproducts while taking into account
the natural variation. Moreover, in industrial and laboratory settings,there is always the need for screening methods that are able to reliablyidentify those products that are potentially non-compliant before more
detailed and accurate analysis with con -firmatory methods is performed, i.e. the traffic light approach. Fingerprints can begenerated with a wide range of analyticaltechniques. They can be obtained from chrom -ato grams, spectroscopic measurements,
spectral measure ments or any other specific signal of complete spectra.The approach requires chemometrics in order to elucidate relationshipsbetween samples and to detect characteristic patterns that can be used to identify a certain material.
New Food, Volume 17, Issue 1, 2014 54 www.newfoodmagazine.com
N E A R I N F R A R E D
Figure 1: Change in water/protein contents in imported poultry meat in the Netherlands in the last decade measured byclassical wet chemistry analysis
Figure 2: First three dimensions of the Principal Component Analysis of poultry meat. Samples marked in blue aresamples from the control scheme, samples in green are adulterated samples. Blue samples outside the blue circle arepoultry cuts (thighs, legs, etc.)
Rather than looking at specific incidents, a system analysis approach
would be the preferred approach to prevent fraud in the future

Near-infrared spectroscopy and food fraud detectionNear-infrared spectroscopy (NIRS) is one of the techniques that can beused for food authentication, either as a rapid alternative techniquereplacing a more laborious reference method or as a fingerprintapproach. Its potential was discovered in the 1960s and the techniqueinvolves the measurement of a material’stendency to absorb light in a certain area ofelectromagnetic radiation. The resultingspectrum is a fingerprint of the material. Thenear-infrared portion of the electromagneticspectrum extends from 800 to 2,500nm,between the conventional mid-infrared region at longer wavelengthsand the visible range at shorter wavelengths. The NIR spectrum ischaracterised by overtones and combination of the fundamentalmolecular vibrations of molecules containing C-H (e.g. in carbohydrates),N-H (e.g. in proteins), or O-H (e.g. in water)groups. The absorbance level at these specificwavelengths is generally proportional to thequantity of that constituent in the material3,4.
In view of food authentication, NIRS as arapid alternative to targeted analysis withreference methods have been described todetermine the major constituents of, forexample, milk, milk powder, casein, butter andcheese with an accuracy similar to the accuracyobtained with the wet chemistry5,6; fat, water,protein, cholesterol, collagen and mineralcontents of meat7; measurement of the iodinevalue of edible oils; caffeine in coffee; andethanol in alcoholic beverages4.
Furthermore, NIRS have been applied in thefingerprint approach to detect compositionaladulteration e.g. orange juice adulteration8,raspberry puree adulterations with apple puree9
and adulteration of pomegranate juice withgrape juice10. Other studies on compositionaladulteration include the identification of cattle,llama and horsemeat by NIRS11 and quantifica -tion of pork, fat trimming and offal in mincedmeat12. With regard to product history, someexample studies demonstrate the use of NIRSfor discrimination between organic andconventional production practices in asparagusproduction13, the reflection of cow feedingregimes in the spectral characteristics ofcheese14, and discrimination between fresh anddefrosted fish15.
NIRS and food fraud example: single marker and fingerprint approachfor poultry meatAs an example of the potential of NIRS for foodauthentication, the results of an investigationthat has been carried out in the authors’research group will be shown. The water
content of poultry meat varies with e.g. the birds’ breed, age, andproduction parameters. The water / protein ratio is an importantparameter in legislation regulating the import of poultry meat into theEU, and a limit of 3.40 applies for a chicken breast’s water to protein ratio.The mean water and protein contents of poultry meat imported into the
Netherlands analysed by wet chemistryreference methods has shown an increasingtrend in water / protein ratio over the lastdecade (Figure 1, page 54). This may be due to avariety of reasons. Although the EU regulationsprescribe the classical wet chemistry methods,
rapid alternatives are useful for screening purposes. In the present study, NIR spectra of a large group of poultry meat
samples were generated. The spectral information was used todetermine water and protein contents in poultry meat with the method
Rapid Oil Analysis with
FT-NIR Spectroscopy
FT-NIRInnovation with Integrity
Bruker offers solutions for the entire process of oil production and processing.
Analysis of incoming oil seeds
On-line monitoring of the extraction and refinery processes
Quality control of the finished oils and fats
Monitoring of frying oil degradation
Ready-to-use calibrations are available for a quick and efficient start.
Contact us for more details:
www.bruker.com/FT-NIR [email protected]
N E A R I N F R A R E D
New Food, Volume 17, Issue 1, 2014
Traditional strategies for foodauthentication rely on the determination ofa marker compound or compounds and the
comparison of the obtained values withthose established for genuine material

New!Sanitary DesignNIR Food
Analysis
calibrated against the wet chemistry reference methods. Furthermore,the spectral data was used as fingerprints in order to distinguish groupsof samples. Regular poultry meat samples (176) as part of an EU controlscheme (EC Regulation No. 543/2008) and 10 chicken breast sampleswith water and retaining agents added were subjected to analysis. After grounding and homogenising, the samples were analysed for theirmoisture and protein contents according to the classical wet chemistrymethods (ISO 1442 and ISO 937 standards), respectively. For NIRSanalysis, samples were packed into a circular large sample cup (140mm Ø by 14mm depth) and placed into the NIR spectrophotometer16.The samples were scanned in transmission in the low near infraredregion (from 850-1050nm). The NIR spectra of 151 chicken breastsamples were then compared to those in a database which includedover 20,000 sample spectra of different sample types and associatedreference values and included poultry meat. The moisture and proteincontents were calculated using the mathematical algorithms of theArtificial Neural Network model. Model predictions and wet chemistryresults were compared. The NIRS results were quite reproducible andcorrelated well with the wet chemistry results. The accuracy of the NIRSresults was similar to the accuracy of the wet chemistry methods andtherefore, a rapid alternative for the wet chemistry methodology.
In addition, the NIR spectra of the total test set (186 samples ofpoultry meat) were subjected to Principal Component Analysis (PCA).PCA of the data revealed that all prepared samples were well separatedfrom the regular samples (Figure 2, page 54). A centre group composedof chicken breasts was separated from the group consisting of poultrycuts (thighs, drumsticks, legs, etc.) with bones. The chicken breastsamples with added water and retaining agents were separated from the
regular chicken breasts in the second dimension which is promising inview of food fraud detection.
Other food authenticity studies of the authors’ with NIRS includediscrimination between wild and farmed salmon17, general anomalydetection in milk powders with regard to nitrogen-replacers such asmelamine, ammonium chloride, caprolactam, diammonium, phosphateand polyvinylpyrrolidone17, geographical origin of coffee beans, andsaffron adulteration.
Food fraud prevention future perspectivesIn the future, when we have better understanding of the technological,criminological and situational factors that increase the risk of food fraud,dedicated food fraud assessments can be included in existingmanagement systems. Rapid analytical detection techniques, which canscreen for general anomalies in-/on-/at-line will help to control foodauthenticity. NIRS and hyperspectral imaging techniques are importanttechniques in this respect. Abnormal samples may then be subjected tofurther advanced confirmatory analyses in the laboratory.
1. Ercsey-Ravasz, M., Toroczkai, Z., Lakner, Z., Baranyi, J. (2012) Complexity of the InternationalAgro-Food Trade Network and Its Impact on Food Safety. PLoS ONE 7(5): e37810.doi:10.1371/journal.pone.0037810
2. Bussmann, K.-D. (2007). Economic crime: people, culture and controls.The 4th biennial GlobalEconomic Crime Survey. PricewaterhouseCoopers. pwc.com/crimesurvey
3. Stark, E., Luchter, K., and Margoshes, M. (1986). Near-Infrared Analysis (NIRA): A Technology forQuantitative and Qualitative Analysis, Appl. Spectrosc., 22, 335
4. Niemöller, A., Behmer, D. (2008). Use of Near Infrared Spectroscopy in the Food Industry. In: Non destructive testing of food quality, J. Irudayaraj & C. Reh (Editors), Blackwell PublishingProfessional, Ames, Iowa, USA, pp. 67-118
References
N E A R I N F R A R E D

Corona extremeThe new ZEISS spectrometer system for agribusiness
READY FOR EXTREMES
N E A R I N F R A R E D
Rob Frankhuizen studied Analytical Chemistry at the ChemicalCollege in Leiden and Delft and Environmental Control at theTechnical College in Amsterdam. From 1969 to 1976, he workedas a chemical engineer at the The Rijnland District WaterControl Board in Leiden. In 1976, he started as a ResearchAssistant and since 1992, has worked as a Scientist at the StateInstitute for Quality Control of Agricultural Products (which is atpresent RIKILT Wageningen University and Research Centre in the Netherlands)with the implementation of instrumental techniques and related analyticalchemistry. Since 1980, he has carried out research in the field of quality control,authentication and processing of a wide variety of food and feed products usingNIRS in combination with chemometrics. He managed the Product Compositionresearch programme from 2006 to 2009. From 1992 to 2010, he also acted as anindependent NIRS Consultant and Assessor for the Dutch Accreditation Council(RvA). Rob has published more than 40 scientific papers, written around 80 RIKILTreports and participated in numerous national, EU and global projects /committees / networks.
Saskia van Ruth has headed up the Authenticity & Novel Foodsbusiness unit at RIKILT Wageningen University and ResearchCentre in the Netherlands since 2012. This post doubles withher position as Professor of Food Authenticity and Integrity atWageningen University. She received her PhD in FoodChemistry from Wageningen University in 1995 and carried outresearch on lipid and volatiles chemistry as post-doctoralresearcher for Unilever in 1996 to1998. From 1998 to 2005, she carried outinstrumental flavour research at University College Cork, Ireland and lectured insensory science and related analytical chemistry. Subsequently she joined RIKILTin 2005 and managed the research cluster Authenticity and Nutrients, and hasmanaged the Product Composition research programme since 2009. Saskia’sresearch interests concern complex authentication issues with regard toproduction system (organic, sustainable, halal), geographical origin, processing,ingredients, and typicality (artisanal products) with application of state-of-the-artanalytical methodology in combination with chemometrics. She has publishedmore than 180 scientific papers and participated in numerous national, EU andglobal projects / committees / networks.
About the Authors5. Frankhuizen, R., van der Veen, N.G. (1985). Determination of major and minor constituents inmilk powders and cheese by near infra-red reflectance spectroscopy. Neth. Milk Dairy J.39:191-207
6. Blazquez, C., Downey, G., O’Donnell, C., OÇallaghan, D., Howard, V. (2004). Prediction ofmoisture, fat and inorganic salts in processed cheese by near infrared reflectancespectroscopy and multivariate data analysis, J. Near Infrared Spectr. 12:149-158
7. Weeranantanaphan, J., Downey, G., Allen, P., Sun, D.W. (2011). A review of near infraredspectroscopy in muscle food analysis 2005-2010. J. Near Infrared Spectr. 19:61-104
8. Twomey, M., Downey, G., Mc Nulty, P.B. (1995). The potential of NIR spectroscopy for thedetection of the adulteration of orange juice. J. Sci. Food Agric. 67:77-84
9. Contal, L., Leon, V., Downey, G. (2002). Detection and quantification of apple adulteration instrawberry and raspberry purees using visible and near infrared spectroscopy. J. Near InfraredSpectr. 10:289-299
10. Vardin, H., Tay, A., Ozen, B., Mauer, L. (2008). Authentication of pomegranate juice concentrateusing FTIR spectroscopy and chemometrics. Food Chem. 108:742-748
11. Mamani-Linares, L.W., Gallo, C., Alomar, D. (2012). Identification of cattle, llama and horsemeat by near infrared reflectance or transflectance spectroscopy. Meat Sci. 90:378–385
12. Morsy, N., Su, D.-W. (2013). Robust linear and non-linear models of NIR spectroscopy fordetection and quantification of adulterants in fresh and frozen-thawed minced beef. Meat Sci.93:292–302
13. Sánchez, M.-T., Garrido-Varo, A., Guerrero, J.-E., Pérez-Marín, D. (2013). NIRS technology for fastauthentication of green asparagus grown under organic and conventional productionsystems. Postharvest Biol. Technol. 85:116–123
14. Andueza, D., Agabriel, C., Constant, I., Lucas, A., Martin, B. (2013). Using visible or near infraredspectroscopy (NIRS) on cheese to authenticate cow feeding regimes. Food Chem. 141:209–214
15. Ottavian, M., Fasolato, L., Facco, P., Barolo, M. (2013). Foodstuff authentication from spectraldata: Toward a species-independent discrimination between fresh and frozen–thawed fishsamples. J. Food Engin. 119:765–775
16. Anderson, S. (2007). Determination of fat, moisture and protein in meat and meat products byusing the FOSS FoodScan Near-Infrared Spectrophotometer with FOSS Artificial NeuralNetwork calibration model and associated database: Collaborative study. J. AOAC Int.90:1073-1083
17. Capuano, E. van Ruth, S.M. (2013). QA: fraud control of foods and other biomaterials byproduct fingerprinting. Latest Research in Quality Control 2. InTech Publishers,http://dx.doi.org/10.5772/51109

The other side of Janus is processed food. Most of the food consumed byhumans undergoes some sort of processing, either by thermal treatment(baking, roasting, frying, cooking, steaming, etc.), by fermentation,pickling, pressure treatment, irradiation or others. During theseprocessing steps, usually associated with browning or darkening ofcolour (here referred to as the dark side), the chemical composition of the initial raw material is dramatically altered. The hundreds ofcomponents present in the raw material undergo a myriad of chemicaltransformations producing thousands of novel products. As a rule ofthumb, it can be estimated that up to 50 per cent of the compoundspresent in the food raw materials are decomposed by chemical reactionsto produce new products1. Since humans consume the vast majority of
their food after processing, the actual percentage depending on socialand cultural circumstances, up to 80 per cent of food consumed isestimated to be processed prior to consumption. It follows that themajority of the food consumed by humans is processed food.
It is worth pointing out that processing food constitutes a uniqueactivity of humans and distinguishes humans from all other animalspecies on our planet. Very little is known about the chemical compo -sition of processed food, mainly due to the enormous chemicalcomplexity of the materials obtained after food processing, containingsometimes several tens of thousands of chemical compounds. Such large compound numbers are usually associated with the presenceof an unresolved hump in a chromatographic analysis. These humps
Do we actually know what we eat? How well do we really understand the chemical composition of our daily food?These are two questions of utmost importance for consumers, food manufacturers and the scientific communityinvolved in food research. The answer to that question is anything but straightforward. Our knowledge of thechemical composition of food resembles the Roman god Janus, on one side a tremendous knowledge has been builtup over the last decade about the chemical composition of the raw materials used for food production. The databaseFoodDB contains around 28,000 entries of fully characterised chemical compounds found in our daily diet and formany food raw material food scientists are able to account for nearly every molecule present in the raw material.
New Food, Volume 17, Issue 1, 2014 58 www.newfoodmagazine.com
© J
ane
Rix
/ Shu
tter
stoc
k.co
m
M A S S S P E C T R O M E T R Y
Understanding the darkside of food: the analysis ofprocessed food by modernmass spectrometry
■ Nikolai Kuhnert School of Engineering and Science Jacobs University Bremen

with its associated complexity have so far constituted aninsurmountable hurdle for analytical chemistry. Trying to gain a betterunderstanding of processed food therefore means to develop and apply analytical methods that are capable of coping with such anenormous complexity.
Our research group has over the last few years developed suchmethods based on modern mass spectrometry that allow, for the firsttime, an understanding of the composition of processed food along with an understanding of the chemistry underlying food processing. This article will provide a short overview about the methods used andhighlight some key findings of our investigations.
Modern mass spectrometryMass spectrometry has made some enormous advances over the past two decades. The advent of Electrospray Ionisation (ESI) and Matrix Assisted Laser Desorption Ionisation (MALDI) has allowed the soft ionisation of almost any biomolecule, large or small, stable or labile and its transfer into the gas phase for further analysis. Isolation ofions in the gas phase followed by fragmentation of intact ions in the gas phase produce fragment ions (this process is referred to as tandem mass spectrometry), which offer the possibility of carrying outstructure detailed elucidation. Additionally, the coupling of massspectrometers to chromatographic equipment and other spectro-scopic techniques has allowed to separate compounds physically andobtain multi-dimensional information on the analytes, all this atrelatively high sensitivity for routine commercial MS instruments in thenM range or better.
The key advantage of mass spectrometry in the analysis ofprocessed food, however, is its resolution, in particular if using highresolution mass analysers such as Time of Flight (TOF) or FourierCyclotrone Resonance mass detectors (FT-ICR-MS), able to resolve tens of thousands of ions in a single mass spectrometry experiment. The resolution achieved in such experiments is therefore several ordersof magnitude higher if compared to chromatographic separation or anyother spectroscopic method.
A high resolution mass spectrum of processed food samples showstypically several thousands of resolved signals (see Table 1 forrepresentative examples) e.g. around 2,000, for caramel, around 10,000 for a black tea infusion or around 30,000 for a cocoa powdersample. From the observed signals in the mass spectrum, molecularformulae for the large majority of signals can be determined, directlytaking advantage of the high mass accuracy employed, providing
extensive mass lists of all analytes observable. It should be noted that insuch an experiment, not all analytes present can be ionised with onegiven ionisation technique, however, the use of complementaryionisation methods for example in positive and negative ion mode andusing ESI, MALDI and APCI provides a more complete picture of thecontent of a given sample. Additionally, it must be noted that mass spectrometry is isomer blind at this stage, resulting in the necessity to obtain average isomer numbers from subsequent LC-tandem-MS experiments. These average isomer numbers are then multiplied with the number of signals obtained in a high resolutionMS experiment, providing an estimate of real compound numbers.Figure 1 shows a typical MS spectrum of a complex mixture, in this caseMaillard reaction products.
Interpretation of high resolution mass spectraAs mentioned above, a high resolution mass spectrum of processed foodsamples provides molecular formula information on thousands or eventens of thousands of analytes present within the sample in a singleexperiment. In order to interpret such extremely information richsamples, we have adapted and transferred data interpretation strategiespioneered in the field of crude oil analysis (petrolomics) along with the
M A S S S P E C T R O M E T R Y
www.newfoodmagazine.com 59 New Food, Volume 17, Issue 1, 2014
Table 1: Number of peaks observed in high resolution mass spectra in the negativeion mode for selected processed foods
Number of resolved peaks in
Processed Food HR-MS spectra at S/N > 50
Black tea 10 000
Fermented and roasted cocoa 30 000
Roasted coffee 2 000
Black pepper 5 000
Browned banana 3 000
Heated sucrose 400
Heated starch 300
Heated glucose 300
Figure 1: ESI-FTICR mass spectrum in negative ion mode of Maillard reactionextract; a) full spectrum; b) expanded region of spectrum
Figure 2: Van Krevelen diagram obtained from an ESI-FTICR mass spectrum inthe negative ion mode of an aqueous cocoa powder extract. Ions of differentelemental compositions are colour coded. Every of the 12,000 data pointscorresponds to a distinct analyte

development of novel data interpretation strategies. In petrolomics, twoapproaches have been shown to be of enormous use, the elemental ratioanalysis (or van Krevelen analysis) and the mass defect analysis (orKendrick analysis)2.
In the van Krevelen analysis, elemental ratios e.g. H/C or O/C arecalculated for each analyte from the molecular formulae informationand plotted against one another. The beauty of this approach lies in thefact that certain classes of compounds (e.g. polyphenols, proteins,carbohydrates, lipids, terpenes phenolglycosides etc.) are characterisedby a set of elemental ratio boundaries. Therefore, all members of aspecified class of compounds appear in a restricted zone on the plot,hence a tentative classification of the tens of thousands of analytes indistinct classes of compounds becomes possible. Figure 2 (page 59)shows a typical van Krevelen diagram of an FT-ICR-MS analysis of a cocoapowder extract with compounds of different elemental compositionscolour coded.
The Kendrick approach makes use of the observation that in ahomologous series of compounds, which are defined as seriescompounds, to which starting from a given precursor, a defined group ofatoms is repeatedly added. The repeated addition of a defined group of atoms with an associated mass increment leads within the series ofcompounds to a constant mass defect. If the plot is normalised to a givenmass defect (e.g. in Figure x loss of water H2O), all members of ahomologous series lie on a straight line parallel to the x-axis on theKendrick plot. Using this approach, homologous series of compounds canbe readily identified from the data set. Figure 3 shows a Kendrick diagramfrom a caramel sample, where homologous series formed by dehydrationare shown in colour parallel to the x-axis. From our work, we could showthat for nearly all classes of processed food, a relatively small selection ofchemical reactions actually take place on heating (loss of water, additionof water, transesterification, transglycosylation etc.) or fermentation(oxidation, nucleophilic attack by water, carbohydrates, phenols etc.),always leading to a homologous series of compounds with repeatedsequences of mechanistically identical reactions. Hence, the identification
of homologous series immediately suggests the mechanistic pathways forchemical reactions occurring during food processing.
Further parameters can be derived from the high resolution MS dataset and plotted against one another to provide graphical displays withpatterns and trends embedded in the graph, whose visual inspectionand later on rationalisation provides additional valuable insight intoboth the chemical composition and the mechanistic chemistryunderlying food processing.
Chromatographic coupling to mass spectrometryLiquid chromatography can be easily coupled to mass spectrometry andcomplex mixtures arising from food processing analysed this way. Incontrast to the high resolution MS analysis by direct infusion describedin the previous section, chromatography allows additional separation ofisomeric structures and hence an estimate of the numbers of isomerspresent in a given sample. Additionally, the chromatographic separationreduces the effect of ion suppression and ion enhancement in a directinfusion measurement, which tends to distort the information obtained.Complex mixtures (also referred to as UCMs; unresolved complexmixtures) typically show next to well defined chromatographic peaks asan unresolved hump as exemplified in Figure 4.
If coupled to tandem mass spectrometry, additional structuralinformation can be obtained from chromatographic runs. In the absenceof authentic reference materials, which for processed food analysisconstitutes a major problem, we have suggested that compounds ofsimilar structure display identical fragmentation mechanisms. Hencefrom the homologous series analysis described tentative structuralhypothesis for compounds produced in food processing must bedeveloped, which in a second stage can be probed by LC-tandem-MS. A search in an extracted ion chromatogram reveals all compounds with agiven molecular formula, and after inspection of their fragment spectra,these can be grouped into compound classes displaying identicalfragmentation mechanisms. Establishing the correct regio- andstereochemistry for the compounds is of course not possible in theabsence of authentic reference materials; however, to solve this problem we have used computational chemistry to aid compoundassignment. Here, our approach is to use DFT calculations to obtainHOMO and LUMO orbital coefficients from starting materials in foodprocessing, which immediately suggest likely regiochemical outcomes ofthe reactions occurring.
New Food, Volume 17, Issue 1, 2014 60 www.newfoodmagazine.com
M A S S S P E C T R O M E T R Y
Figure 3: Kendrick diagram from an ESI-TOF-mass spectrum in the negative ionmode normalised for the H2O mass increment for a caramel sample obtainedfrom sucrose. Coloured points form lines parallel to the x-axis, whichcorrespond to homologous series of compounds with stepwise loss of water(from right to left, up to eight water molecules are lost)
Figure 4: Typical HPLC chromatogram of a processed food (black tea infusion)displaying an unresolved hump

Structure elucidation by tandem mass spectrometryMS has the advantage of being able to isolate ions of a chosen m/z valueand subsequently fragment the chosen ions, revealing valuablestructural information through the analysis of fragment ions. Recentyears have shown that this method is much more powerful thanpreviously assumed with even regio- and stereoisomeric ions yieldingdistinct fragment spectra that allow unambiguous structure elucidation.As a prime example, all four regioisomeric mono-esters of quinic acid and all six possible regioisomeric di-esters of quinic acid , allgenerally classified as chlorogenic acids, have been shown to displaydiagnostic and fragment spectra that allow predictive assignment ofcompounds3. Figure 5) shows the MS2 spectra of all six regioisomers of dicaffeoyl quinic acid as an illustrative example. Similarly, esters ofdiastereoisomers of quinic acids have been shown to display diagnosticfragment spectra allowing assignment of stereochemistry of the quinicacid moiety. In the case of quinic acid regioisomers and stereoisomers,all assignments of compounds could be supported with the aid ofauthentic reference materials obtained by chemical synthesis orextraction and isolation from natural sources4.
In other work, we have shown that the same principle of structureelucidation can be applied to shikimic acid derivatives5, lactones orproanthocyanidines6 and in so far unpublished work, we have extendedthis principle to the unambiguous identification of carbohydrate estersand carbohydrates themselves.
In general, we take the view that tandem mass spectrometry is asinformation rich as NMR spectroscopy and should in principle be able toprovide all information necessary for a complete structure elucidation ofeven complex structures. Two aspects, however, prevent a full
exploitation of its tremendous potential; firstly a lack of standardisationof MS equipment and experimental parameters used in practice andsecondly an insufficient understanding on how MS data are correlated tostructure. Both will change within the next decade.
Quantification of compounds from Food ProcessingUsing our approach, no quantitative data on analytes present can bededuced from the data obtained, since in a complex sample, all analytescompete for ionisation and the ability to ionise preferentially determinesthe intensity of the signals observed rather than relative or absolutequantities. Additionally, the effects of ion suppression and enhancement
M A S S S P E C T R O M E T R Y
Figure 5: Tandem mass spectra of all six regioisomers of dicaffeoyl quinic acid(blue ball signifies caffeoyl ester substituent)
Network online with your industry peers, visit:
http://linkd.in/NewFoodMagMembers and non-members are welcome to join the discussions
LET’S CONNECT!
Exchange information, ideas and opportunities

change signal intensities in samples of non-identical compositions.Hence for quantification authentic reference materials are alwaysrequired, which after obtaining calibration curves can be used even invery complex samples for quantification purposes. Here, either tandemmass spectrometry in the single or multiple reaction monitoring mode(SRM or MRM) or the use of extracted ion chromatograms from highresolution LC-MS data can be employed, guaranteeing a high level ofselectivity for the analyte of interest.
Data reduction using multi-variant statistical techniquesThe section above described our strategies to carry out a full analysis of achromatographic unresolved hump. Alternatively, one has the option toconcentrate only on compounds that are important within a sample. Theimportance can relate to sensory properties, sample origin, foodauthenticity, processing parameters (improving visual appearance,shelf-life of a product etc.), beneficial health effects or possible IPconsiderations. If such parameters are related to differences incomposition between samples, multi-variant statistical techniques canbe employed to analyse a data set without loss of information. The mostpopular method to achieve data reduction without loss of information isprincipal component analysis (PCA). Here all analytes e.g. observed in anLC-MS run are characterised as a triplet of data containing retention time,m/z ratio and intensity. Out of all the data describing the analyte, a set oflinear combination is computed (the principle component) and thosesearched that account for most variations between samples7.
The results of a PCA analysis are displayed in two plots. Firstly thescores plot shows how sample groups can be distinguished in twoselected PCs (each data point represent one sample or LC-MS run) andseconcdly in the loading plot every data point corresponds to one analytethat is in particular responsible for differentiations. Hence analytes thatare important for differences between samples can be readily identifiedirrespective of the complexity of the original sample.
As an example, a PCA scores and loading plot of a series ofthearubigins from Kenyan and Ceylonese black tea are shown in Figure 6.The scores plot allows clear differentialtion between samples, how-ever the loading plot reveals the extraordinarily complexity of the sampleswith many hundreds compounds contributing to sample differentiation.
Selected examples of processed food analysed: black teaMost of our analytical strategies for the investigation of processed food
were developed for black tea chemistry. Black tea is produced from theyoung shoots of Camilla sinensis or Camilla assamica by a processreferred to as fermentation. The green tea leaves are mechanicallytreated mixing their phenolic secondary metabolites, mainly sixcompounds of the class of the catechins, stored in the cell vacuoles withthe enzyme polyphenoloxidase (PPO). PPO oxidises the B-ring ofcatechins to an ortho-quinone, which is subsequently attacked by anucleophile, e.g. another catechin, to form dimeric structures such astheaflavins or theasinensins and a material referred to as thearubigin(TR) first described by E.A.H. Roberts in the 1950s. For structures, pleasesee Figure 7. The chemical composition of the TRs remained mysteriousand enigmatic for a long time and withstood for almost five decades anyattempt to carry out a meaningful characterisation8.
Using FT-ICR-MS, we could show that the TRs are composed fromaround 30,000 different compounds (10,000 signals in a mass spectrummultiplied by an average number of isomers) arising through the actionof PPO acting on the only six catechins contained within the plant leaf.Using the analytical data interpretation strategies described, weformulated a hypothesis for TR formation, which has become known asthe oxidative cascade hypothesis9. PPO produces electrophilic quinones,which are attacked by nucleophilic catechins to form oligomers (up to six catechin moieties). Additionally, water as the most abundantnucleophile in the green tea leaves furnishes polyhydroxylatedderivatives of oligomeric catechins, which are in a redox equilibrium withtheir quinone counterparts. Hence 90 per cent of the TR constituentscould be assigned with tentative structures and for more than 1,000 constituents, their structure was subsequently confirmed bytandem-MS. A sound and plausible mechanism for TR formation wasintroduced, which has so far withstood all further experimental tests10.
Roasted coffeeGreen coffee beans contain mainly a class of secondary metabolitestermed the chlorogenic acids (CGAs) along with proteins, carbohydratesand lipids. Roasted coffee is produced by heating green coffee beans totemperatures ranging from 180 – 250°C for a period of 8 – 15 minutesproducing different roasts. An FT-ICR-MS of roasted coffee extractsrevealed the presence of around 2,000 signals, which could, bycomparison to model roast systems, be classified into products arisingfrom the reactions of all the individual classes of compounds present inthe bean, with products arising from CGAs and carbohydrates
New Food, Volume 17, Issue 1, 2014 62 www.newfoodmagazine.com
M A S S S P E C T R O M E T R Y
Figure 6: Score and loading plot of a PCA analysis of LC-ESI-TOF-MS data of Ceylonese and Kenyan black teas, allowing differentiation of the products in the score plot (left) and identification of analytes (every data pointcorresponds to one compound) in the loading plot (right) that are responsiblefor the differentiation
Figure 7: Structures of green tea catechins and dimeric oxidation productsformed in the production of black tea by fermentation

dominating the complex mixture. Using synthetic chemistry, we couldshow that CGAs undergo a series of simple organic transformation duringroasting, which include acyl-migration, dehydration to form lactones orcyclohexene derivatives along with epimerisation. In a second brewingstep, water undergoes conjugate addition to CGAs and subsequent beta-eliminations yielding cis-CGA derivatives11. Figure 8 illustrates thedifferent mechanistic pathways observed for CGAs after thermaltreatment in coffee roasting.
CaramelThe products of thermally treated sugars are traditionally referred to as caramel. For caramel made from sucrose, we could show that a typicalcaramel sample is characterised by the presence of around 3,000 signalsin an FT-ICR-mass spectrum. Further analysis revealed that structuresencountered are formed by oligomerisation of sucrose and sequentialstepwise dehydration. In contrast to CGAs, no epimerisation of sugarmoieties could be observed12. Similar work was carried out for theanalysis of thermally treated starch as frequently used in bread baking.Starch breaks down into small glucose oligomers followed bydehydration reactions resembling the chemistry of caramel formation13.
ConclusionIn conclusion, our novel analytical strategies based on modern mass
spectrometry allow, for the first time, a detailed insight into processedfood, or otherwise referred to here as the dark side of food. The numberof constituents present can be obtained along with molecular formulaelists for all constituents. Further data interpretation allows theformulation of structural and mechanistic hypothesis on the chemistryunderlying food processing, thus a global picture of processed foodcomposition emerges. We have so far successfully applied this approachto black tea chemistry, coffee roasting and caramel formation. Currentwork focuses on the investigation of cocoa production and the 100-year-old enigmatic Maillard reaction.
Our methods are not aimed at replacing the more classical approach based on isolation, purification and complete spectroscopicstructure elucidation of food constituents. Rather, it constitutes acomplementary approach to the classical way of food chemistry andshould always be attempted in cases where thousands of analytesprevent due to poor chromatographic resolution their properpurification and characterisation.
We hope as well that regulatory authorities will take notice of ournew approach and request and accept such data for the majority ofprocessed foods, whether new or old, whose chemical composition hasremained unknown and mysterious.
From a philosophical point of view, our work has highlighted a completely unexpected chemical complexity and chemical diversity of complex food, raising the general question on how humans areactually coping with a daily avalanche of tens of thousands ofxenobiotics defining the chemistry and pleasure of processed food. We like to put forward the hypothesis that the chemical composition ofprocessed food has largely contributed to the evolutionary success of thehuman species. To find out why and how will be the research challengefor the future.
M A S S S P E C T R O M E T R Y
www.newfoodmagazine.com 63 New Food, Volume 17, Issue 1, 2014
1. “What is under the hump? Mass spectrometry based analysis of processed food. Lessons fromthe analysis of black tea thearubigins, coffee melanoidines and caramel”, N. Kuhnert, F.Dairpoosh, A. Golon, G. Yassin and R. Jaiswal, Food and Function, 2013, 4, 1130-1147
2. “On the chemical characterization of black tea thearubigins using mass spectrometry” N. Kuhnert, J. W. Drynan, J. Obuchowicz and M. Clifford, Rapid Commun. Mass Spetrom. 2010, 24, 3387-3404
3. “Hierarchical Scheme for the LC–MSn identification of chlorogenic acids”, M. N. Clifford, K. L. Johnston, S. Knight and N. Kuhnert, J. Agr. Food. Chem. 2003, 51, 2900-2911
4. “Discriminating between the six isomers of dicaffeoylquinic acid by LC-MSn” M. Clifford, S. Knight and N. Kuhnert, J. Agr. Food Chem. 2005, 53, 3821-3832
5. “Profiling the chlorogenic acids and hydroxyl cinnamoylshikimates in mate (ilex paraguayensis)”,R. Jaiswal, T. Sovdat and N. Kuhnert J. Agr. Food Chem. 2010, 58, 5471-5484
6. “Identification and characterization of proanthocyanidines of 16 members of the Rhododendrongenus (Ericaceae) by tandem LC-MS” R. Jaiswal, L. Jayasinghe and N. Kuhnert, J. Mass Spectrom.2012, 47, 502-515
7. “Scope and limitations of principal component analysis of high resolution LC-MS data: The analysis of the chlorogenic acid fraction in green coffee beans as a case study”
N. Kuhnert, R. Jaiswal, PO. Eruvichera, M. El-Abassy, B. von der Kammer and A. Materny, Anal. Meth. 2011, 3, 144-155
8. “On the chemistry of small molecular weight polyphenols in black tea” J. W. Drynan, M. N. Clifford, J. Obuchowicz and N. Kuhnert, Nat. Prod. Rep. 2010, 27, 417-462.
9. “Unravelling the structure of black tea thearubigins”, N. Kuhnert, Arch. Biochem. Biophys. 2010, 501, 37-51
10. “Oxidative cascade reactions yielding polyhydroxy-theaflavins and theacitrins in the formation ofblack tea thearubigins: Evidence by tandem LC-MS” N. Kuhnert, M. N. Clifford and A. Müller, Foodand Function, 2010, 1, 180-199
11. “Investigating the chemical changes of chlorogenic acids during coffee brewing – conjugateaddition of water to the olefinic moiety of chlorogenic acids and their quinides”, M. F. Matei, R. Jaiswal and N. Kuhnert, J. Agr. Food Chem. 2012, 60, 12105-12115
12. “Unravelling the chemical composition of caramel”, A. Golon and N. Kuhnert, J. Agr. Food Chem. 2012, 60, 3266-3274
13. Investigating the thermal decomposition of starch and cellulose in model systems and toastedbread” A. Golon, X. Hernandez, J. Z. Davalos and N. Kuhnert, J. Agr. Food Chem. 2013, 61, 674-684
References
Nikolai Kuhnert studied chemistry at the University of Würzburg and received hisPhD under the supervision of Professor W. A. Schenk in 1995. Followingpostdoctoral stays at the Universities of Cambridge and Oxford, he obtained hisfirst faculty position at the University of Surrey. In 2006, he moved to JacobsUniversity Bremen, where he is now a Full Professor of Analytical and OrganicChemistry. His research interests cover the application of modern massspectrometry in structure elucidation of natural products, the analysis ofcomplex mixtures from processed food and the chemistry and biological activityof dietary polyphenolics.
About the Author
Figure 8: Structure of chlorogenic acid and typical reaction products of CGA identified in the roasting of coffee

Live Labs & Special Show: Occupational safety/Health and safety in the workplace Modern analysis techniques and innovative biological methods are nowindispensible in most branches of industry – whether in the production ofmedications or quality control of drinking water. That is why analytica2014 will revolve around food and plastics analysis as well as geneticanalysis and bioanalysis. These topics will be reflected in the trade fairand its programme of related events as well as the Live Labs. Thirty-minute lectures and product presentations are on the agenda threetimes a day – at 11:00, 13:00 and 15:00. Among other things, they will dealwith routine analysis applications as well as special analysis techniques.
Whether in research or industry, safety of laboratory employees isextremely important. Now analytica is integrating this topic into its LiveLabs in Hall A3 with experimental lectures on how to avoid fires andexplosions. It will also examine the best ways to protect employees’health in everyday laboratory operations and what measures arenecessary to do so. The special show will also give exhibitors anopportunity to present products that are necessary for safety such assafety cabinets, gas detectors and protective clothing.
analytica conference From pharmaceutical analysis, bioanalysis and clinical and medicaldiagnostics to environmental, water and material analysis: Theprogramme of lectures at the analytica Conference covers the analysissector in its entirety. The conference is held in conjunction with and onthe first three days of the fair. For the first time ever, it is being held in theimmediate vicinity of the fair, i.e. at the ICM – Internationales CongressCenter München. Experts from Germany and abroad will use theconference to talk about the current state of the art and development
prospects in analysis, biochemistry and clinical diagnostics. Amongother things, topics will include Bio Metallomics, Bioimaging of Tissuesand Proteomics in Biomedical Research Drug Testing and Metabolism inSamples Beyond Conve. Admission to the conference is included in theprice of admission to the fair.
Forum Laboratory & Analytics The latest applications and marketable products on the laboratory andanalysis market will be presented in lectures and panel discussions in theForum Laboratory & Analytics in Hall B2. Practice-oriented exhibitorlectures will give routine-analysis professionals tips that are relevant tobusiness and actual applications. And on Friday, the forum will becomea career springboard when analytica Job Day is held there.
Forum Biotech: Best practice for users Life scientists use refined methods to complete the puzzle of life moreand more, even though they often have just a few cells or a fewmicroliters available for their measurements. As equipmentmanufacturers master these and other bioanalysis challenges, theyreport on their accomplishments in the form of Best Practice lecturesand presentations in the Forum Biotech in Hall A3. The biotech region ofMunich is considered a leading cluster for personalized medicine andtargeted therapies. analytica places special importance on this future-oriented topic with an additional series of lectures as part of the forum.Lectures and panel discussions on recent and future developments andmethods are planned.
On 1 April 2014, it will be time again for the international community for laboratory technology, analysis andbiotechnology meets at analytica in Munich. For four days, more than 1,000 manufacturers of laboratory equipmentand analysis devices will present their latest products and highlights. The fair will revolve around the topics of food and plastics analysis as well as genetic analysis and bioanalysis.
analytica 2014 – Gatheringfor industry and research
For fururther information: www.analytica.de
S h o w P r e v i e w
New Food, Volume 17, Issue 1, 2014 64 www.newfoodmagazine.com

Scandinavia:Mr. John Jensen
+45 9926 9938 or [email protected]
Outside Scandinavia:Mr. Simon Reay +44 1732 762761
BOOK YOUR STAND TODAY
Northern Europe’s leading
Food Tech Event
28-30 October 2014, Denmark

Food fraud for economic gain is more prevalent – and more costly – than you may realize. Matter of fact, fraud has risen 60% in the last year alone – and new economic adulterants enter the food supply every day. Our solutions make a real difference by letting you scan for known and unknown adulterants in each ingredient and you get your results in 30 seconds – with no scientific background required. Want to protect your brand and bottom line? Learn how to detect differently.
Register for our webinar at www.perkinelmer.com/NontargetedWebinar.
Read how we help others
COMBATINGFOOD FRAUDONE INGREDIENTAT A TIME
© 2
013
Perk
inEl
mer
, Inc
. 400
290_
02. A
ll tra
dem
arks
or r
egist
ered
trad
emar
ks a
re th
e pr
oper
ty o
f Per
kinE
lmer
, Inc
. and
/or i
ts s
ubsid
iarie
s.
2:47 PM Jaisalmer, India